Zip Codes with the Highest Percentage of Population Employed in Food Preparation & Serving in Memphis, TN
RELATED REPORTS & OPTIONS
Food Preparation & Serving
Memphis
Compare Zip Codes
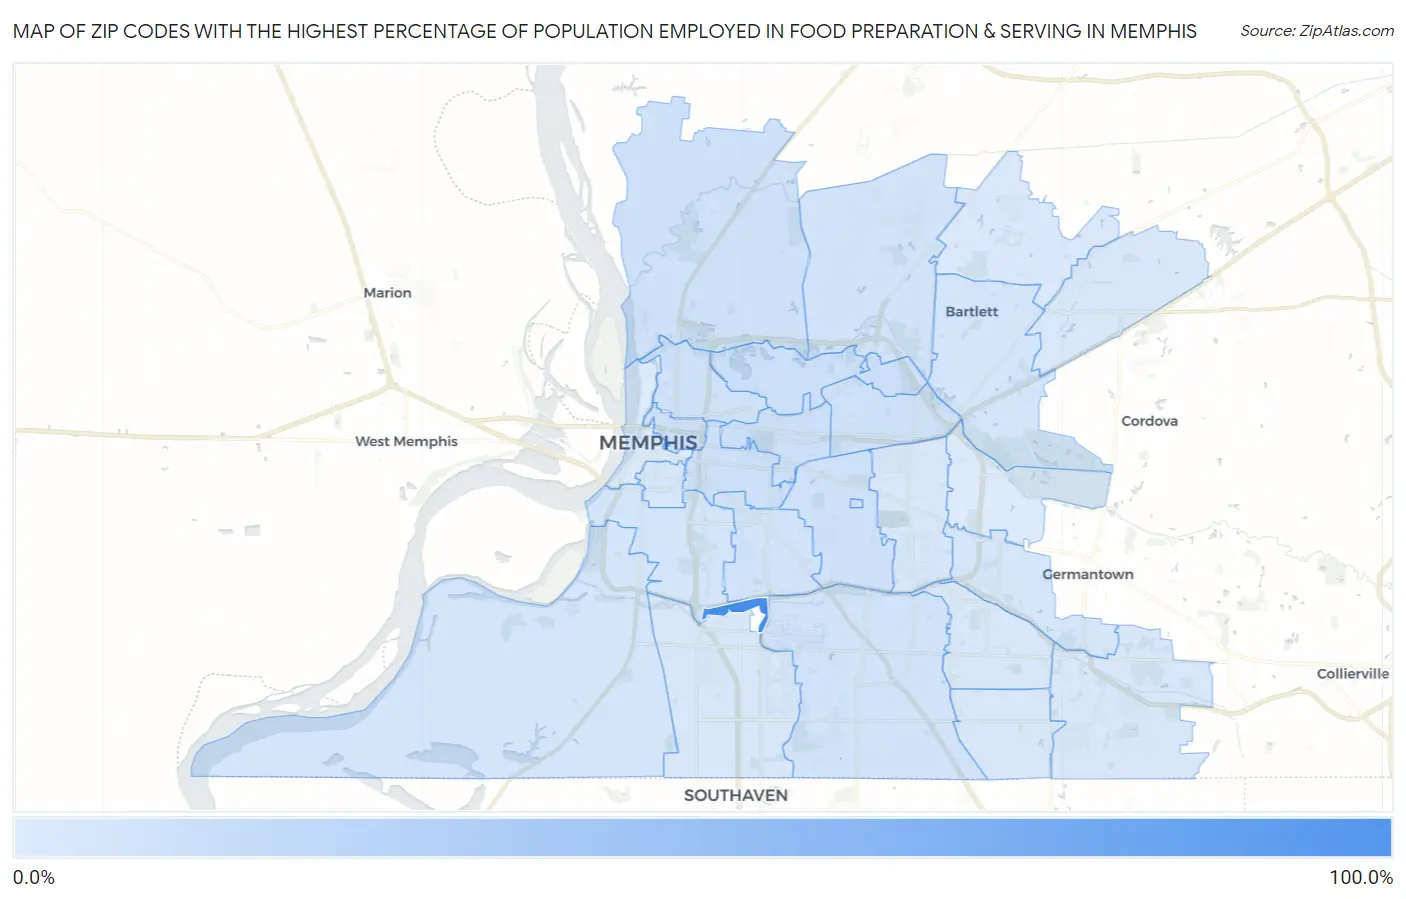
Map of Zip Codes with the Highest Percentage of Population Employed in Food Preparation & Serving in Memphis
1.3%
100.0%
Zip Codes with the Highest Percentage of Population Employed in Food Preparation & Serving in Memphis, TN
| Zip Code | % Employed | vs State | vs National | |
| 1. | 38132 | 100.0% | 5.4%(+94.6)#1 | 5.3%(+94.7)#10 |
| 2. | 38152 | 9.4% | 5.4%(+3.99)#52 | 5.3%(+4.13)#3,127 |
| 3. | 38112 | 9.1% | 5.4%(+3.68)#61 | 5.3%(+3.81)#3,417 |
| 4. | 38108 | 8.8% | 5.4%(+3.41)#67 | 5.3%(+3.54)#3,690 |
| 5. | 38105 | 8.5% | 5.4%(+3.11)#78 | 5.3%(+3.24)#4,045 |
| 6. | 38104 | 8.4% | 5.4%(+2.99)#83 | 5.3%(+3.12)#4,167 |
| 7. | 38127 | 8.3% | 5.4%(+2.88)#88 | 5.3%(+3.01)#4,323 |
| 8. | 38107 | 8.1% | 5.4%(+2.71)#94 | 5.3%(+2.84)#4,545 |
| 9. | 38122 | 7.9% | 5.4%(+2.51)#104 | 5.3%(+2.65)#4,839 |
| 10. | 38111 | 7.6% | 5.4%(+2.15)#119 | 5.3%(+2.29)#5,428 |
| 11. | 38118 | 7.0% | 5.4%(+1.57)#138 | 5.3%(+1.71)#6,580 |
| 12. | 38128 | 6.9% | 5.4%(+1.52)#142 | 5.3%(+1.65)#6,714 |
| 13. | 38114 | 6.8% | 5.4%(+1.38)#148 | 5.3%(+1.51)#7,061 |
| 14. | 38106 | 5.9% | 5.4%(+0.523)#192 | 5.3%(+0.656)#9,533 |
| 15. | 38109 | 5.4% | 5.4%(+0.006)#225 | 5.3%(+0.139)#11,325 |
| 16. | 38134 | 5.4% | 5.4%(-0.010)#226 | 5.3%(+0.123)#11,373 |
| 17. | 38119 | 4.7% | 5.4%(-0.714)#282 | 5.3%(-0.581)#14,144 |
| 18. | 38126 | 4.0% | 5.4%(-1.39)#343 | 5.3%(-1.26)#17,021 |
| 19. | 38117 | 3.8% | 5.4%(-1.58)#357 | 5.3%(-1.45)#17,790 |
| 20. | 38141 | 3.8% | 5.4%(-1.60)#358 | 5.3%(-1.47)#17,856 |
| 21. | 38116 | 3.6% | 5.4%(-1.84)#382 | 5.3%(-1.71)#18,881 |
| 22. | 38133 | 3.6% | 5.4%(-1.86)#385 | 5.3%(-1.72)#18,942 |
| 23. | 38115 | 3.3% | 5.4%(-2.10)#404 | 5.3%(-1.97)#20,002 |
| 24. | 38125 | 3.1% | 5.4%(-2.27)#423 | 5.3%(-2.14)#20,676 |
| 25. | 38135 | 2.5% | 5.4%(-2.90)#466 | 5.3%(-2.77)#23,085 |
| 26. | 38120 | 1.4% | 5.4%(-4.01)#523 | 5.3%(-3.88)#26,188 |
| 27. | 38103 | 1.3% | 5.4%(-4.16)#532 | 5.3%(-4.03)#26,482 |
1
Common Questions
What are the Top 10 Zip Codes with the Highest Percentage of Population Employed in Food Preparation & Serving in Memphis, TN?
Top 10 Zip Codes with the Highest Percentage of Population Employed in Food Preparation & Serving in Memphis, TN are:
What zip code has the Highest Percentage of Population Employed in Food Preparation & Serving in Memphis, TN?
38132 has the Highest Percentage of Population Employed in Food Preparation & Serving in Memphis, TN with 100.0%.
What is the Percentage of Population Employed in Food Preparation & Serving in Memphis, TN?
Percentage of Population Employed in Food Preparation & Serving in Memphis is 5.6%.
What is the Percentage of Population Employed in Food Preparation & Serving in Tennessee?
Percentage of Population Employed in Food Preparation & Serving in Tennessee is 5.4%.
What is the Percentage of Population Employed in Food Preparation & Serving in the United States?
Percentage of Population Employed in Food Preparation & Serving in the United States is 5.3%.