Sewanee, TN Map & Demographics
Sewanee Map
Sewanee Overview
$24,591
PER CAPITA INCOME
$129,097
AVG FAMILY INCOME
$77,105
AVG HOUSEHOLD INCOME
6.5%
WAGE / INCOME GAP [ % ]
93.5¢/ $1
WAGE / INCOME GAP [ $ ]
0.55
INEQUALITY / GINI INDEX
2,922
TOTAL POPULATION
1,396
MALE POPULATION
1,526
FEMALE POPULATION
91.48
MALES / 100 FEMALES
109.31
FEMALES / 100 MALES
21.6
MEDIAN AGE
2.5
AVG FAMILY SIZE
2.1
AVG HOUSEHOLD SIZE
1,451
LABOR FORCE [ PEOPLE ]
52.6%
PERCENT IN LABOR FORCE
0.7%
UNEMPLOYMENT RATE
Sewanee Area Codes
Income in Sewanee
Income Overview in Sewanee
Per Capita Income in Sewanee is $24,591, while median incomes of families and households are $129,097 and $77,105 respectively.
| Characteristic | Number | Measure |
| Per Capita Income | 2,922 | $24,591 |
| Median Family Income | 356 | $129,097 |
| Mean Family Income | 356 | $193,967 |
| Median Household Income | 528 | $77,105 |
| Mean Household Income | 528 | $148,778 |
| Income Deficit | 356 | $0 |
| Wage / Income Gap (%) | 2,922 | 6.49% |
| Wage / Income Gap ($) | 2,922 | 93.51¢ per $1 |
| Gini / Inequality Index | 2,922 | 0.55 |
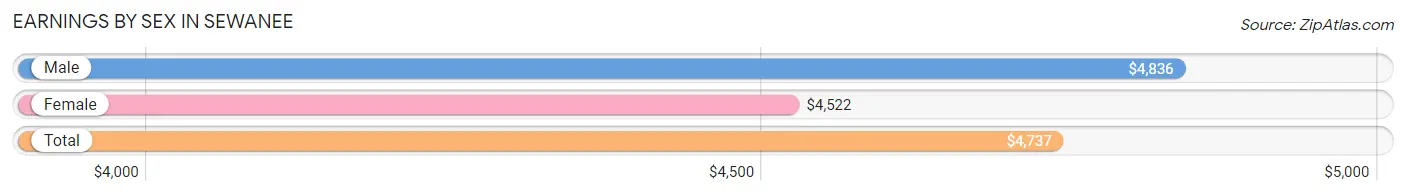
Earnings by Sex in Sewanee
Average Earnings in Sewanee are $4,737, $4,836 for men and $4,522 for women, a difference of 6.5%.
| Sex | Number | Average Earnings |
| Male | 1,002 (51.4%) | $4,836 |
| Female | 946 (48.6%) | $4,522 |
| Total | 1,948 (100.0%) | $4,737 |
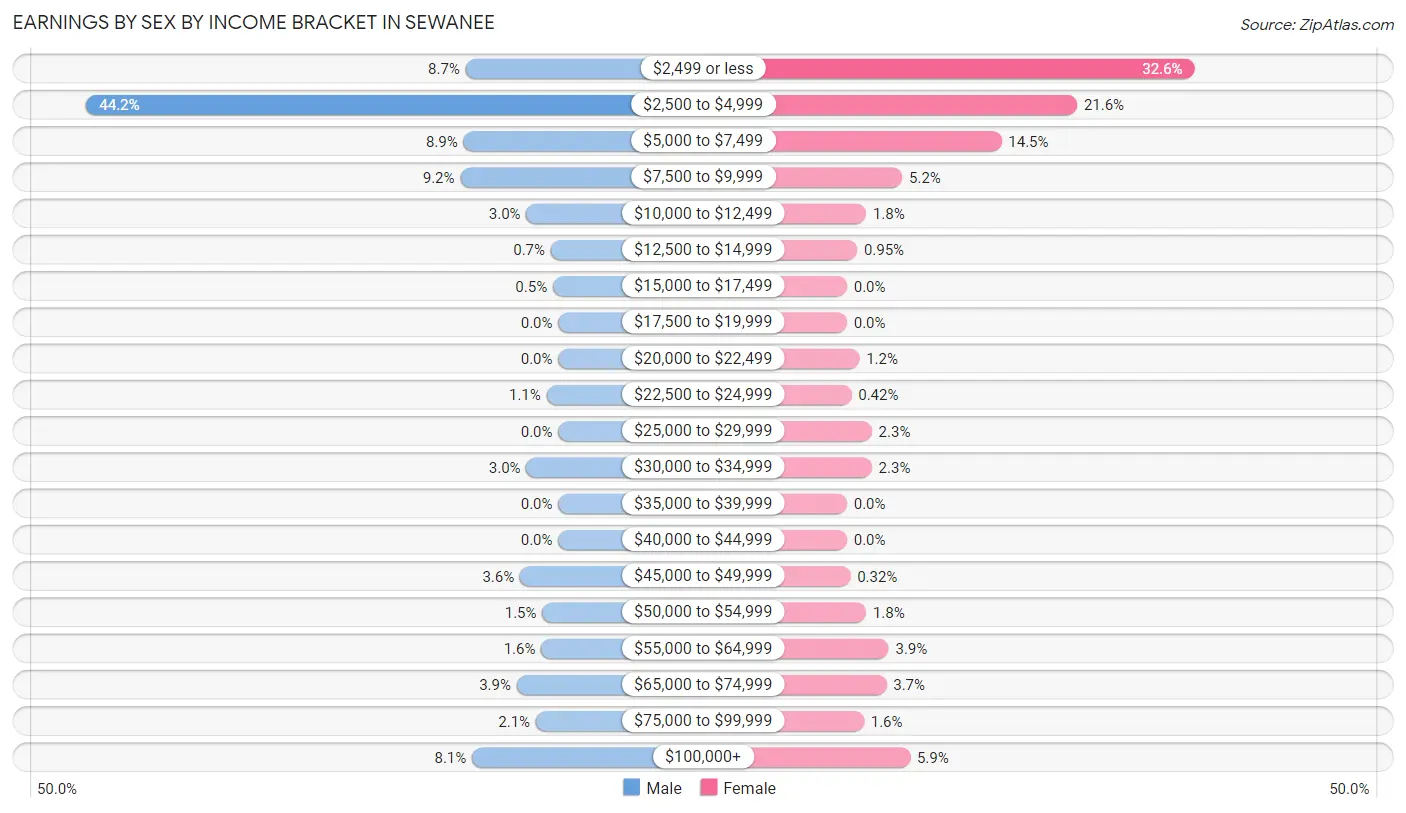
Earnings by Sex by Income Bracket in Sewanee
The most common earnings brackets in Sewanee are $2,500 to $4,999 for men (443 | 44.2%) and $2,499 or less for women (308 | 32.6%).
| Income | Male | Female |
| $2,499 or less | 87 (8.7%) | 308 (32.6%) |
| $2,500 to $4,999 | 443 (44.2%) | 204 (21.6%) |
| $5,000 to $7,499 | 89 (8.9%) | 137 (14.5%) |
| $7,500 to $9,999 | 92 (9.2%) | 49 (5.2%) |
| $10,000 to $12,499 | 30 (3.0%) | 17 (1.8%) |
| $12,500 to $14,999 | 7 (0.7%) | 9 (0.9%) |
| $15,000 to $17,499 | 5 (0.5%) | 0 (0.0%) |
| $17,500 to $19,999 | 0 (0.0%) | 0 (0.0%) |
| $20,000 to $22,499 | 0 (0.0%) | 11 (1.2%) |
| $22,500 to $24,999 | 11 (1.1%) | 4 (0.4%) |
| $25,000 to $29,999 | 0 (0.0%) | 22 (2.3%) |
| $30,000 to $34,999 | 30 (3.0%) | 22 (2.3%) |
| $35,000 to $39,999 | 0 (0.0%) | 0 (0.0%) |
| $40,000 to $44,999 | 0 (0.0%) | 0 (0.0%) |
| $45,000 to $49,999 | 36 (3.6%) | 3 (0.3%) |
| $50,000 to $54,999 | 15 (1.5%) | 17 (1.8%) |
| $55,000 to $64,999 | 16 (1.6%) | 37 (3.9%) |
| $65,000 to $74,999 | 39 (3.9%) | 35 (3.7%) |
| $75,000 to $99,999 | 21 (2.1%) | 15 (1.6%) |
| $100,000+ | 81 (8.1%) | 56 (5.9%) |
| Total | 1,002 (100.0%) | 946 (100.0%) |
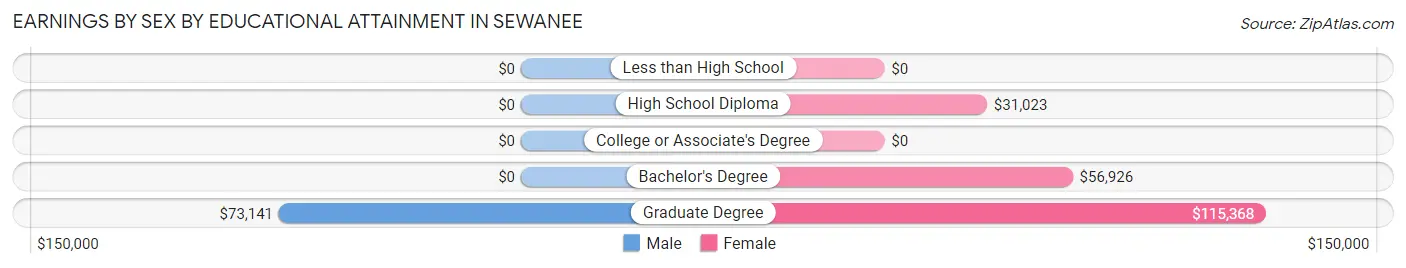
Earnings by Sex by Educational Attainment in Sewanee
Average earnings in Sewanee are $50,667 for men and $56,351 for women, a difference of 10.1%. Men with an educational attainment of graduate degree enjoy the highest average annual earnings of $73,141, while those with graduate degree education earn the least with $73,141. Women with an educational attainment of graduate degree earn the most with the average annual earnings of $115,368, while those with high school diploma education have the smallest earnings of $31,023.
| Educational Attainment | Male Income | Female Income |
| Less than High School | - | - |
| High School Diploma | - | - |
| College or Associate's Degree | - | - |
| Bachelor's Degree | - | - |
| Graduate Degree | $73,141 | $115,368 |
| Total | $50,667 | $56,351 |
Family Income in Sewanee
Family Income Brackets in Sewanee
According to the Sewanee family income data, there are 99 families falling into the $200,000+ income range, which is the most common income bracket and makes up 27.8% of all families.
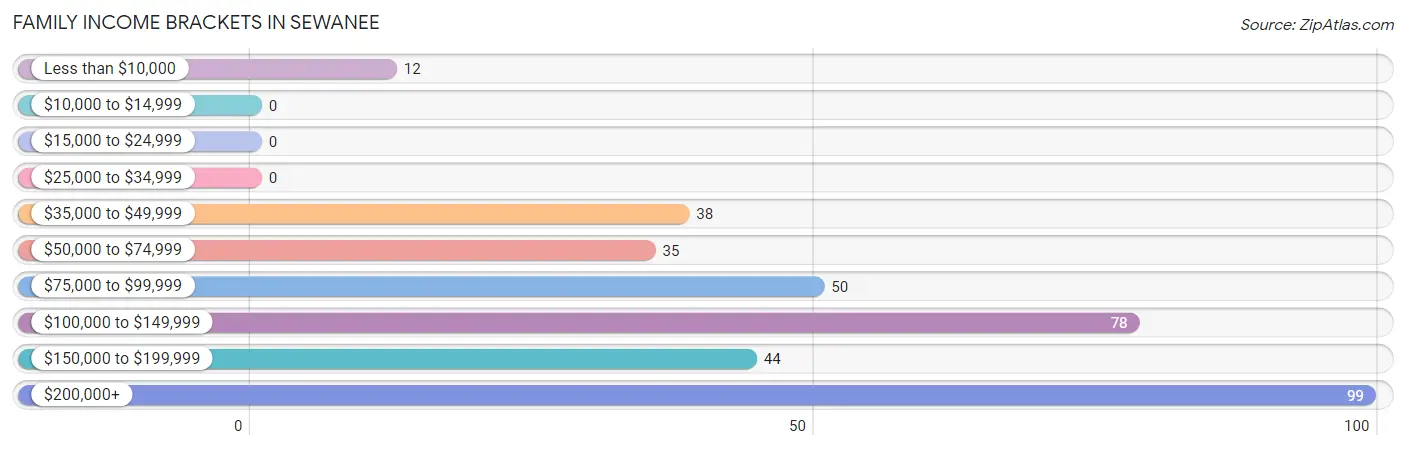
| Income Bracket | # Families | % Families |
| Less than $10,000 | 12 | 3.4% |
| $10,000 to $14,999 | 0 | 0.0% |
| $15,000 to $24,999 | 0 | 0.0% |
| $25,000 to $34,999 | 0 | 0.0% |
| $35,000 to $49,999 | 38 | 10.7% |
| $50,000 to $74,999 | 35 | 9.8% |
| $75,000 to $99,999 | 50 | 14.0% |
| $100,000 to $149,999 | 78 | 21.9% |
| $150,000 to $199,999 | 44 | 12.4% |
| $200,000+ | 99 | 27.8% |
Family Income by Famaliy Size in Sewanee
4-person families (78 | 21.9%) account for the highest median family income in Sewanee with $250,001 per family, while 3-person families (67 | 18.8%) have the highest median income of $71,054 per family member.
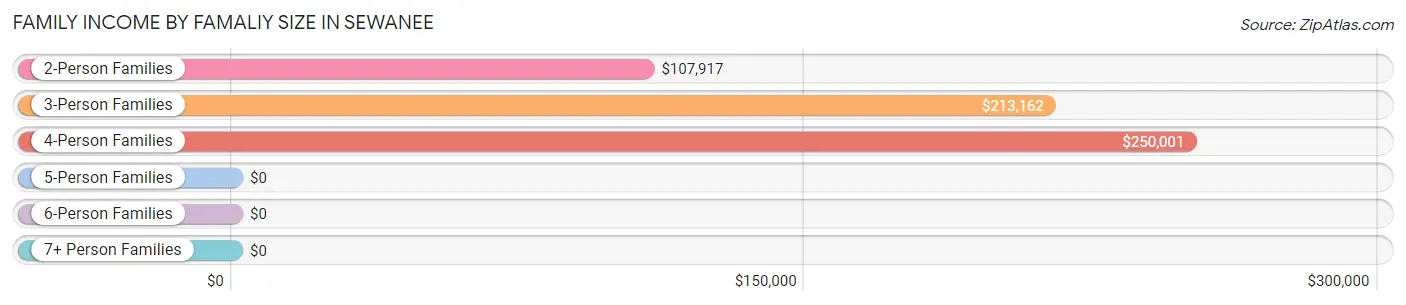
| Income Bracket | # Families | Median Income |
| 2-Person Families | 206 (57.9%) | $107,917 |
| 3-Person Families | 67 (18.8%) | $213,162 |
| 4-Person Families | 78 (21.9%) | $250,001 |
| 5-Person Families | 5 (1.4%) | $0 |
| 6-Person Families | 0 (0.0%) | $0 |
| 7+ Person Families | 0 (0.0%) | $0 |
| Total | 356 (100.0%) | $129,097 |
Family Income by Number of Earners in Sewanee
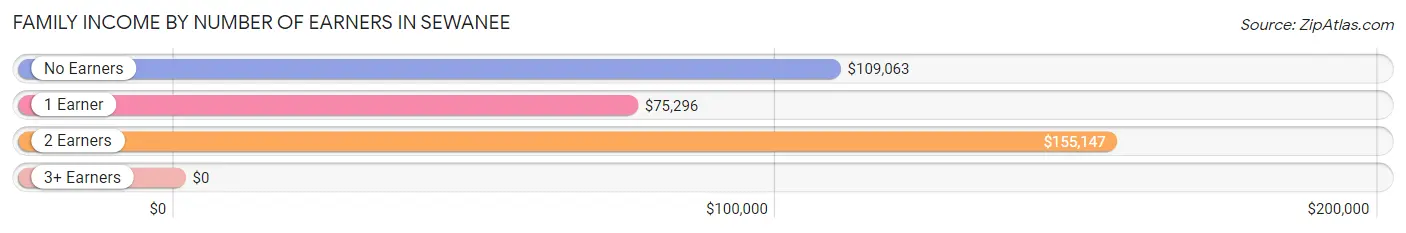
| Number of Earners | # Families | Median Income |
| No Earners | 55 (15.4%) | $109,063 |
| 1 Earner | 101 (28.4%) | $75,296 |
| 2 Earners | 162 (45.5%) | $155,147 |
| 3+ Earners | 38 (10.7%) | $0 |
| Total | 356 (100.0%) | $129,097 |
Household Income in Sewanee
Household Income Brackets in Sewanee
With 114 households falling in the category, the $200,000+ income range is the most frequent in Sewanee, accounting for 21.6% of all households.
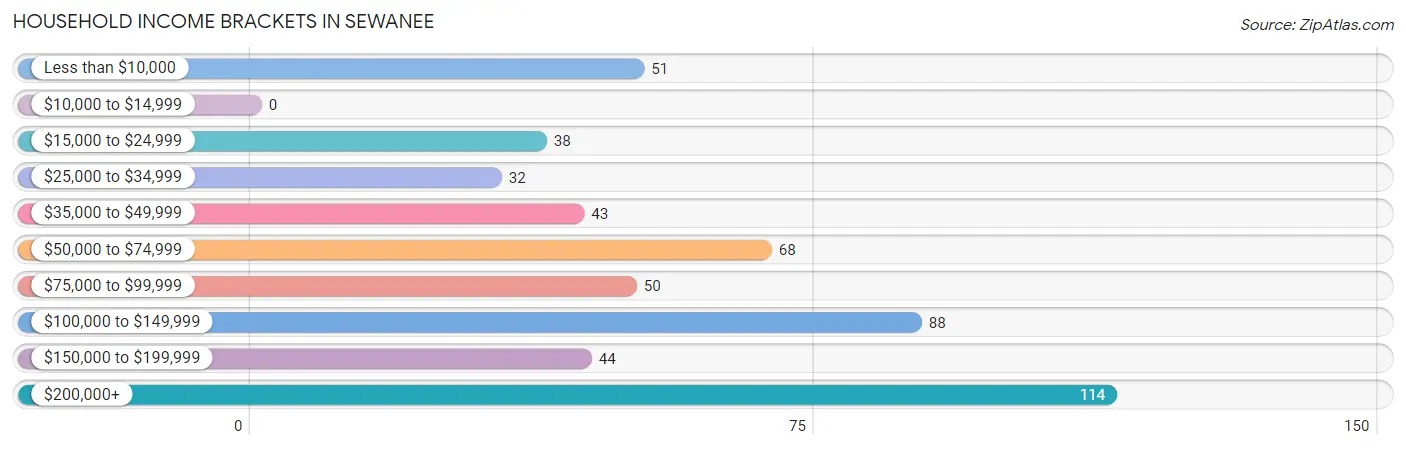
| Income Bracket | # Households | % Households |
| Less than $10,000 | 51 | 9.7% |
| $10,000 to $14,999 | 0 | 0.0% |
| $15,000 to $24,999 | 38 | 7.2% |
| $25,000 to $34,999 | 32 | 6.1% |
| $35,000 to $49,999 | 43 | 8.1% |
| $50,000 to $74,999 | 68 | 12.9% |
| $75,000 to $99,999 | 50 | 9.5% |
| $100,000 to $149,999 | 88 | 16.7% |
| $150,000 to $199,999 | 44 | 8.3% |
| $200,000+ | 114 | 21.6% |
Household Income by Householder Age in Sewanee
The median household income in Sewanee is $77,105, with the highest median household income of $155,441 found in the 45 to 64 years age bracket for the primary householder. A total of 182 households (34.5%) fall into this category. Meanwhile, the 15 to 24 years age bracket for the primary householder has the lowest median household income of $0, with 9 households (1.7%) in this group.
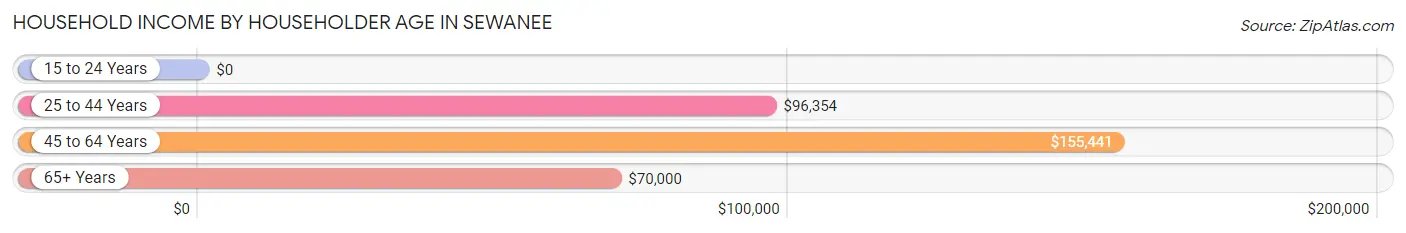
| Income Bracket | # Households | Median Income |
| 15 to 24 Years | 9 (1.7%) | $0 |
| 25 to 44 Years | 69 (13.1%) | $96,354 |
| 45 to 64 Years | 182 (34.5%) | $155,441 |
| 65+ Years | 268 (50.8%) | $70,000 |
| Total | 528 (100.0%) | $77,105 |
Poverty in Sewanee
Income Below Poverty by Sex and Age in Sewanee
With 11.6% poverty level for males and 11.4% for females among the residents of Sewanee, 5 year old males and 18 to 24 year old females are the most vulnerable to poverty, with 9 males (100.0%) and 9 females (39.1%) in their respective age groups living below the poverty level.
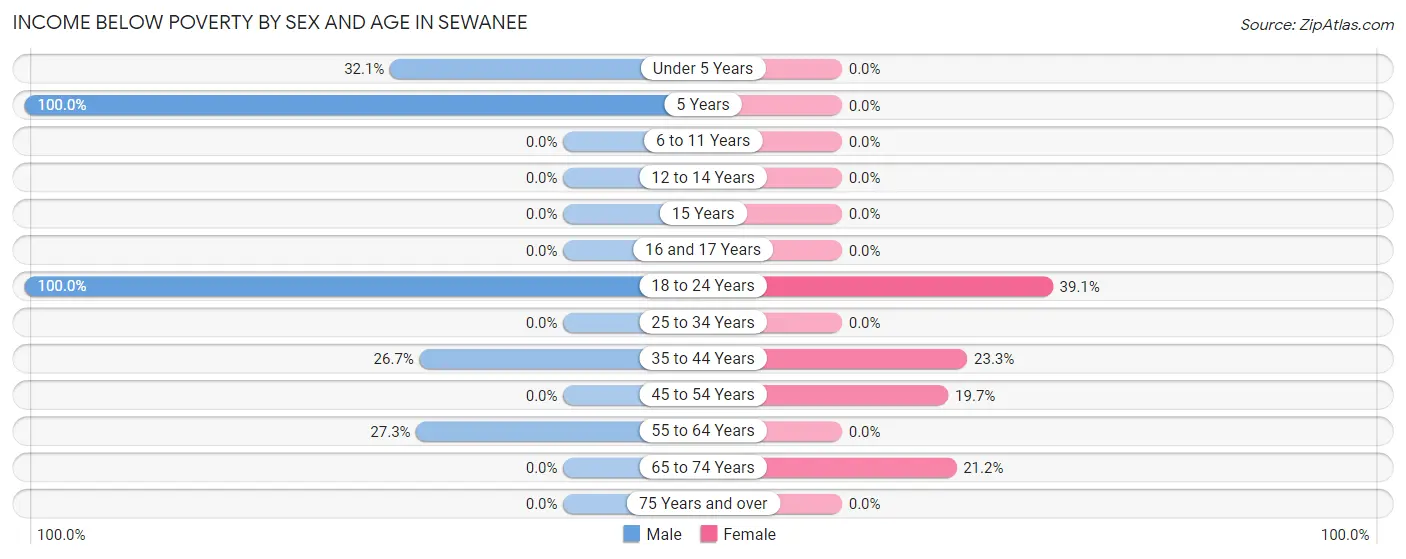
| Age Bracket | Male | Female |
| Under 5 Years | 9 (32.1%) | 0 (0.0%) |
| 5 Years | 9 (100.0%) | 0 (0.0%) |
| 6 to 11 Years | 0 (0.0%) | 0 (0.0%) |
| 12 to 14 Years | 0 (0.0%) | 0 (0.0%) |
| 15 Years | 0 (0.0%) | 0 (0.0%) |
| 16 and 17 Years | 0 (0.0%) | 0 (0.0%) |
| 18 to 24 Years | 14 (100.0%) | 9 (39.1%) |
| 25 to 34 Years | 0 (0.0%) | 0 (0.0%) |
| 35 to 44 Years | 12 (26.7%) | 10 (23.3%) |
| 45 to 54 Years | 0 (0.0%) | 15 (19.7%) |
| 55 to 64 Years | 27 (27.3%) | 0 (0.0%) |
| 65 to 74 Years | 0 (0.0%) | 24 (21.2%) |
| 75 Years and over | 0 (0.0%) | 0 (0.0%) |
| Total | 71 (11.6%) | 58 (11.4%) |
Income Above Poverty by Sex and Age in Sewanee
According to the poverty statistics in Sewanee, males aged 6 to 11 years and females aged under 5 years are the age groups that are most secure financially, with 100.0% of males and 100.0% of females in these age groups living above the poverty line.
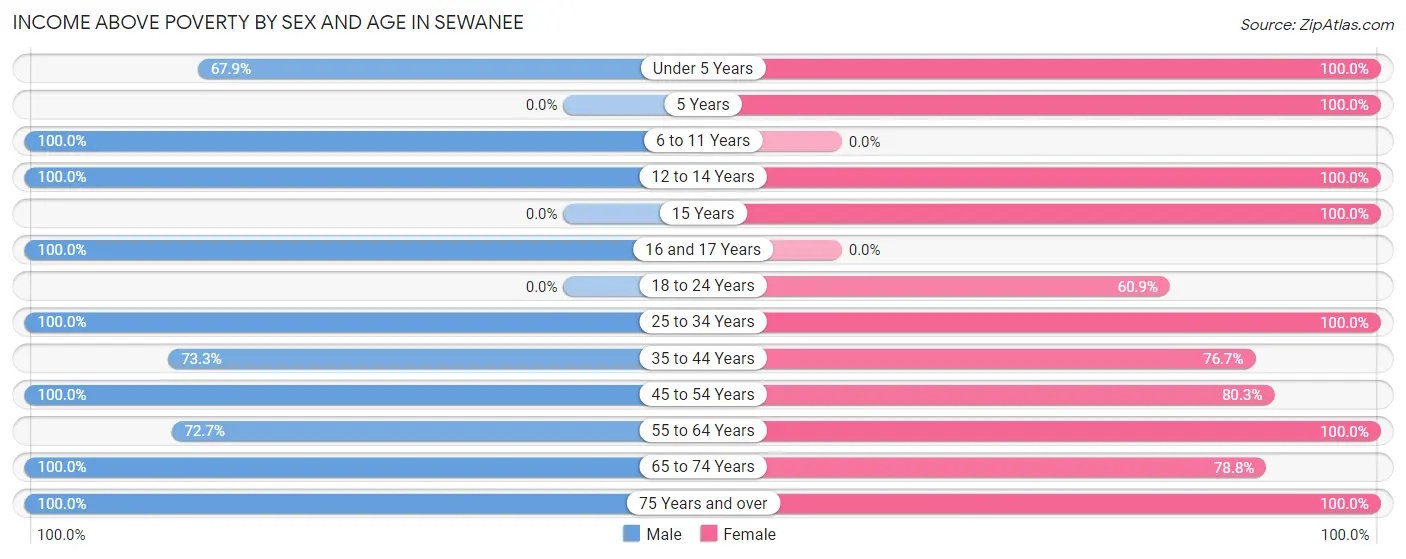
| Age Bracket | Male | Female |
| Under 5 Years | 19 (67.9%) | 29 (100.0%) |
| 5 Years | 0 (0.0%) | 4 (100.0%) |
| 6 to 11 Years | 34 (100.0%) | 0 (0.0%) |
| 12 to 14 Years | 41 (100.0%) | 14 (100.0%) |
| 15 Years | 0 (0.0%) | 4 (100.0%) |
| 16 and 17 Years | 4 (100.0%) | 0 (0.0%) |
| 18 to 24 Years | 0 (0.0%) | 14 (60.9%) |
| 25 to 34 Years | 19 (100.0%) | 22 (100.0%) |
| 35 to 44 Years | 33 (73.3%) | 33 (76.7%) |
| 45 to 54 Years | 108 (100.0%) | 61 (80.3%) |
| 55 to 64 Years | 72 (72.7%) | 77 (100.0%) |
| 65 to 74 Years | 116 (100.0%) | 89 (78.8%) |
| 75 Years and over | 93 (100.0%) | 103 (100.0%) |
| Total | 539 (88.4%) | 450 (88.6%) |
Income Below Poverty Among Married-Couple Families in Sewanee
The poverty statistics for married-couple families in Sewanee show that 3.5% or 12 of the total 341 families live below the poverty line. Families with 1 or 2 children have the highest poverty rate of 11.8%, comprising of 12 families. On the other hand, families with no children have the lowest poverty rate of 0.0%, which includes 0 families.
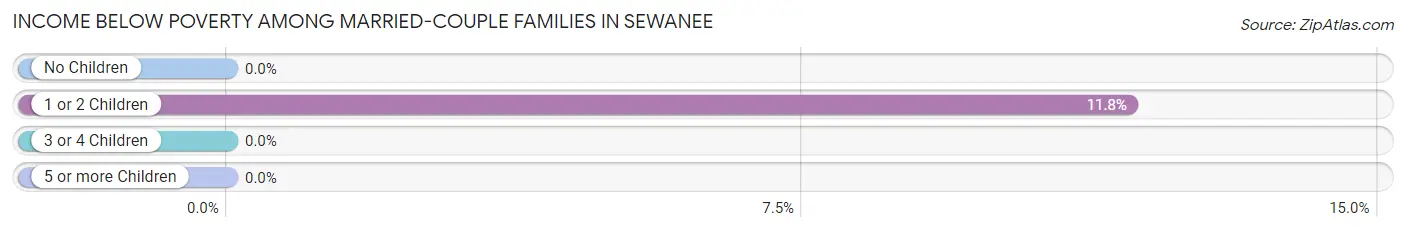
| Children | Above Poverty | Below Poverty |
| No Children | 234 (100.0%) | 0 (0.0%) |
| 1 or 2 Children | 90 (88.2%) | 12 (11.8%) |
| 3 or 4 Children | 5 (100.0%) | 0 (0.0%) |
| 5 or more Children | 0 (0.0%) | 0 (0.0%) |
| Total | 329 (96.5%) | 12 (3.5%) |
Income Below Poverty Among Single-Parent Households in Sewanee
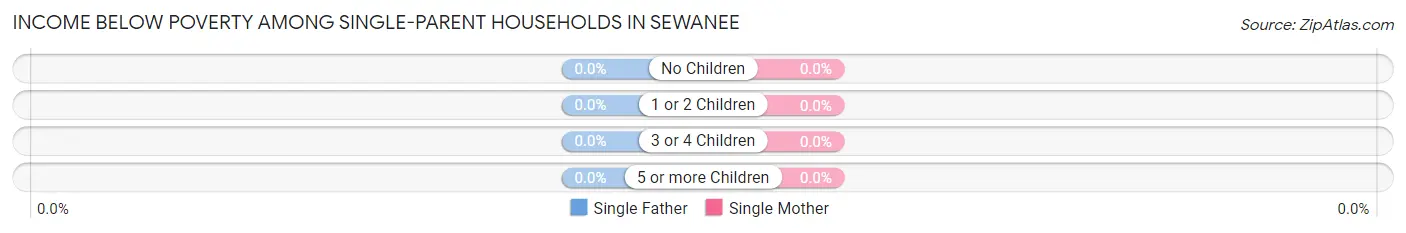
| Children | Single Father | Single Mother |
| No Children | 0 (0.0%) | 0 (0.0%) |
| 1 or 2 Children | 0 (0.0%) | 0 (0.0%) |
| 3 or 4 Children | 0 (0.0%) | 0 (0.0%) |
| 5 or more Children | 0 (0.0%) | 0 (0.0%) |
| Total | 0 (0.0%) | 0 (0.0%) |
Income Below Poverty Among Married-Couple vs Single-Parent Households in Sewanee
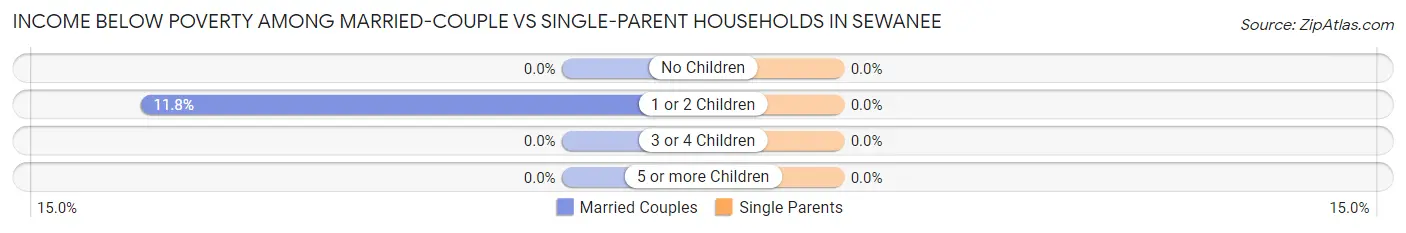
| Children | Married-Couple Families | Single-Parent Households |
| No Children | 0 (0.0%) | 0 (0.0%) |
| 1 or 2 Children | 12 (11.8%) | 0 (0.0%) |
| 3 or 4 Children | 0 (0.0%) | 0 (0.0%) |
| 5 or more Children | 0 (0.0%) | 0 (0.0%) |
| Total | 12 (3.5%) | 0 (0.0%) |
Race in Sewanee
The most populous races in Sewanee are White / Caucasian (2,646 | 90.5%), Two or more Races (145 | 5.0%), and Hispanic or Latino (138 | 4.7%).
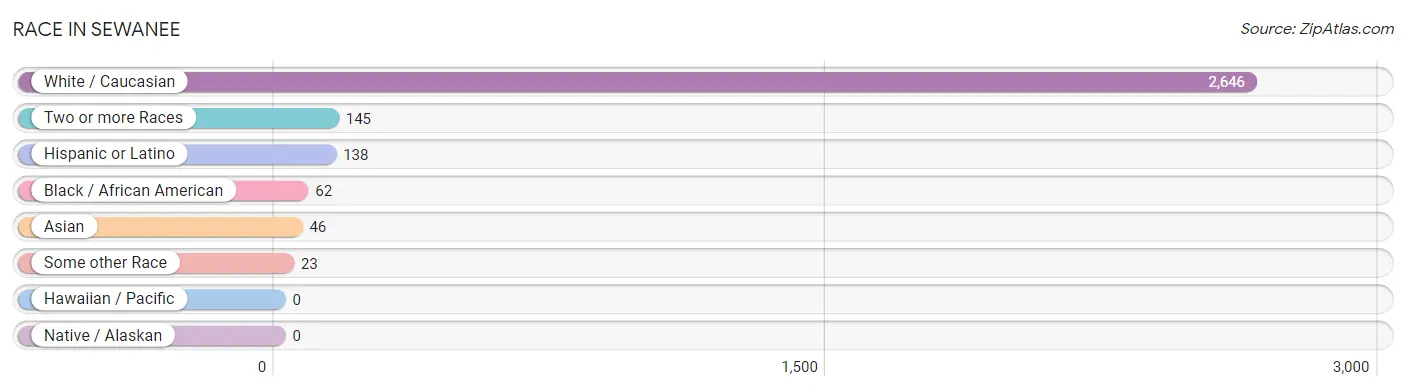
| Race | # Population | % Population |
| Asian | 46 | 1.6% |
| Black / African American | 62 | 2.1% |
| Hawaiian / Pacific | 0 | 0.0% |
| Hispanic or Latino | 138 | 4.7% |
| Native / Alaskan | 0 | 0.0% |
| White / Caucasian | 2,646 | 90.5% |
| Two or more Races | 145 | 5.0% |
| Some other Race | 23 | 0.8% |
| Total | 2,922 | 100.0% |
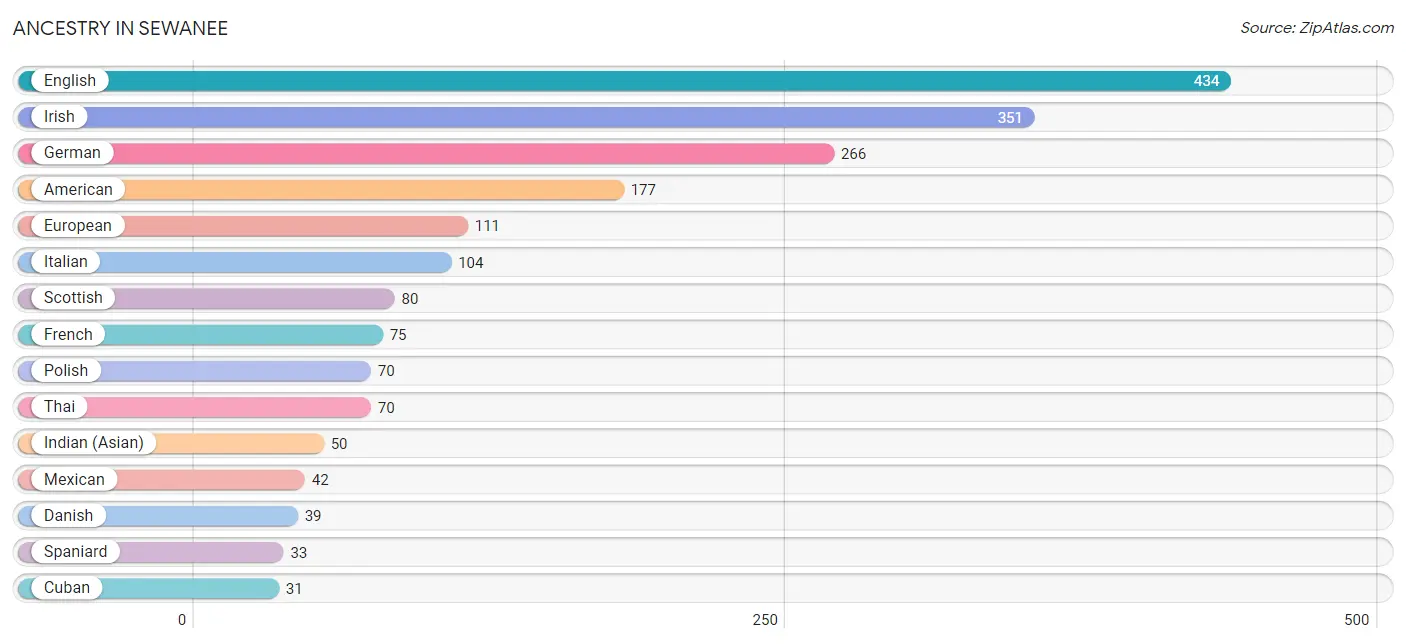
Ancestry in Sewanee
The most populous ancestries reported in Sewanee are English (434 | 14.8%), Irish (351 | 12.0%), German (266 | 9.1%), American (177 | 6.1%), and European (111 | 3.8%), together accounting for 45.8% of all Sewanee residents.
| Ancestry | # Population | % Population |
| American | 177 | 6.1% |
| Arab | 2 | 0.1% |
| Argentinean | 14 | 0.5% |
| Armenian | 5 | 0.2% |
| Austrian | 5 | 0.2% |
| British | 18 | 0.6% |
| Burmese | 26 | 0.9% |
| Canadian | 27 | 0.9% |
| Central American | 8 | 0.3% |
| Cuban | 31 | 1.1% |
| Danish | 39 | 1.3% |
| Dutch | 30 | 1.0% |
| English | 434 | 14.8% |
| Ethiopian | 7 | 0.2% |
| European | 111 | 3.8% |
| French | 75 | 2.6% |
| French Canadian | 14 | 0.5% |
| German | 266 | 9.1% |
| Guatemalan | 4 | 0.1% |
| Hungarian | 18 | 0.6% |
| Indian (Asian) | 50 | 1.7% |
| Irish | 351 | 12.0% |
| Italian | 104 | 3.6% |
| Lebanese | 2 | 0.1% |
| Mexican | 42 | 1.4% |
| Norwegian | 11 | 0.4% |
| Panamanian | 4 | 0.1% |
| Polish | 70 | 2.4% |
| Scottish | 80 | 2.7% |
| South American | 14 | 0.5% |
| Spaniard | 33 | 1.1% |
| Subsaharan African | 7 | 0.2% |
| Swedish | 28 | 1.0% |
| Swiss | 8 | 0.3% |
| Thai | 70 | 2.4% |
| Welsh | 16 | 0.5% |
| Yugoslavian | 10 | 0.3% | View All 37 Rows |
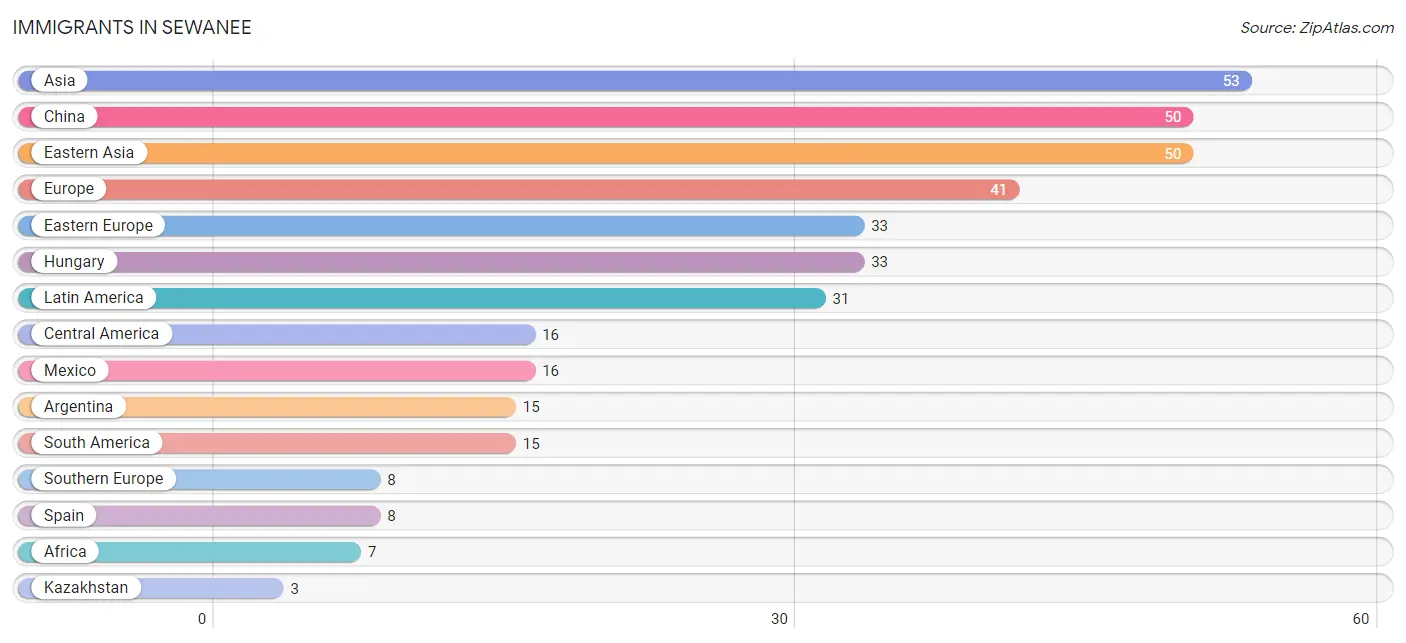
Immigrants in Sewanee
The most numerous immigrant groups reported in Sewanee came from Asia (53 | 1.8%), China (50 | 1.7%), Eastern Asia (50 | 1.7%), Europe (41 | 1.4%), and Eastern Europe (33 | 1.1%), together accounting for 7.8% of all Sewanee residents.
| Immigration Origin | # Population | % Population |
| Africa | 7 | 0.2% |
| Argentina | 15 | 0.5% |
| Asia | 53 | 1.8% |
| Central America | 16 | 0.5% |
| China | 50 | 1.7% |
| Eastern Asia | 50 | 1.7% |
| Eastern Europe | 33 | 1.1% |
| Europe | 41 | 1.4% |
| Hungary | 33 | 1.1% |
| Kazakhstan | 3 | 0.1% |
| Latin America | 31 | 1.1% |
| Mexico | 16 | 0.5% |
| South America | 15 | 0.5% |
| South Central Asia | 3 | 0.1% |
| Southern Europe | 8 | 0.3% |
| Spain | 8 | 0.3% | View All 16 Rows |
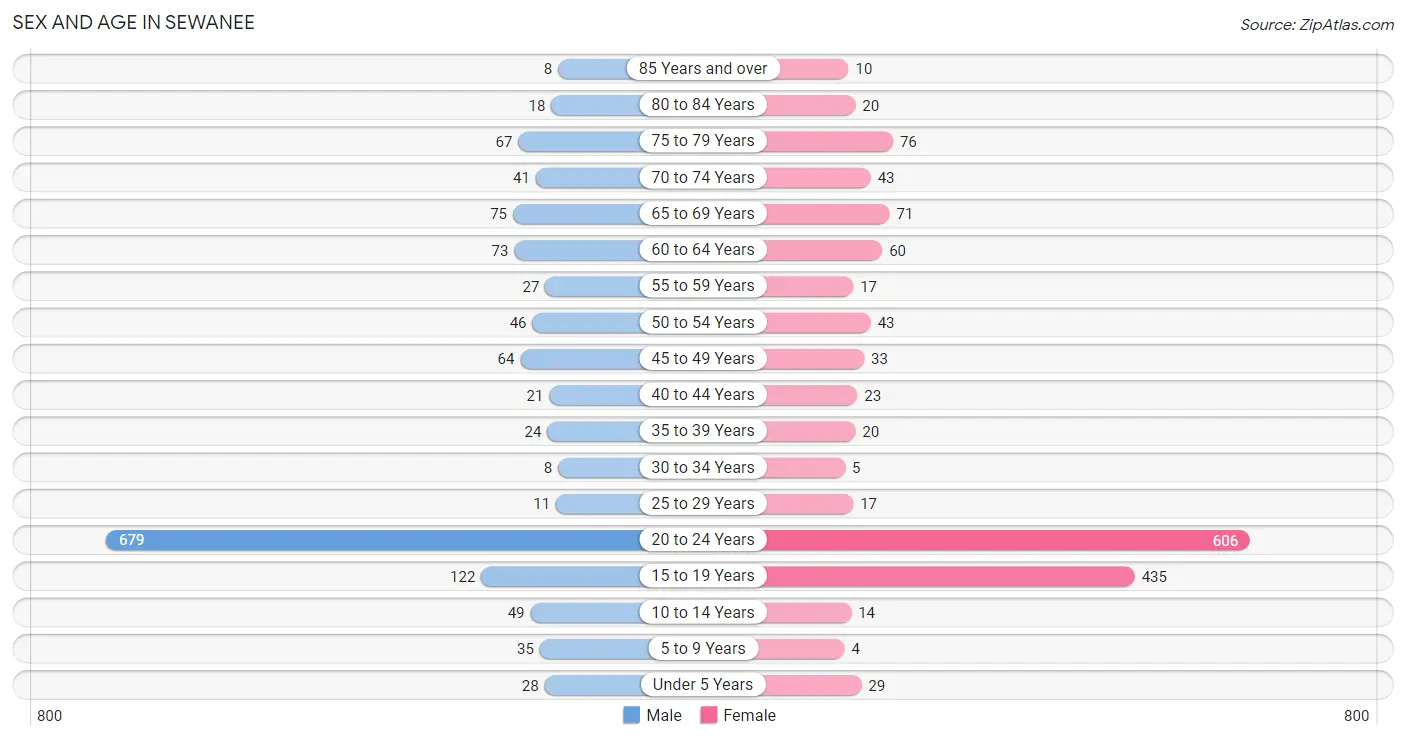
Sex and Age in Sewanee
Sex and Age in Sewanee
The most populous age groups in Sewanee are 20 to 24 Years (679 | 48.6%) for men and 20 to 24 Years (606 | 39.7%) for women.
| Age Bracket | Male | Female |
| Under 5 Years | 28 (2.0%) | 29 (1.9%) |
| 5 to 9 Years | 35 (2.5%) | 4 (0.3%) |
| 10 to 14 Years | 49 (3.5%) | 14 (0.9%) |
| 15 to 19 Years | 122 (8.7%) | 435 (28.5%) |
| 20 to 24 Years | 679 (48.6%) | 606 (39.7%) |
| 25 to 29 Years | 11 (0.8%) | 17 (1.1%) |
| 30 to 34 Years | 8 (0.6%) | 5 (0.3%) |
| 35 to 39 Years | 24 (1.7%) | 20 (1.3%) |
| 40 to 44 Years | 21 (1.5%) | 23 (1.5%) |
| 45 to 49 Years | 64 (4.6%) | 33 (2.2%) |
| 50 to 54 Years | 46 (3.3%) | 43 (2.8%) |
| 55 to 59 Years | 27 (1.9%) | 17 (1.1%) |
| 60 to 64 Years | 73 (5.2%) | 60 (3.9%) |
| 65 to 69 Years | 75 (5.4%) | 71 (4.6%) |
| 70 to 74 Years | 41 (2.9%) | 43 (2.8%) |
| 75 to 79 Years | 67 (4.8%) | 76 (5.0%) |
| 80 to 84 Years | 18 (1.3%) | 20 (1.3%) |
| 85 Years and over | 8 (0.6%) | 10 (0.7%) |
| Total | 1,396 (100.0%) | 1,526 (100.0%) |
Families and Households in Sewanee
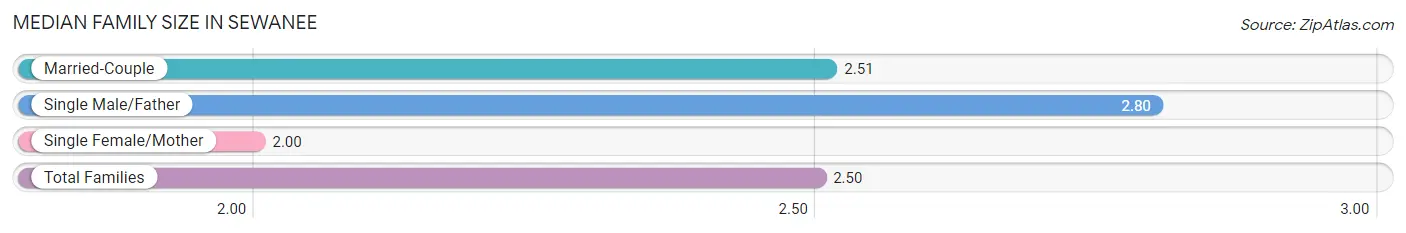
Median Family Size in Sewanee
The median family size in Sewanee is 2.50 persons per family, with single male/father families (5 | 1.4%) accounting for the largest median family size of 2.8 persons per family. On the other hand, single female/mother families (10 | 2.8%) represent the smallest median family size with 2.00 persons per family.
| Family Type | # Families | Family Size |
| Married-Couple | 341 (95.8%) | 2.51 |
| Single Male/Father | 5 (1.4%) | 2.80 |
| Single Female/Mother | 10 (2.8%) | 2.00 |
| Total Families | 356 (100.0%) | 2.50 |
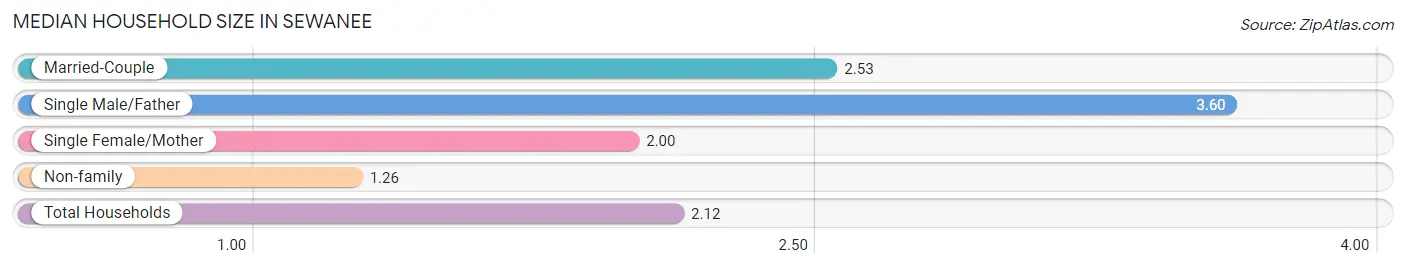
Median Household Size in Sewanee
The median household size in Sewanee is 2.12 persons per household, with single male/father households (5 | 0.9%) accounting for the largest median household size of 3.6 persons per household. non-family households (172 | 32.6%) represent the smallest median household size with 1.26 persons per household.
| Household Type | # Households | Household Size |
| Married-Couple | 341 (64.6%) | 2.53 |
| Single Male/Father | 5 (0.9%) | 3.60 |
| Single Female/Mother | 10 (1.9%) | 2.00 |
| Non-family | 172 (32.6%) | 1.26 |
| Total Households | 528 (100.0%) | 2.12 |
Household Size by Marriage Status in Sewanee
Out of a total of 528 households in Sewanee, 356 (67.4%) are family households, while 172 (32.6%) are nonfamily households. The most numerous type of family households are 2-person households, comprising 206, and the most common type of nonfamily households are 1-person households, comprising 129.
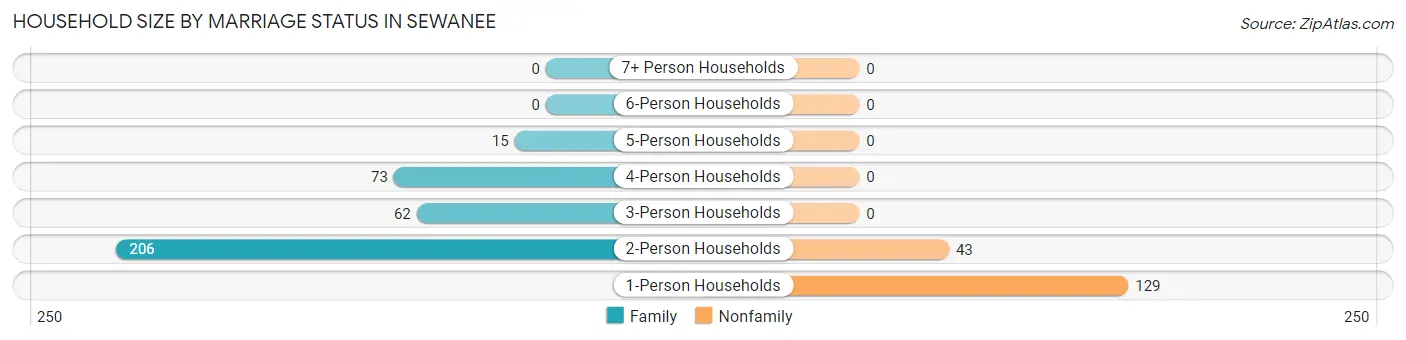
| Household Size | Family Households | Nonfamily Households |
| 1-Person Households | - | 129 (24.4%) |
| 2-Person Households | 206 (39.0%) | 43 (8.1%) |
| 3-Person Households | 62 (11.7%) | 0 (0.0%) |
| 4-Person Households | 73 (13.8%) | 0 (0.0%) |
| 5-Person Households | 15 (2.8%) | 0 (0.0%) |
| 6-Person Households | 0 (0.0%) | 0 (0.0%) |
| 7+ Person Households | 0 (0.0%) | 0 (0.0%) |
| Total | 356 (67.4%) | 172 (32.6%) |
Female Fertility in Sewanee
Fertility by Age in Sewanee
Average fertility rate in Sewanee is 4.0 births per 1,000 women. Women in the age bracket of 20 to 34 years have the highest fertility rate with 8.0 births per 1,000 women. Women in the age bracket of 20 to 34 years acount for 100.0% of all women with births.
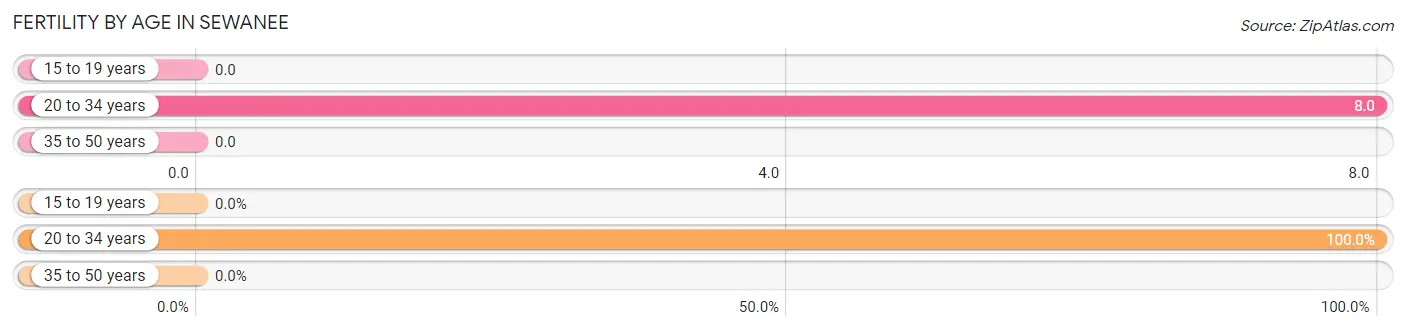
| Age Bracket | Women with Births | Births / 1,000 Women |
| 15 to 19 years | 0 (0.0%) | 0.0 |
| 20 to 34 years | 5 (100.0%) | 8.0 |
| 35 to 50 years | 0 (0.0%) | 0.0 |
| Total | 5 (100.0%) | 4.0 |
Fertility by Age by Marriage Status in Sewanee
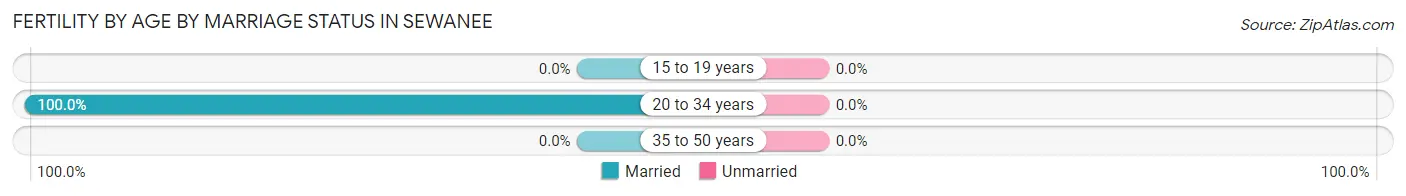
| Age Bracket | Married | Unmarried |
| 15 to 19 years | 0 (0.0%) | 0 (0.0%) |
| 20 to 34 years | 5 (100.0%) | 0 (0.0%) |
| 35 to 50 years | 0 (0.0%) | 0 (0.0%) |
| Total | 5 (100.0%) | 0 (0.0%) |
Fertility by Education in Sewanee
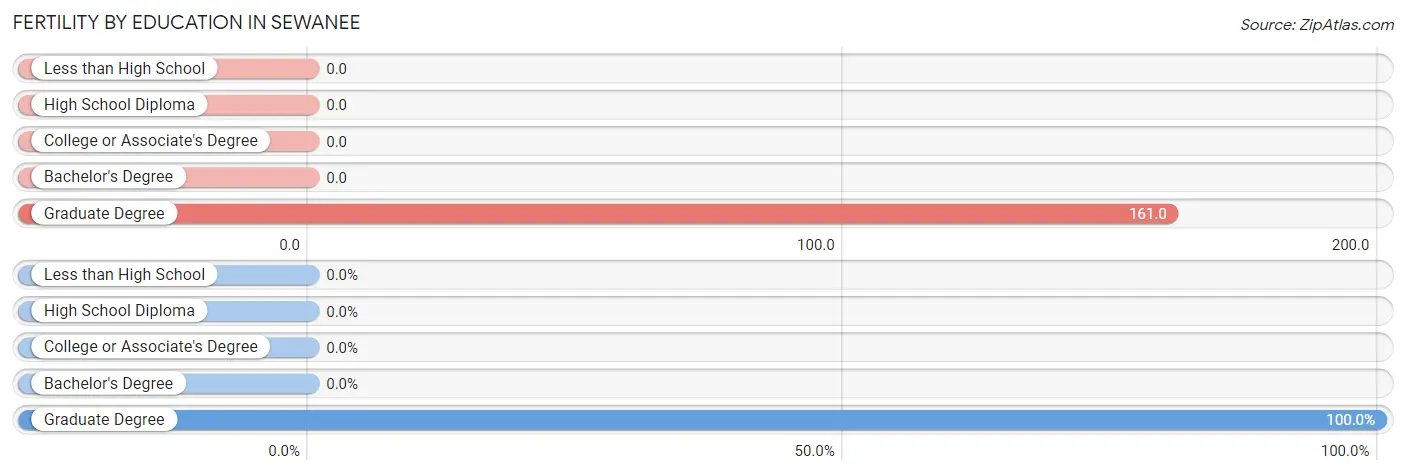
| Educational Attainment | Women with Births | Births / 1,000 Women |
| Less than High School | 0 (0.0%) | 0.0 |
| High School Diploma | 0 (0.0%) | 0.0 |
| College or Associate's Degree | 0 (0.0%) | 0.0 |
| Bachelor's Degree | 0 (0.0%) | 0.0 |
| Graduate Degree | 5 (100.0%) | 161.0 |
| Total | 5 (100.0%) | 4.0 |
Fertility by Education by Marriage Status in Sewanee
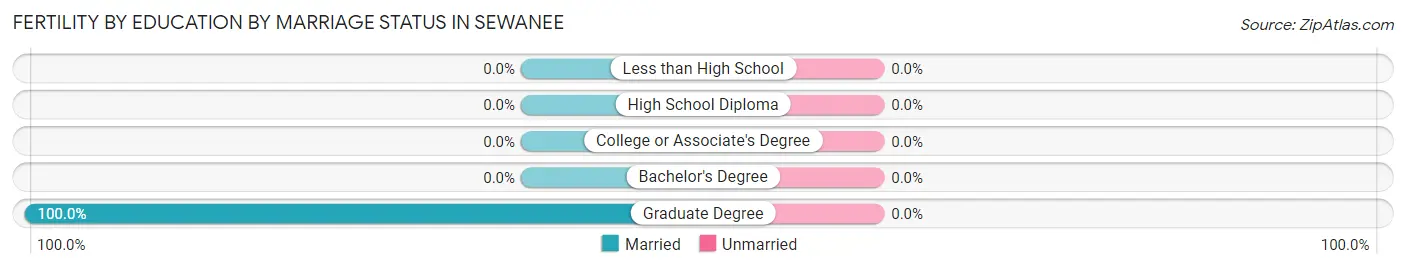
| Educational Attainment | Married | Unmarried |
| Less than High School | 0 (0.0%) | 0 (0.0%) |
| High School Diploma | 0 (0.0%) | 0 (0.0%) |
| College or Associate's Degree | 0 (0.0%) | 0 (0.0%) |
| Bachelor's Degree | 0 (0.0%) | 0 (0.0%) |
| Graduate Degree | 5 (100.0%) | 0 (0.0%) |
| Total | 5 (100.0%) | 0 (0.0%) |
Employment Characteristics in Sewanee
Employment by Class of Employer in Sewanee
Among the 1,305 employed individuals in Sewanee, private company employees (662 | 50.7%), not-for-profit organizations (389 | 29.8%), and state government employees (125 | 9.6%) make up the most common classes of employment.
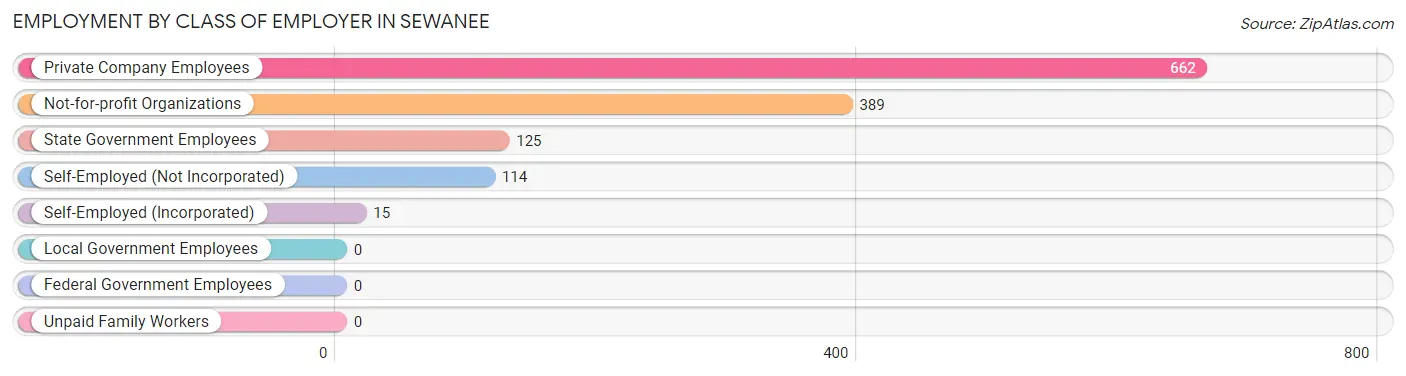
| Employer Class | # Employees | % Employees |
| Private Company Employees | 662 | 50.7% |
| Self-Employed (Incorporated) | 15 | 1.1% |
| Self-Employed (Not Incorporated) | 114 | 8.7% |
| Not-for-profit Organizations | 389 | 29.8% |
| Local Government Employees | 0 | 0.0% |
| State Government Employees | 125 | 9.6% |
| Federal Government Employees | 0 | 0.0% |
| Unpaid Family Workers | 0 | 0.0% |
| Total | 1,305 | 100.0% |
Employment Status by Age in Sewanee
According to the labor force statistics for Sewanee, out of the total population over 16 years of age (2,759), 52.6% or 1,451 individuals are in the labor force, with 0.7% or 10 of them unemployed. The age group with the highest labor force participation rate is 30 to 34 years, with 100.0% or 13 individuals in the labor force. Within the labor force, the 60 to 64 years age range has the highest percentage of unemployed individuals, with 8.6% or 10 of them being unemployed.
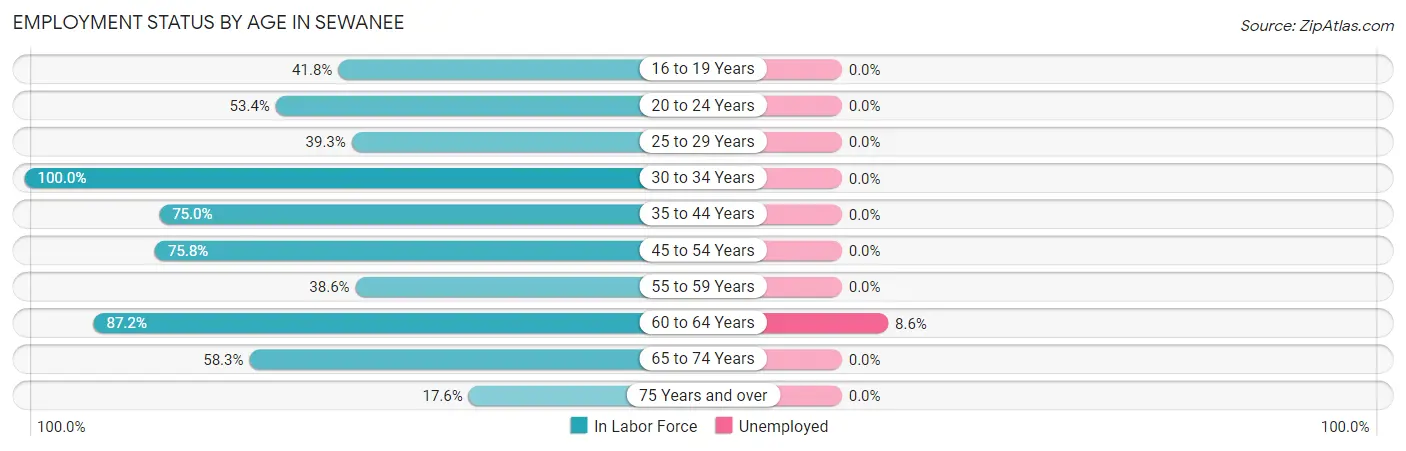
| Age Bracket | In Labor Force | Unemployed |
| 16 to 19 Years | 231 (41.8%) | 0 (0.0%) |
| 20 to 24 Years | 686 (53.4%) | 0 (0.0%) |
| 25 to 29 Years | 11 (39.3%) | 0 (0.0%) |
| 30 to 34 Years | 13 (100.0%) | 0 (0.0%) |
| 35 to 44 Years | 66 (75.0%) | 0 (0.0%) |
| 45 to 54 Years | 141 (75.8%) | 0 (0.0%) |
| 55 to 59 Years | 17 (38.6%) | 0 (0.0%) |
| 60 to 64 Years | 116 (87.2%) | 10 (8.6%) |
| 65 to 74 Years | 134 (58.3%) | 0 (0.0%) |
| 75 Years and over | 35 (17.6%) | 0 (0.0%) |
| Total | 1,451 (52.6%) | 10 (0.7%) |
Employment Status by Educational Attainment in Sewanee
According to labor force statistics for Sewanee, 74.0% of individuals (364) out of the total population between 25 and 64 years of age (492) are in the labor force, with 2.7% or 10 of them being unemployed. The group with the highest labor force participation rate are those with the educational attainment of less than high school, with 100.0% or 22 individuals in the labor force. Within the labor force, individuals with college / associate degree education have the highest percentage of unemployment, with 29.4% or 10 of them being unemployed.
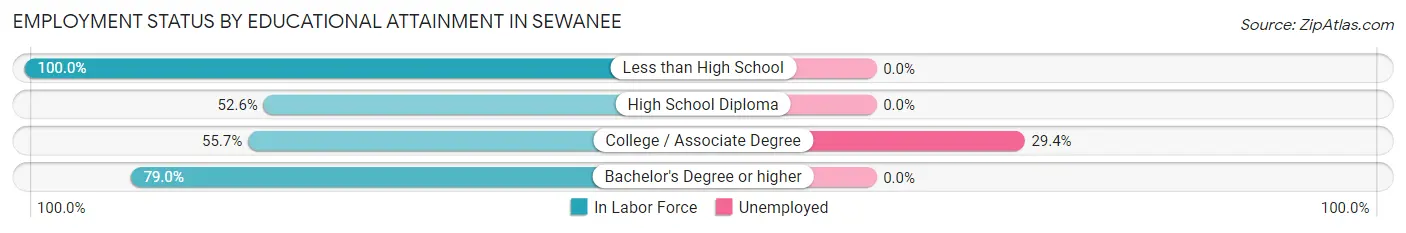
| Educational Attainment | In Labor Force | Unemployed |
| Less than High School | 22 (100.0%) | 0 (0.0%) |
| High School Diploma | 30 (52.6%) | 0 (0.0%) |
| College / Associate Degree | 34 (55.7%) | 18 (29.4%) |
| Bachelor's Degree or higher | 278 (79.0%) | 0 (0.0%) |
| Total | 364 (74.0%) | 13 (2.7%) |
Employment Occupations by Sex in Sewanee
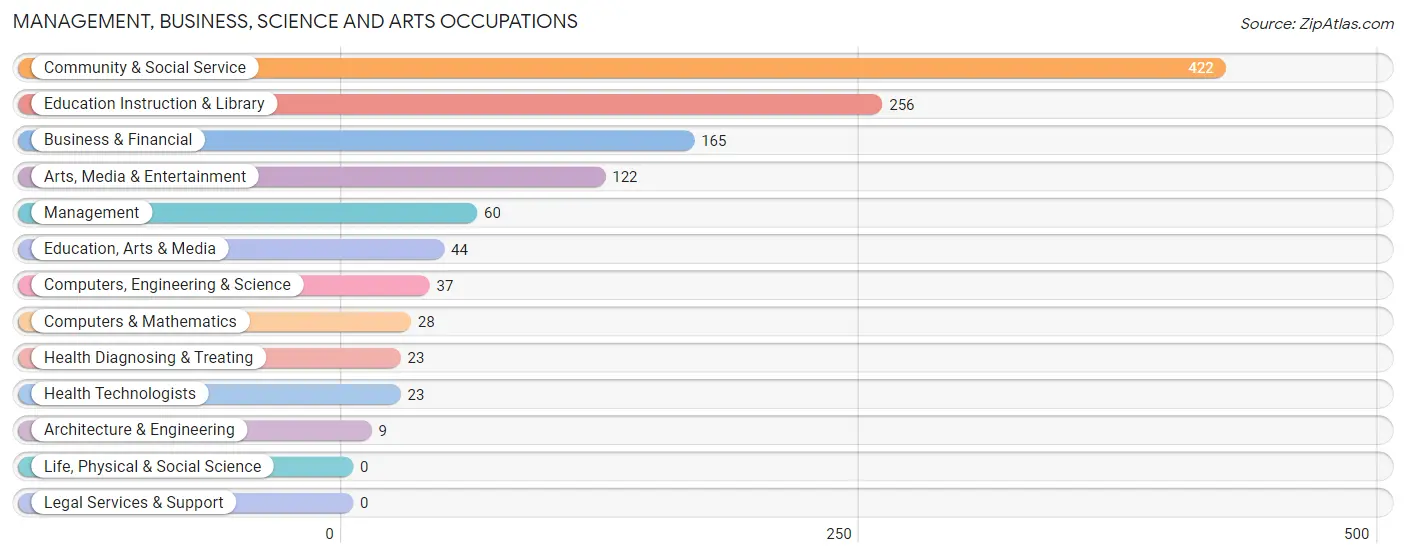
Management, Business, Science and Arts Occupations
The most common Management, Business, Science and Arts occupations in Sewanee are Community & Social Service (422 | 29.3%), Education Instruction & Library (256 | 17.8%), Business & Financial (165 | 11.5%), Arts, Media & Entertainment (122 | 8.5%), and Management (60 | 4.2%).
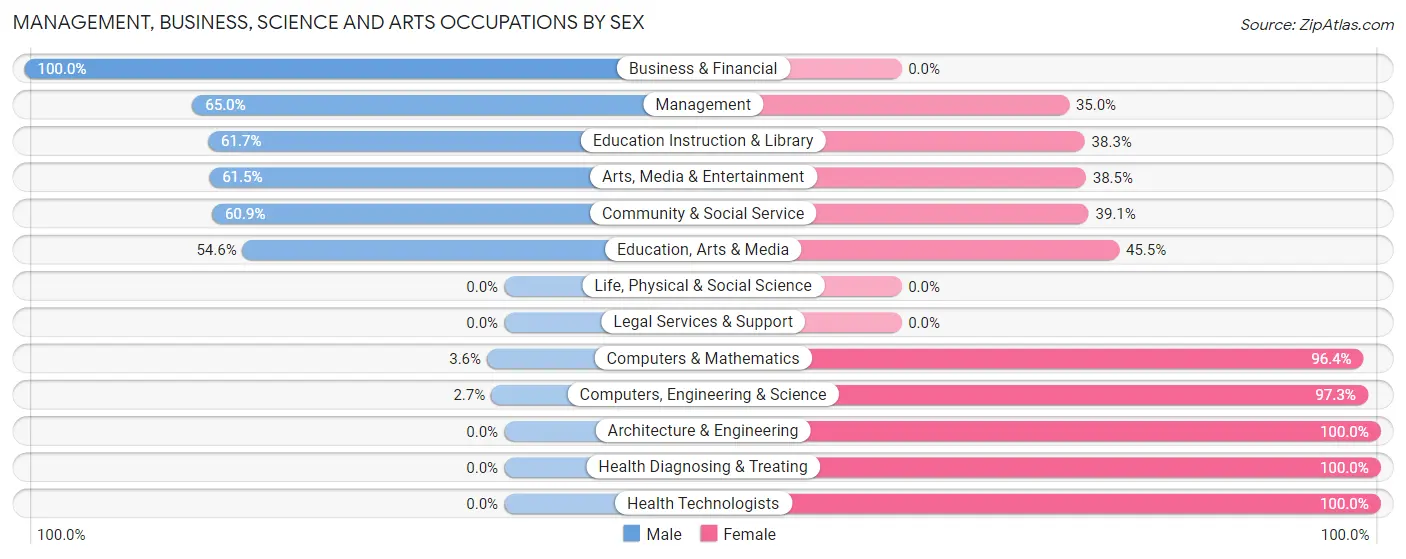
Management, Business, Science and Arts Occupations by Sex
Within the Management, Business, Science and Arts occupations in Sewanee, the most male-oriented occupations are Business & Financial (100.0%), Management (65.0%), and Education Instruction & Library (61.7%), while the most female-oriented occupations are Architecture & Engineering (100.0%), Health Diagnosing & Treating (100.0%), and Health Technologists (100.0%).
| Occupation | Male | Female |
| Management | 39 (65.0%) | 21 (35.0%) |
| Business & Financial | 165 (100.0%) | 0 (0.0%) |
| Computers, Engineering & Science | 1 (2.7%) | 36 (97.3%) |
| Computers & Mathematics | 1 (3.6%) | 27 (96.4%) |
| Architecture & Engineering | 0 (0.0%) | 9 (100.0%) |
| Life, Physical & Social Science | 0 (0.0%) | 0 (0.0%) |
| Community & Social Service | 257 (60.9%) | 165 (39.1%) |
| Education, Arts & Media | 24 (54.5%) | 20 (45.5%) |
| Legal Services & Support | 0 (0.0%) | 0 (0.0%) |
| Education Instruction & Library | 158 (61.7%) | 98 (38.3%) |
| Arts, Media & Entertainment | 75 (61.5%) | 47 (38.5%) |
| Health Diagnosing & Treating | 0 (0.0%) | 23 (100.0%) |
| Health Technologists | 0 (0.0%) | 23 (100.0%) |
| Total (Category) | 462 (65.3%) | 245 (34.6%) |
| Total (Overall) | 781 (54.2%) | 659 (45.8%) |
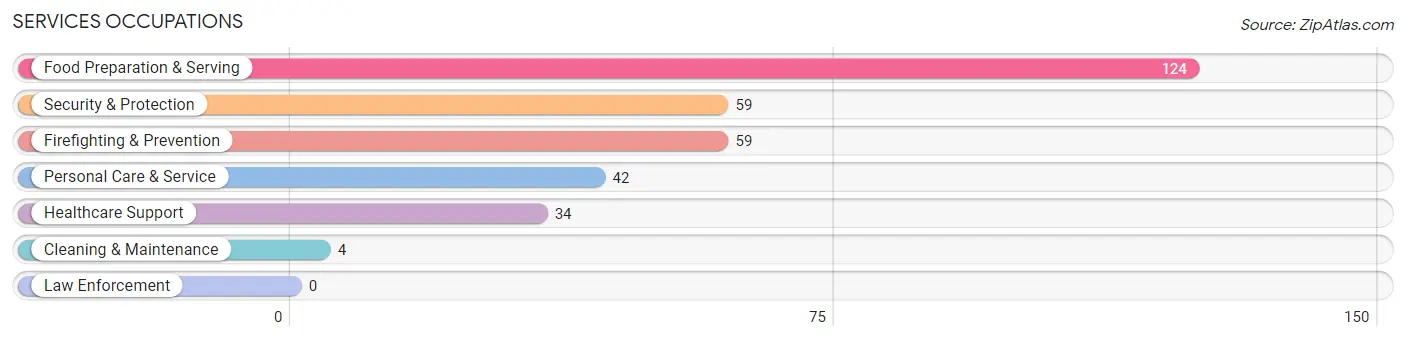
Services Occupations
The most common Services occupations in Sewanee are Food Preparation & Serving (124 | 8.6%), Security & Protection (59 | 4.1%), Firefighting & Prevention (59 | 4.1%), Personal Care & Service (42 | 2.9%), and Healthcare Support (34 | 2.4%).
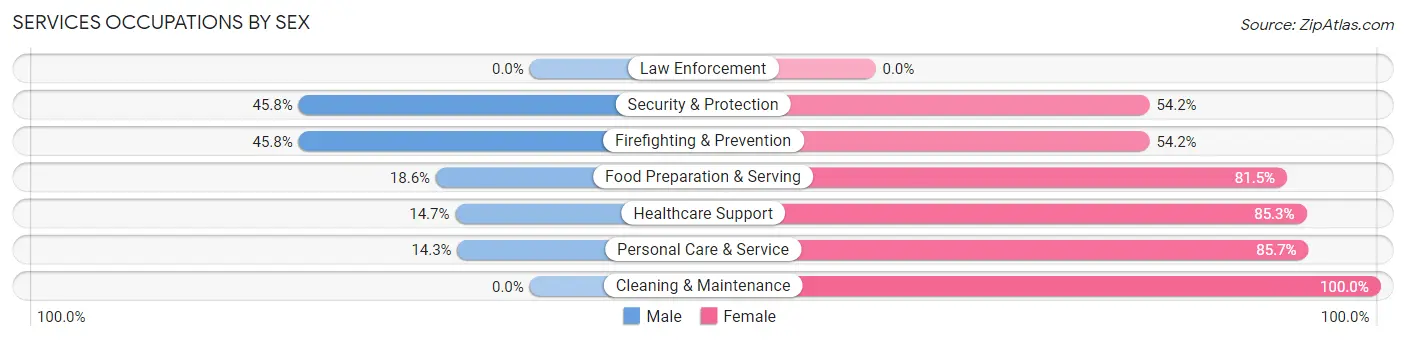
Services Occupations by Sex
Within the Services occupations in Sewanee, the most male-oriented occupations are Security & Protection (45.8%), Firefighting & Prevention (45.8%), and Food Preparation & Serving (18.5%), while the most female-oriented occupations are Cleaning & Maintenance (100.0%), Personal Care & Service (85.7%), and Healthcare Support (85.3%).
| Occupation | Male | Female |
| Healthcare Support | 5 (14.7%) | 29 (85.3%) |
| Security & Protection | 27 (45.8%) | 32 (54.2%) |
| Firefighting & Prevention | 27 (45.8%) | 32 (54.2%) |
| Law Enforcement | 0 (0.0%) | 0 (0.0%) |
| Food Preparation & Serving | 23 (18.5%) | 101 (81.5%) |
| Cleaning & Maintenance | 0 (0.0%) | 4 (100.0%) |
| Personal Care & Service | 6 (14.3%) | 36 (85.7%) |
| Total (Category) | 61 (23.2%) | 202 (76.8%) |
| Total (Overall) | 781 (54.2%) | 659 (45.8%) |
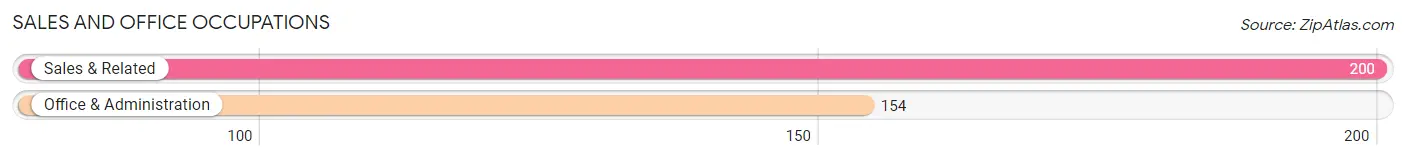
Sales and Office Occupations
The most common Sales and Office occupations in Sewanee are Sales & Related (200 | 13.9%), and Office & Administration (154 | 10.7%).
Sales and Office Occupations by Sex
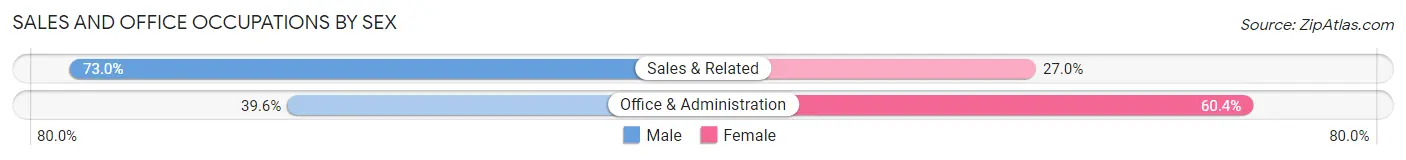
| Occupation | Male | Female |
| Sales & Related | 146 (73.0%) | 54 (27.0%) |
| Office & Administration | 61 (39.6%) | 93 (60.4%) |
| Total (Category) | 207 (58.5%) | 147 (41.5%) |
| Total (Overall) | 781 (54.2%) | 659 (45.8%) |
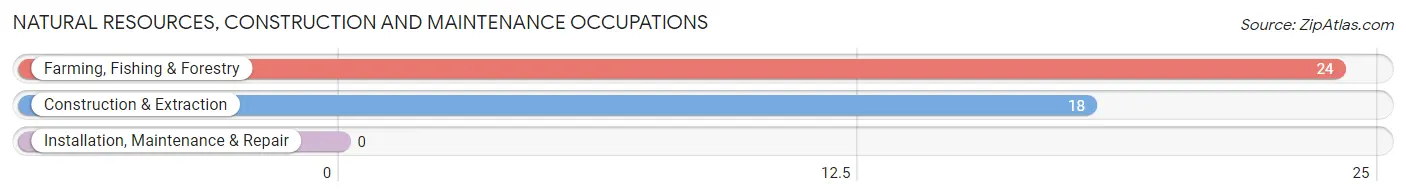
Natural Resources, Construction and Maintenance Occupations
The most common Natural Resources, Construction and Maintenance occupations in Sewanee are Farming, Fishing & Forestry (24 | 1.7%), and Construction & Extraction (18 | 1.3%).
Natural Resources, Construction and Maintenance Occupations by Sex
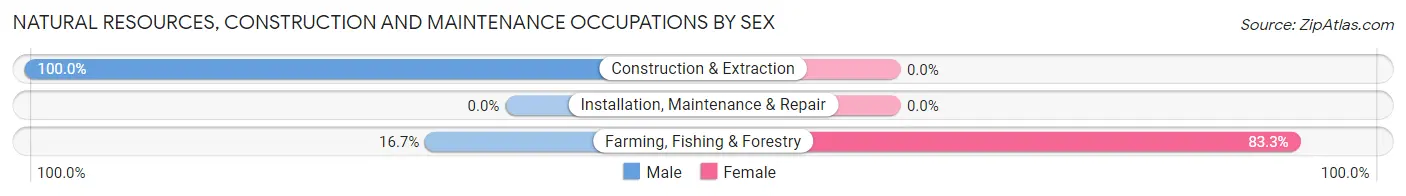
| Occupation | Male | Female |
| Farming, Fishing & Forestry | 4 (16.7%) | 20 (83.3%) |
| Construction & Extraction | 18 (100.0%) | 0 (0.0%) |
| Installation, Maintenance & Repair | 0 (0.0%) | 0 (0.0%) |
| Total (Category) | 22 (52.4%) | 20 (47.6%) |
| Total (Overall) | 781 (54.2%) | 659 (45.8%) |
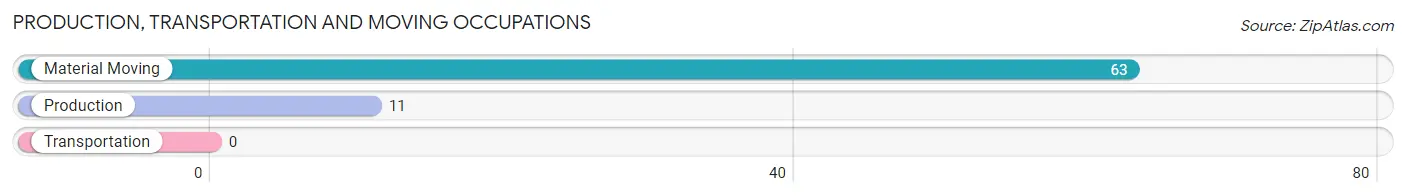
Production, Transportation and Moving Occupations
The most common Production, Transportation and Moving occupations in Sewanee are Material Moving (63 | 4.4%), and Production (11 | 0.8%).
Production, Transportation and Moving Occupations by Sex
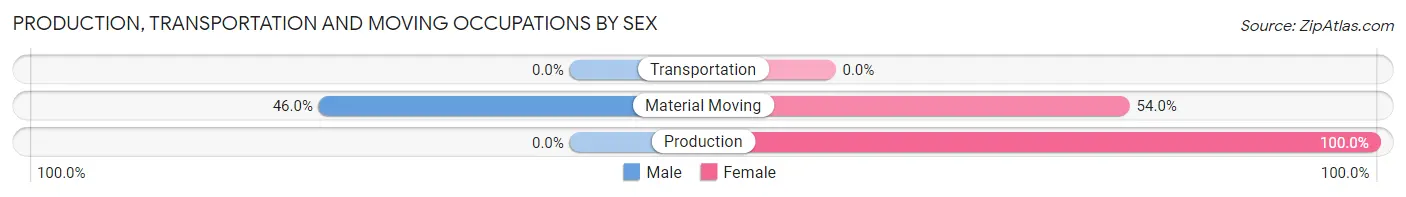
| Occupation | Male | Female |
| Production | 0 (0.0%) | 11 (100.0%) |
| Transportation | 0 (0.0%) | 0 (0.0%) |
| Material Moving | 29 (46.0%) | 34 (54.0%) |
| Total (Category) | 29 (39.2%) | 45 (60.8%) |
| Total (Overall) | 781 (54.2%) | 659 (45.8%) |
Employment Industries by Sex in Sewanee
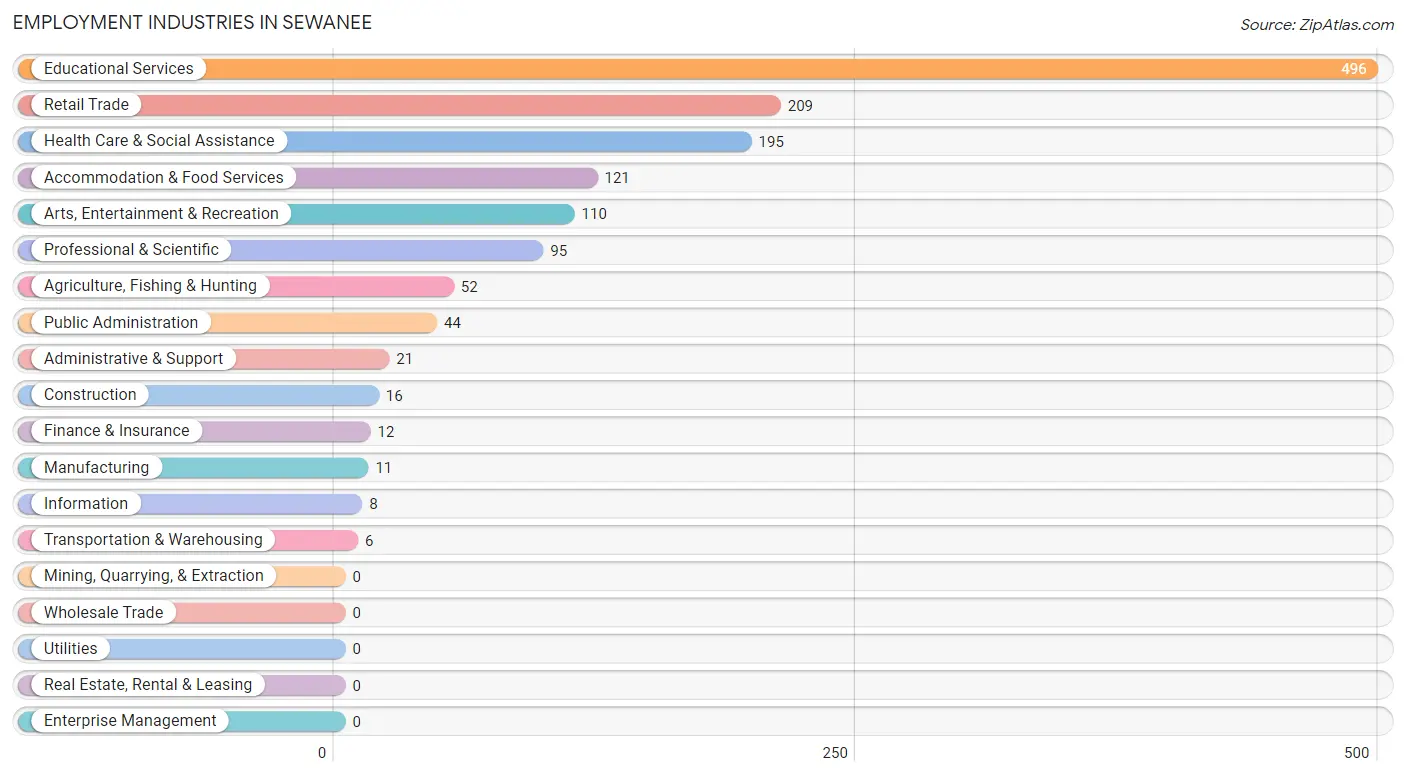
Employment Industries in Sewanee
The major employment industries in Sewanee include Educational Services (496 | 34.4%), Retail Trade (209 | 14.5%), Health Care & Social Assistance (195 | 13.5%), Accommodation & Food Services (121 | 8.4%), and Arts, Entertainment & Recreation (110 | 7.6%).
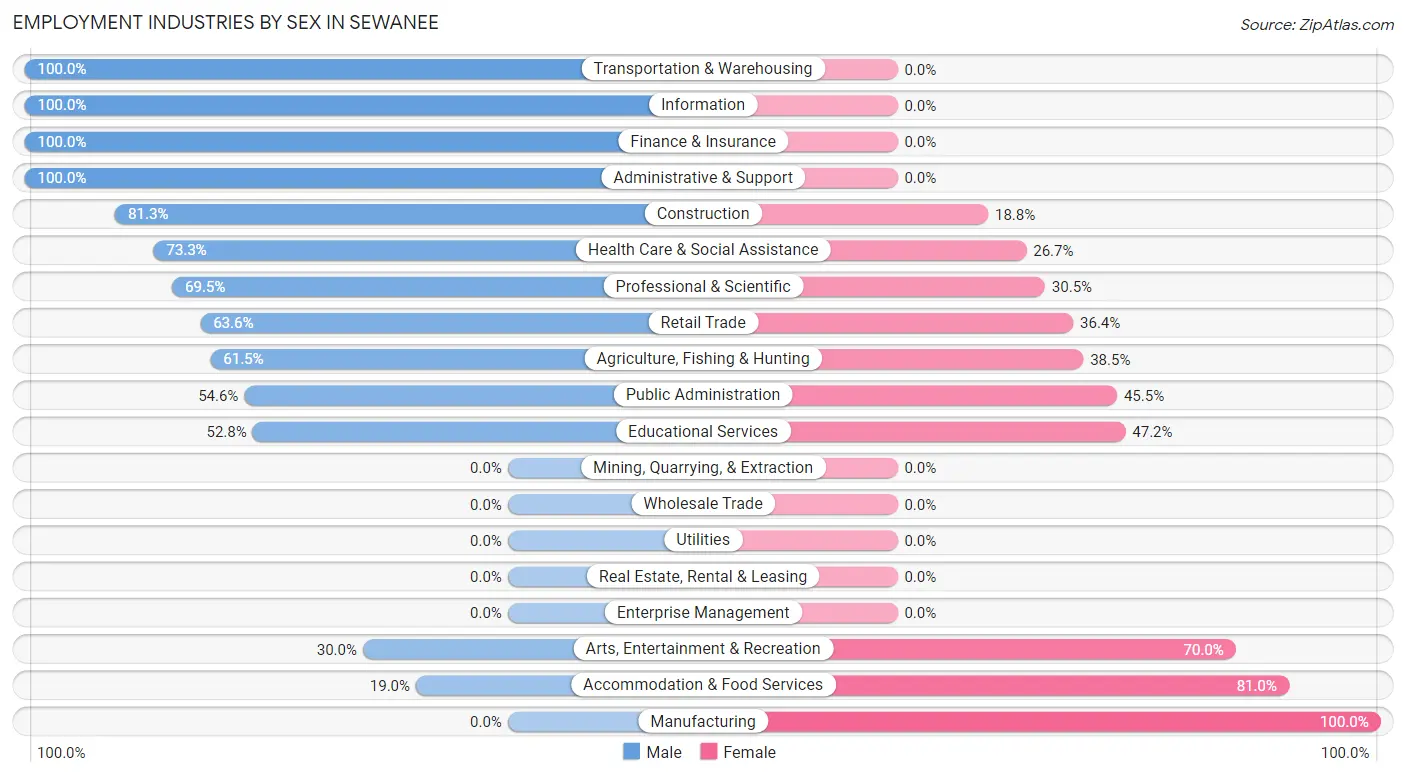
Employment Industries by Sex in Sewanee
The Sewanee industries that see more men than women are Transportation & Warehousing (100.0%), Information (100.0%), and Finance & Insurance (100.0%), whereas the industries that tend to have a higher number of women are Manufacturing (100.0%), Accommodation & Food Services (81.0%), and Arts, Entertainment & Recreation (70.0%).
| Industry | Male | Female |
| Agriculture, Fishing & Hunting | 32 (61.5%) | 20 (38.5%) |
| Mining, Quarrying, & Extraction | 0 (0.0%) | 0 (0.0%) |
| Construction | 13 (81.2%) | 3 (18.8%) |
| Manufacturing | 0 (0.0%) | 11 (100.0%) |
| Wholesale Trade | 0 (0.0%) | 0 (0.0%) |
| Retail Trade | 133 (63.6%) | 76 (36.4%) |
| Transportation & Warehousing | 6 (100.0%) | 0 (0.0%) |
| Utilities | 0 (0.0%) | 0 (0.0%) |
| Information | 8 (100.0%) | 0 (0.0%) |
| Finance & Insurance | 12 (100.0%) | 0 (0.0%) |
| Real Estate, Rental & Leasing | 0 (0.0%) | 0 (0.0%) |
| Professional & Scientific | 66 (69.5%) | 29 (30.5%) |
| Enterprise Management | 0 (0.0%) | 0 (0.0%) |
| Administrative & Support | 21 (100.0%) | 0 (0.0%) |
| Educational Services | 262 (52.8%) | 234 (47.2%) |
| Health Care & Social Assistance | 143 (73.3%) | 52 (26.7%) |
| Arts, Entertainment & Recreation | 33 (30.0%) | 77 (70.0%) |
| Accommodation & Food Services | 23 (19.0%) | 98 (81.0%) |
| Public Administration | 24 (54.5%) | 20 (45.5%) |
| Total | 781 (54.2%) | 659 (45.8%) |
Education in Sewanee
School Enrollment in Sewanee
The most common levels of schooling among the 2,039 students in Sewanee are college / undergraduate (1,839 | 90.2%), graduate / professional (73 | 3.6%), and middle school (49 | 2.4%).
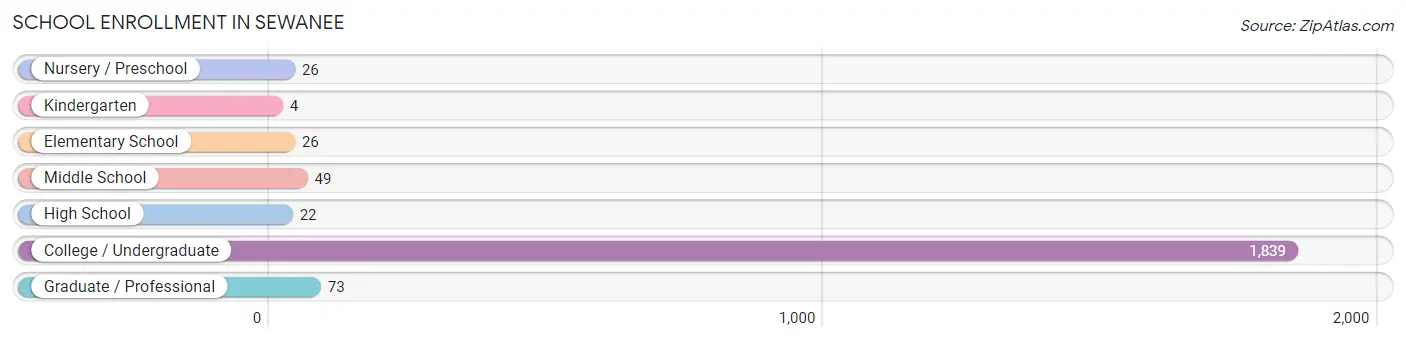
| School Level | # Students | % Students |
| Nursery / Preschool | 26 | 1.3% |
| Kindergarten | 4 | 0.2% |
| Elementary School | 26 | 1.3% |
| Middle School | 49 | 2.4% |
| High School | 22 | 1.1% |
| College / Undergraduate | 1,839 | 90.2% |
| Graduate / Professional | 73 | 3.6% |
| Total | 2,039 | 100.0% |
School Enrollment by Age by Funding Source in Sewanee
Out of a total of 2,039 students who are enrolled in schools in Sewanee, 1,870 (91.7%) attend a private institution, while the remaining 169 (8.3%) are enrolled in public schools. The age group of 3 to 4 year olds has the highest likelihood of being enrolled in private schools, with 17 (100.0% in the age bracket) enrolled. Conversely, the age group of 5 to 9 year old has the lowest likelihood of being enrolled in a private school, with 39 (100.0% in the age bracket) attending a public institution.
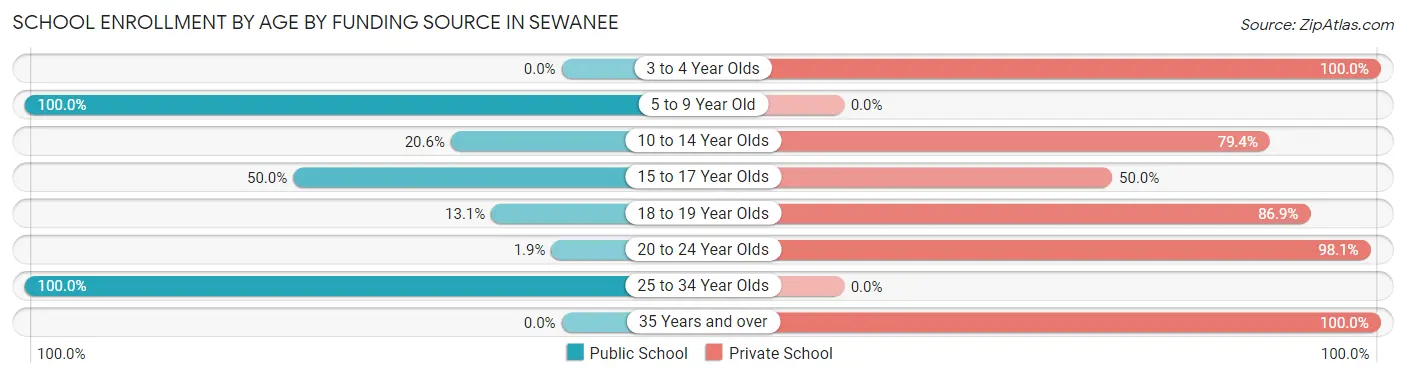
| Age Bracket | Public School | Private School |
| 3 to 4 Year Olds | 0 (0.0%) | 17 (100.0%) |
| 5 to 9 Year Old | 39 (100.0%) | 0 (0.0%) |
| 10 to 14 Year Olds | 13 (20.6%) | 50 (79.4%) |
| 15 to 17 Year Olds | 4 (50.0%) | 4 (50.0%) |
| 18 to 19 Year Olds | 72 (13.1%) | 477 (86.9%) |
| 20 to 24 Year Olds | 24 (1.9%) | 1,245 (98.1%) |
| 25 to 34 Year Olds | 17 (100.0%) | 0 (0.0%) |
| 35 Years and over | 0 (0.0%) | 77 (100.0%) |
| Total | 169 (8.3%) | 1,870 (91.7%) |
Educational Attainment by Field of Study in Sewanee
Liberal arts & history (142 | 18.8%), literature & languages (116 | 15.3%), social sciences (104 | 13.8%), bio, nature & agricultural (81 | 10.7%), and business (77 | 10.2%) are the most common fields of study among 756 individuals in Sewanee who have obtained a bachelor's degree or higher.
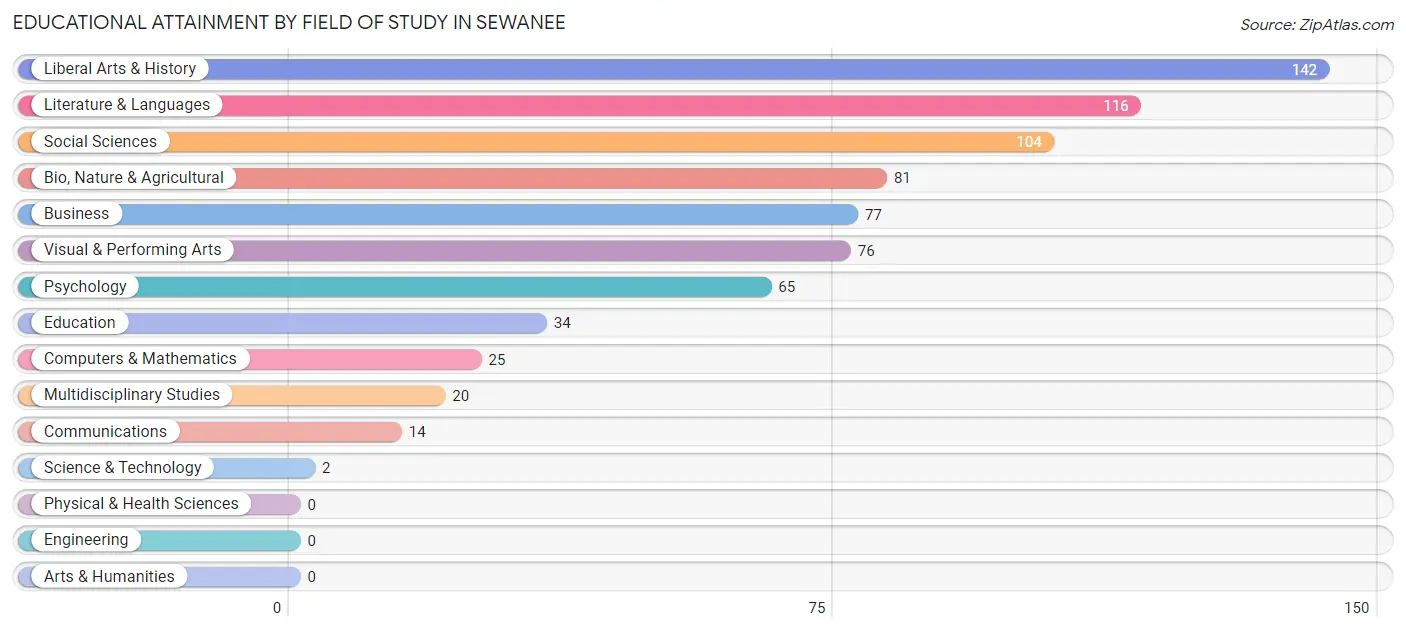
| Field of Study | # Graduates | % Graduates |
| Computers & Mathematics | 25 | 3.3% |
| Bio, Nature & Agricultural | 81 | 10.7% |
| Physical & Health Sciences | 0 | 0.0% |
| Psychology | 65 | 8.6% |
| Social Sciences | 104 | 13.8% |
| Engineering | 0 | 0.0% |
| Multidisciplinary Studies | 20 | 2.6% |
| Science & Technology | 2 | 0.3% |
| Business | 77 | 10.2% |
| Education | 34 | 4.5% |
| Literature & Languages | 116 | 15.3% |
| Liberal Arts & History | 142 | 18.8% |
| Visual & Performing Arts | 76 | 10.1% |
| Communications | 14 | 1.8% |
| Arts & Humanities | 0 | 0.0% |
| Total | 756 | 100.0% |
Transportation & Commute in Sewanee
Vehicle Availability by Sex in Sewanee
The most prevalent vehicle ownership categories in Sewanee are males with 2 vehicles (155, accounting for 47.7%) and females with 2 vehicles (104, making up 66.8%).
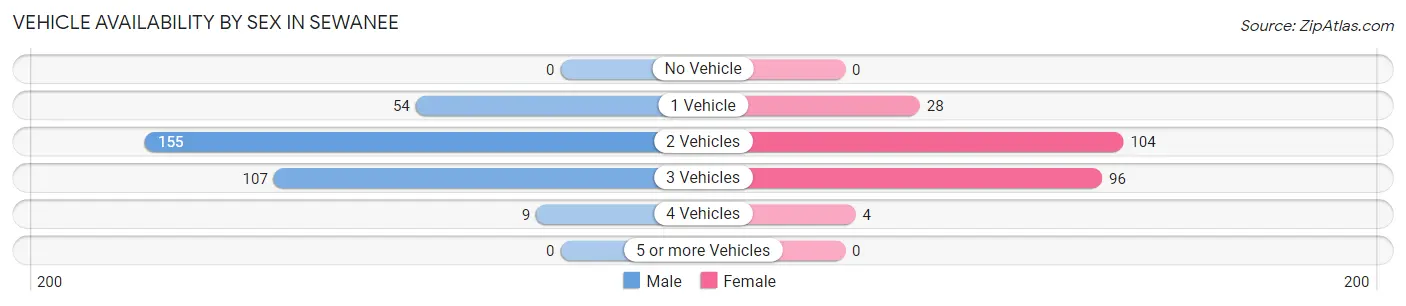
| Vehicles Available | Male | Female |
| No Vehicle | 0 (0.0%) | 0 (0.0%) |
| 1 Vehicle | 54 (16.6%) | 28 (12.1%) |
| 2 Vehicles | 155 (47.7%) | 104 (44.8%) |
| 3 Vehicles | 107 (32.9%) | 96 (41.4%) |
| 4 Vehicles | 9 (2.8%) | 4 (1.7%) |
| 5 or more Vehicles | 0 (0.0%) | 0 (0.0%) |
| Total | 325 (100.0%) | 232 (100.0%) |
Commute Time in Sewanee
The most frequently occuring commute durations in Sewanee are 5 to 9 minutes (445 commuters, 38.3%), 10 to 14 minutes (244 commuters, 21.0%), and 15 to 19 minutes (139 commuters, 12.0%).
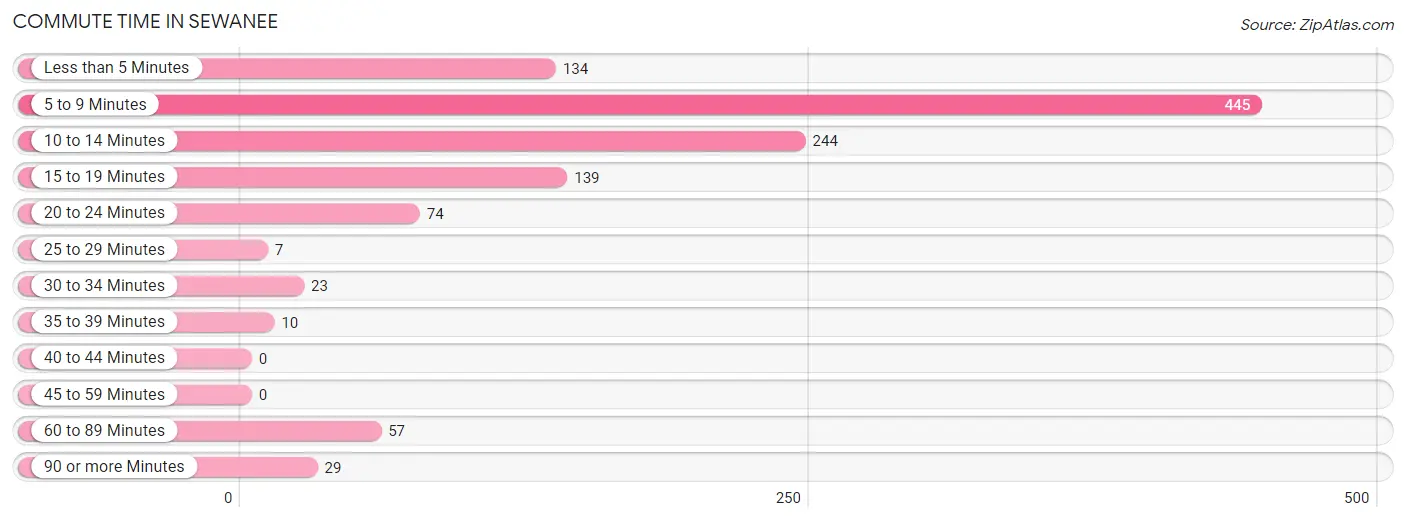
| Commute Time | # Commuters | % Commuters |
| Less than 5 Minutes | 134 | 11.5% |
| 5 to 9 Minutes | 445 | 38.3% |
| 10 to 14 Minutes | 244 | 21.0% |
| 15 to 19 Minutes | 139 | 12.0% |
| 20 to 24 Minutes | 74 | 6.4% |
| 25 to 29 Minutes | 7 | 0.6% |
| 30 to 34 Minutes | 23 | 2.0% |
| 35 to 39 Minutes | 10 | 0.9% |
| 40 to 44 Minutes | 0 | 0.0% |
| 45 to 59 Minutes | 0 | 0.0% |
| 60 to 89 Minutes | 57 | 4.9% |
| 90 or more Minutes | 29 | 2.5% |
Commute Time by Sex in Sewanee
The most common commute times in Sewanee are 5 to 9 minutes (255 commuters, 36.5%) for males and 5 to 9 minutes (190 commuters, 41.0%) for females.
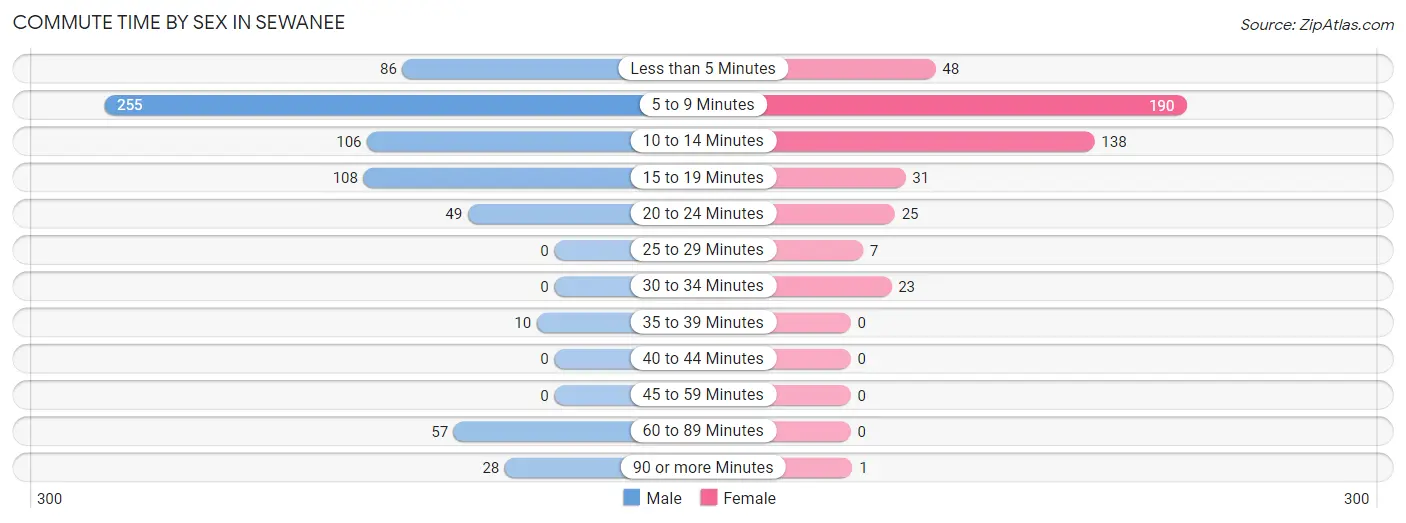
| Commute Time | Male | Female |
| Less than 5 Minutes | 86 (12.3%) | 48 (10.4%) |
| 5 to 9 Minutes | 255 (36.5%) | 190 (41.0%) |
| 10 to 14 Minutes | 106 (15.2%) | 138 (29.8%) |
| 15 to 19 Minutes | 108 (15.4%) | 31 (6.7%) |
| 20 to 24 Minutes | 49 (7.0%) | 25 (5.4%) |
| 25 to 29 Minutes | 0 (0.0%) | 7 (1.5%) |
| 30 to 34 Minutes | 0 (0.0%) | 23 (5.0%) |
| 35 to 39 Minutes | 10 (1.4%) | 0 (0.0%) |
| 40 to 44 Minutes | 0 (0.0%) | 0 (0.0%) |
| 45 to 59 Minutes | 0 (0.0%) | 0 (0.0%) |
| 60 to 89 Minutes | 57 (8.2%) | 0 (0.0%) |
| 90 or more Minutes | 28 (4.0%) | 1 (0.2%) |
Time of Departure to Work by Sex in Sewanee
The most frequent times of departure to work in Sewanee are 12:00 PM to 3:59 PM (199, 28.5%) for males and 12:00 PM to 3:59 PM (100, 21.6%) for females.
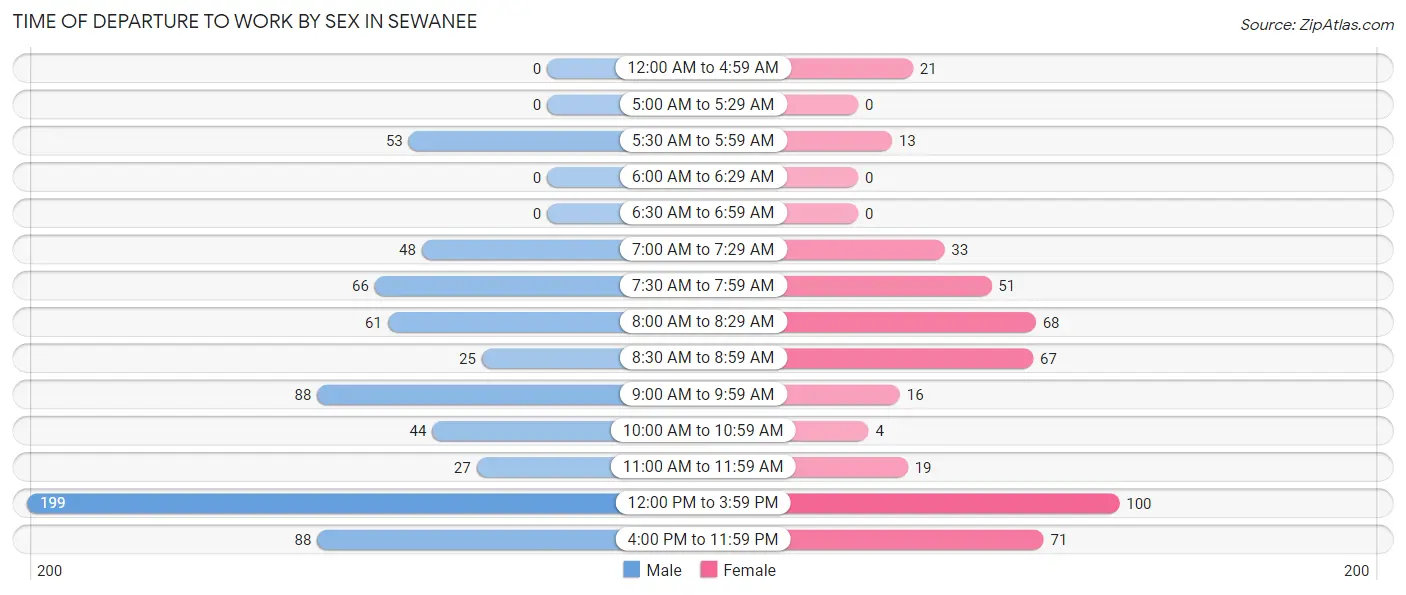
| Time of Departure | Male | Female |
| 12:00 AM to 4:59 AM | 0 (0.0%) | 21 (4.5%) |
| 5:00 AM to 5:29 AM | 0 (0.0%) | 0 (0.0%) |
| 5:30 AM to 5:59 AM | 53 (7.6%) | 13 (2.8%) |
| 6:00 AM to 6:29 AM | 0 (0.0%) | 0 (0.0%) |
| 6:30 AM to 6:59 AM | 0 (0.0%) | 0 (0.0%) |
| 7:00 AM to 7:29 AM | 48 (6.9%) | 33 (7.1%) |
| 7:30 AM to 7:59 AM | 66 (9.4%) | 51 (11.0%) |
| 8:00 AM to 8:29 AM | 61 (8.7%) | 68 (14.7%) |
| 8:30 AM to 8:59 AM | 25 (3.6%) | 67 (14.5%) |
| 9:00 AM to 9:59 AM | 88 (12.6%) | 16 (3.5%) |
| 10:00 AM to 10:59 AM | 44 (6.3%) | 4 (0.9%) |
| 11:00 AM to 11:59 AM | 27 (3.9%) | 19 (4.1%) |
| 12:00 PM to 3:59 PM | 199 (28.5%) | 100 (21.6%) |
| 4:00 PM to 11:59 PM | 88 (12.6%) | 71 (15.3%) |
| Total | 699 (100.0%) | 463 (100.0%) |
Housing Occupancy in Sewanee
Occupancy by Ownership in Sewanee
Of the total 528 dwellings in Sewanee, owner-occupied units account for 424 (80.3%), while renter-occupied units make up 104 (19.7%).
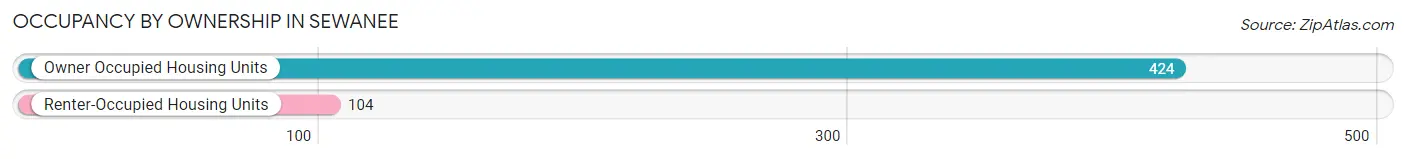
| Occupancy | # Housing Units | % Housing Units |
| Owner Occupied Housing Units | 424 | 80.3% |
| Renter-Occupied Housing Units | 104 | 19.7% |
| Total Occupied Housing Units | 528 | 100.0% |
Occupancy by Household Size in Sewanee
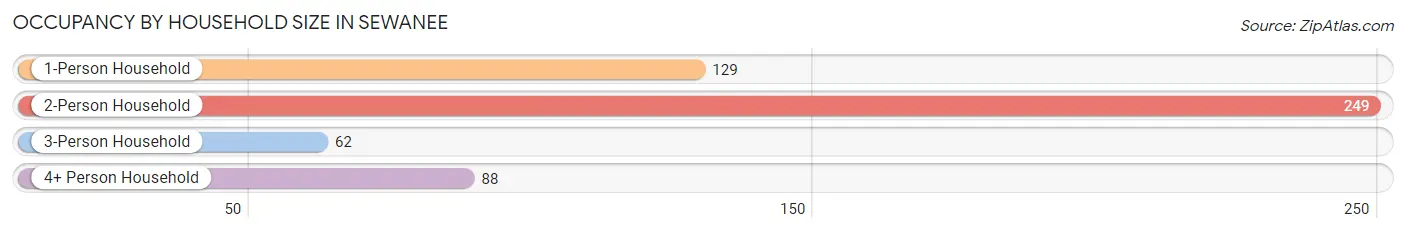
| Household Size | # Housing Units | % Housing Units |
| 1-Person Household | 129 | 24.4% |
| 2-Person Household | 249 | 47.2% |
| 3-Person Household | 62 | 11.7% |
| 4+ Person Household | 88 | 16.7% |
| Total Housing Units | 528 | 100.0% |
Occupancy by Ownership by Household Size in Sewanee
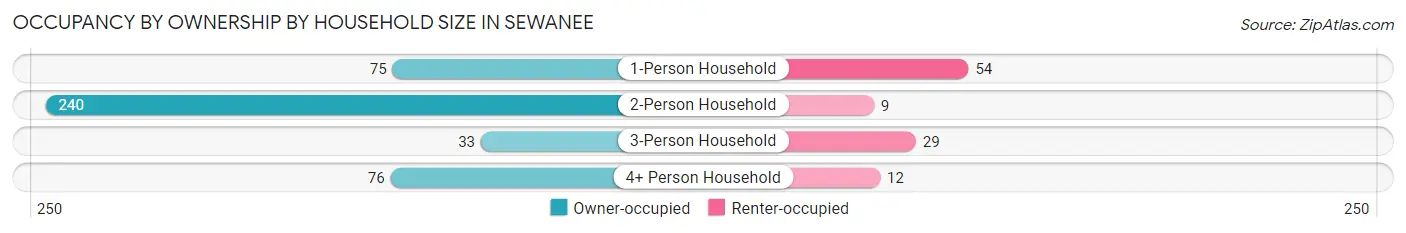
| Household Size | Owner-occupied | Renter-occupied |
| 1-Person Household | 75 (58.1%) | 54 (41.9%) |
| 2-Person Household | 240 (96.4%) | 9 (3.6%) |
| 3-Person Household | 33 (53.2%) | 29 (46.8%) |
| 4+ Person Household | 76 (86.4%) | 12 (13.6%) |
| Total Housing Units | 424 (80.3%) | 104 (19.7%) |
Occupancy by Educational Attainment in Sewanee
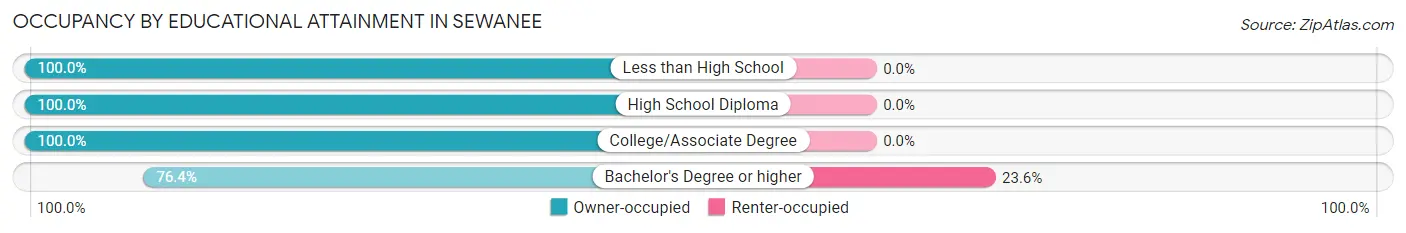
| Household Size | Owner-occupied | Renter-occupied |
| Less than High School | 27 (100.0%) | 0 (0.0%) |
| High School Diploma | 36 (100.0%) | 0 (0.0%) |
| College/Associate Degree | 24 (100.0%) | 0 (0.0%) |
| Bachelor's Degree or higher | 337 (76.4%) | 104 (23.6%) |
Occupancy by Age of Householder in Sewanee
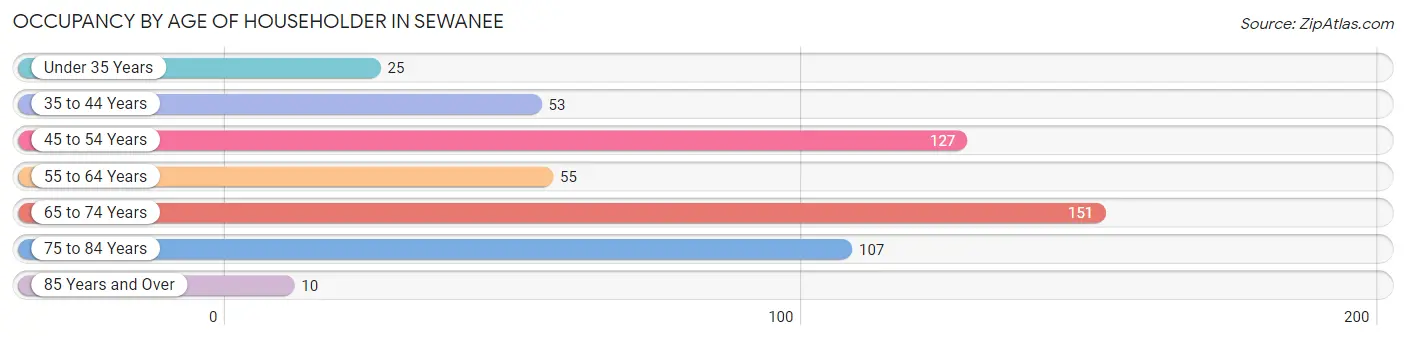
| Age Bracket | # Households | % Households |
| Under 35 Years | 25 | 4.7% |
| 35 to 44 Years | 53 | 10.0% |
| 45 to 54 Years | 127 | 24.0% |
| 55 to 64 Years | 55 | 10.4% |
| 65 to 74 Years | 151 | 28.6% |
| 75 to 84 Years | 107 | 20.3% |
| 85 Years and Over | 10 | 1.9% |
| Total | 528 | 100.0% |
Housing Finances in Sewanee
Median Income by Occupancy in Sewanee
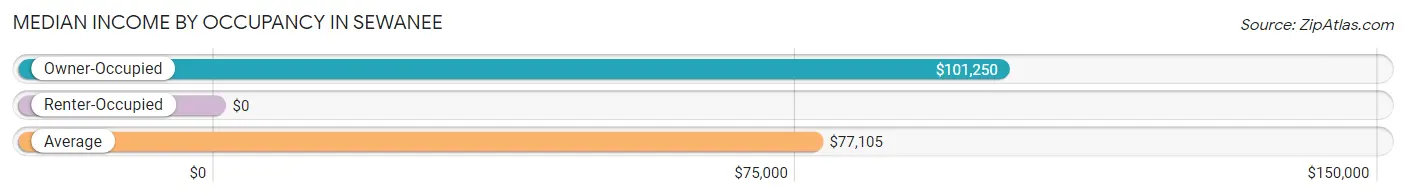
| Occupancy Type | # Households | Median Income |
| Owner-Occupied | 424 (80.3%) | $101,250 |
| Renter-Occupied | 104 (19.7%) | $0 |
| Average | 528 (100.0%) | $77,105 |
Occupancy by Householder Income Bracket in Sewanee
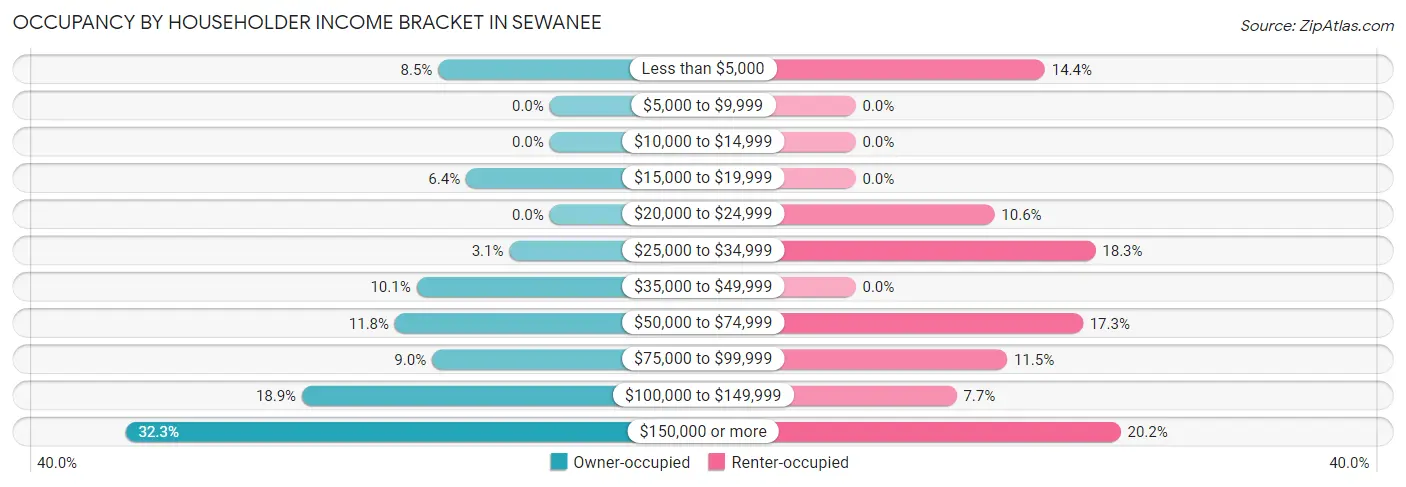
| Income Bracket | Owner-occupied | Renter-occupied |
| Less than $5,000 | 36 (8.5%) | 15 (14.4%) |
| $5,000 to $9,999 | 0 (0.0%) | 0 (0.0%) |
| $10,000 to $14,999 | 0 (0.0%) | 0 (0.0%) |
| $15,000 to $19,999 | 27 (6.4%) | 0 (0.0%) |
| $20,000 to $24,999 | 0 (0.0%) | 11 (10.6%) |
| $25,000 to $34,999 | 13 (3.1%) | 19 (18.3%) |
| $35,000 to $49,999 | 43 (10.1%) | 0 (0.0%) |
| $50,000 to $74,999 | 50 (11.8%) | 18 (17.3%) |
| $75,000 to $99,999 | 38 (9.0%) | 12 (11.5%) |
| $100,000 to $149,999 | 80 (18.9%) | 8 (7.7%) |
| $150,000 or more | 137 (32.3%) | 21 (20.2%) |
| Total | 424 (100.0%) | 104 (100.0%) |
Monthly Housing Cost Tiers in Sewanee
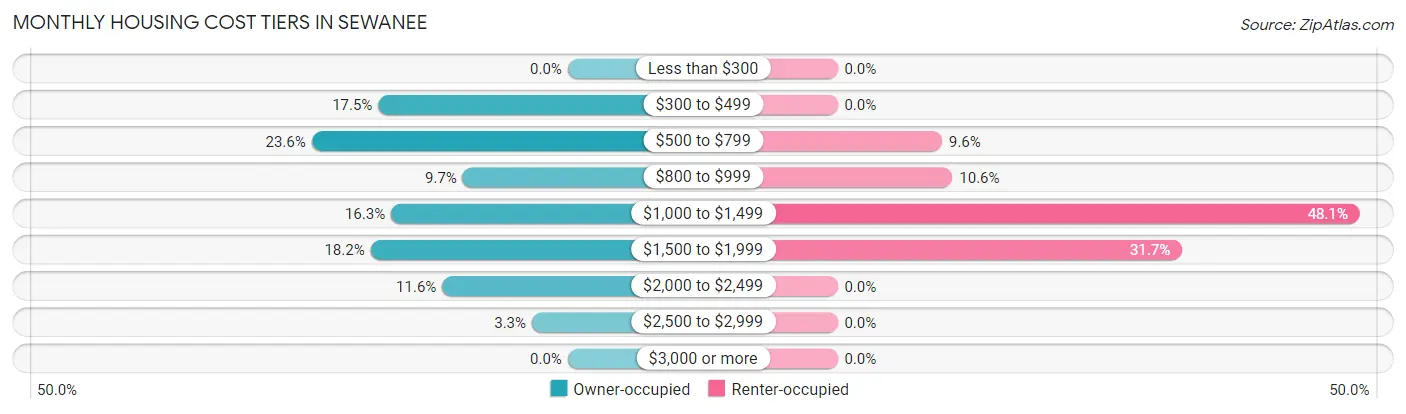
| Monthly Cost | Owner-occupied | Renter-occupied |
| Less than $300 | 0 (0.0%) | 0 (0.0%) |
| $300 to $499 | 74 (17.4%) | 0 (0.0%) |
| $500 to $799 | 100 (23.6%) | 10 (9.6%) |
| $800 to $999 | 41 (9.7%) | 11 (10.6%) |
| $1,000 to $1,499 | 69 (16.3%) | 50 (48.1%) |
| $1,500 to $1,999 | 77 (18.2%) | 33 (31.7%) |
| $2,000 to $2,499 | 49 (11.6%) | 0 (0.0%) |
| $2,500 to $2,999 | 14 (3.3%) | 0 (0.0%) |
| $3,000 or more | 0 (0.0%) | 0 (0.0%) |
| Total | 424 (100.0%) | 104 (100.0%) |
Physical Housing Characteristics in Sewanee
Housing Structures in Sewanee
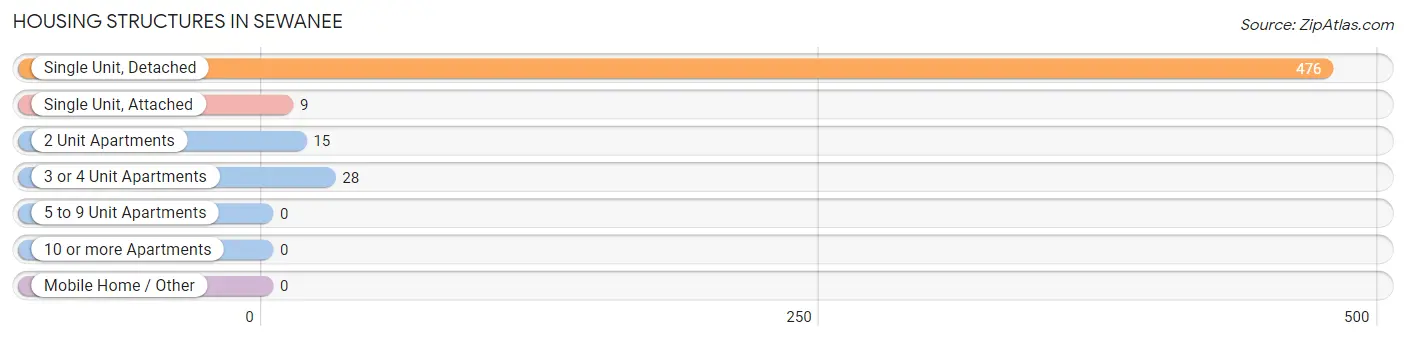
| Structure Type | # Housing Units | % Housing Units |
| Single Unit, Detached | 476 | 90.1% |
| Single Unit, Attached | 9 | 1.7% |
| 2 Unit Apartments | 15 | 2.8% |
| 3 or 4 Unit Apartments | 28 | 5.3% |
| 5 to 9 Unit Apartments | 0 | 0.0% |
| 10 or more Apartments | 0 | 0.0% |
| Mobile Home / Other | 0 | 0.0% |
| Total | 528 | 100.0% |
Housing Structures by Occupancy in Sewanee
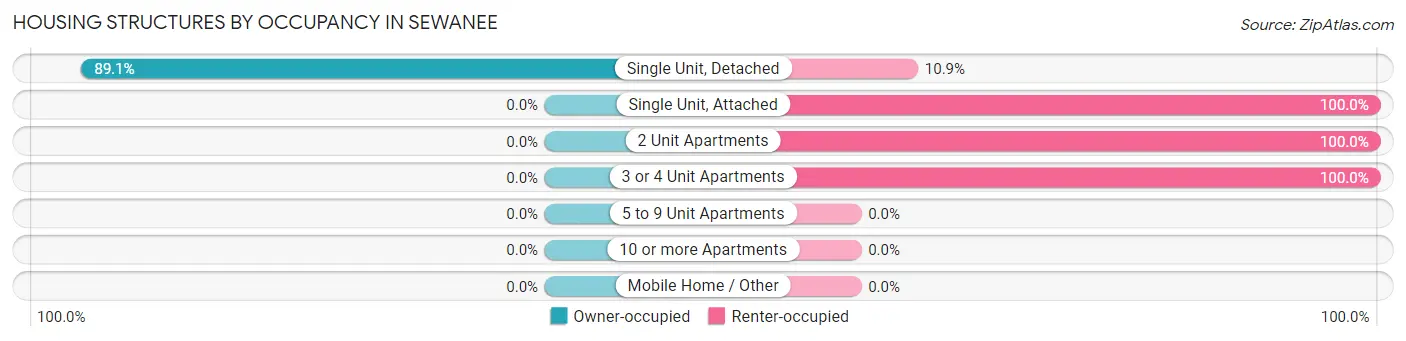
| Structure Type | Owner-occupied | Renter-occupied |
| Single Unit, Detached | 424 (89.1%) | 52 (10.9%) |
| Single Unit, Attached | 0 (0.0%) | 9 (100.0%) |
| 2 Unit Apartments | 0 (0.0%) | 15 (100.0%) |
| 3 or 4 Unit Apartments | 0 (0.0%) | 28 (100.0%) |
| 5 to 9 Unit Apartments | 0 (0.0%) | 0 (0.0%) |
| 10 or more Apartments | 0 (0.0%) | 0 (0.0%) |
| Mobile Home / Other | 0 (0.0%) | 0 (0.0%) |
| Total | 424 (80.3%) | 104 (19.7%) |
Housing Structures by Number of Rooms in Sewanee
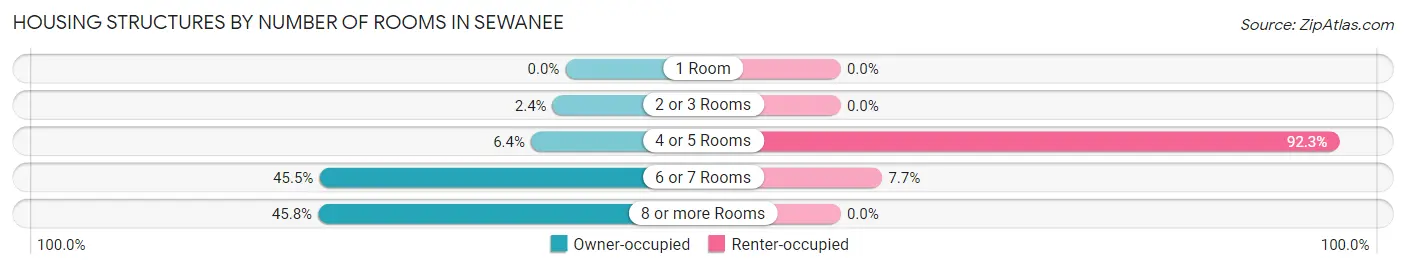
| Number of Rooms | Owner-occupied | Renter-occupied |
| 1 Room | 0 (0.0%) | 0 (0.0%) |
| 2 or 3 Rooms | 10 (2.4%) | 0 (0.0%) |
| 4 or 5 Rooms | 27 (6.4%) | 96 (92.3%) |
| 6 or 7 Rooms | 193 (45.5%) | 8 (7.7%) |
| 8 or more Rooms | 194 (45.8%) | 0 (0.0%) |
| Total | 424 (100.0%) | 104 (100.0%) |
Housing Structure by Heating Type in Sewanee
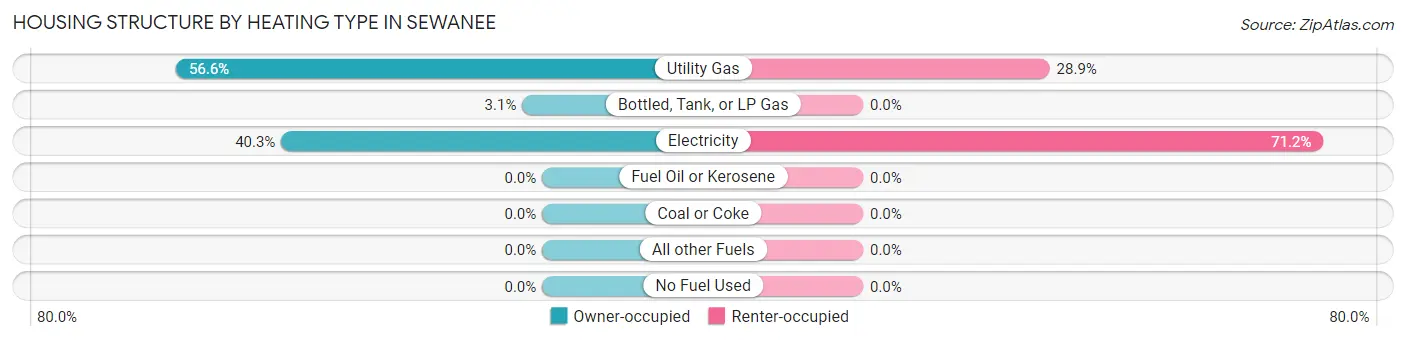
| Heating Type | Owner-occupied | Renter-occupied |
| Utility Gas | 240 (56.6%) | 30 (28.8%) |
| Bottled, Tank, or LP Gas | 13 (3.1%) | 0 (0.0%) |
| Electricity | 171 (40.3%) | 74 (71.2%) |
| Fuel Oil or Kerosene | 0 (0.0%) | 0 (0.0%) |
| Coal or Coke | 0 (0.0%) | 0 (0.0%) |
| All other Fuels | 0 (0.0%) | 0 (0.0%) |
| No Fuel Used | 0 (0.0%) | 0 (0.0%) |
| Total | 424 (100.0%) | 104 (100.0%) |
Household Vehicle Usage in Sewanee
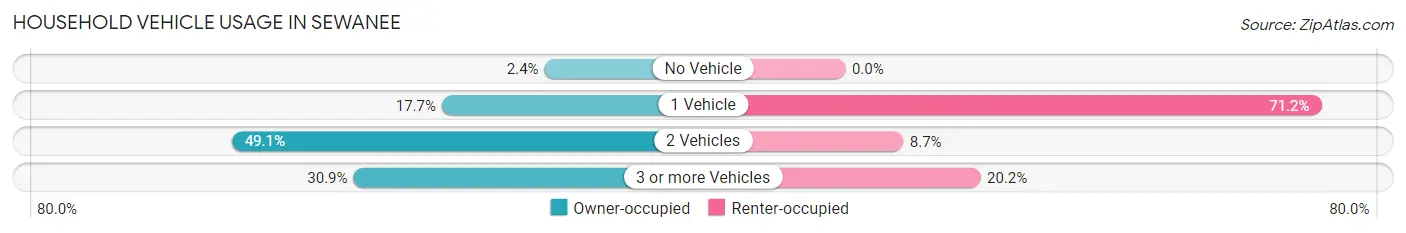
| Vehicles per Household | Owner-occupied | Renter-occupied |
| No Vehicle | 10 (2.4%) | 0 (0.0%) |
| 1 Vehicle | 75 (17.7%) | 74 (71.2%) |
| 2 Vehicles | 208 (49.1%) | 9 (8.6%) |
| 3 or more Vehicles | 131 (30.9%) | 21 (20.2%) |
| Total | 424 (100.0%) | 104 (100.0%) |
Real Estate & Mortgages in Sewanee
Real Estate and Mortgage Overview in Sewanee
| Characteristic | Without Mortgage | With Mortgage |
| Housing Units | 282 | 142 |
| Median Property Value | $357,100 | $309,100 |
| Median Household Income | $108,750 | $55 |
| Monthly Housing Costs | $661 | $0 |
| Real Estate Taxes | $1,662 | $0 |
Property Value by Mortgage Status in Sewanee
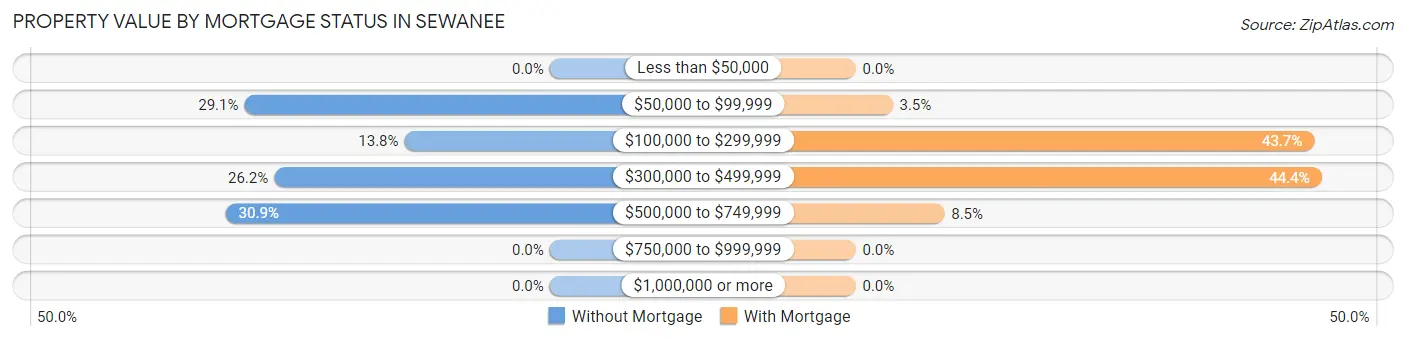
| Property Value | Without Mortgage | With Mortgage |
| Less than $50,000 | 0 (0.0%) | 0 (0.0%) |
| $50,000 to $99,999 | 82 (29.1%) | 5 (3.5%) |
| $100,000 to $299,999 | 39 (13.8%) | 62 (43.7%) |
| $300,000 to $499,999 | 74 (26.2%) | 63 (44.4%) |
| $500,000 to $749,999 | 87 (30.8%) | 12 (8.5%) |
| $750,000 to $999,999 | 0 (0.0%) | 0 (0.0%) |
| $1,000,000 or more | 0 (0.0%) | 0 (0.0%) |
| Total | 282 (100.0%) | 142 (100.0%) |
Household Income by Mortgage Status in Sewanee
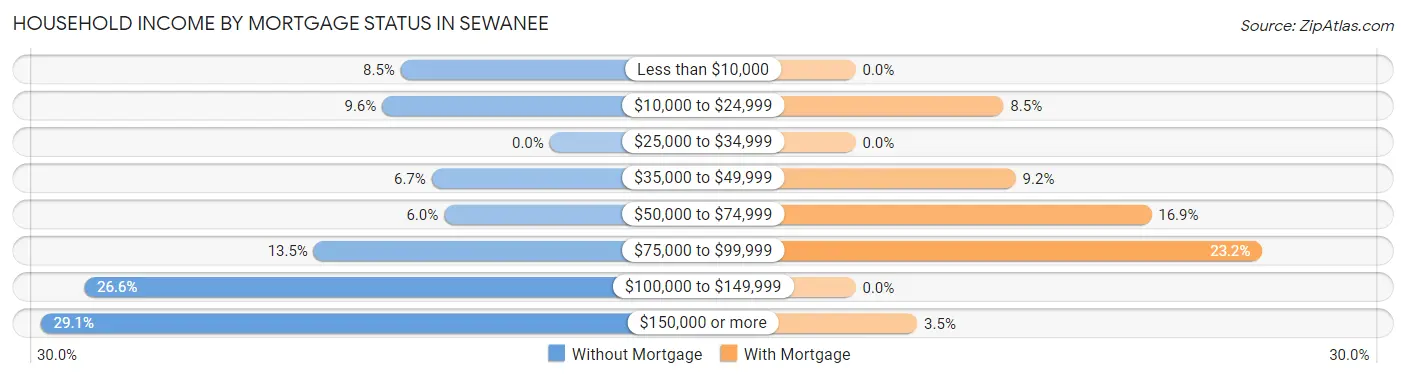
| Household Income | Without Mortgage | With Mortgage |
| Less than $10,000 | 24 (8.5%) | 0 (0.0%) |
| $10,000 to $24,999 | 27 (9.6%) | 12 (8.5%) |
| $25,000 to $34,999 | 0 (0.0%) | 0 (0.0%) |
| $35,000 to $49,999 | 19 (6.7%) | 13 (9.1%) |
| $50,000 to $74,999 | 17 (6.0%) | 24 (16.9%) |
| $75,000 to $99,999 | 38 (13.5%) | 33 (23.2%) |
| $100,000 to $149,999 | 75 (26.6%) | 0 (0.0%) |
| $150,000 or more | 82 (29.1%) | 5 (3.5%) |
| Total | 282 (100.0%) | 142 (100.0%) |
Property Value to Household Income Ratio in Sewanee
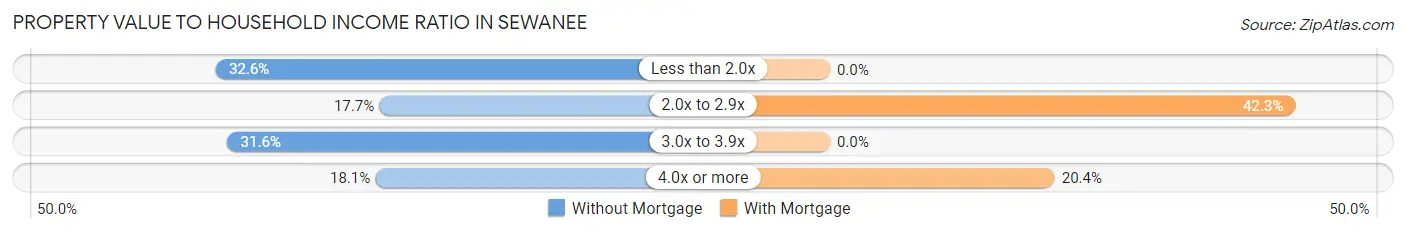
| Value-to-Income Ratio | Without Mortgage | With Mortgage |
| Less than 2.0x | 92 (32.6%) | 0 (0.0%) |
| 2.0x to 2.9x | 50 (17.7%) | 60 (42.2%) |
| 3.0x to 3.9x | 89 (31.6%) | 0 (0.0%) |
| 4.0x or more | 51 (18.1%) | 29 (20.4%) |
| Total | 282 (100.0%) | 142 (100.0%) |
Real Estate Taxes by Mortgage Status in Sewanee
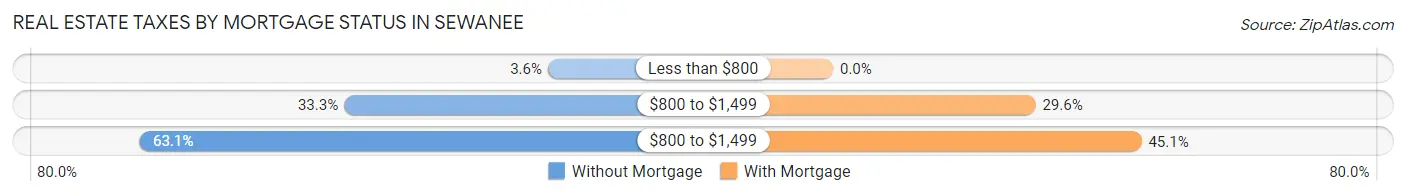
| Property Taxes | Without Mortgage | With Mortgage |
| Less than $800 | 10 (3.5%) | 0 (0.0%) |
| $800 to $1,499 | 94 (33.3%) | 42 (29.6%) |
| $800 to $1,499 | 178 (63.1%) | 64 (45.1%) |
| Total | 282 (100.0%) | 142 (100.0%) |
Health & Disability in Sewanee
Health Insurance Coverage by Age in Sewanee
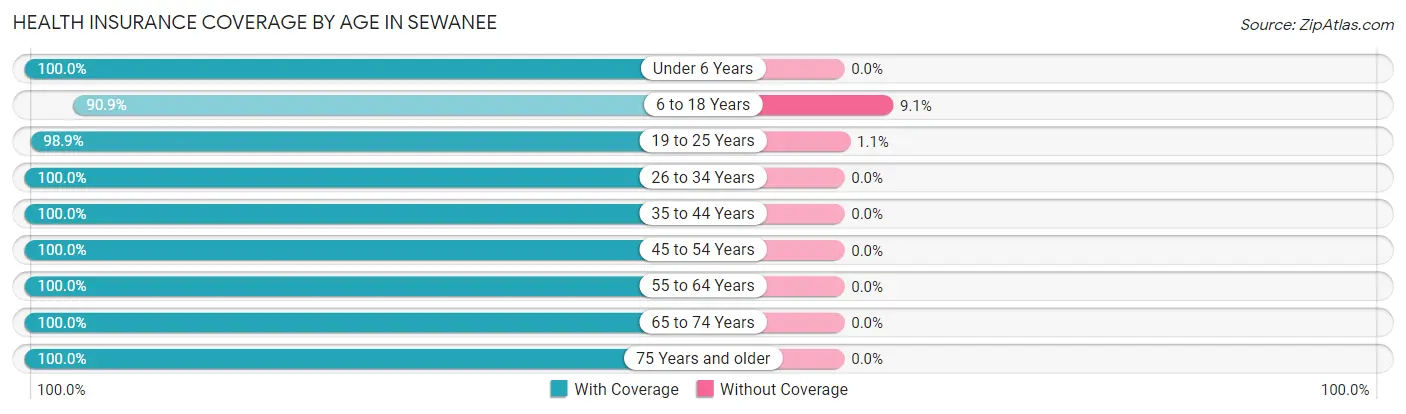
| Age Bracket | With Coverage | Without Coverage |
| Under 6 Years | 70 (100.0%) | 0 (0.0%) |
| 6 to 18 Years | 150 (90.9%) | 15 (9.1%) |
| 19 to 25 Years | 1,747 (98.9%) | 19 (1.1%) |
| 26 to 34 Years | 41 (100.0%) | 0 (0.0%) |
| 35 to 44 Years | 88 (100.0%) | 0 (0.0%) |
| 45 to 54 Years | 184 (100.0%) | 0 (0.0%) |
| 55 to 64 Years | 176 (100.0%) | 0 (0.0%) |
| 65 to 74 Years | 229 (100.0%) | 0 (0.0%) |
| 75 Years and older | 196 (100.0%) | 0 (0.0%) |
| Total | 2,881 (98.8%) | 34 (1.2%) |
Health Insurance Coverage by Citizenship Status in Sewanee
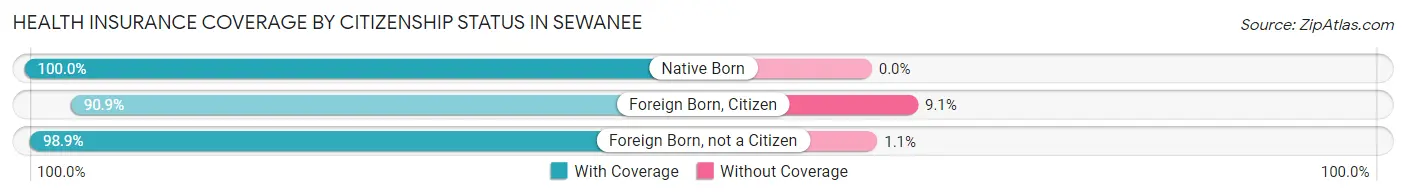
| Citizenship Status | With Coverage | Without Coverage |
| Native Born | 70 (100.0%) | 0 (0.0%) |
| Foreign Born, Citizen | 150 (90.9%) | 15 (9.1%) |
| Foreign Born, not a Citizen | 1,747 (98.9%) | 19 (1.1%) |
Health Insurance Coverage by Household Income in Sewanee
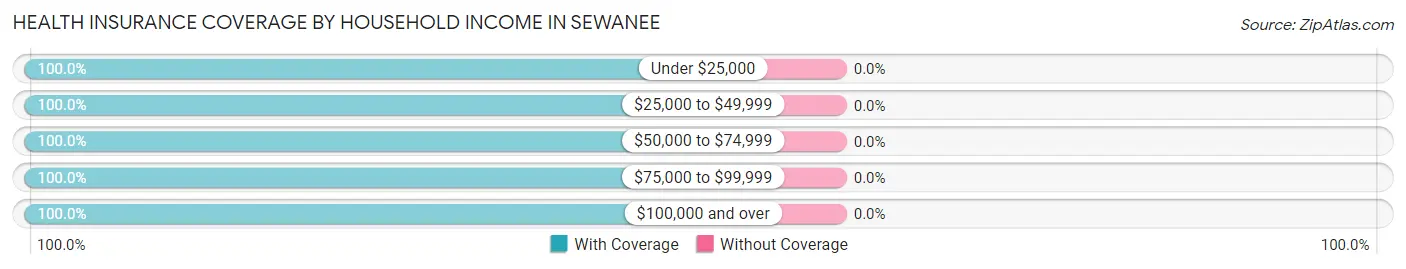
| Household Income | With Coverage | Without Coverage |
| Under $25,000 | 144 (100.0%) | 0 (0.0%) |
| $25,000 to $49,999 | 116 (100.0%) | 0 (0.0%) |
| $50,000 to $74,999 | 140 (100.0%) | 0 (0.0%) |
| $75,000 to $99,999 | 114 (100.0%) | 0 (0.0%) |
| $100,000 and over | 604 (100.0%) | 0 (0.0%) |
Public vs Private Health Insurance Coverage by Age in Sewanee
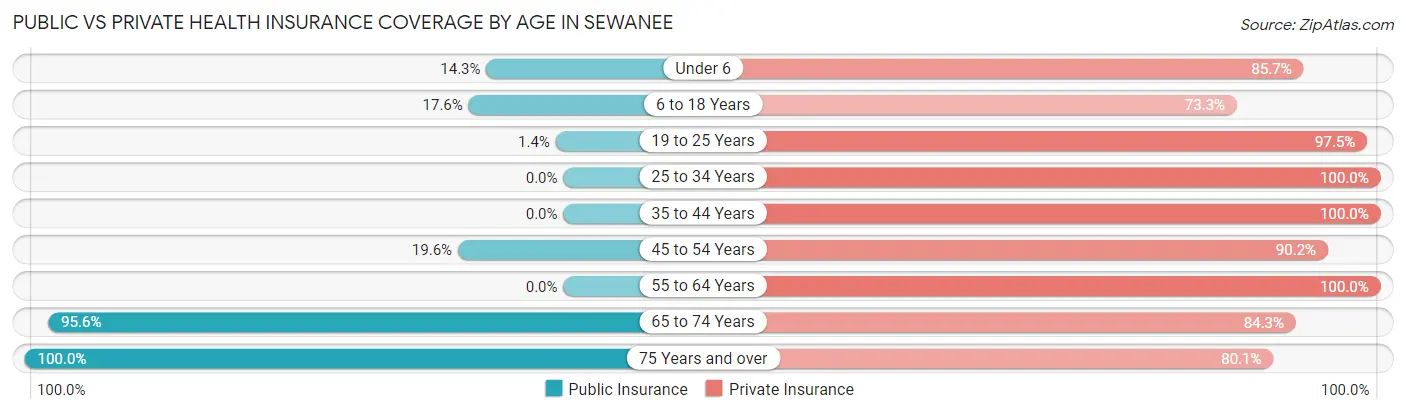
| Age Bracket | Public Insurance | Private Insurance |
| Under 6 | 10 (14.3%) | 60 (85.7%) |
| 6 to 18 Years | 29 (17.6%) | 121 (73.3%) |
| 19 to 25 Years | 25 (1.4%) | 1,722 (97.5%) |
| 25 to 34 Years | 0 (0.0%) | 41 (100.0%) |
| 35 to 44 Years | 0 (0.0%) | 88 (100.0%) |
| 45 to 54 Years | 36 (19.6%) | 166 (90.2%) |
| 55 to 64 Years | 0 (0.0%) | 176 (100.0%) |
| 65 to 74 Years | 219 (95.6%) | 193 (84.3%) |
| 75 Years and over | 196 (100.0%) | 157 (80.1%) |
| Total | 515 (17.7%) | 2,724 (93.4%) |
Disability Status by Sex by Age in Sewanee
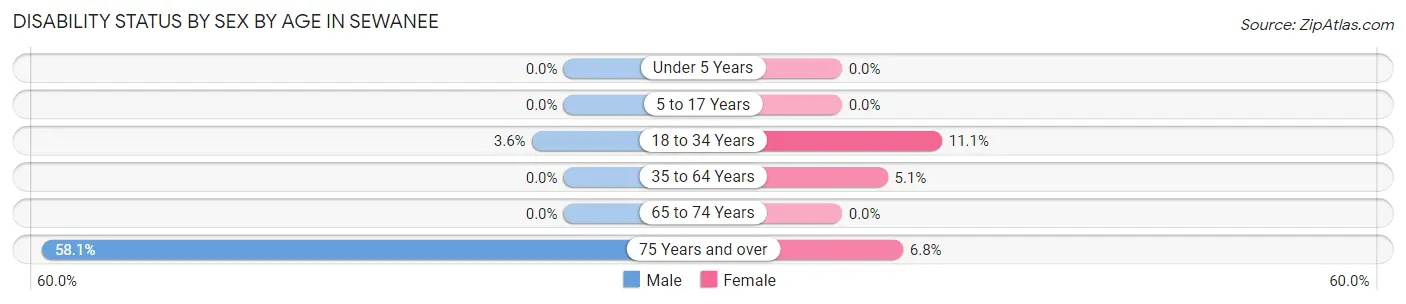
| Age Bracket | Male | Female |
| Under 5 Years | 0 (0.0%) | 0 (0.0%) |
| 5 to 17 Years | 0 (0.0%) | 0 (0.0%) |
| 18 to 34 Years | 29 (3.5%) | 118 (11.1%) |
| 35 to 64 Years | 0 (0.0%) | 10 (5.1%) |
| 65 to 74 Years | 0 (0.0%) | 0 (0.0%) |
| 75 Years and over | 54 (58.1%) | 7 (6.8%) |
Disability Class by Sex by Age in Sewanee
Disability Class: Hearing Difficulty
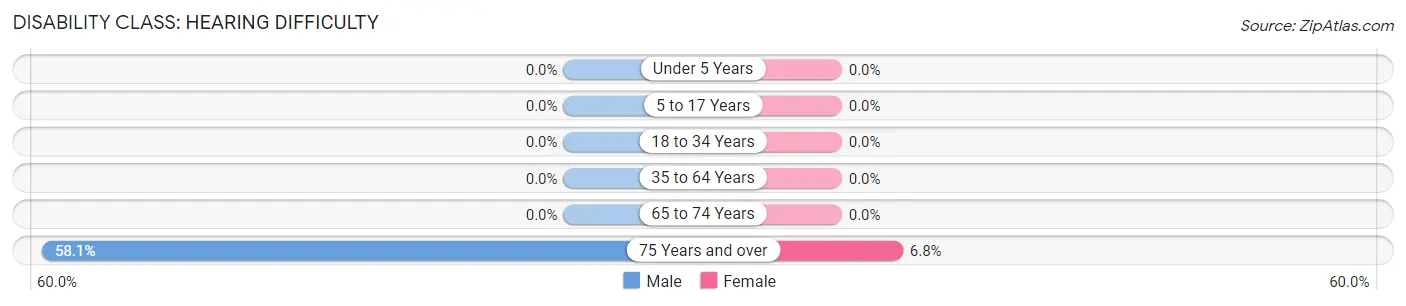
| Age Bracket | Male | Female |
| Under 5 Years | 0 (0.0%) | 0 (0.0%) |
| 5 to 17 Years | 0 (0.0%) | 0 (0.0%) |
| 18 to 34 Years | 0 (0.0%) | 0 (0.0%) |
| 35 to 64 Years | 0 (0.0%) | 0 (0.0%) |
| 65 to 74 Years | 0 (0.0%) | 0 (0.0%) |
| 75 Years and over | 54 (58.1%) | 7 (6.8%) |
Disability Class: Vision Difficulty
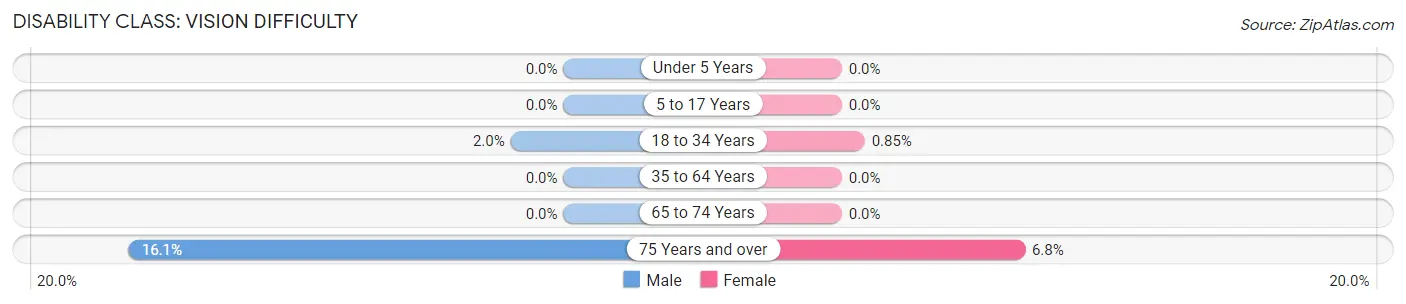
| Age Bracket | Male | Female |
| Under 5 Years | 0 (0.0%) | 0 (0.0%) |
| 5 to 17 Years | 0 (0.0%) | 0 (0.0%) |
| 18 to 34 Years | 16 (2.0%) | 9 (0.9%) |
| 35 to 64 Years | 0 (0.0%) | 0 (0.0%) |
| 65 to 74 Years | 0 (0.0%) | 0 (0.0%) |
| 75 Years and over | 15 (16.1%) | 7 (6.8%) |
Disability Class: Cognitive Difficulty
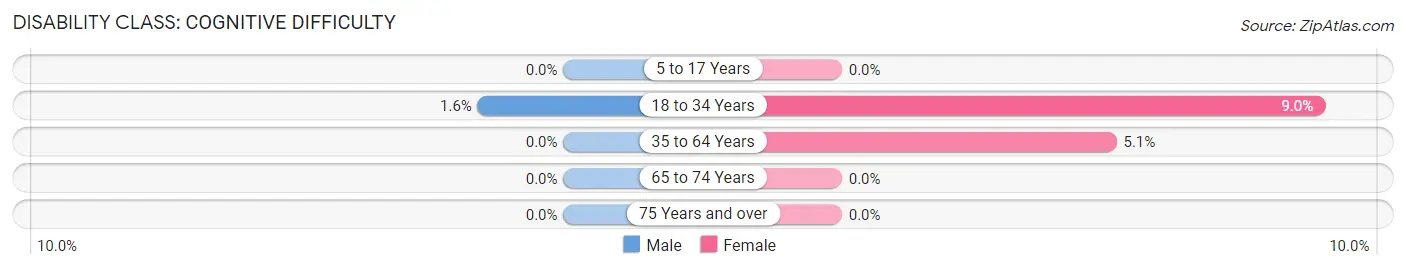
| Age Bracket | Male | Female |
| 5 to 17 Years | 0 (0.0%) | 0 (0.0%) |
| 18 to 34 Years | 13 (1.6%) | 95 (9.0%) |
| 35 to 64 Years | 0 (0.0%) | 10 (5.1%) |
| 65 to 74 Years | 0 (0.0%) | 0 (0.0%) |
| 75 Years and over | 0 (0.0%) | 0 (0.0%) |
Disability Class: Ambulatory Difficulty
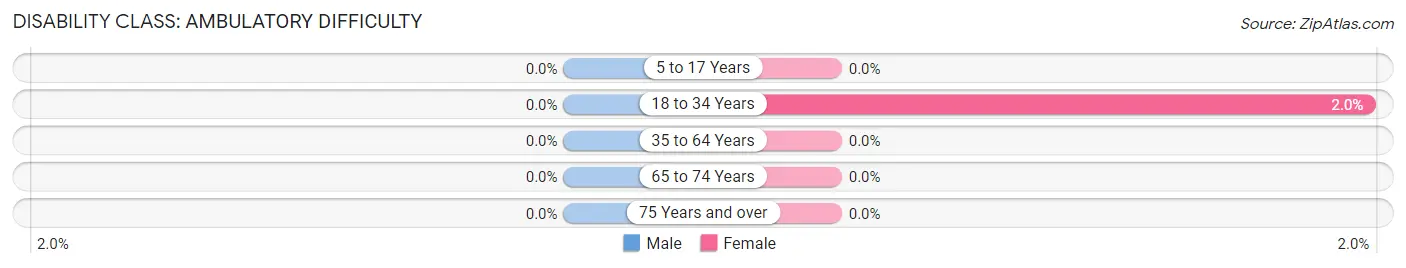
| Age Bracket | Male | Female |
| 5 to 17 Years | 0 (0.0%) | 0 (0.0%) |
| 18 to 34 Years | 0 (0.0%) | 21 (2.0%) |
| 35 to 64 Years | 0 (0.0%) | 0 (0.0%) |
| 65 to 74 Years | 0 (0.0%) | 0 (0.0%) |
| 75 Years and over | 0 (0.0%) | 0 (0.0%) |
Disability Class: Self-Care Difficulty
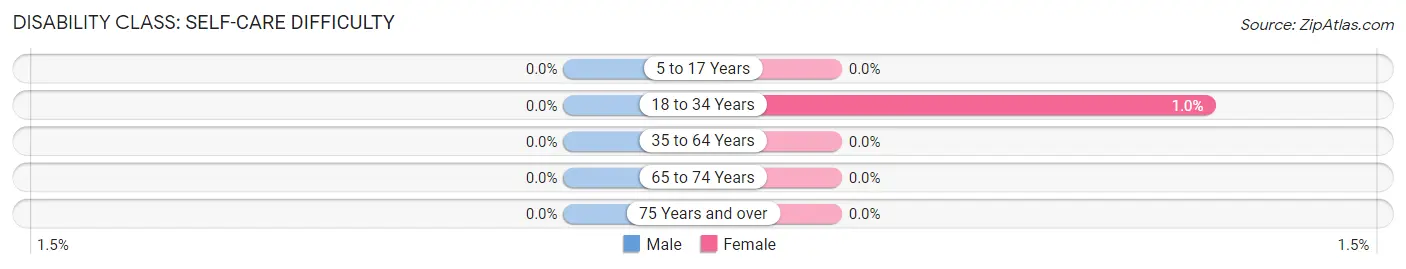
| Age Bracket | Male | Female |
| 5 to 17 Years | 0 (0.0%) | 0 (0.0%) |
| 18 to 34 Years | 0 (0.0%) | 11 (1.0%) |
| 35 to 64 Years | 0 (0.0%) | 0 (0.0%) |
| 65 to 74 Years | 0 (0.0%) | 0 (0.0%) |
| 75 Years and over | 0 (0.0%) | 0 (0.0%) |
Technology Access in Sewanee
Computing Device Access in Sewanee
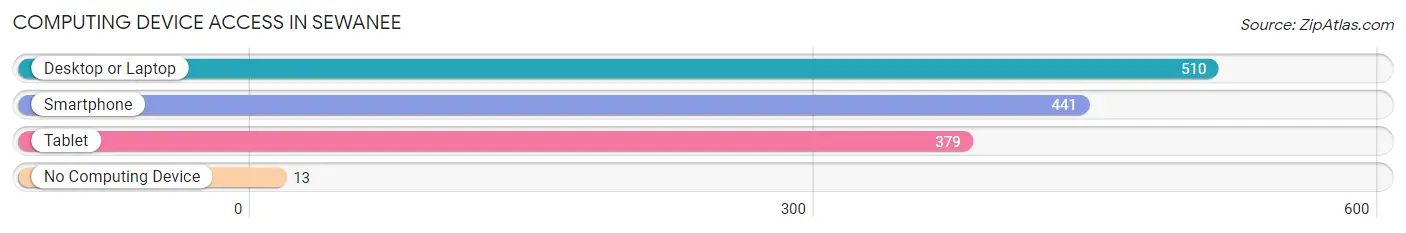
| Device Type | # Households | % Households |
| Desktop or Laptop | 510 | 96.6% |
| Smartphone | 441 | 83.5% |
| Tablet | 379 | 71.8% |
| No Computing Device | 13 | 2.5% |
| Total | 528 | 100.0% |
Internet Access in Sewanee
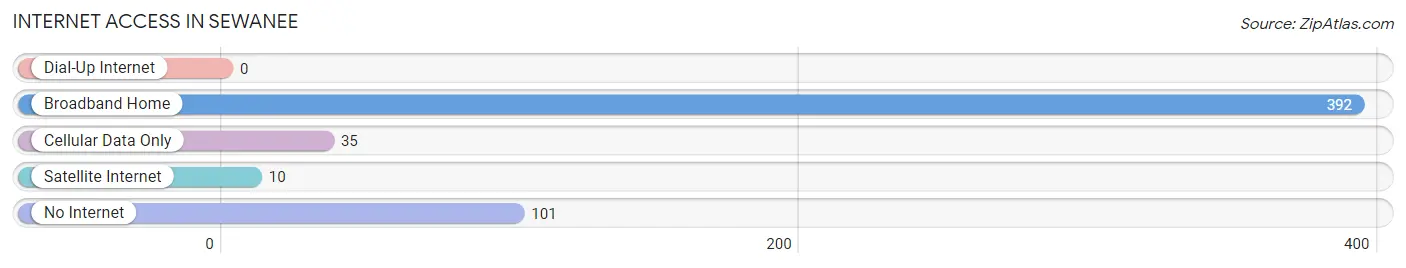
| Internet Type | # Households | % Households |
| Dial-Up Internet | 0 | 0.0% |
| Broadband Home | 392 | 74.2% |
| Cellular Data Only | 35 | 6.6% |
| Satellite Internet | 10 | 1.9% |
| No Internet | 101 | 19.1% |
| Total | 528 | 100.0% |
Sewanee Summary
Sewanee, Tennessee is a small town located in Franklin County, Tennessee. It is situated in the foothills of the Cumberland Plateau and is home to the University of the South, also known as Sewanee. The town is known for its picturesque views, its historic buildings, and its vibrant culture.
History
Sewanee was founded in 1857 by the Episcopal Diocese of Tennessee. The town was named after Bishop Leonidas Polk, who was the first Bishop of the Episcopal Diocese of Tennessee. The town was originally intended to be a college town, and the University of the South was founded in 1857. The university was founded with the intention of providing a liberal arts education to students from all over the South.
The town of Sewanee was officially incorporated in 1858. During the Civil War, the town was occupied by Union forces and the university was used as a hospital. After the war, the town and university were rebuilt and the town began to grow. In the late 19th century, the town became a popular tourist destination, and many of the historic buildings in the town were built during this time.
Geography
Sewanee is located in Franklin County, Tennessee. It is situated in the foothills of the Cumberland Plateau, and is surrounded by the mountains of the Cumberland Plateau. The town is located at an elevation of 1,400 feet, and the surrounding area is known for its scenic views. The town is located approximately 60 miles south of Nashville, and is accessible by car or train.
Economy
The economy of Sewanee is largely based on tourism and education. The University of the South is the largest employer in the town, and the university provides jobs for many of the town's residents. The town is also home to several small businesses, including restaurants, shops, and galleries. The town is also home to several bed and breakfasts, which attract visitors from all over the country.
Demographics
As of the 2010 census, the population of Sewanee was 2,311. The town is predominantly white, with 91.3% of the population identifying as white. The median household income in the town is $50,000, and the median age is 33. The town is home to a diverse population, with people from all over the world living in the town.
Conclusion
Sewanee, Tennessee is a small town located in Franklin County, Tennessee. It is situated in the foothills of the Cumberland Plateau and is home to the University of the South. The town is known for its picturesque views, its historic buildings, and its vibrant culture. The economy of Sewanee is largely based on tourism and education, and the town is home to a diverse population. Sewanee is a unique and beautiful town, and it is a great place to visit or live.
Common Questions
What is Per Capita Income in Sewanee?
Per Capita income in Sewanee is $24,591.
What is the Median Family Income in Sewanee?
Median Family Income in Sewanee is $129,097.
What is the Median Household income in Sewanee?
Median Household Income in Sewanee is $77,105.
What is Income or Wage Gap in Sewanee?
Income or Wage Gap in Sewanee is 6.5%.
Women in Sewanee earn 93.5 cents for every dollar earned by a man.
What is Inequality or Gini Index in Sewanee?
Inequality or Gini Index in Sewanee is 0.55.
What is the Total Population of Sewanee?
Total Population of Sewanee is 2,922.
What is the Total Male Population of Sewanee?
Total Male Population of Sewanee is 1,396.
What is the Total Female Population of Sewanee?
Total Female Population of Sewanee is 1,526.
What is the Ratio of Males per 100 Females in Sewanee?
There are 91.48 Males per 100 Females in Sewanee.
What is the Ratio of Females per 100 Males in Sewanee?
There are 109.31 Females per 100 Males in Sewanee.
What is the Median Population Age in Sewanee?
Median Population Age in Sewanee is 21.6 Years.
What is the Average Family Size in Sewanee
Average Family Size in Sewanee is 2.5 People.
What is the Average Household Size in Sewanee
Average Household Size in Sewanee is 2.1 People.
How Large is the Labor Force in Sewanee?
There are 1,451 People in the Labor Forcein in Sewanee.
What is the Percentage of People in the Labor Force in Sewanee?
52.6% of People are in the Labor Force in Sewanee.
What is the Unemployment Rate in Sewanee?
Unemployment Rate in Sewanee is 0.7%.