Immigrants from Vietnam Disability Age 5 to 17
COMPARE
Immigrants from Vietnam
Select to Compare
Disability Age 5 to 17
Immigrants from Vietnam Disability Age 5 to 17
5.2%
DISABILITY | AGE 5 TO 17
99.7/ 100
METRIC RATING
72nd/ 347
METRIC RANK
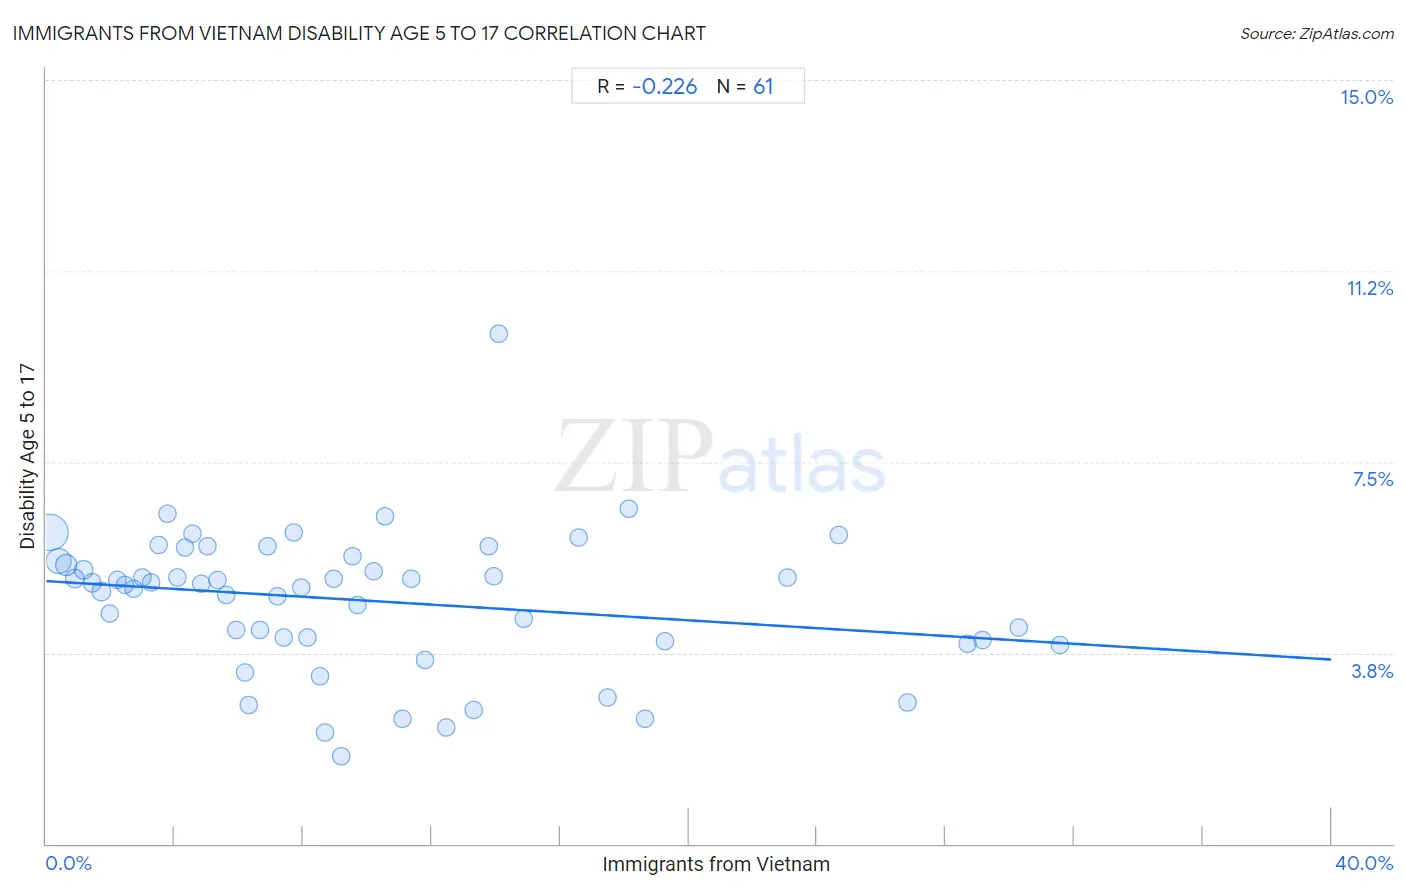
Immigrants from Vietnam Disability Age 5 to 17 Correlation Chart
The statistical analysis conducted on geographies consisting of 402,102,659 people shows a weak negative correlation between the proportion of Immigrants from Vietnam and percentage of population with a disability between the ages 5 and 17 in the United States with a correlation coefficient (R) of -0.226 and weighted average of 5.2%. On average, for every 1% (one percent) increase in Immigrants from Vietnam within a typical geography, there is a decrease of 0.039% in percentage of population with a disability between the ages 5 and 17.
It is essential to understand that the correlation between the percentage of Immigrants from Vietnam and percentage of population with a disability between the ages 5 and 17 does not imply a direct cause-and-effect relationship. It remains uncertain whether the presence of Immigrants from Vietnam influences an upward or downward trend in the level of percentage of population with a disability between the ages 5 and 17 within an area, or if Immigrants from Vietnam simply ended up residing in those areas with higher or lower levels of percentage of population with a disability between the ages 5 and 17 due to other factors.
Demographics Similar to Immigrants from Vietnam by Disability Age 5 to 17
In terms of disability age 5 to 17, the demographic groups most similar to Immigrants from Vietnam are Jordanian (5.2%, a difference of 0.020%), Immigrants from Czechoslovakia (5.2%, a difference of 0.020%), Immigrants from Belgium (5.2%, a difference of 0.070%), Immigrants from Romania (5.2%, a difference of 0.090%), and Guyanese (5.2%, a difference of 0.11%).
| Demographics | Rating | Rank | Disability Age 5 to 17 |
| Immigrants from Greece | 99.8 /100 | #65 | Exceptional 5.2% |
| Palestinians | 99.8 /100 | #66 | Exceptional 5.2% |
| Macedonians | 99.8 /100 | #67 | Exceptional 5.2% |
| Immigrants from Syria | 99.7 /100 | #68 | Exceptional 5.2% |
| Guyanese | 99.7 /100 | #69 | Exceptional 5.2% |
| Immigrants from Belgium | 99.7 /100 | #70 | Exceptional 5.2% |
| Jordanians | 99.7 /100 | #71 | Exceptional 5.2% |
| Immigrants from Vietnam | 99.7 /100 | #72 | Exceptional 5.2% |
| Immigrants from Czechoslovakia | 99.7 /100 | #73 | Exceptional 5.2% |
| Immigrants from Romania | 99.7 /100 | #74 | Exceptional 5.2% |
| Immigrants from Moldova | 99.6 /100 | #75 | Exceptional 5.2% |
| Immigrants from Guyana | 99.6 /100 | #76 | Exceptional 5.2% |
| Immigrants from Kazakhstan | 99.6 /100 | #77 | Exceptional 5.2% |
| Immigrants from Cuba | 99.6 /100 | #78 | Exceptional 5.2% |
| Afghans | 99.6 /100 | #79 | Exceptional 5.2% |
Immigrants from Vietnam Disability Age 5 to 17 Correlation Summary
| Measurement | Immigrants from Vietnam Data | Disability Age 5 to 17 Data |
| Minimum | 0.12% | 1.7% |
| Maximum | 31.6% | 10.0% |
| Range | 31.4% | 8.3% |
| Mean | 10.0% | 4.8% |
| Median | 8.0% | 5.1% |
| Interquartile 25% (IQ1) | 3.9% | 4.0% |
| Interquartile 75% (IQ3) | 13.9% | 5.6% |
| Interquartile Range (IQR) | 9.9% | 1.6% |
| Standard Deviation (Sample) | 8.1% | 1.4% |
| Standard Deviation (Population) | 8.1% | 1.4% |
Correlation Details
| Immigrants from Vietnam Percentile | Sample Size | Disability Age 5 to 17 |
[ 0.0% - 0.5% ] 0.12% | 203,041,328 | 6.1% |
[ 0.0% - 0.5% ] 0.37% | 84,778,084 | 5.5% |
[ 0.5% - 1.0% ] 0.64% | 40,488,011 | 5.5% |
[ 0.5% - 1.0% ] 0.90% | 18,303,677 | 5.2% |
[ 1.0% - 1.5% ] 1.18% | 16,010,370 | 5.4% |
[ 1.0% - 1.5% ] 1.43% | 7,059,464 | 5.1% |
[ 1.5% - 2.0% ] 1.72% | 9,018,388 | 5.0% |
[ 1.5% - 2.0% ] 1.97% | 4,003,573 | 4.5% |
[ 2.0% - 2.5% ] 2.20% | 3,020,270 | 5.2% |
[ 2.0% - 2.5% ] 2.46% | 2,391,067 | 5.1% |
[ 2.5% - 3.0% ] 2.73% | 1,480,730 | 5.0% |
[ 3.0% - 3.5% ] 3.01% | 1,376,131 | 5.2% |
[ 3.0% - 3.5% ] 3.28% | 1,198,941 | 5.1% |
[ 3.0% - 3.5% ] 3.50% | 934,251 | 5.9% |
[ 3.5% - 4.0% ] 3.77% | 657,868 | 6.5% |
[ 4.0% - 4.5% ] 4.07% | 1,146,190 | 5.2% |
[ 4.0% - 4.5% ] 4.31% | 519,349 | 5.8% |
[ 4.5% - 5.0% ] 4.54% | 308,898 | 6.1% |
[ 4.5% - 5.0% ] 4.83% | 383,824 | 5.1% |
[ 5.0% - 5.5% ] 5.03% | 239,913 | 5.8% |
[ 5.0% - 5.5% ] 5.31% | 474,584 | 5.2% |
[ 5.5% - 6.0% ] 5.62% | 323,967 | 4.9% |
[ 5.5% - 6.0% ] 5.90% | 297,884 | 4.2% |
[ 6.0% - 6.5% ] 6.18% | 334,466 | 3.4% |
[ 6.0% - 6.5% ] 6.29% | 42,330 | 2.7% |
[ 6.5% - 7.0% ] 6.64% | 240,662 | 4.2% |
[ 6.5% - 7.0% ] 6.89% | 92,970 | 5.8% |
[ 7.0% - 7.5% ] 7.21% | 185,946 | 4.9% |
[ 7.0% - 7.5% ] 7.39% | 167,608 | 4.1% |
[ 7.5% - 8.0% ] 7.70% | 109,036 | 6.1% |
[ 7.5% - 8.0% ] 7.96% | 274,548 | 5.0% |
[ 8.0% - 8.5% ] 8.13% | 1,107,074 | 4.1% |
[ 8.5% - 9.0% ] 8.51% | 69,794 | 3.3% |
[ 8.5% - 9.0% ] 8.67% | 196 | 2.2% |
[ 8.5% - 9.0% ] 8.95% | 167,741 | 5.2% |
[ 9.0% - 9.5% ] 9.19% | 158,485 | 1.7% |
[ 9.5% - 10.0% ] 9.55% | 183,803 | 5.6% |
[ 9.5% - 10.0% ] 9.70% | 84,771 | 4.7% |
[ 10.0% - 10.5% ] 10.21% | 61,593 | 5.4% |
[ 10.5% - 11.0% ] 10.54% | 44,528 | 6.4% |
[ 11.0% - 11.5% ] 11.11% | 17,645 | 2.5% |
[ 11.0% - 11.5% ] 11.36% | 19,420 | 5.2% |
[ 11.5% - 12.0% ] 11.78% | 74,703 | 3.6% |
[ 12.0% - 12.5% ] 12.45% | 37,340 | 2.3% |
[ 13.0% - 13.5% ] 13.29% | 40,981 | 2.6% |
[ 13.5% - 14.0% ] 13.77% | 31,102 | 5.8% |
[ 13.5% - 14.0% ] 13.95% | 38,271 | 5.3% |
[ 14.0% - 14.5% ] 14.08% | 61,688 | 10.0% |
[ 14.5% - 15.0% ] 14.88% | 142,257 | 4.4% |
[ 16.5% - 17.0% ] 16.59% | 52,555 | 6.0% |
[ 17.0% - 17.5% ] 17.45% | 7,786 | 2.9% |
[ 18.0% - 18.5% ] 18.11% | 113,587 | 6.6% |
[ 18.5% - 19.0% ] 18.62% | 127,330 | 2.4% |
[ 19.0% - 19.5% ] 19.25% | 45,688 | 4.0% |
[ 23.0% - 23.5% ] 23.07% | 171,637 | 5.2% |
[ 24.5% - 25.0% ] 24.66% | 36,657 | 6.1% |
[ 26.5% - 27.0% ] 26.81% | 34,188 | 2.8% |
[ 28.5% - 29.0% ] 28.68% | 47,549 | 3.9% |
[ 29.0% - 29.5% ] 29.13% | 16,072 | 4.0% |
[ 30.0% - 30.5% ] 30.26% | 181,268 | 4.2% |
[ 31.5% - 32.0% ] 31.56% | 22,622 | 3.9% |