Immigrants from Vietnam vs Immigrants from Afghanistan Married-Couple Family Poverty
COMPARE
Immigrants from Vietnam
Immigrants from Afghanistan
Married-Couple Family Poverty
Married-Couple Family Poverty Comparison
Immigrants from Vietnam
Immigrants from Afghanistan
5.3%
MARRIED-COUPLE FAMILY POVERTY
37.7/ 100
METRIC RATING
182nd/ 347
METRIC RANK
5.8%
MARRIED-COUPLE FAMILY POVERTY
2.1/ 100
METRIC RATING
245th/ 347
METRIC RANK
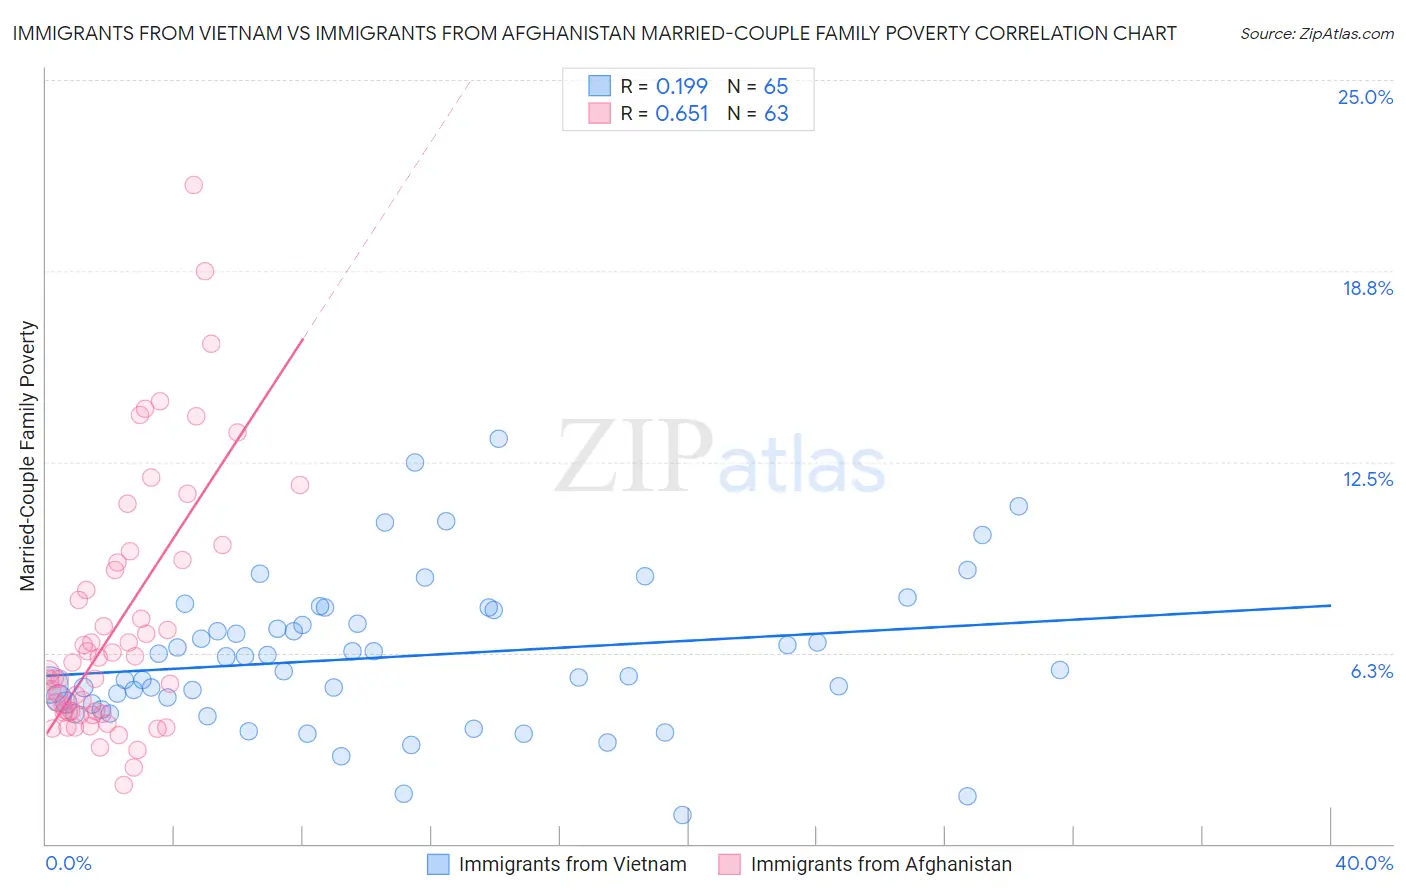
Immigrants from Vietnam vs Immigrants from Afghanistan Married-Couple Family Poverty Correlation Chart
The statistical analysis conducted on geographies consisting of 401,742,374 people shows a poor positive correlation between the proportion of Immigrants from Vietnam and poverty level among married-couple families in the United States with a correlation coefficient (R) of 0.199 and weighted average of 5.3%. Similarly, the statistical analysis conducted on geographies consisting of 147,133,206 people shows a significant positive correlation between the proportion of Immigrants from Afghanistan and poverty level among married-couple families in the United States with a correlation coefficient (R) of 0.651 and weighted average of 5.8%, a difference of 9.5%.
Married-Couple Family Poverty Correlation Summary
| Measurement | Immigrants from Vietnam | Immigrants from Afghanistan |
| Minimum | 0.96% | 1.9% |
| Maximum | 13.2% | 21.6% |
| Range | 12.3% | 19.6% |
| Mean | 6.1% | 7.2% |
| Median | 5.7% | 5.6% |
| Interquartile 25% (IQ1) | 4.6% | 4.3% |
| Interquartile 75% (IQ3) | 7.4% | 9.2% |
| Interquartile Range (IQR) | 2.8% | 4.9% |
| Standard Deviation (Sample) | 2.4% | 4.1% |
| Standard Deviation (Population) | 2.4% | 4.1% |
Similar Demographics by Married-Couple Family Poverty
Demographics Similar to Immigrants from Vietnam by Married-Couple Family Poverty
In terms of married-couple family poverty, the demographic groups most similar to Immigrants from Vietnam are Peruvian (5.3%, a difference of 0.010%), Immigrants from Chile (5.3%, a difference of 0.13%), Immigrants from Sierra Leone (5.3%, a difference of 0.18%), Nonimmigrants (5.3%, a difference of 0.24%), and American (5.3%, a difference of 0.29%).
| Demographics | Rating | Rank | Married-Couple Family Poverty |
| Marshallese | 47.9 /100 | #175 | Average 5.2% |
| Menominee | 47.8 /100 | #176 | Average 5.2% |
| Immigrants | Kazakhstan | 45.1 /100 | #177 | Average 5.2% |
| Immigrants | Ukraine | 44.9 /100 | #178 | Average 5.2% |
| Spanish | 41.4 /100 | #179 | Average 5.3% |
| Immigrants | Sierra Leone | 39.3 /100 | #180 | Fair 5.3% |
| Immigrants | Chile | 38.8 /100 | #181 | Fair 5.3% |
| Immigrants | Vietnam | 37.7 /100 | #182 | Fair 5.3% |
| Peruvians | 37.6 /100 | #183 | Fair 5.3% |
| Immigrants | Nonimmigrants | 35.8 /100 | #184 | Fair 5.3% |
| Americans | 35.4 /100 | #185 | Fair 5.3% |
| Hungarians | 34.7 /100 | #186 | Fair 5.3% |
| Immigrants | Albania | 33.8 /100 | #187 | Fair 5.3% |
| Israelis | 33.1 /100 | #188 | Fair 5.3% |
| South American Indians | 32.5 /100 | #189 | Fair 5.3% |
Demographics Similar to Immigrants from Afghanistan by Married-Couple Family Poverty
In terms of married-couple family poverty, the demographic groups most similar to Immigrants from Afghanistan are Chickasaw (5.8%, a difference of 0.15%), Somali (5.8%, a difference of 0.16%), Immigrants from Western Africa (5.8%, a difference of 0.31%), Immigrants from Panama (5.8%, a difference of 0.40%), and Fijian (5.8%, a difference of 0.43%).
| Demographics | Rating | Rank | Married-Couple Family Poverty |
| Cherokee | 2.7 /100 | #238 | Tragic 5.8% |
| Venezuelans | 2.7 /100 | #239 | Tragic 5.8% |
| Fijians | 2.5 /100 | #240 | Tragic 5.8% |
| Immigrants | Panama | 2.5 /100 | #241 | Tragic 5.8% |
| Immigrants | Western Africa | 2.4 /100 | #242 | Tragic 5.8% |
| Somalis | 2.3 /100 | #243 | Tragic 5.8% |
| Chickasaw | 2.3 /100 | #244 | Tragic 5.8% |
| Immigrants | Afghanistan | 2.1 /100 | #245 | Tragic 5.8% |
| Immigrants | Venezuela | 1.8 /100 | #246 | Tragic 5.8% |
| Iraqis | 1.4 /100 | #247 | Tragic 5.9% |
| Cree | 1.2 /100 | #248 | Tragic 5.9% |
| Tsimshian | 1.1 /100 | #249 | Tragic 5.9% |
| Immigrants | Eritrea | 1.1 /100 | #250 | Tragic 5.9% |
| Immigrants | Ghana | 1.0 /100 | #251 | Tragic 5.9% |
| Immigrants | Western Asia | 0.7 /100 | #252 | Tragic 6.0% |