Immigrants from Vietnam Self-Care Disability
COMPARE
Immigrants from Vietnam
Select to Compare
Self-Care Disability
Immigrants from Vietnam Self-Care Disability
2.5%
SELF-CARE DISABILITY
59.3/ 100
METRIC RATING
164th/ 347
METRIC RANK
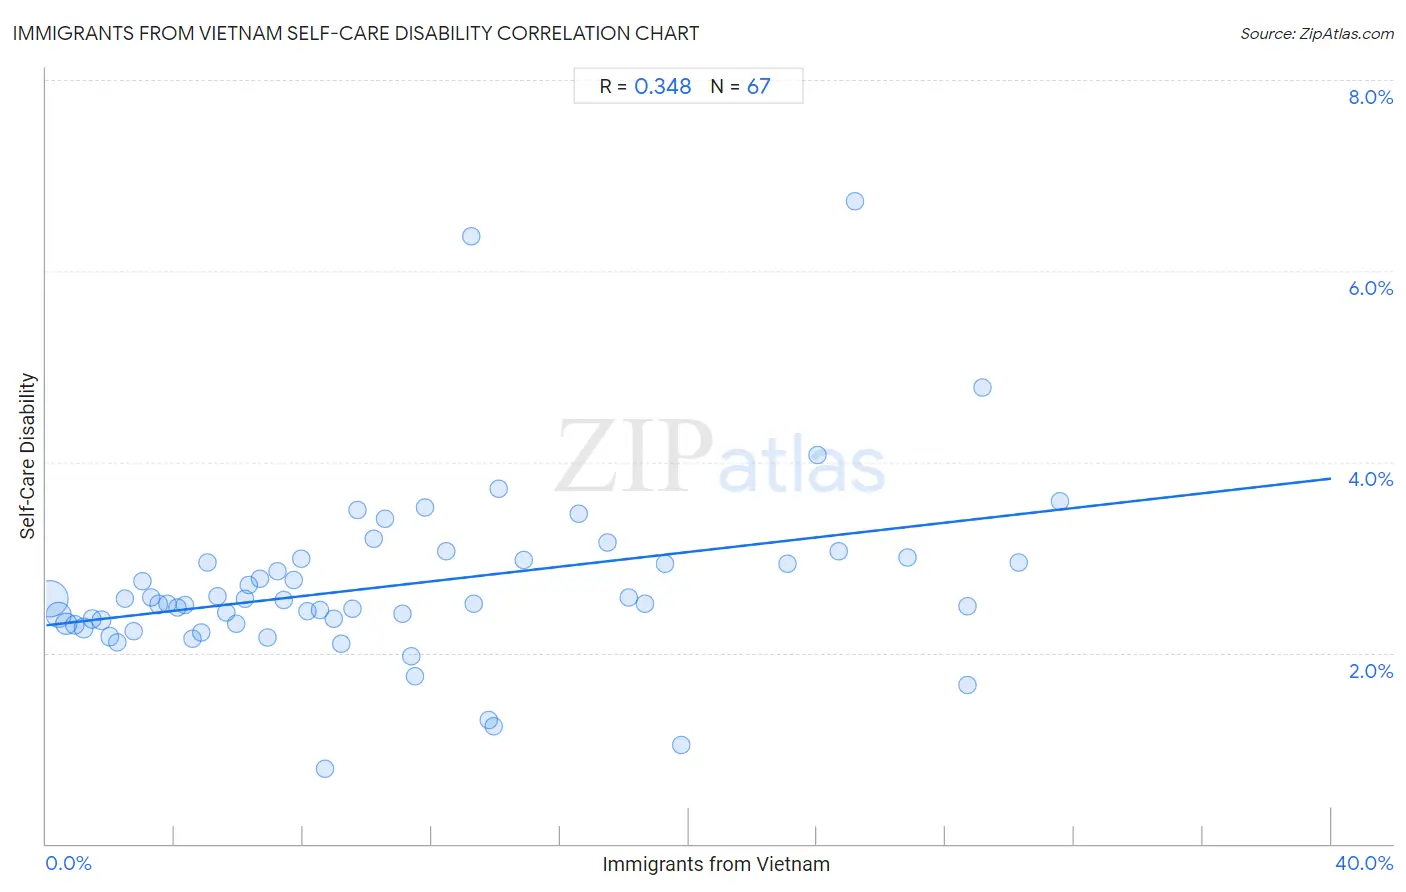
Immigrants from Vietnam Self-Care Disability Correlation Chart
The statistical analysis conducted on geographies consisting of 404,358,280 people shows a mild positive correlation between the proportion of Immigrants from Vietnam and percentage of population with self-care disability in the United States with a correlation coefficient (R) of 0.348 and weighted average of 2.5%. On average, for every 1% (one percent) increase in Immigrants from Vietnam within a typical geography, there is an increase of 0.038% in percentage of population with self-care disability.
It is essential to understand that the correlation between the percentage of Immigrants from Vietnam and percentage of population with self-care disability does not imply a direct cause-and-effect relationship. It remains uncertain whether the presence of Immigrants from Vietnam influences an upward or downward trend in the level of percentage of population with self-care disability within an area, or if Immigrants from Vietnam simply ended up residing in those areas with higher or lower levels of percentage of population with self-care disability due to other factors.
Demographics Similar to Immigrants from Vietnam by Self-Care Disability
In terms of self-care disability, the demographic groups most similar to Immigrants from Vietnam are Syrian (2.5%, a difference of 0.020%), Canadian (2.5%, a difference of 0.030%), Immigrants from Greece (2.5%, a difference of 0.10%), Ute (2.5%, a difference of 0.11%), and German Russian (2.5%, a difference of 0.17%).
| Demographics | Rating | Rank | Self-Care Disability |
| Immigrants from Europe | 69.6 /100 | #157 | Good 2.4% |
| Immigrants from Western Europe | 68.6 /100 | #158 | Good 2.4% |
| Immigrants from Italy | 68.5 /100 | #159 | Good 2.4% |
| Finns | 67.0 /100 | #160 | Good 2.4% |
| Lebanese | 66.5 /100 | #161 | Good 2.4% |
| Somalis | 63.7 /100 | #162 | Good 2.5% |
| German Russians | 62.7 /100 | #163 | Good 2.5% |
| Immigrants from Vietnam | 59.3 /100 | #164 | Average 2.5% |
| Syrians | 59.0 /100 | #165 | Average 2.5% |
| Canadians | 58.8 /100 | #166 | Average 2.5% |
| Immigrants from Greece | 57.3 /100 | #167 | Average 2.5% |
| Ute | 57.1 /100 | #168 | Average 2.5% |
| Immigrants from Somalia | 55.9 /100 | #169 | Average 2.5% |
| Scottish | 54.3 /100 | #170 | Average 2.5% |
| Pennsylvania Germans | 53.5 /100 | #171 | Average 2.5% |
Immigrants from Vietnam Self-Care Disability Correlation Summary
| Measurement | Immigrants from Vietnam Data | Self-Care Disability Data |
| Minimum | 0.12% | 0.78% |
| Maximum | 31.6% | 6.7% |
| Range | 31.4% | 5.9% |
| Mean | 10.9% | 2.7% |
| Median | 8.7% | 2.5% |
| Interquartile 25% (IQ1) | 4.3% | 2.3% |
| Interquartile 75% (IQ3) | 14.9% | 3.0% |
| Interquartile Range (IQR) | 10.6% | 0.66% |
| Standard Deviation (Sample) | 8.5% | 0.94% |
| Standard Deviation (Population) | 8.4% | 0.93% |
Correlation Details
| Immigrants from Vietnam Percentile | Sample Size | Self-Care Disability |
[ 0.0% - 0.5% ] 0.12% | 204,165,085 | 2.6% |
[ 0.0% - 0.5% ] 0.37% | 85,162,664 | 2.4% |
[ 0.5% - 1.0% ] 0.64% | 40,662,766 | 2.3% |
[ 0.5% - 1.0% ] 0.90% | 18,411,712 | 2.3% |
[ 1.0% - 1.5% ] 1.18% | 16,095,286 | 2.3% |
[ 1.0% - 1.5% ] 1.43% | 7,154,430 | 2.4% |
[ 1.5% - 2.0% ] 1.72% | 9,061,029 | 2.3% |
[ 1.5% - 2.0% ] 1.97% | 4,012,241 | 2.2% |
[ 2.0% - 2.5% ] 2.20% | 3,070,141 | 2.1% |
[ 2.0% - 2.5% ] 2.46% | 2,400,258 | 2.6% |
[ 2.5% - 3.0% ] 2.73% | 1,506,674 | 2.2% |
[ 3.0% - 3.5% ] 3.00% | 1,429,452 | 2.7% |
[ 3.0% - 3.5% ] 3.28% | 1,213,301 | 2.6% |
[ 3.0% - 3.5% ] 3.50% | 948,297 | 2.5% |
[ 3.5% - 4.0% ] 3.77% | 665,249 | 2.5% |
[ 4.0% - 4.5% ] 4.07% | 1,151,760 | 2.5% |
[ 4.0% - 4.5% ] 4.31% | 522,991 | 2.5% |
[ 4.5% - 5.0% ] 4.54% | 312,106 | 2.2% |
[ 4.5% - 5.0% ] 4.83% | 395,472 | 2.2% |
[ 5.0% - 5.5% ] 5.03% | 247,215 | 2.9% |
[ 5.0% - 5.5% ] 5.32% | 479,249 | 2.6% |
[ 5.5% - 6.0% ] 5.62% | 325,716 | 2.4% |
[ 5.5% - 6.0% ] 5.90% | 297,884 | 2.3% |
[ 6.0% - 6.5% ] 6.18% | 336,051 | 2.6% |
[ 6.0% - 6.5% ] 6.29% | 42,330 | 2.7% |
[ 6.5% - 7.0% ] 6.64% | 241,035 | 2.8% |
[ 6.5% - 7.0% ] 6.89% | 93,231 | 2.2% |
[ 7.0% - 7.5% ] 7.21% | 185,946 | 2.9% |
[ 7.0% - 7.5% ] 7.39% | 167,688 | 2.6% |
[ 7.5% - 8.0% ] 7.71% | 113,259 | 2.8% |
[ 7.5% - 8.0% ] 7.96% | 275,428 | 3.0% |
[ 8.0% - 8.5% ] 8.13% | 1,107,074 | 2.4% |
[ 8.5% - 9.0% ] 8.51% | 71,794 | 2.4% |
[ 8.5% - 9.0% ] 8.70% | 805 | 0.78% |
[ 8.5% - 9.0% ] 8.95% | 167,741 | 2.4% |
[ 9.0% - 9.5% ] 9.19% | 158,485 | 2.1% |
[ 9.5% - 10.0% ] 9.55% | 183,803 | 2.5% |
[ 9.5% - 10.0% ] 9.70% | 84,771 | 3.5% |
[ 10.0% - 10.5% ] 10.21% | 61,593 | 3.2% |
[ 10.5% - 11.0% ] 10.54% | 44,528 | 3.4% |
[ 11.0% - 11.5% ] 11.11% | 17,842 | 2.4% |
[ 11.0% - 11.5% ] 11.36% | 20,132 | 2.0% |
[ 11.0% - 11.5% ] 11.48% | 61 | 1.8% |
[ 11.5% - 12.0% ] 11.78% | 74,703 | 3.5% |
[ 12.0% - 12.5% ] 12.45% | 40,001 | 3.1% |
[ 13.0% - 13.5% ] 13.22% | 1,241 | 6.4% |
[ 13.0% - 13.5% ] 13.29% | 40,981 | 2.5% |
[ 13.5% - 14.0% ] 13.77% | 31,102 | 1.3% |
[ 13.5% - 14.0% ] 13.95% | 38,271 | 1.2% |
[ 14.0% - 14.5% ] 14.08% | 61,688 | 3.7% |
[ 14.5% - 15.0% ] 14.88% | 142,257 | 3.0% |
[ 16.5% - 17.0% ] 16.59% | 53,476 | 3.5% |
[ 17.0% - 17.5% ] 17.45% | 7,786 | 3.2% |
[ 18.0% - 18.5% ] 18.11% | 113,587 | 2.6% |
[ 18.5% - 19.0% ] 18.62% | 127,330 | 2.5% |
[ 19.0% - 19.5% ] 19.25% | 45,688 | 2.9% |
[ 19.5% - 20.0% ] 19.75% | 1,691 | 1.0% |
[ 23.0% - 23.5% ] 23.07% | 171,637 | 2.9% |
[ 24.0% - 24.5% ] 24.01% | 2,916 | 4.1% |
[ 24.5% - 25.0% ] 24.66% | 36,657 | 3.1% |
[ 25.0% - 25.5% ] 25.19% | 401 | 6.7% |
[ 26.5% - 27.0% ] 26.81% | 34,188 | 3.0% |
[ 28.5% - 29.0% ] 28.67% | 593 | 1.7% |
[ 28.5% - 29.0% ] 28.68% | 47,549 | 2.5% |
[ 29.0% - 29.5% ] 29.13% | 16,072 | 4.8% |
[ 30.0% - 30.5% ] 30.26% | 181,268 | 2.9% |
[ 31.5% - 32.0% ] 31.56% | 22,622 | 3.6% |