Immigrants from Vietnam Wage/Income Gap
COMPARE
Immigrants from Vietnam
Select to Compare
Wage/Income Gap
Immigrants from Vietnam Wage/Income Gap
25.2%
WAGE/INCOME GAP
77.7/ 100
METRIC RATING
155th/ 347
METRIC RANK
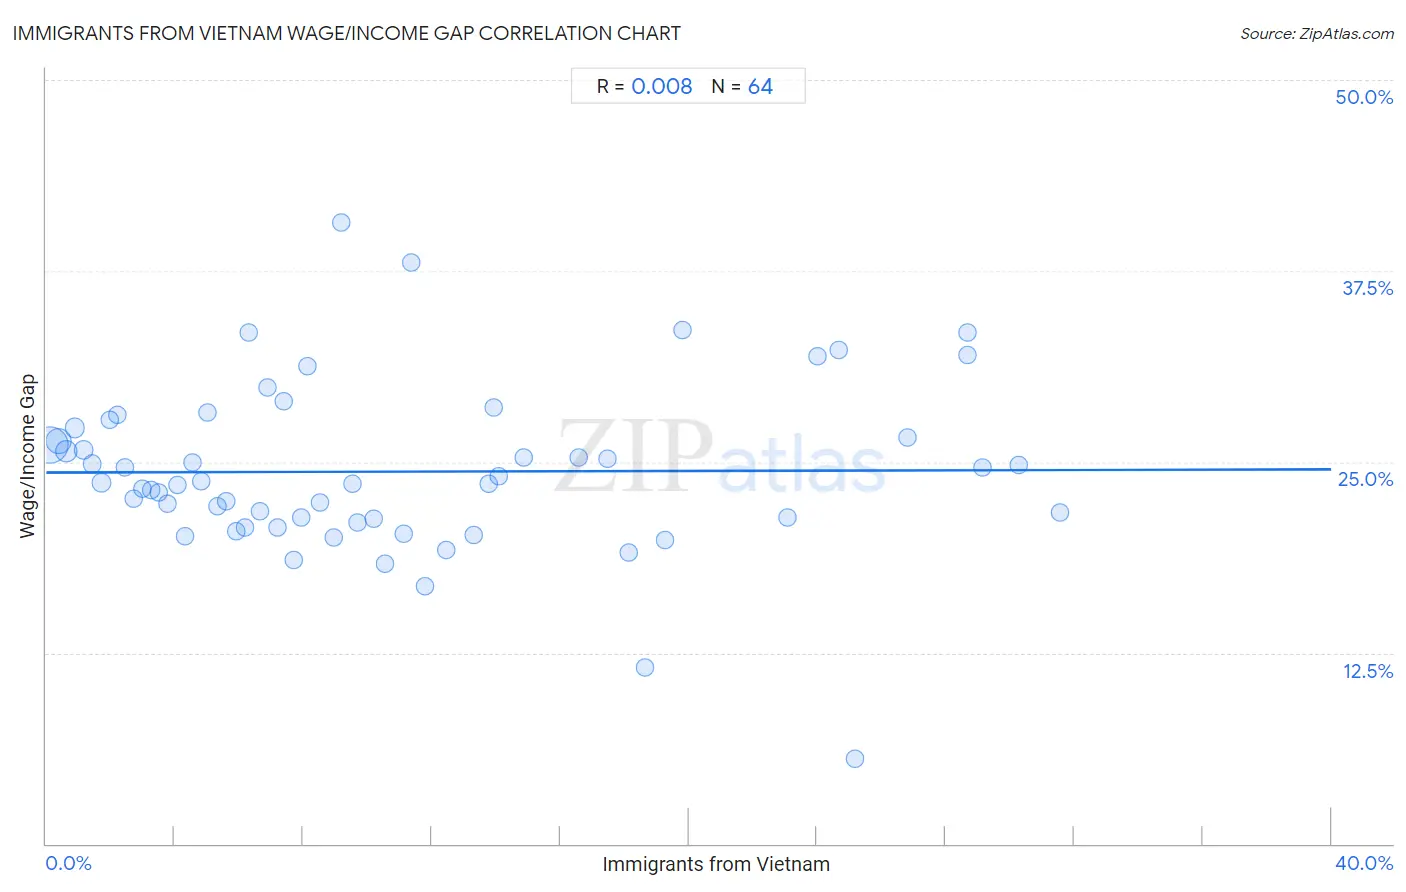
Immigrants from Vietnam Wage/Income Gap Correlation Chart
The statistical analysis conducted on geographies consisting of 404,669,724 people shows no correlation between the proportion of Immigrants from Vietnam and wage/income gap percentage in the United States with a correlation coefficient (R) of 0.008 and weighted average of 25.2%. On average, for every 1% (one percent) increase in Immigrants from Vietnam within a typical geography, there is an increase of 0.0050% in wage/income gap percentage.
It is essential to understand that the correlation between the percentage of Immigrants from Vietnam and wage/income gap percentage does not imply a direct cause-and-effect relationship. It remains uncertain whether the presence of Immigrants from Vietnam influences an upward or downward trend in the level of wage/income gap percentage within an area, or if Immigrants from Vietnam simply ended up residing in those areas with higher or lower levels of wage/income gap percentage due to other factors.
Demographics Similar to Immigrants from Vietnam by Wage/Income Gap
In terms of wage/income gap, the demographic groups most similar to Immigrants from Vietnam are Blackfeet (25.2%, a difference of 0.040%), Immigrants from Northern Africa (25.2%, a difference of 0.040%), Immigrants from Mexico (25.3%, a difference of 0.12%), Costa Rican (25.3%, a difference of 0.18%), and Immigrants from Zimbabwe (25.3%, a difference of 0.36%).
| Demographics | Rating | Rank | Wage/Income Gap |
| Iroquois | 83.9 /100 | #148 | Excellent 25.1% |
| Immigrants from Peru | 82.6 /100 | #149 | Excellent 25.1% |
| Immigrants | 82.3 /100 | #150 | Excellent 25.1% |
| Taiwanese | 81.6 /100 | #151 | Excellent 25.1% |
| Uruguayans | 81.3 /100 | #152 | Excellent 25.2% |
| Blackfeet | 78.1 /100 | #153 | Good 25.2% |
| Immigrants from Northern Africa | 78.1 /100 | #154 | Good 25.2% |
| Immigrants from Vietnam | 77.7 /100 | #155 | Good 25.2% |
| Immigrants from Mexico | 76.4 /100 | #156 | Good 25.3% |
| Costa Ricans | 75.8 /100 | #157 | Good 25.3% |
| Immigrants from Zimbabwe | 73.7 /100 | #158 | Good 25.3% |
| Puget Sound Salish | 73.0 /100 | #159 | Good 25.3% |
| French American Indians | 72.5 /100 | #160 | Good 25.4% |
| Albanians | 69.4 /100 | #161 | Good 25.4% |
| Shoshone | 69.0 /100 | #162 | Good 25.4% |
Immigrants from Vietnam Wage/Income Gap Correlation Summary
| Measurement | Immigrants from Vietnam Data | Wage/Income Gap Data |
| Minimum | 0.12% | 5.6% |
| Maximum | 31.6% | 40.6% |
| Range | 31.4% | 35.1% |
| Mean | 10.9% | 24.4% |
| Median | 8.3% | 23.6% |
| Interquartile 25% (IQ1) | 4.2% | 21.1% |
| Interquartile 75% (IQ3) | 15.7% | 26.9% |
| Interquartile Range (IQR) | 11.5% | 5.8% |
| Standard Deviation (Sample) | 8.7% | 5.6% |
| Standard Deviation (Population) | 8.6% | 5.6% |
Correlation Details
| Immigrants from Vietnam Percentile | Sample Size | Wage/Income Gap |
[ 0.0% - 0.5% ] 0.12% | 204,303,561 | 26.1% |
[ 0.0% - 0.5% ] 0.37% | 85,266,025 | 26.3% |
[ 0.5% - 1.0% ] 0.64% | 40,713,227 | 25.7% |
[ 0.5% - 1.0% ] 0.90% | 18,427,253 | 27.2% |
[ 1.0% - 1.5% ] 1.18% | 16,100,476 | 25.8% |
[ 1.0% - 1.5% ] 1.43% | 7,149,685 | 24.8% |
[ 1.5% - 2.0% ] 1.72% | 9,065,703 | 23.7% |
[ 1.5% - 2.0% ] 1.97% | 4,011,427 | 27.8% |
[ 2.0% - 2.5% ] 2.20% | 3,069,871 | 28.1% |
[ 2.0% - 2.5% ] 2.46% | 2,399,494 | 24.6% |
[ 2.5% - 3.0% ] 2.73% | 1,509,021 | 22.6% |
[ 3.0% - 3.5% ] 3.00% | 1,428,172 | 23.2% |
[ 3.0% - 3.5% ] 3.28% | 1,214,023 | 23.1% |
[ 3.0% - 3.5% ] 3.50% | 949,902 | 23.0% |
[ 3.5% - 4.0% ] 3.77% | 665,249 | 22.3% |
[ 4.0% - 4.5% ] 4.07% | 1,151,760 | 23.5% |
[ 4.0% - 4.5% ] 4.31% | 522,849 | 20.1% |
[ 4.5% - 5.0% ] 4.54% | 312,938 | 25.0% |
[ 4.5% - 5.0% ] 4.83% | 395,472 | 23.8% |
[ 5.0% - 5.5% ] 5.03% | 247,215 | 28.3% |
[ 5.0% - 5.5% ] 5.32% | 479,249 | 22.1% |
[ 5.5% - 6.0% ] 5.62% | 325,716 | 22.4% |
[ 5.5% - 6.0% ] 5.90% | 297,884 | 20.4% |
[ 6.0% - 6.5% ] 6.18% | 337,142 | 20.7% |
[ 6.0% - 6.5% ] 6.29% | 42,330 | 33.5% |
[ 6.5% - 7.0% ] 6.64% | 239,916 | 21.8% |
[ 6.5% - 7.0% ] 6.89% | 92,970 | 29.9% |
[ 7.0% - 7.5% ] 7.21% | 185,946 | 20.7% |
[ 7.0% - 7.5% ] 7.39% | 167,688 | 28.9% |
[ 7.5% - 8.0% ] 7.71% | 114,456 | 18.6% |
[ 7.5% - 8.0% ] 7.96% | 275,428 | 21.4% |
[ 8.0% - 8.5% ] 8.13% | 1,107,074 | 31.3% |
[ 8.5% - 9.0% ] 8.51% | 71,794 | 22.3% |
[ 8.5% - 9.0% ] 8.95% | 167,741 | 20.1% |
[ 9.0% - 9.5% ] 9.19% | 158,485 | 40.6% |
[ 9.5% - 10.0% ] 9.55% | 183,803 | 23.5% |
[ 9.5% - 10.0% ] 9.70% | 84,791 | 21.0% |
[ 10.0% - 10.5% ] 10.21% | 61,593 | 21.3% |
[ 10.5% - 11.0% ] 10.54% | 44,528 | 18.3% |
[ 11.0% - 11.5% ] 11.11% | 17,024 | 20.3% |
[ 11.0% - 11.5% ] 11.36% | 20,132 | 38.1% |
[ 11.5% - 12.0% ] 11.78% | 74,703 | 16.9% |
[ 12.0% - 12.5% ] 12.45% | 40,001 | 19.3% |
[ 13.0% - 13.5% ] 13.29% | 40,981 | 20.2% |
[ 13.5% - 14.0% ] 13.77% | 31,102 | 23.6% |
[ 13.5% - 14.0% ] 13.95% | 38,271 | 28.6% |
[ 14.0% - 14.5% ] 14.08% | 61,688 | 24.1% |
[ 14.5% - 15.0% ] 14.88% | 142,257 | 25.3% |
[ 16.5% - 17.0% ] 16.59% | 52,555 | 25.3% |
[ 17.0% - 17.5% ] 17.45% | 7,786 | 25.2% |
[ 18.0% - 18.5% ] 18.11% | 113,587 | 19.1% |
[ 18.5% - 19.0% ] 18.62% | 127,330 | 11.6% |
[ 19.0% - 19.5% ] 19.25% | 45,688 | 19.9% |
[ 19.5% - 20.0% ] 19.79% | 859 | 33.6% |
[ 23.0% - 23.5% ] 23.07% | 171,637 | 21.3% |
[ 24.0% - 24.5% ] 24.01% | 2,916 | 31.9% |
[ 24.5% - 25.0% ] 24.66% | 36,657 | 32.3% |
[ 25.0% - 25.5% ] 25.19% | 401 | 5.6% |
[ 26.5% - 27.0% ] 26.81% | 34,188 | 26.6% |
[ 28.5% - 29.0% ] 28.67% | 593 | 33.5% |
[ 28.5% - 29.0% ] 28.68% | 47,549 | 32.0% |
[ 29.0% - 29.5% ] 29.13% | 16,072 | 24.6% |
[ 30.0% - 30.5% ] 30.26% | 181,268 | 24.8% |
[ 31.5% - 32.0% ] 31.56% | 22,622 | 21.7% |