Immigrants from Vietnam 3 or more Vehicles in Household
COMPARE
Immigrants from Vietnam
Select to Compare
3 or more Vehicles in Household
Immigrants from Vietnam 3 or more Vehicles in Household
23.8%
3+ VEHICLES AVAILABLE
100.0/ 100
METRIC RATING
21st/ 347
METRIC RANK
Immigrants from Vietnam 3 or more Vehicles in Household Correlation Chart
The statistical analysis conducted on geographies consisting of 404,478,645 people shows a moderate positive correlation between the proportion of Immigrants from Vietnam and percentage of households with 3 or more vehicles available in the United States with a correlation coefficient (R) of 0.428 and weighted average of 23.8%. On average, for every 1% (one percent) increase in Immigrants from Vietnam within a typical geography, there is an increase of 0.39% in percentage of households with 3 or more vehicles available.
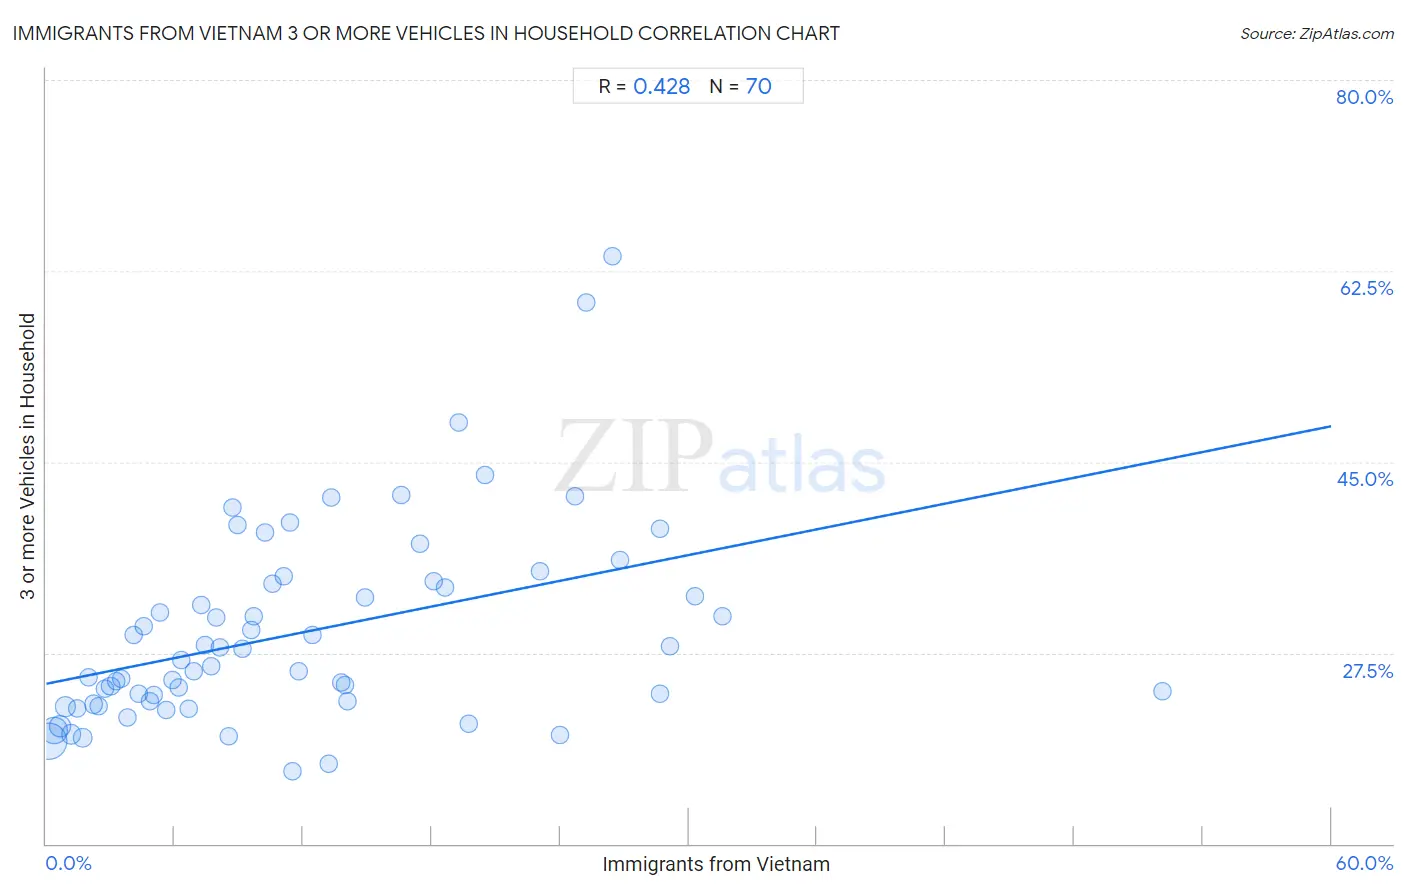
It is essential to understand that the correlation between the percentage of Immigrants from Vietnam and percentage of households with 3 or more vehicles available does not imply a direct cause-and-effect relationship. It remains uncertain whether the presence of Immigrants from Vietnam influences an upward or downward trend in the level of percentage of households with 3 or more vehicles available within an area, or if Immigrants from Vietnam simply ended up residing in those areas with higher or lower levels of percentage of households with 3 or more vehicles available due to other factors.
Demographics Similar to Immigrants from Vietnam by 3 or more Vehicles in Household
In terms of 3 or more vehicles in household, the demographic groups most similar to Immigrants from Vietnam are Immigrants from Philippines (23.8%, a difference of 0.060%), Paiute (23.8%, a difference of 0.12%), Chinese (23.9%, a difference of 0.41%), Norwegian (23.9%, a difference of 0.45%), and Scandinavian (23.6%, a difference of 0.65%).
| Demographics | Rating | Rank | 3 or more Vehicles in Household |
| Immigrants from Mexico | 100.0 /100 | #14 | Exceptional 24.6% |
| Hawaiians | 100.0 /100 | #15 | Exceptional 24.3% |
| Basques | 100.0 /100 | #16 | Exceptional 24.3% |
| Koreans | 100.0 /100 | #17 | Exceptional 24.1% |
| Norwegians | 100.0 /100 | #18 | Exceptional 23.9% |
| Chinese | 100.0 /100 | #19 | Exceptional 23.9% |
| Paiute | 100.0 /100 | #20 | Exceptional 23.8% |
| Immigrants from Vietnam | 100.0 /100 | #21 | Exceptional 23.8% |
| Immigrants from Philippines | 100.0 /100 | #22 | Exceptional 23.8% |
| Scandinavians | 100.0 /100 | #23 | Exceptional 23.6% |
| Sri Lankans | 100.0 /100 | #24 | Exceptional 23.6% |
| Immigrants from Central America | 100.0 /100 | #25 | Exceptional 23.4% |
| Mexican American Indians | 100.0 /100 | #26 | Exceptional 23.3% |
| Guamanians/Chamorros | 100.0 /100 | #27 | Exceptional 23.2% |
| Lumbee | 100.0 /100 | #28 | Exceptional 23.1% |
Immigrants from Vietnam 3 or more Vehicles in Household Correlation Summary
| Measurement | Immigrants from Vietnam Data | 3 or more Vehicles in Household Data |
| Minimum | 0.12% | 16.7% |
| Maximum | 52.1% | 63.9% |
| Range | 52.0% | 47.2% |
| Mean | 11.9% | 29.3% |
| Median | 9.1% | 26.6% |
| Interquartile 25% (IQ1) | 4.5% | 23.0% |
| Interquartile 75% (IQ3) | 17.5% | 33.9% |
| Interquartile Range (IQR) | 12.9% | 10.9% |
| Standard Deviation (Sample) | 9.9% | 9.1% |
| Standard Deviation (Population) | 9.8% | 9.0% |
Correlation Details
| Immigrants from Vietnam Percentile | Sample Size | 3 or more Vehicles in Household |
[ 0.0% - 0.5% ] 0.12% | 204,169,349 | 19.4% |
[ 0.0% - 0.5% ] 0.37% | 85,195,793 | 20.4% |
[ 0.5% - 1.0% ] 0.64% | 40,694,509 | 20.7% |
[ 0.5% - 1.0% ] 0.90% | 18,424,495 | 22.6% |
[ 1.0% - 1.5% ] 1.18% | 16,102,462 | 20.0% |
[ 1.0% - 1.5% ] 1.43% | 7,163,281 | 22.4% |
[ 1.5% - 2.0% ] 1.72% | 9,064,901 | 19.7% |
[ 1.5% - 2.0% ] 1.97% | 4,011,132 | 25.2% |
[ 2.0% - 2.5% ] 2.20% | 3,073,613 | 22.8% |
[ 2.0% - 2.5% ] 2.46% | 2,400,258 | 22.7% |
[ 2.5% - 3.0% ] 2.73% | 1,511,722 | 24.2% |
[ 3.0% - 3.5% ] 3.00% | 1,430,150 | 24.4% |
[ 3.0% - 3.5% ] 3.28% | 1,213,301 | 24.9% |
[ 3.0% - 3.5% ] 3.50% | 949,902 | 25.1% |
[ 3.5% - 4.0% ] 3.77% | 665,249 | 21.6% |
[ 4.0% - 4.5% ] 4.07% | 1,151,023 | 29.1% |
[ 4.0% - 4.5% ] 4.31% | 524,011 | 23.8% |
[ 4.5% - 5.0% ] 4.54% | 313,400 | 30.0% |
[ 4.5% - 5.0% ] 4.83% | 395,929 | 23.1% |
[ 5.0% - 5.5% ] 5.03% | 247,215 | 23.6% |
[ 5.0% - 5.5% ] 5.32% | 479,249 | 31.2% |
[ 5.5% - 6.0% ] 5.62% | 325,716 | 22.3% |
[ 5.5% - 6.0% ] 5.90% | 297,884 | 25.0% |
[ 6.0% - 6.5% ] 6.18% | 337,142 | 24.3% |
[ 6.0% - 6.5% ] 6.29% | 42,330 | 26.9% |
[ 6.5% - 7.0% ] 6.64% | 242,629 | 22.4% |
[ 6.5% - 7.0% ] 6.89% | 93,660 | 25.8% |
[ 7.0% - 7.5% ] 7.21% | 185,946 | 31.9% |
[ 7.0% - 7.5% ] 7.39% | 167,688 | 28.2% |
[ 7.5% - 8.0% ] 7.71% | 114,943 | 26.3% |
[ 7.5% - 8.0% ] 7.96% | 275,428 | 30.8% |
[ 8.0% - 8.5% ] 8.13% | 1,107,074 | 28.0% |
[ 8.5% - 9.0% ] 8.51% | 71,794 | 19.8% |
[ 8.5% - 9.0% ] 8.70% | 805 | 40.9% |
[ 8.5% - 9.0% ] 8.95% | 167,797 | 39.2% |
[ 9.0% - 9.5% ] 9.19% | 158,485 | 27.8% |
[ 9.5% - 10.0% ] 9.55% | 183,803 | 29.6% |
[ 9.5% - 10.0% ] 9.70% | 84,862 | 30.8% |
[ 10.0% - 10.5% ] 10.21% | 61,939 | 38.6% |
[ 10.5% - 11.0% ] 10.54% | 44,528 | 33.9% |
[ 11.0% - 11.5% ] 11.11% | 17,842 | 34.5% |
[ 11.0% - 11.5% ] 11.36% | 20,132 | 39.4% |
[ 11.0% - 11.5% ] 11.48% | 61 | 16.7% |
[ 11.5% - 12.0% ] 11.78% | 74,703 | 25.8% |
[ 12.0% - 12.5% ] 12.45% | 40,001 | 29.1% |
[ 13.0% - 13.5% ] 13.22% | 1,241 | 17.3% |
[ 13.0% - 13.5% ] 13.29% | 40,981 | 41.8% |
[ 13.5% - 14.0% ] 13.77% | 31,102 | 24.8% |
[ 13.5% - 14.0% ] 13.95% | 38,271 | 24.5% |
[ 14.0% - 14.5% ] 14.08% | 61,688 | 23.0% |
[ 14.5% - 15.0% ] 14.88% | 142,257 | 32.6% |
[ 16.5% - 17.0% ] 16.59% | 53,476 | 41.9% |
[ 17.0% - 17.5% ] 17.45% | 7,786 | 37.5% |
[ 18.0% - 18.5% ] 18.11% | 113,587 | 34.0% |
[ 18.5% - 19.0% ] 18.62% | 127,330 | 33.5% |
[ 19.0% - 19.5% ] 19.25% | 45,688 | 48.6% |
[ 19.5% - 20.0% ] 19.75% | 1,691 | 20.9% |
[ 20.0% - 20.5% ] 20.49% | 893 | 43.8% |
[ 23.0% - 23.5% ] 23.07% | 171,637 | 34.9% |
[ 24.0% - 24.5% ] 24.01% | 2,916 | 20.0% |
[ 24.5% - 25.0% ] 24.66% | 36,657 | 41.8% |
[ 25.0% - 25.5% ] 25.19% | 401 | 59.6% |
[ 26.0% - 26.5% ] 26.46% | 427 | 63.9% |
[ 26.5% - 27.0% ] 26.81% | 34,188 | 36.0% |
[ 28.5% - 29.0% ] 28.67% | 593 | 23.8% |
[ 28.5% - 29.0% ] 28.68% | 47,549 | 38.9% |
[ 29.0% - 29.5% ] 29.13% | 16,072 | 28.1% |
[ 30.0% - 30.5% ] 30.26% | 181,268 | 32.6% |
[ 31.5% - 32.0% ] 31.56% | 22,622 | 30.8% |
[ 52.0% - 52.5% ] 52.13% | 188 | 24.0% |