Dutch 3 or more Vehicles in Household
COMPARE
Dutch
Select to Compare
3 or more Vehicles in Household
Dutch 3 or more Vehicles in Household
22.9%
3+ VEHICLES AVAILABLE
100.0/ 100
METRIC RATING
38th/ 347
METRIC RANK
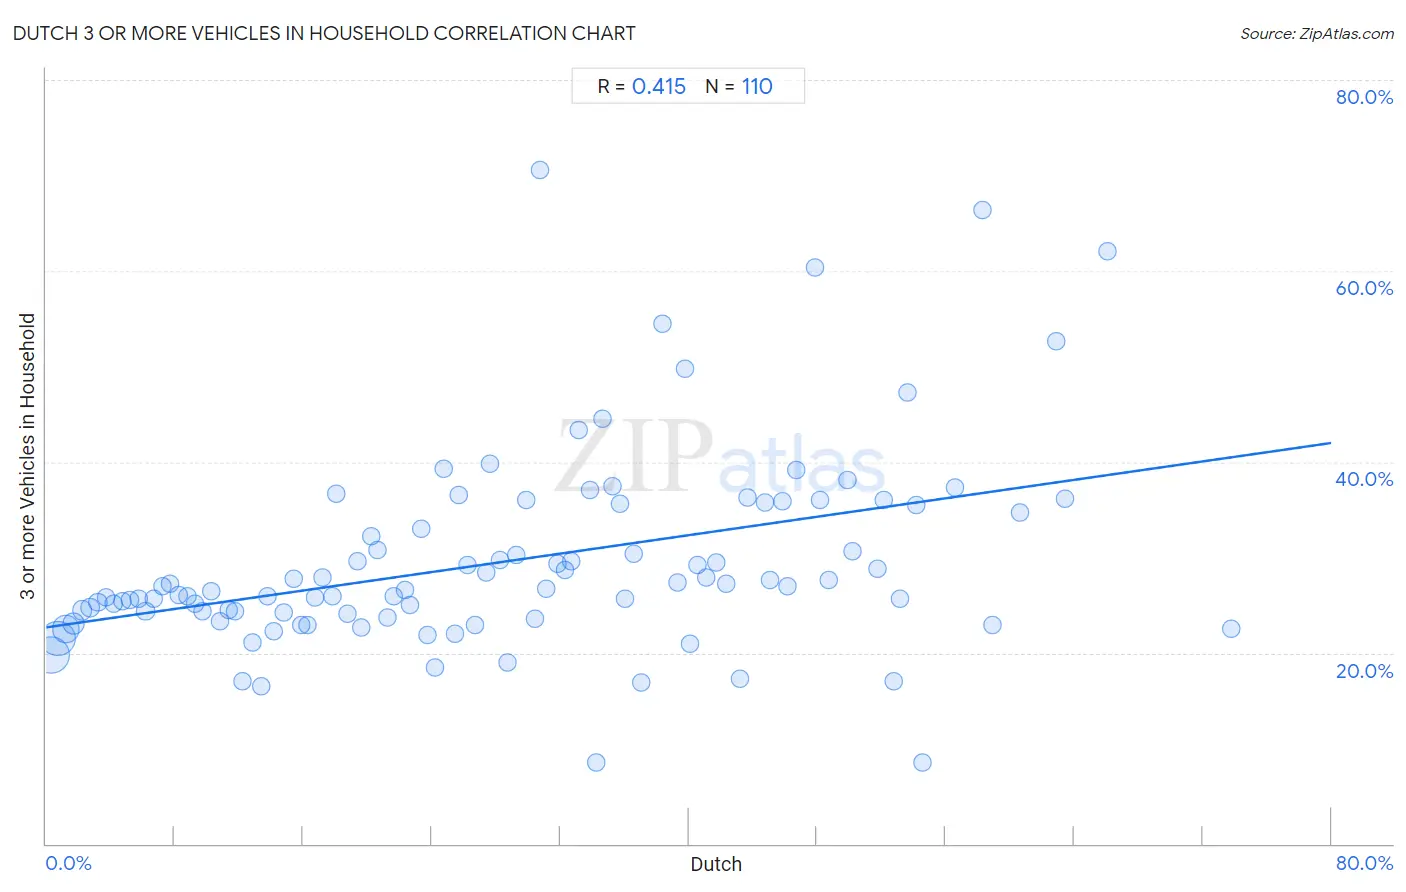
Dutch 3 or more Vehicles in Household Correlation Chart
The statistical analysis conducted on geographies consisting of 553,619,535 people shows a moderate positive correlation between the proportion of Dutch and percentage of households with 3 or more vehicles available in the United States with a correlation coefficient (R) of 0.415 and weighted average of 22.9%. On average, for every 1% (one percent) increase in Dutch within a typical geography, there is an increase of 0.24% in percentage of households with 3 or more vehicles available.
It is essential to understand that the correlation between the percentage of Dutch and percentage of households with 3 or more vehicles available does not imply a direct cause-and-effect relationship. It remains uncertain whether the presence of Dutch influences an upward or downward trend in the level of percentage of households with 3 or more vehicles available within an area, or if Dutch simply ended up residing in those areas with higher or lower levels of percentage of households with 3 or more vehicles available due to other factors.
Demographics Similar to Dutch by 3 or more Vehicles in Household
In terms of 3 or more vehicles in household, the demographic groups most similar to Dutch are Yaqui (22.9%, a difference of 0.10%), Swedish (23.0%, a difference of 0.22%), Cherokee (23.0%, a difference of 0.25%), Choctaw (23.0%, a difference of 0.29%), and Swiss (23.0%, a difference of 0.31%).
| Demographics | Rating | Rank | 3 or more Vehicles in Household |
| English | 100.0 /100 | #31 | Exceptional 23.1% |
| Pueblo | 100.0 /100 | #32 | Exceptional 23.0% |
| Spanish Americans | 100.0 /100 | #33 | Exceptional 23.0% |
| Swiss | 100.0 /100 | #34 | Exceptional 23.0% |
| Choctaw | 100.0 /100 | #35 | Exceptional 23.0% |
| Cherokee | 100.0 /100 | #36 | Exceptional 23.0% |
| Swedes | 100.0 /100 | #37 | Exceptional 23.0% |
| Dutch | 100.0 /100 | #38 | Exceptional 22.9% |
| Yaqui | 100.0 /100 | #39 | Exceptional 22.9% |
| Europeans | 100.0 /100 | #40 | Exceptional 22.9% |
| Germans | 100.0 /100 | #41 | Exceptional 22.7% |
| Natives/Alaskans | 100.0 /100 | #42 | Exceptional 22.7% |
| Osage | 100.0 /100 | #43 | Exceptional 22.7% |
| Cheyenne | 100.0 /100 | #44 | Exceptional 22.7% |
| Ute | 100.0 /100 | #45 | Exceptional 22.7% |
Dutch 3 or more Vehicles in Household Correlation Summary
| Measurement | Dutch Data | 3 or more Vehicles in Household Data |
| Minimum | 0.27% | 8.5% |
| Maximum | 73.8% | 70.6% |
| Range | 73.5% | 62.1% |
| Mean | 28.7% | 29.6% |
| Median | 27.5% | 26.8% |
| Interquartile 25% (IQ1) | 13.8% | 24.1% |
| Interquartile 75% (IQ3) | 42.4% | 35.4% |
| Interquartile Range (IQR) | 28.6% | 11.3% |
| Standard Deviation (Sample) | 17.9% | 10.4% |
| Standard Deviation (Population) | 17.8% | 10.4% |
Correlation Details
| Dutch Percentile | Sample Size | 3 or more Vehicles in Household |
[ 0.0% - 0.5% ] 0.27% | 192,792,839 | 19.7% |
[ 0.5% - 1.0% ] 0.74% | 173,259,570 | 21.5% |
[ 1.0% - 1.5% ] 1.22% | 97,744,523 | 22.5% |
[ 1.5% - 2.0% ] 1.72% | 42,321,747 | 23.0% |
[ 2.0% - 2.5% ] 2.23% | 19,158,123 | 24.4% |
[ 2.5% - 3.0% ] 2.71% | 9,707,841 | 24.8% |
[ 3.0% - 3.5% ] 3.23% | 5,244,022 | 25.3% |
[ 3.5% - 4.0% ] 3.73% | 3,020,277 | 25.8% |
[ 4.0% - 4.5% ] 4.22% | 1,895,585 | 25.1% |
[ 4.5% - 5.0% ] 4.75% | 1,321,854 | 25.4% |
[ 5.0% - 5.5% ] 5.24% | 918,293 | 25.5% |
[ 5.5% - 6.0% ] 5.77% | 796,322 | 25.6% |
[ 6.0% - 6.5% ] 6.18% | 606,403 | 24.4% |
[ 6.5% - 7.0% ] 6.72% | 409,662 | 25.6% |
[ 7.0% - 7.5% ] 7.23% | 375,263 | 27.0% |
[ 7.5% - 8.0% ] 7.70% | 335,062 | 27.3% |
[ 8.0% - 8.5% ] 8.24% | 256,800 | 26.1% |
[ 8.5% - 9.0% ] 8.78% | 345,640 | 25.9% |
[ 9.0% - 9.5% ] 9.25% | 269,515 | 25.1% |
[ 9.5% - 10.0% ] 9.73% | 149,984 | 24.4% |
[ 10.0% - 10.5% ] 10.26% | 194,129 | 26.5% |
[ 10.5% - 11.0% ] 10.78% | 128,227 | 23.4% |
[ 11.0% - 11.5% ] 11.38% | 102,377 | 24.5% |
[ 11.5% - 12.0% ] 11.79% | 83,016 | 24.4% |
[ 12.0% - 12.5% ] 12.20% | 265,318 | 17.1% |
[ 12.5% - 13.0% ] 12.81% | 114,169 | 21.0% |
[ 13.0% - 13.5% ] 13.40% | 86,690 | 16.4% |
[ 13.5% - 14.0% ] 13.78% | 85,350 | 25.9% |
[ 14.0% - 14.5% ] 14.16% | 67,644 | 22.2% |
[ 14.5% - 15.0% ] 14.76% | 105,623 | 24.3% |
[ 15.0% - 15.5% ] 15.40% | 49,710 | 27.8% |
[ 15.5% - 16.0% ] 15.84% | 179,996 | 22.9% |
[ 16.0% - 16.5% ] 16.23% | 189,558 | 23.0% |
[ 16.5% - 17.0% ] 16.77% | 25,224 | 25.7% |
[ 17.0% - 17.5% ] 17.21% | 60,586 | 27.9% |
[ 17.5% - 18.0% ] 17.80% | 78,644 | 26.0% |
[ 18.0% - 18.5% ] 18.08% | 46,945 | 36.7% |
[ 18.5% - 19.0% ] 18.73% | 35,782 | 24.1% |
[ 19.0% - 19.5% ] 19.37% | 64,419 | 29.6% |
[ 19.5% - 20.0% ] 19.61% | 20,221 | 22.6% |
[ 20.0% - 20.5% ] 20.24% | 10,516 | 32.2% |
[ 20.5% - 21.0% ] 20.66% | 16,294 | 30.7% |
[ 21.0% - 21.5% ] 21.26% | 6,944 | 23.7% |
[ 21.5% - 22.0% ] 21.67% | 3,779 | 26.0% |
[ 22.0% - 22.5% ] 22.33% | 38,028 | 26.6% |
[ 22.5% - 23.0% ] 22.65% | 84,471 | 25.0% |
[ 23.0% - 23.5% ] 23.31% | 5,852 | 33.0% |
[ 23.5% - 24.0% ] 23.76% | 17,867 | 21.9% |
[ 24.0% - 24.5% ] 24.23% | 50,002 | 18.5% |
[ 24.5% - 25.0% ] 24.78% | 1,921 | 39.3% |
[ 25.0% - 25.5% ] 25.47% | 33,366 | 22.0% |
[ 25.5% - 26.0% ] 25.69% | 2,733 | 36.5% |
[ 26.0% - 26.5% ] 26.23% | 8,551 | 29.2% |
[ 26.5% - 27.0% ] 26.68% | 30,309 | 22.9% |
[ 27.0% - 27.5% ] 27.40% | 21,758 | 28.5% |
[ 27.5% - 28.0% ] 27.63% | 5,515 | 39.9% |
[ 28.0% - 28.5% ] 28.21% | 4,353 | 29.7% |
[ 28.5% - 29.0% ] 28.73% | 63,752 | 19.1% |
[ 29.0% - 29.5% ] 29.27% | 17,792 | 30.3% |
[ 29.5% - 30.0% ] 29.86% | 1,383 | 36.0% |
[ 30.0% - 30.5% ] 30.41% | 7,662 | 23.6% |
[ 30.5% - 31.0% ] 30.77% | 156 | 70.6% |
[ 31.0% - 31.5% ] 31.13% | 30,521 | 26.7% |
[ 31.5% - 32.0% ] 31.79% | 7,797 | 29.4% |
[ 32.0% - 32.5% ] 32.30% | 2,105 | 28.7% |
[ 32.5% - 33.0% ] 32.72% | 2,610 | 29.7% |
[ 33.0% - 33.5% ] 33.19% | 467 | 43.3% |
[ 33.5% - 34.0% ] 33.87% | 1,435 | 37.0% |
[ 34.0% - 34.5% ] 34.26% | 108 | 8.5% |
[ 34.5% - 35.0% ] 34.59% | 899 | 44.5% |
[ 35.0% - 35.5% ] 35.29% | 1,159 | 37.5% |
[ 35.5% - 36.0% ] 35.71% | 5,315 | 35.6% |
[ 36.0% - 36.5% ] 36.07% | 28,312 | 25.6% |
[ 36.5% - 37.0% ] 36.60% | 3,989 | 30.4% |
[ 37.0% - 37.5% ] 37.04% | 1,142 | 16.9% |
[ 38.0% - 38.5% ] 38.34% | 313 | 54.4% |
[ 39.0% - 39.5% ] 39.32% | 857 | 27.4% |
[ 39.5% - 40.0% ] 39.75% | 478 | 49.7% |
[ 40.0% - 40.5% ] 40.09% | 23,394 | 20.9% |
[ 40.5% - 41.0% ] 40.54% | 30,571 | 29.2% |
[ 41.0% - 41.5% ] 41.12% | 40,985 | 27.9% |
[ 41.5% - 42.0% ] 41.74% | 5,326 | 29.5% |
[ 42.0% - 42.5% ] 42.37% | 7,116 | 27.2% |
[ 43.0% - 43.5% ] 43.16% | 7,906 | 17.3% |
[ 43.5% - 44.0% ] 43.69% | 444 | 36.3% |
[ 44.5% - 45.0% ] 44.78% | 8,483 | 35.7% |
[ 45.0% - 45.5% ] 45.08% | 4,887 | 27.6% |
[ 45.5% - 46.0% ] 45.83% | 408 | 35.9% |
[ 46.0% - 46.5% ] 46.14% | 11,008 | 27.0% |
[ 46.5% - 47.0% ] 46.66% | 1,749 | 39.1% |
[ 47.5% - 48.0% ] 47.83% | 1,729 | 60.3% |
[ 48.0% - 48.5% ] 48.18% | 1,509 | 36.0% |
[ 48.5% - 49.0% ] 48.68% | 7,130 | 27.7% |
[ 49.5% - 50.0% ] 49.85% | 1,362 | 38.1% |
[ 50.0% - 50.5% ] 50.22% | 20,042 | 30.7% |
[ 51.5% - 52.0% ] 51.76% | 1,022 | 28.9% |
[ 52.0% - 52.5% ] 52.18% | 1,470 | 36.1% |
[ 52.5% - 53.0% ] 52.78% | 1,114 | 17.0% |
[ 53.0% - 53.5% ] 53.12% | 642 | 25.6% |
[ 53.5% - 54.0% ] 53.63% | 179 | 47.3% |
[ 54.0% - 54.5% ] 54.14% | 2,087 | 35.4% |
[ 54.5% - 55.0% ] 54.55% | 473 | 8.5% |
[ 56.5% - 57.0% ] 56.59% | 751 | 37.3% |
[ 58.0% - 58.5% ] 58.30% | 578 | 66.3% |
[ 58.5% - 59.0% ] 58.93% | 1,064 | 22.9% |
[ 60.5% - 61.0% ] 60.59% | 477 | 34.7% |
[ 62.5% - 63.0% ] 62.87% | 676 | 52.7% |
[ 63.0% - 63.5% ] 63.44% | 1,012 | 36.1% |
[ 66.0% - 66.5% ] 66.10% | 351 | 62.0% |
[ 73.5% - 74.0% ] 73.81% | 126 | 22.6% |