Dutch Disability Age 5 to 17
COMPARE
Dutch
Select to Compare
Disability Age 5 to 17
Dutch Disability Age 5 to 17
6.0%
DISABILITY | AGE 5 TO 17
0.2/ 100
METRIC RATING
275th/ 347
METRIC RANK
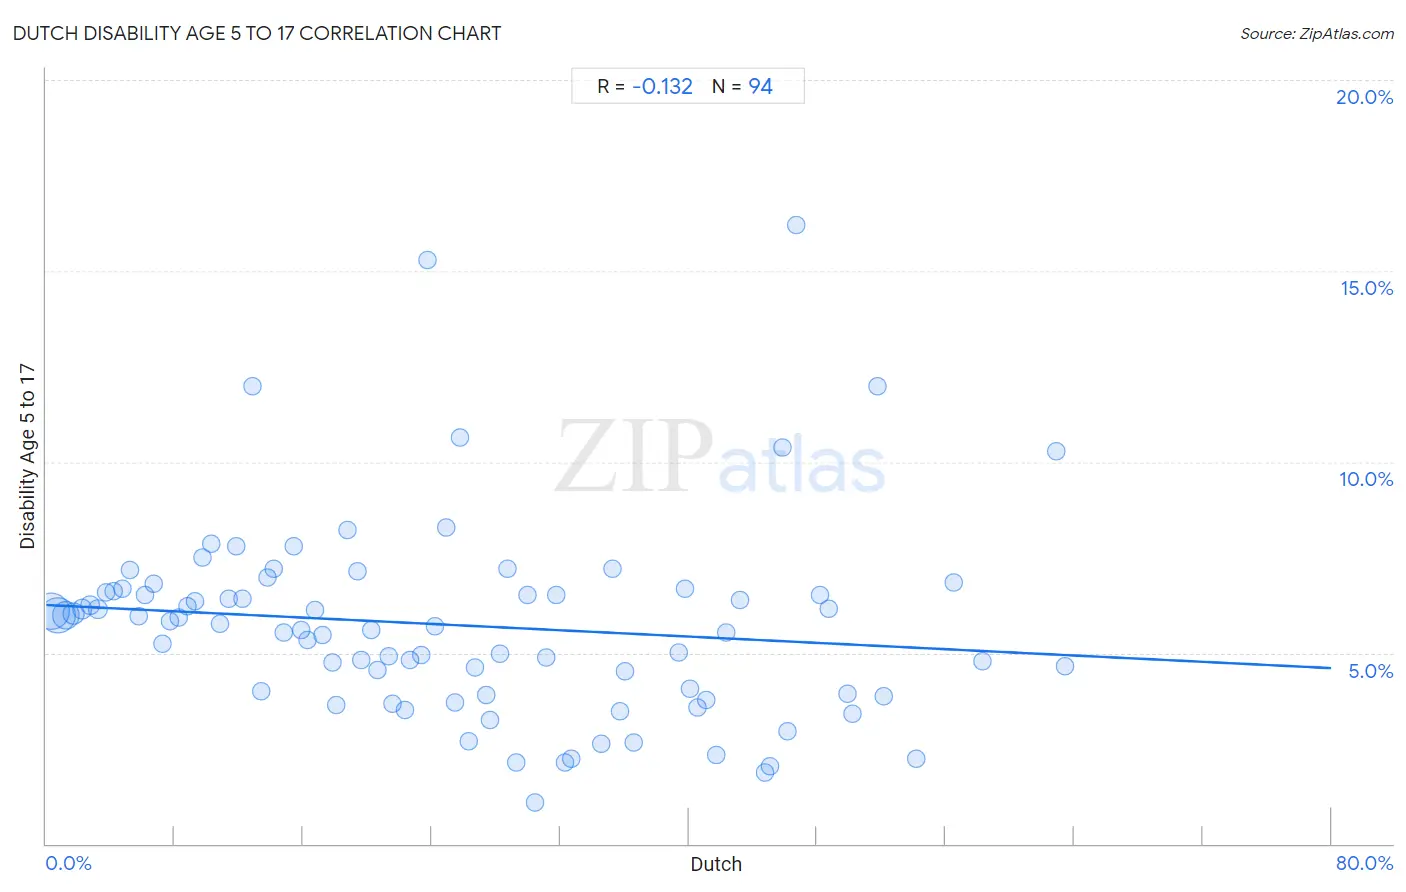
Dutch Disability Age 5 to 17 Correlation Chart
The statistical analysis conducted on geographies consisting of 542,324,990 people shows a poor negative correlation between the proportion of Dutch and percentage of population with a disability between the ages 5 and 17 in the United States with a correlation coefficient (R) of -0.132 and weighted average of 6.0%. On average, for every 1% (one percent) increase in Dutch within a typical geography, there is a decrease of 0.021% in percentage of population with a disability between the ages 5 and 17.
It is essential to understand that the correlation between the percentage of Dutch and percentage of population with a disability between the ages 5 and 17 does not imply a direct cause-and-effect relationship. It remains uncertain whether the presence of Dutch influences an upward or downward trend in the level of percentage of population with a disability between the ages 5 and 17 within an area, or if Dutch simply ended up residing in those areas with higher or lower levels of percentage of population with a disability between the ages 5 and 17 due to other factors.
Demographics Similar to Dutch by Disability Age 5 to 17
In terms of disability age 5 to 17, the demographic groups most similar to Dutch are Cheyenne (6.0%, a difference of 0.11%), Japanese (6.1%, a difference of 0.11%), Alaska Native (6.0%, a difference of 0.22%), Finnish (6.0%, a difference of 0.27%), and Immigrants from Zaire (6.0%, a difference of 0.30%).
| Demographics | Rating | Rank | Disability Age 5 to 17 |
| Sioux | 0.4 /100 | #268 | Tragic 6.0% |
| Liberians | 0.4 /100 | #269 | Tragic 6.0% |
| Immigrants from Somalia | 0.4 /100 | #270 | Tragic 6.0% |
| Immigrants from Zaire | 0.2 /100 | #271 | Tragic 6.0% |
| Finns | 0.2 /100 | #272 | Tragic 6.0% |
| Alaska Natives | 0.2 /100 | #273 | Tragic 6.0% |
| Cheyenne | 0.2 /100 | #274 | Tragic 6.0% |
| Dutch | 0.2 /100 | #275 | Tragic 6.0% |
| Japanese | 0.1 /100 | #276 | Tragic 6.1% |
| Puget Sound Salish | 0.1 /100 | #277 | Tragic 6.1% |
| Immigrants from Liberia | 0.1 /100 | #278 | Tragic 6.1% |
| Immigrants from Jamaica | 0.1 /100 | #279 | Tragic 6.1% |
| Portuguese | 0.1 /100 | #280 | Tragic 6.1% |
| Scottish | 0.0 /100 | #281 | Tragic 6.1% |
| Germans | 0.0 /100 | #282 | Tragic 6.1% |
Dutch Disability Age 5 to 17 Correlation Summary
| Measurement | Dutch Data | Disability Age 5 to 17 Data |
| Minimum | 0.27% | 1.1% |
| Maximum | 63.4% | 16.2% |
| Range | 63.2% | 15.1% |
| Mean | 25.4% | 5.7% |
| Median | 23.5% | 5.7% |
| Interquartile 25% (IQ1) | 11.8% | 3.9% |
| Interquartile 75% (IQ3) | 39.4% | 6.6% |
| Interquartile Range (IQR) | 27.6% | 2.7% |
| Standard Deviation (Sample) | 16.4% | 2.6% |
| Standard Deviation (Population) | 16.4% | 2.6% |
Correlation Details
| Dutch Percentile | Sample Size | Disability Age 5 to 17 |
[ 0.0% - 0.5% ] 0.27% | 190,479,151 | 6.1% |
[ 0.5% - 1.0% ] 0.74% | 170,603,165 | 6.0% |
[ 1.0% - 1.5% ] 1.22% | 96,042,618 | 6.0% |
[ 1.5% - 2.0% ] 1.72% | 40,956,762 | 6.0% |
[ 2.0% - 2.5% ] 2.23% | 18,253,697 | 6.1% |
[ 2.5% - 3.0% ] 2.71% | 9,120,104 | 6.2% |
[ 3.0% - 3.5% ] 3.23% | 4,887,569 | 6.1% |
[ 3.5% - 4.0% ] 3.73% | 2,737,562 | 6.6% |
[ 4.0% - 4.5% ] 4.21% | 1,678,835 | 6.6% |
[ 4.5% - 5.0% ] 4.75% | 1,108,152 | 6.7% |
[ 5.0% - 5.5% ] 5.24% | 811,820 | 7.2% |
[ 5.5% - 6.0% ] 5.78% | 706,906 | 6.0% |
[ 6.0% - 6.5% ] 6.18% | 535,436 | 6.5% |
[ 6.5% - 7.0% ] 6.72% | 364,315 | 6.8% |
[ 7.0% - 7.5% ] 7.22% | 321,979 | 5.3% |
[ 7.5% - 8.0% ] 7.69% | 298,350 | 5.8% |
[ 8.0% - 8.5% ] 8.24% | 234,199 | 5.9% |
[ 8.5% - 9.0% ] 8.78% | 315,235 | 6.2% |
[ 9.0% - 9.5% ] 9.25% | 241,330 | 6.4% |
[ 9.5% - 10.0% ] 9.72% | 137,752 | 7.5% |
[ 10.0% - 10.5% ] 10.27% | 179,109 | 7.8% |
[ 10.5% - 11.0% ] 10.79% | 116,148 | 5.8% |
[ 11.0% - 11.5% ] 11.39% | 92,383 | 6.4% |
[ 11.5% - 12.0% ] 11.79% | 62,853 | 7.8% |
[ 12.0% - 12.5% ] 12.19% | 255,090 | 6.4% |
[ 12.5% - 13.0% ] 12.81% | 98,272 | 12.0% |
[ 13.0% - 13.5% ] 13.41% | 82,296 | 4.0% |
[ 13.5% - 14.0% ] 13.79% | 77,542 | 7.0% |
[ 14.0% - 14.5% ] 14.16% | 64,235 | 7.2% |
[ 14.5% - 15.0% ] 14.76% | 102,268 | 5.5% |
[ 15.0% - 15.5% ] 15.41% | 46,924 | 7.8% |
[ 15.5% - 16.0% ] 15.84% | 172,475 | 5.6% |
[ 16.0% - 16.5% ] 16.23% | 183,125 | 5.3% |
[ 16.5% - 17.0% ] 16.76% | 19,543 | 6.1% |
[ 17.0% - 17.5% ] 17.20% | 53,032 | 5.5% |
[ 17.5% - 18.0% ] 17.81% | 74,758 | 4.8% |
[ 18.0% - 18.5% ] 18.07% | 44,582 | 3.6% |
[ 18.5% - 19.0% ] 18.74% | 33,017 | 8.2% |
[ 19.0% - 19.5% ] 19.37% | 64,232 | 7.1% |
[ 19.5% - 20.0% ] 19.59% | 18,642 | 4.8% |
[ 20.0% - 20.5% ] 20.24% | 7,721 | 5.6% |
[ 20.5% - 21.0% ] 20.66% | 15,798 | 4.6% |
[ 21.0% - 21.5% ] 21.36% | 2,271 | 4.9% |
[ 21.5% - 22.0% ] 21.58% | 2,674 | 3.7% |
[ 22.0% - 22.5% ] 22.34% | 33,684 | 3.5% |
[ 22.5% - 23.0% ] 22.65% | 82,073 | 4.8% |
[ 23.0% - 23.5% ] 23.35% | 3,958 | 4.9% |
[ 23.5% - 24.0% ] 23.75% | 15,375 | 15.3% |
[ 24.0% - 24.5% ] 24.23% | 49,511 | 5.7% |
[ 24.5% - 25.0% ] 24.90% | 526 | 8.3% |
[ 25.0% - 25.5% ] 25.47% | 32,903 | 3.7% |
[ 25.5% - 26.0% ] 25.74% | 1,966 | 10.6% |
[ 26.0% - 26.5% ] 26.27% | 6,250 | 2.7% |
[ 26.5% - 27.0% ] 26.68% | 27,564 | 4.6% |
[ 27.0% - 27.5% ] 27.41% | 20,877 | 3.9% |
[ 27.5% - 28.0% ] 27.63% | 5,227 | 3.2% |
[ 28.0% - 28.5% ] 28.25% | 3,066 | 5.0% |
[ 28.5% - 29.0% ] 28.73% | 63,717 | 7.2% |
[ 29.0% - 29.5% ] 29.27% | 17,225 | 2.1% |
[ 29.5% - 30.0% ] 29.93% | 568 | 6.5% |
[ 30.0% - 30.5% ] 30.43% | 6,358 | 1.1% |
[ 31.0% - 31.5% ] 31.13% | 30,444 | 4.9% |
[ 31.5% - 32.0% ] 31.78% | 7,318 | 6.5% |
[ 32.0% - 32.5% ] 32.30% | 1,712 | 2.1% |
[ 32.5% - 33.0% ] 32.68% | 1,674 | 2.2% |
[ 34.5% - 35.0% ] 34.59% | 691 | 2.6% |
[ 35.0% - 35.5% ] 35.27% | 879 | 7.2% |
[ 35.5% - 36.0% ] 35.72% | 4,815 | 3.5% |
[ 36.0% - 36.5% ] 36.06% | 27,909 | 4.5% |
[ 36.5% - 37.0% ] 36.59% | 3,066 | 2.7% |
[ 39.0% - 39.5% ] 39.36% | 719 | 5.0% |
[ 39.5% - 40.0% ] 39.75% | 478 | 6.7% |
[ 40.0% - 40.5% ] 40.08% | 17,314 | 4.0% |
[ 40.5% - 41.0% ] 40.54% | 30,231 | 3.6% |
[ 41.0% - 41.5% ] 41.12% | 40,410 | 3.8% |
[ 41.5% - 42.0% ] 41.74% | 5,218 | 2.3% |
[ 42.0% - 42.5% ] 42.37% | 6,988 | 5.5% |
[ 43.0% - 43.5% ] 43.15% | 7,633 | 6.4% |
[ 44.5% - 45.0% ] 44.78% | 8,483 | 1.9% |
[ 45.0% - 45.5% ] 45.08% | 4,887 | 2.0% |
[ 45.5% - 46.0% ] 45.87% | 351 | 10.4% |
[ 46.0% - 46.5% ] 46.12% | 10,567 | 2.9% |
[ 46.5% - 47.0% ] 46.65% | 1,629 | 16.2% |
[ 48.0% - 48.5% ] 48.17% | 1,478 | 6.5% |
[ 48.5% - 49.0% ] 48.68% | 7,130 | 6.2% |
[ 49.5% - 50.0% ] 49.88% | 1,211 | 3.9% |
[ 50.0% - 50.5% ] 50.22% | 19,798 | 3.4% |
[ 51.5% - 52.0% ] 51.76% | 1,022 | 12.0% |
[ 52.0% - 52.5% ] 52.15% | 1,256 | 3.9% |
[ 54.0% - 54.5% ] 54.14% | 2,063 | 2.2% |
[ 56.5% - 57.0% ] 56.52% | 575 | 6.8% |
[ 58.0% - 58.5% ] 58.30% | 578 | 4.8% |
[ 62.5% - 63.0% ] 62.87% | 676 | 10.3% |
[ 63.0% - 63.5% ] 63.44% | 1,012 | 4.7% |