Dutch Disability
COMPARE
Dutch
Select to Compare
Disability
Dutch Disability
12.8%
DISABILITY
0.0/ 100
METRIC RATING
277th/ 347
METRIC RANK
Dutch Disability Correlation Chart
The statistical analysis conducted on geographies consisting of 554,259,467 people shows a poor positive correlation between the proportion of Dutch and percentage of population with a disability in the United States with a correlation coefficient (R) of 0.116 and weighted average of 12.8%. On average, for every 1% (one percent) increase in Dutch within a typical geography, there is an increase of 0.033% in percentage of population with a disability.
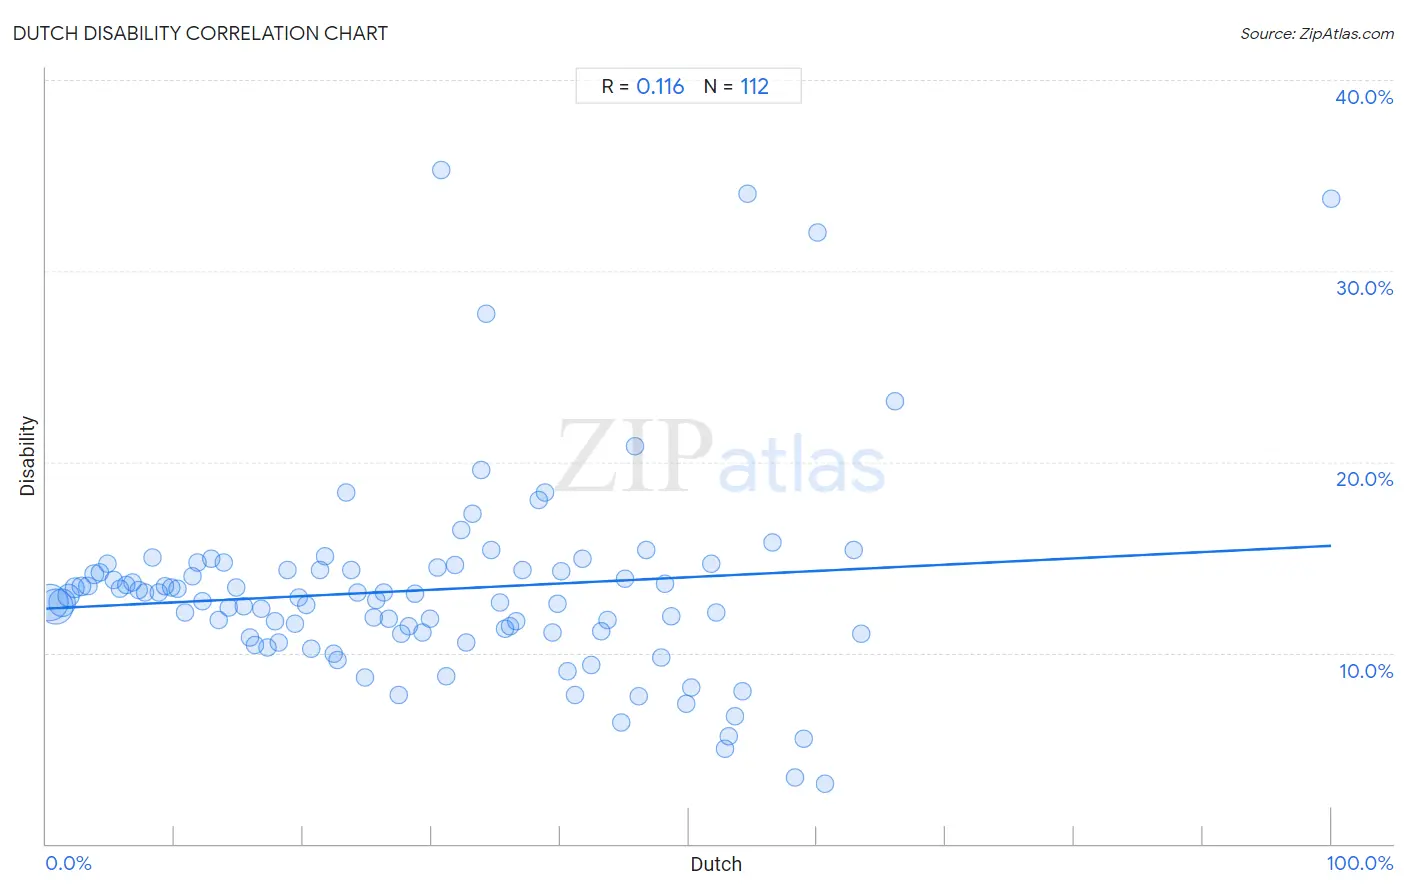
It is essential to understand that the correlation between the percentage of Dutch and percentage of population with a disability does not imply a direct cause-and-effect relationship. It remains uncertain whether the presence of Dutch influences an upward or downward trend in the level of percentage of population with a disability within an area, or if Dutch simply ended up residing in those areas with higher or lower levels of percentage of population with a disability due to other factors.
Demographics Similar to Dutch by Disability
In terms of disability, the demographic groups most similar to Dutch are Hmong (12.8%, a difference of 0.050%), German (12.8%, a difference of 0.17%), Sioux (12.8%, a difference of 0.20%), Fijian (12.8%, a difference of 0.26%), and Nepalese (12.8%, a difference of 0.28%).
| Demographics | Rating | Rank | Disability |
| Portuguese | 0.1 /100 | #270 | Tragic 12.6% |
| Immigrants from Yemen | 0.1 /100 | #271 | Tragic 12.6% |
| Dominicans | 0.0 /100 | #272 | Tragic 12.7% |
| Finns | 0.0 /100 | #273 | Tragic 12.7% |
| Nepalese | 0.0 /100 | #274 | Tragic 12.8% |
| Sioux | 0.0 /100 | #275 | Tragic 12.8% |
| Hmong | 0.0 /100 | #276 | Tragic 12.8% |
| Dutch | 0.0 /100 | #277 | Tragic 12.8% |
| Germans | 0.0 /100 | #278 | Tragic 12.8% |
| Fijians | 0.0 /100 | #279 | Tragic 12.8% |
| Spanish | 0.0 /100 | #280 | Tragic 12.8% |
| Immigrants from Portugal | 0.0 /100 | #281 | Tragic 12.9% |
| Scottish | 0.0 /100 | #282 | Tragic 12.9% |
| Irish | 0.0 /100 | #283 | Tragic 12.9% |
| Welsh | 0.0 /100 | #284 | Tragic 12.9% |
Dutch Disability Correlation Summary
| Measurement | Dutch Data | Disability Data |
| Minimum | 0.27% | 3.1% |
| Maximum | 100.0% | 35.3% |
| Range | 99.7% | 32.1% |
| Mean | 29.3% | 13.3% |
| Median | 27.9% | 12.8% |
| Interquartile 25% (IQ1) | 14.0% | 11.0% |
| Interquartile 75% (IQ3) | 42.8% | 14.4% |
| Interquartile Range (IQR) | 28.8% | 3.3% |
| Standard Deviation (Sample) | 18.7% | 5.3% |
| Standard Deviation (Population) | 18.6% | 5.3% |
Correlation Details
| Dutch Percentile | Sample Size | Disability |
[ 0.0% - 0.5% ] 0.27% | 193,047,650 | 12.6% |
[ 0.5% - 1.0% ] 0.74% | 173,447,695 | 12.4% |
[ 1.0% - 1.5% ] 1.22% | 97,820,678 | 12.6% |
[ 1.5% - 2.0% ] 1.72% | 42,369,364 | 13.0% |
[ 2.0% - 2.5% ] 2.23% | 19,196,159 | 13.4% |
[ 2.5% - 3.0% ] 2.71% | 9,712,886 | 13.5% |
[ 3.0% - 3.5% ] 3.23% | 5,249,280 | 13.5% |
[ 3.5% - 4.0% ] 3.73% | 3,027,792 | 14.1% |
[ 4.0% - 4.5% ] 4.22% | 1,895,104 | 14.2% |
[ 4.5% - 5.0% ] 4.75% | 1,324,300 | 14.7% |
[ 5.0% - 5.5% ] 5.24% | 918,636 | 13.8% |
[ 5.5% - 6.0% ] 5.77% | 798,736 | 13.4% |
[ 6.0% - 6.5% ] 6.19% | 611,774 | 13.5% |
[ 6.5% - 7.0% ] 6.72% | 410,882 | 13.7% |
[ 7.0% - 7.5% ] 7.23% | 377,253 | 13.3% |
[ 7.5% - 8.0% ] 7.70% | 336,352 | 13.1% |
[ 8.0% - 8.5% ] 8.24% | 257,796 | 15.0% |
[ 8.5% - 9.0% ] 8.78% | 345,640 | 13.2% |
[ 9.0% - 9.5% ] 9.25% | 270,680 | 13.5% |
[ 9.5% - 10.0% ] 9.73% | 150,460 | 13.4% |
[ 10.0% - 10.5% ] 10.26% | 193,922 | 13.3% |
[ 10.5% - 11.0% ] 10.78% | 128,359 | 12.1% |
[ 11.0% - 11.5% ] 11.38% | 102,262 | 14.0% |
[ 11.5% - 12.0% ] 11.79% | 83,144 | 14.7% |
[ 12.0% - 12.5% ] 12.20% | 265,222 | 12.7% |
[ 12.5% - 13.0% ] 12.81% | 114,169 | 14.9% |
[ 13.0% - 13.5% ] 13.40% | 87,682 | 11.7% |
[ 13.5% - 14.0% ] 13.78% | 85,202 | 14.7% |
[ 14.0% - 14.5% ] 14.16% | 68,345 | 12.4% |
[ 14.5% - 15.0% ] 14.76% | 104,568 | 13.4% |
[ 15.0% - 15.5% ] 15.40% | 49,867 | 12.4% |
[ 15.5% - 16.0% ] 15.84% | 180,097 | 10.8% |
[ 16.0% - 16.5% ] 16.23% | 189,954 | 10.4% |
[ 16.5% - 17.0% ] 16.77% | 25,393 | 12.3% |
[ 17.0% - 17.5% ] 17.21% | 58,834 | 10.3% |
[ 17.5% - 18.0% ] 17.80% | 78,644 | 11.7% |
[ 18.0% - 18.5% ] 18.08% | 46,840 | 10.5% |
[ 18.5% - 19.0% ] 18.73% | 35,766 | 14.3% |
[ 19.0% - 19.5% ] 19.37% | 64,883 | 11.5% |
[ 19.5% - 20.0% ] 19.61% | 20,221 | 12.9% |
[ 20.0% - 20.5% ] 20.23% | 10,815 | 12.5% |
[ 20.5% - 21.0% ] 20.66% | 16,414 | 10.2% |
[ 21.0% - 21.5% ] 21.26% | 6,944 | 14.4% |
[ 21.5% - 22.0% ] 21.64% | 3,502 | 15.1% |
[ 22.0% - 22.5% ] 22.33% | 37,933 | 9.9% |
[ 22.5% - 23.0% ] 22.65% | 84,471 | 9.6% |
[ 23.0% - 23.5% ] 23.31% | 5,852 | 18.4% |
[ 23.5% - 24.0% ] 23.77% | 18,176 | 14.3% |
[ 24.0% - 24.5% ] 24.23% | 50,002 | 13.1% |
[ 24.5% - 25.0% ] 24.78% | 2,119 | 8.7% |
[ 25.0% - 25.5% ] 25.47% | 33,691 | 11.9% |
[ 25.5% - 26.0% ] 25.69% | 2,783 | 12.8% |
[ 26.0% - 26.5% ] 26.23% | 8,570 | 13.2% |
[ 26.5% - 27.0% ] 26.68% | 30,309 | 11.8% |
[ 27.0% - 27.5% ] 27.40% | 21,817 | 7.8% |
[ 27.5% - 28.0% ] 27.63% | 5,515 | 11.0% |
[ 28.0% - 28.5% ] 28.22% | 4,182 | 11.4% |
[ 28.5% - 29.0% ] 28.73% | 63,717 | 13.1% |
[ 29.0% - 29.5% ] 29.27% | 17,727 | 11.0% |
[ 29.5% - 30.0% ] 29.86% | 1,393 | 11.8% |
[ 30.0% - 30.5% ] 30.41% | 7,662 | 14.5% |
[ 30.5% - 31.0% ] 30.77% | 156 | 35.3% |
[ 31.0% - 31.5% ] 31.13% | 30,575 | 8.8% |
[ 31.5% - 32.0% ] 31.79% | 7,797 | 14.6% |
[ 32.0% - 32.5% ] 32.30% | 2,139 | 16.4% |
[ 32.5% - 33.0% ] 32.72% | 2,610 | 10.6% |
[ 33.0% - 33.5% ] 33.14% | 353 | 17.3% |
[ 33.5% - 34.0% ] 33.87% | 1,435 | 19.6% |
[ 34.0% - 34.5% ] 34.26% | 108 | 27.8% |
[ 34.5% - 35.0% ] 34.59% | 876 | 15.4% |
[ 35.0% - 35.5% ] 35.29% | 1,159 | 12.7% |
[ 35.5% - 36.0% ] 35.71% | 5,315 | 11.3% |
[ 36.0% - 36.5% ] 36.07% | 28,428 | 11.4% |
[ 36.5% - 37.0% ] 36.60% | 3,989 | 11.7% |
[ 37.0% - 37.5% ] 37.04% | 1,142 | 14.4% |
[ 38.0% - 38.5% ] 38.32% | 428 | 18.0% |
[ 38.5% - 39.0% ] 38.78% | 49 | 18.4% |
[ 39.0% - 39.5% ] 39.37% | 851 | 11.0% |
[ 39.5% - 40.0% ] 39.75% | 478 | 12.6% |
[ 40.0% - 40.5% ] 40.09% | 23,394 | 14.2% |
[ 40.5% - 41.0% ] 40.54% | 30,571 | 9.0% |
[ 41.0% - 41.5% ] 41.12% | 41,002 | 7.8% |
[ 41.5% - 42.0% ] 41.74% | 5,326 | 14.9% |
[ 42.0% - 42.5% ] 42.37% | 7,116 | 9.3% |
[ 43.0% - 43.5% ] 43.16% | 7,906 | 11.2% |
[ 43.5% - 44.0% ] 43.69% | 444 | 11.7% |
[ 44.5% - 45.0% ] 44.78% | 8,483 | 6.3% |
[ 45.0% - 45.5% ] 45.08% | 4,887 | 13.9% |
[ 45.5% - 46.0% ] 45.83% | 408 | 20.8% |
[ 46.0% - 46.5% ] 46.13% | 10,651 | 7.7% |
[ 46.5% - 47.0% ] 46.66% | 1,749 | 15.4% |
[ 47.5% - 48.0% ] 47.83% | 1,616 | 9.8% |
[ 48.0% - 48.5% ] 48.18% | 1,509 | 13.6% |
[ 48.5% - 49.0% ] 48.68% | 7,130 | 11.9% |
[ 49.5% - 50.0% ] 49.85% | 1,360 | 7.4% |
[ 50.0% - 50.5% ] 50.22% | 20,042 | 8.2% |
[ 51.5% - 52.0% ] 51.76% | 1,022 | 14.7% |
[ 52.0% - 52.5% ] 52.18% | 1,470 | 12.1% |
[ 52.5% - 53.0% ] 52.80% | 1,017 | 4.9% |
[ 53.0% - 53.5% ] 53.12% | 642 | 5.6% |
[ 53.5% - 54.0% ] 53.63% | 179 | 6.7% |
[ 54.0% - 54.5% ] 54.14% | 2,087 | 8.0% |
[ 54.5% - 55.0% ] 54.55% | 473 | 34.0% |
[ 56.5% - 57.0% ] 56.55% | 679 | 15.8% |
[ 58.0% - 58.5% ] 58.30% | 578 | 3.5% |
[ 58.5% - 59.0% ] 58.93% | 1,064 | 5.5% |
[ 60.0% - 60.5% ] 60.00% | 25 | 32.0% |
[ 60.5% - 61.0% ] 60.59% | 477 | 3.1% |
[ 62.5% - 63.0% ] 62.87% | 676 | 15.4% |
[ 63.0% - 63.5% ] 63.44% | 1,012 | 11.0% |
[ 66.0% - 66.5% ] 66.09% | 289 | 23.2% |
[ 99.5% - 100.0% ] 100.00% | 210 | 33.8% |