Dutch 2 or more Vehicles in Household
COMPARE
Dutch
Select to Compare
2 or more Vehicles in Household
Dutch 2 or more Vehicles in Household
61.6%
2+ VEHICLES AVAILABLE
100.0/ 100
METRIC RATING
11th/ 347
METRIC RANK
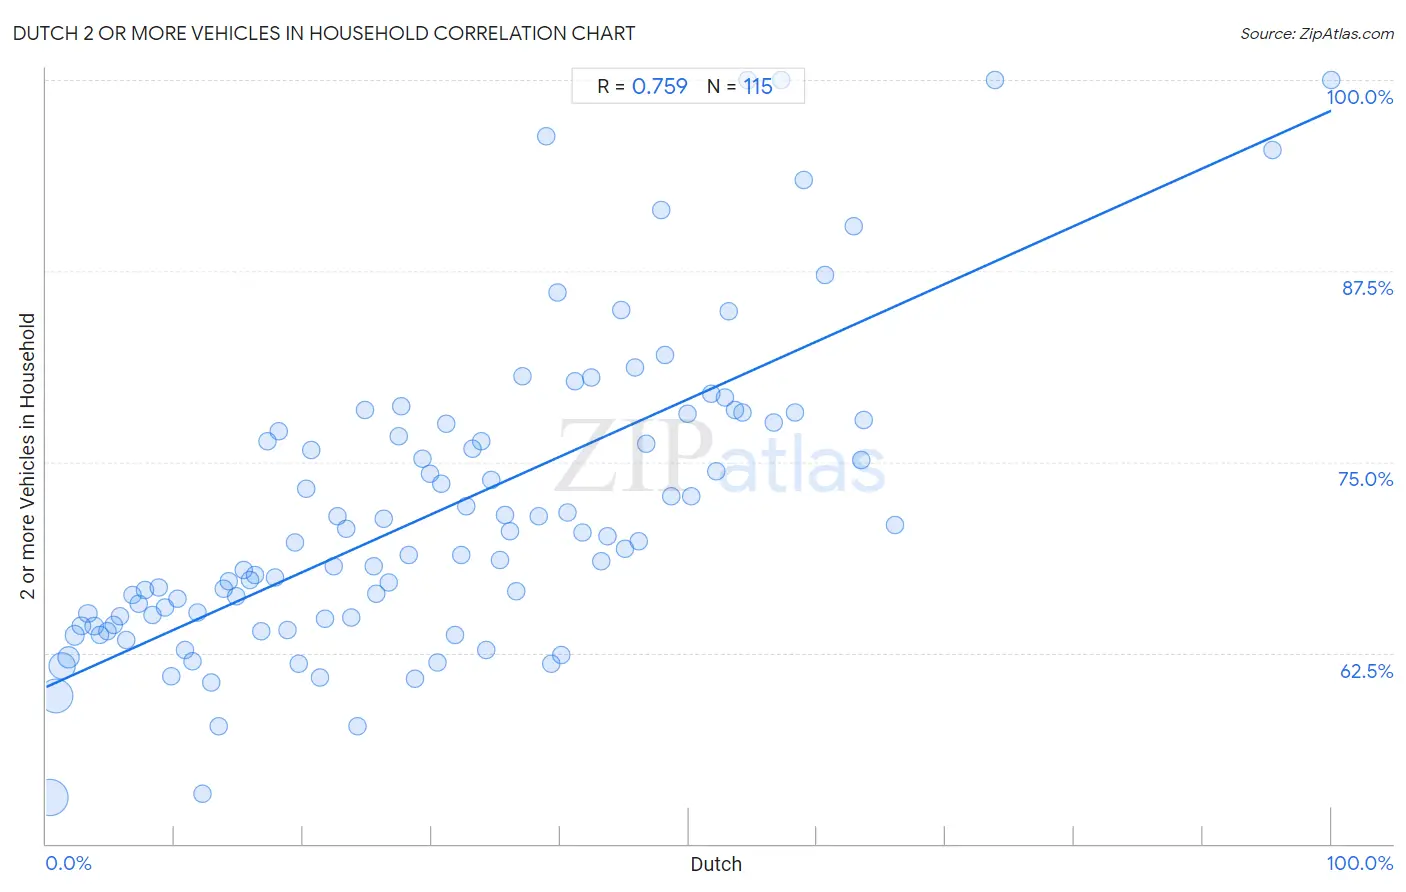
Dutch 2 or more Vehicles in Household Correlation Chart
The statistical analysis conducted on geographies consisting of 553,922,403 people shows a strong positive correlation between the proportion of Dutch and percentage of households with 2 or more vehicles available in the United States with a correlation coefficient (R) of 0.759 and weighted average of 61.6%. On average, for every 1% (one percent) increase in Dutch within a typical geography, there is an increase of 0.38% in percentage of households with 2 or more vehicles available.
It is essential to understand that the correlation between the percentage of Dutch and percentage of households with 2 or more vehicles available does not imply a direct cause-and-effect relationship. It remains uncertain whether the presence of Dutch influences an upward or downward trend in the level of percentage of households with 2 or more vehicles available within an area, or if Dutch simply ended up residing in those areas with higher or lower levels of percentage of households with 2 or more vehicles available due to other factors.
Demographics Similar to Dutch by 2 or more Vehicles in Household
In terms of 2 or more vehicles in household, the demographic groups most similar to Dutch are Mexican (61.7%, a difference of 0.050%), German (61.6%, a difference of 0.11%), Samoan (61.5%, a difference of 0.23%), Czech (61.5%, a difference of 0.28%), and Swedish (61.8%, a difference of 0.33%).
| Demographics | Rating | Rank | 2 or more Vehicles in Household |
| Norwegians | 100.0 /100 | #4 | Exceptional 62.8% |
| Immigrants from Fiji | 100.0 /100 | #5 | Exceptional 62.3% |
| Scandinavians | 100.0 /100 | #6 | Exceptional 62.1% |
| Puget Sound Salish | 100.0 /100 | #7 | Exceptional 62.1% |
| English | 100.0 /100 | #8 | Exceptional 61.9% |
| Swedes | 100.0 /100 | #9 | Exceptional 61.8% |
| Mexicans | 100.0 /100 | #10 | Exceptional 61.7% |
| Dutch | 100.0 /100 | #11 | Exceptional 61.6% |
| Germans | 100.0 /100 | #12 | Exceptional 61.6% |
| Samoans | 100.0 /100 | #13 | Exceptional 61.5% |
| Czechs | 100.0 /100 | #14 | Exceptional 61.5% |
| Nepalese | 100.0 /100 | #15 | Exceptional 61.4% |
| Native Hawaiians | 100.0 /100 | #16 | Exceptional 61.4% |
| Basques | 100.0 /100 | #17 | Exceptional 61.4% |
| Europeans | 100.0 /100 | #18 | Exceptional 61.4% |
Dutch 2 or more Vehicles in Household Correlation Summary
| Measurement | Dutch Data | 2 or more Vehicles in Household Data |
| Minimum | 0.27% | 53.0% |
| Maximum | 100.0% | 100.0% |
| Range | 99.7% | 47.0% |
| Mean | 30.6% | 71.8% |
| Median | 28.7% | 69.7% |
| Interquartile 25% (IQ1) | 14.2% | 64.7% |
| Interquartile 75% (IQ3) | 44.8% | 77.5% |
| Interquartile Range (IQR) | 30.6% | 12.8% |
| Standard Deviation (Sample) | 20.1% | 10.0% |
| Standard Deviation (Population) | 20.0% | 10.0% |
Correlation Details
| Dutch Percentile | Sample Size | 2 or more Vehicles in Household |
[ 0.0% - 0.5% ] 0.27% | 192,893,097 | 53.0% |
[ 0.5% - 1.0% ] 0.74% | 173,362,901 | 59.7% |
[ 1.0% - 1.5% ] 1.22% | 97,764,163 | 61.6% |
[ 1.5% - 2.0% ] 1.72% | 42,345,155 | 62.2% |
[ 2.0% - 2.5% ] 2.23% | 19,183,615 | 63.7% |
[ 2.5% - 3.0% ] 2.71% | 9,710,167 | 64.3% |
[ 3.0% - 3.5% ] 3.23% | 5,247,187 | 65.1% |
[ 3.5% - 4.0% ] 3.73% | 3,021,902 | 64.2% |
[ 4.0% - 4.5% ] 4.22% | 1,896,322 | 63.7% |
[ 4.5% - 5.0% ] 4.75% | 1,324,525 | 63.9% |
[ 5.0% - 5.5% ] 5.24% | 919,286 | 64.3% |
[ 5.5% - 6.0% ] 5.77% | 798,884 | 64.9% |
[ 6.0% - 6.5% ] 6.18% | 607,362 | 63.4% |
[ 6.5% - 7.0% ] 6.72% | 410,942 | 66.3% |
[ 7.0% - 7.5% ] 7.23% | 376,784 | 65.7% |
[ 7.5% - 8.0% ] 7.70% | 335,797 | 66.6% |
[ 8.0% - 8.5% ] 8.24% | 258,277 | 65.0% |
[ 8.5% - 9.0% ] 8.78% | 345,640 | 66.8% |
[ 9.0% - 9.5% ] 9.25% | 270,702 | 65.5% |
[ 9.5% - 10.0% ] 9.73% | 151,015 | 61.0% |
[ 10.0% - 10.5% ] 10.26% | 194,382 | 66.0% |
[ 10.5% - 11.0% ] 10.78% | 128,339 | 62.7% |
[ 11.0% - 11.5% ] 11.38% | 102,395 | 62.0% |
[ 11.5% - 12.0% ] 11.79% | 83,273 | 65.1% |
[ 12.0% - 12.5% ] 12.20% | 265,611 | 53.2% |
[ 12.5% - 13.0% ] 12.81% | 114,169 | 60.6% |
[ 13.0% - 13.5% ] 13.40% | 88,093 | 57.7% |
[ 13.5% - 14.0% ] 13.78% | 85,350 | 66.7% |
[ 14.0% - 14.5% ] 14.16% | 68,366 | 67.2% |
[ 14.5% - 15.0% ] 14.76% | 105,623 | 66.2% |
[ 15.0% - 15.5% ] 15.40% | 50,066 | 67.9% |
[ 15.5% - 16.0% ] 15.84% | 180,160 | 67.3% |
[ 16.0% - 16.5% ] 16.23% | 189,954 | 67.6% |
[ 16.5% - 17.0% ] 16.77% | 25,393 | 63.9% |
[ 17.0% - 17.5% ] 17.21% | 60,627 | 76.4% |
[ 17.5% - 18.0% ] 17.80% | 78,644 | 67.4% |
[ 18.0% - 18.5% ] 18.08% | 47,022 | 77.0% |
[ 18.5% - 19.0% ] 18.73% | 35,846 | 64.0% |
[ 19.0% - 19.5% ] 19.37% | 64,883 | 69.7% |
[ 19.5% - 20.0% ] 19.61% | 20,323 | 61.8% |
[ 20.0% - 20.5% ] 20.23% | 10,815 | 73.3% |
[ 20.5% - 21.0% ] 20.66% | 16,414 | 75.8% |
[ 21.0% - 21.5% ] 21.26% | 7,202 | 60.9% |
[ 21.5% - 22.0% ] 21.67% | 3,858 | 64.7% |
[ 22.0% - 22.5% ] 22.33% | 38,028 | 68.1% |
[ 22.5% - 23.0% ] 22.65% | 84,471 | 71.4% |
[ 23.0% - 23.5% ] 23.31% | 5,852 | 70.6% |
[ 23.5% - 24.0% ] 23.77% | 18,464 | 64.8% |
[ 24.0% - 24.5% ] 24.23% | 50,002 | 57.7% |
[ 24.5% - 25.0% ] 24.78% | 2,143 | 78.4% |
[ 25.0% - 25.5% ] 25.47% | 33,691 | 68.1% |
[ 25.5% - 26.0% ] 25.69% | 2,783 | 66.4% |
[ 26.0% - 26.5% ] 26.23% | 8,570 | 71.3% |
[ 26.5% - 27.0% ] 26.68% | 30,309 | 67.1% |
[ 27.0% - 27.5% ] 27.40% | 21,758 | 76.7% |
[ 27.5% - 28.0% ] 27.63% | 5,515 | 78.6% |
[ 28.0% - 28.5% ] 28.21% | 4,353 | 68.9% |
[ 28.5% - 29.0% ] 28.73% | 63,863 | 60.8% |
[ 29.0% - 29.5% ] 29.27% | 17,833 | 75.2% |
[ 29.5% - 30.0% ] 29.86% | 1,383 | 74.2% |
[ 30.0% - 30.5% ] 30.41% | 7,662 | 61.9% |
[ 30.5% - 31.0% ] 30.77% | 156 | 73.5% |
[ 31.0% - 31.5% ] 31.13% | 30,575 | 77.5% |
[ 31.5% - 32.0% ] 31.79% | 7,797 | 63.6% |
[ 32.0% - 32.5% ] 32.30% | 2,139 | 68.9% |
[ 32.5% - 33.0% ] 32.72% | 2,610 | 72.1% |
[ 33.0% - 33.5% ] 33.19% | 467 | 75.9% |
[ 33.5% - 34.0% ] 33.87% | 1,435 | 76.3% |
[ 34.0% - 34.5% ] 34.26% | 108 | 62.7% |
[ 34.5% - 35.0% ] 34.59% | 899 | 73.8% |
[ 35.0% - 35.5% ] 35.29% | 1,159 | 68.5% |
[ 35.5% - 36.0% ] 35.71% | 5,315 | 71.5% |
[ 36.0% - 36.5% ] 36.07% | 28,428 | 70.5% |
[ 36.5% - 37.0% ] 36.60% | 3,989 | 66.5% |
[ 37.0% - 37.5% ] 37.04% | 1,150 | 80.6% |
[ 38.0% - 38.5% ] 38.32% | 428 | 71.5% |
[ 38.5% - 39.0% ] 38.94% | 208 | 96.3% |
[ 39.0% - 39.5% ] 39.33% | 989 | 61.8% |
[ 39.5% - 40.0% ] 39.75% | 478 | 86.1% |
[ 40.0% - 40.5% ] 40.09% | 23,394 | 62.4% |
[ 40.5% - 41.0% ] 40.54% | 30,571 | 71.7% |
[ 41.0% - 41.5% ] 41.12% | 41,002 | 80.3% |
[ 41.5% - 42.0% ] 41.74% | 5,326 | 70.4% |
[ 42.0% - 42.5% ] 42.37% | 7,116 | 80.5% |
[ 43.0% - 43.5% ] 43.16% | 8,080 | 68.5% |
[ 43.5% - 44.0% ] 43.69% | 444 | 70.1% |
[ 44.5% - 45.0% ] 44.78% | 8,483 | 85.0% |
[ 45.0% - 45.5% ] 45.08% | 4,887 | 69.3% |
[ 45.5% - 46.0% ] 45.83% | 408 | 81.2% |
[ 46.0% - 46.5% ] 46.14% | 11,008 | 69.8% |
[ 46.5% - 47.0% ] 46.66% | 1,749 | 76.2% |
[ 47.5% - 48.0% ] 47.83% | 1,729 | 91.5% |
[ 48.0% - 48.5% ] 48.19% | 1,629 | 82.0% |
[ 48.5% - 49.0% ] 48.68% | 7,130 | 72.7% |
[ 49.5% - 50.0% ] 49.86% | 1,412 | 78.2% |
[ 50.0% - 50.5% ] 50.22% | 20,042 | 72.8% |
[ 51.5% - 52.0% ] 51.76% | 1,022 | 79.5% |
[ 52.0% - 52.5% ] 52.18% | 1,470 | 74.4% |
[ 52.5% - 53.0% ] 52.78% | 1,114 | 79.2% |
[ 53.0% - 53.5% ] 53.12% | 642 | 84.9% |
[ 53.5% - 54.0% ] 53.63% | 179 | 78.4% |
[ 54.0% - 54.5% ] 54.14% | 2,087 | 78.2% |
[ 54.5% - 55.0% ] 54.55% | 473 | 100.0% |
[ 56.5% - 57.0% ] 56.59% | 751 | 77.6% |
[ 57.0% - 57.5% ] 57.23% | 318 | 100.0% |
[ 58.0% - 58.5% ] 58.30% | 578 | 78.2% |
[ 58.5% - 59.0% ] 58.93% | 1,064 | 93.5% |
[ 60.5% - 61.0% ] 60.59% | 477 | 87.3% |
[ 62.5% - 63.0% ] 62.87% | 676 | 90.4% |
[ 63.0% - 63.5% ] 63.44% | 1,012 | 75.1% |
[ 63.5% - 64.0% ] 63.64% | 11 | 77.8% |
[ 66.0% - 66.5% ] 66.10% | 351 | 70.9% |
[ 73.5% - 74.0% ] 73.81% | 126 | 100.0% |
[ 95.0% - 95.5% ] 95.45% | 44 | 95.5% |
[ 99.5% - 100.0% ] 100.00% | 57 | 100.0% |