Dutch Unemployment Among Women with Children Ages 6 to 17 years
COMPARE
Dutch
Select to Compare
Unemployment Among Women with Children Ages 6 to 17 years
Dutch Unemployment Among Women with Children Ages 6 to 17 years
9.4%
UNEMPLOYMENT | WOMEN W/ CHILDREN 6 TO 17
1.5/ 100
METRIC RATING
248th/ 347
METRIC RANK
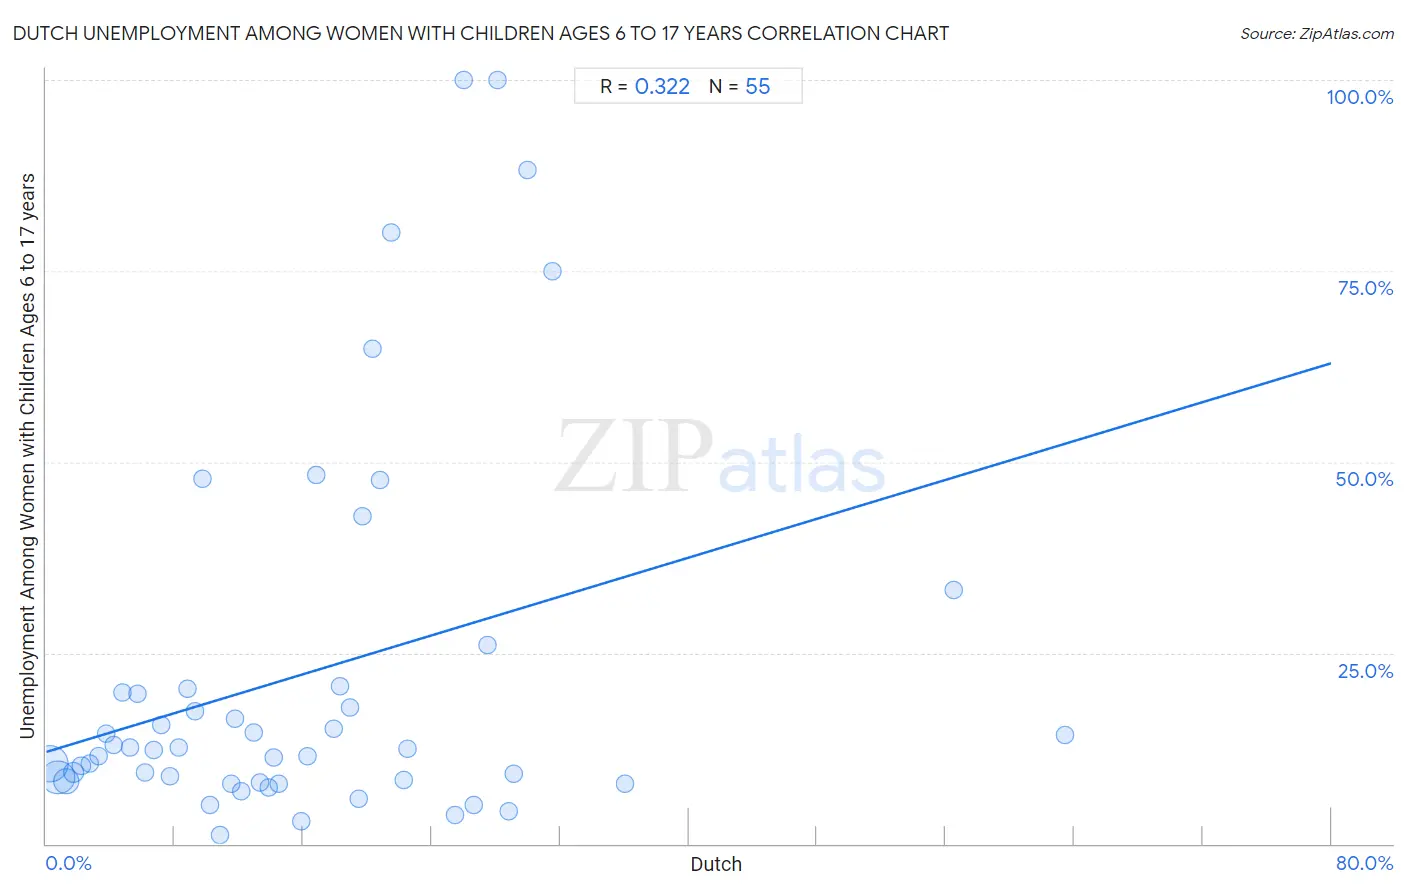
Dutch Unemployment Among Women with Children Ages 6 to 17 years Correlation Chart
The statistical analysis conducted on geographies consisting of 349,724,133 people shows a mild positive correlation between the proportion of Dutch and unemployment rate among women with children between the ages 6 and 17 in the United States with a correlation coefficient (R) of 0.322 and weighted average of 9.4%. On average, for every 1% (one percent) increase in Dutch within a typical geography, there is an increase of 0.64% in unemployment rate among women with children between the ages 6 and 17.
It is essential to understand that the correlation between the percentage of Dutch and unemployment rate among women with children between the ages 6 and 17 does not imply a direct cause-and-effect relationship. It remains uncertain whether the presence of Dutch influences an upward or downward trend in the level of unemployment rate among women with children between the ages 6 and 17 within an area, or if Dutch simply ended up residing in those areas with higher or lower levels of unemployment rate among women with children between the ages 6 and 17 due to other factors.
Demographics Similar to Dutch by Unemployment Among Women with Children Ages 6 to 17 years
In terms of unemployment among women with children ages 6 to 17 years, the demographic groups most similar to Dutch are Immigrants from South America (9.4%, a difference of 0.010%), Polish (9.4%, a difference of 0.040%), Immigrants from Africa (9.4%, a difference of 0.070%), Immigrants from Guatemala (9.4%, a difference of 0.10%), and Central American (9.4%, a difference of 0.11%).
| Demographics | Rating | Rank | Unemployment Among Women with Children Ages 6 to 17 years |
| Colombians | 2.2 /100 | #241 | Tragic 9.3% |
| Immigrants from Colombia | 2.1 /100 | #242 | Tragic 9.3% |
| Scottish | 2.0 /100 | #243 | Tragic 9.4% |
| English | 1.9 /100 | #244 | Tragic 9.4% |
| Immigrants from Cameroon | 1.8 /100 | #245 | Tragic 9.4% |
| Immigrants from Africa | 1.6 /100 | #246 | Tragic 9.4% |
| Poles | 1.5 /100 | #247 | Tragic 9.4% |
| Dutch | 1.5 /100 | #248 | Tragic 9.4% |
| Immigrants from South America | 1.5 /100 | #249 | Tragic 9.4% |
| Immigrants from Guatemala | 1.3 /100 | #250 | Tragic 9.4% |
| Central Americans | 1.3 /100 | #251 | Tragic 9.4% |
| Creek | 1.2 /100 | #252 | Tragic 9.4% |
| Portuguese | 1.1 /100 | #253 | Tragic 9.4% |
| Nicaraguans | 1.0 /100 | #254 | Tragic 9.4% |
| Lithuanians | 0.9 /100 | #255 | Tragic 9.4% |
Dutch Unemployment Among Women with Children Ages 6 to 17 years Correlation Summary
| Measurement | Dutch Data | Unemployment Among Women with Children Ages 6 to 17 years Data |
| Minimum | 0.27% | 1.2% |
| Maximum | 63.4% | 100.0% |
| Range | 63.2% | 98.8% |
| Mean | 16.1% | 22.3% |
| Median | 13.8% | 12.4% |
| Interquartile 25% (IQ1) | 6.7% | 8.1% |
| Interquartile 75% (IQ3) | 22.3% | 20.2% |
| Interquartile Range (IQR) | 15.6% | 12.1% |
| Standard Deviation (Sample) | 12.6% | 24.9% |
| Standard Deviation (Population) | 12.5% | 24.6% |
Correlation Details
| Dutch Percentile | Sample Size | Unemployment Among Women with Children Ages 6 to 17 years |
[ 0.0% - 0.5% ] 0.27% | 140,524,651 | 10.5% |
[ 0.5% - 1.0% ] 0.73% | 114,849,506 | 8.7% |
[ 1.0% - 1.5% ] 1.21% | 56,640,327 | 8.1% |
[ 1.5% - 2.0% ] 1.72% | 20,400,346 | 9.3% |
[ 2.0% - 2.5% ] 2.22% | 7,554,036 | 10.2% |
[ 2.5% - 3.0% ] 2.70% | 3,741,182 | 10.5% |
[ 3.0% - 3.5% ] 3.23% | 1,873,701 | 11.5% |
[ 3.5% - 4.0% ] 3.73% | 1,123,659 | 14.5% |
[ 4.0% - 4.5% ] 4.19% | 657,299 | 12.9% |
[ 4.5% - 5.0% ] 4.78% | 301,353 | 19.8% |
[ 5.0% - 5.5% ] 5.19% | 282,965 | 12.6% |
[ 5.5% - 6.0% ] 5.68% | 120,721 | 19.7% |
[ 6.0% - 6.5% ] 6.15% | 219,441 | 9.3% |
[ 6.5% - 7.0% ] 6.71% | 64,051 | 12.3% |
[ 7.0% - 7.5% ] 7.15% | 59,189 | 15.5% |
[ 7.5% - 8.0% ] 7.70% | 79,472 | 8.8% |
[ 8.0% - 8.5% ] 8.24% | 56,851 | 12.7% |
[ 8.5% - 9.0% ] 8.78% | 66,305 | 20.2% |
[ 9.0% - 9.5% ] 9.23% | 75,640 | 17.4% |
[ 9.5% - 10.0% ] 9.70% | 5,236 | 47.7% |
[ 10.0% - 10.5% ] 10.22% | 98,365 | 5.1% |
[ 10.5% - 11.0% ] 10.83% | 71,984 | 1.2% |
[ 11.0% - 11.5% ] 11.49% | 45,777 | 7.9% |
[ 11.5% - 12.0% ] 11.77% | 26,936 | 16.4% |
[ 12.0% - 12.5% ] 12.18% | 212,373 | 6.9% |
[ 12.5% - 13.0% ] 12.89% | 38,177 | 14.6% |
[ 13.0% - 13.5% ] 13.34% | 952 | 8.0% |
[ 13.5% - 14.0% ] 13.83% | 57,343 | 7.4% |
[ 14.0% - 14.5% ] 14.13% | 17,111 | 11.3% |
[ 14.5% - 15.0% ] 14.51% | 13,271 | 7.9% |
[ 15.5% - 16.0% ] 15.84% | 133,116 | 2.9% |
[ 16.0% - 16.5% ] 16.27% | 69,370 | 11.4% |
[ 16.5% - 17.0% ] 16.85% | 1,674 | 48.3% |
[ 17.5% - 18.0% ] 17.94% | 22,334 | 15.0% |
[ 18.0% - 18.5% ] 18.30% | 4,247 | 20.6% |
[ 18.5% - 19.0% ] 18.90% | 15,723 | 17.9% |
[ 19.0% - 19.5% ] 19.44% | 31,966 | 5.9% |
[ 19.5% - 20.0% ] 19.71% | 1,517 | 42.9% |
[ 20.0% - 20.5% ] 20.32% | 2,175 | 64.8% |
[ 20.5% - 21.0% ] 20.80% | 4,804 | 47.7% |
[ 21.0% - 21.5% ] 21.45% | 289 | 80.0% |
[ 22.0% - 22.5% ] 22.28% | 7,446 | 8.3% |
[ 22.5% - 23.0% ] 22.51% | 48,493 | 12.4% |
[ 25.0% - 25.5% ] 25.48% | 32,359 | 3.8% |
[ 26.0% - 26.5% ] 26.03% | 146 | 100.0% |
[ 26.5% - 27.0% ] 26.60% | 13,280 | 5.0% |
[ 27.0% - 27.5% ] 27.48% | 8,917 | 26.1% |
[ 28.0% - 28.5% ] 28.11% | 530 | 100.0% |
[ 28.5% - 29.0% ] 28.76% | 16,017 | 4.2% |
[ 29.0% - 29.5% ] 29.09% | 832 | 9.1% |
[ 29.5% - 30.0% ] 29.93% | 568 | 88.2% |
[ 31.5% - 32.0% ] 31.51% | 730 | 75.0% |
[ 36.0% - 36.5% ] 36.06% | 27,793 | 7.9% |
[ 56.5% - 57.0% ] 56.52% | 575 | 33.3% |
[ 63.0% - 63.5% ] 63.44% | 1,012 | 14.3% |