Dutch vs Creek Married-Couple Family Poverty
COMPARE
Dutch
Creek
Married-Couple Family Poverty
Married-Couple Family Poverty Comparison
Dutch
Creek
4.2%
MARRIED-COUPLE FAMILY POVERTY
99.9/ 100
METRIC RATING
34th/ 347
METRIC RANK
6.2%
MARRIED-COUPLE FAMILY POVERTY
0.2/ 100
METRIC RATING
266th/ 347
METRIC RANK
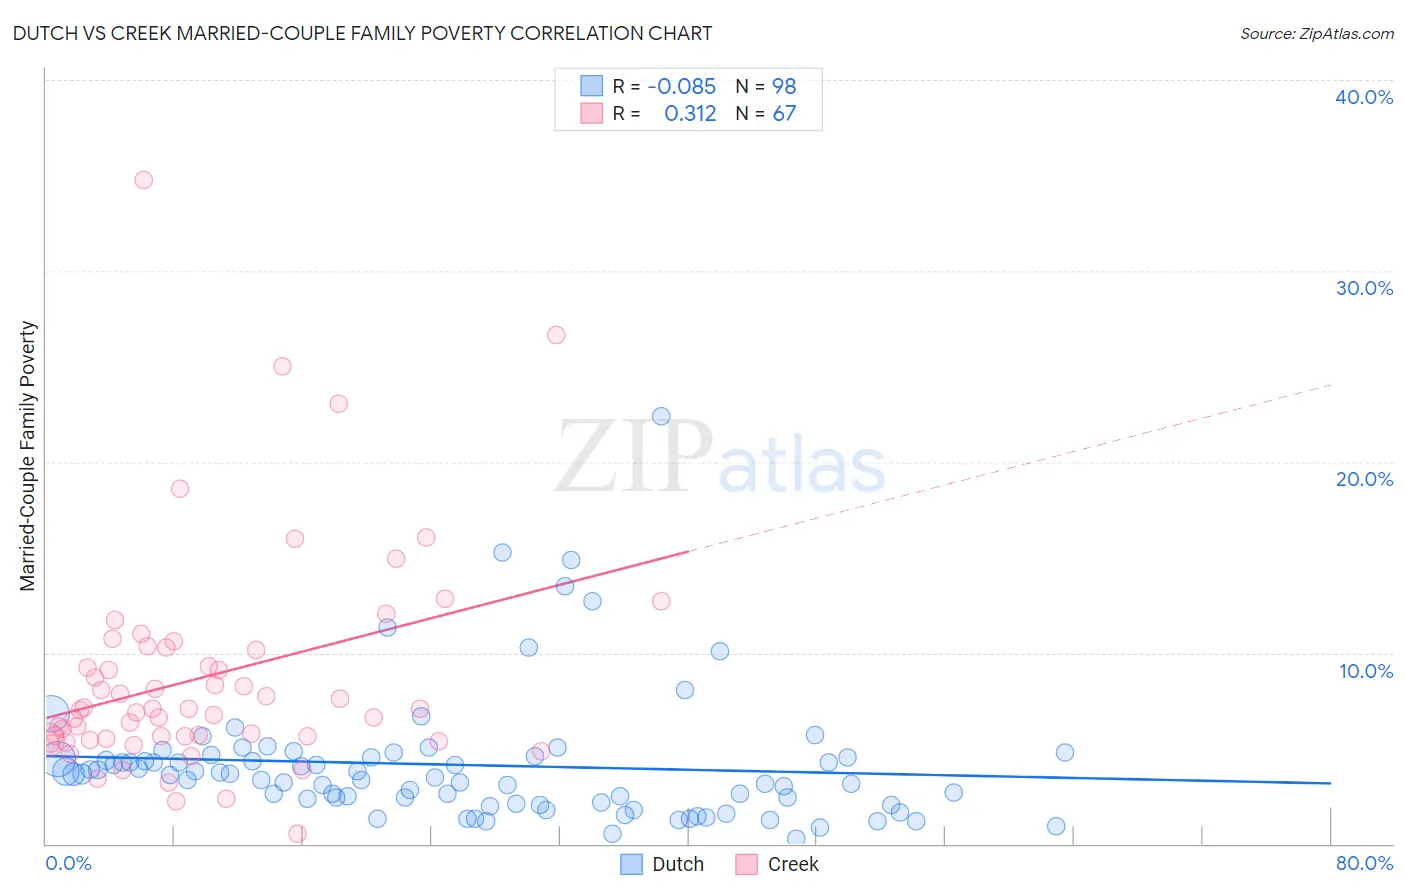
Dutch vs Creek Married-Couple Family Poverty Correlation Chart
The statistical analysis conducted on geographies consisting of 541,561,341 people shows a slight negative correlation between the proportion of Dutch and poverty level among married-couple families in the United States with a correlation coefficient (R) of -0.085 and weighted average of 4.2%. Similarly, the statistical analysis conducted on geographies consisting of 177,846,952 people shows a mild positive correlation between the proportion of Creek and poverty level among married-couple families in the United States with a correlation coefficient (R) of 0.312 and weighted average of 6.2%, a difference of 47.0%.
Married-Couple Family Poverty Correlation Summary
| Measurement | Dutch | Creek |
| Minimum | 0.25% | 0.52% |
| Maximum | 22.4% | 34.7% |
| Range | 22.2% | 34.2% |
| Mean | 4.1% | 8.8% |
| Median | 3.6% | 7.1% |
| Interquartile 25% (IQ1) | 2.1% | 5.5% |
| Interquartile 75% (IQ3) | 4.5% | 10.3% |
| Interquartile Range (IQR) | 2.4% | 4.8% |
| Standard Deviation (Sample) | 3.4% | 5.9% |
| Standard Deviation (Population) | 3.4% | 5.8% |
Similar Demographics by Married-Couple Family Poverty
Demographics Similar to Dutch by Married-Couple Family Poverty
In terms of married-couple family poverty, the demographic groups most similar to Dutch are Irish (4.2%, a difference of 0.23%), European (4.2%, a difference of 0.57%), English (4.2%, a difference of 0.60%), Iranian (4.2%, a difference of 0.67%), and Greek (4.2%, a difference of 0.71%).
| Demographics | Rating | Rank | Married-Couple Family Poverty |
| Danes | 99.9 /100 | #27 | Exceptional 4.1% |
| Scandinavians | 99.9 /100 | #28 | Exceptional 4.1% |
| Immigrants | Scotland | 99.9 /100 | #29 | Exceptional 4.2% |
| Finns | 99.9 /100 | #30 | Exceptional 4.2% |
| Estonians | 99.9 /100 | #31 | Exceptional 4.2% |
| Greeks | 99.9 /100 | #32 | Exceptional 4.2% |
| Irish | 99.9 /100 | #33 | Exceptional 4.2% |
| Dutch | 99.9 /100 | #34 | Exceptional 4.2% |
| Europeans | 99.9 /100 | #35 | Exceptional 4.2% |
| English | 99.9 /100 | #36 | Exceptional 4.2% |
| Iranians | 99.9 /100 | #37 | Exceptional 4.2% |
| Belgians | 99.9 /100 | #38 | Exceptional 4.2% |
| Immigrants | Northern Europe | 99.8 /100 | #39 | Exceptional 4.2% |
| French Canadians | 99.8 /100 | #40 | Exceptional 4.2% |
| Northern Europeans | 99.8 /100 | #41 | Exceptional 4.3% |
Demographics Similar to Creek by Married-Couple Family Poverty
In terms of married-couple family poverty, the demographic groups most similar to Creek are Spanish American (6.2%, a difference of 0.050%), Blackfeet (6.2%, a difference of 0.080%), Immigrants from Congo (6.1%, a difference of 0.51%), Alaska Native (6.2%, a difference of 0.53%), and Immigrants from West Indies (6.2%, a difference of 0.70%).
| Demographics | Rating | Rank | Married-Couple Family Poverty |
| Alaskan Athabascans | 0.4 /100 | #259 | Tragic 6.1% |
| Jamaicans | 0.3 /100 | #260 | Tragic 6.1% |
| Senegalese | 0.3 /100 | #261 | Tragic 6.1% |
| Shoshone | 0.3 /100 | #262 | Tragic 6.1% |
| Immigrants | Senegal | 0.3 /100 | #263 | Tragic 6.1% |
| Immigrants | Congo | 0.2 /100 | #264 | Tragic 6.1% |
| Blackfeet | 0.2 /100 | #265 | Tragic 6.2% |
| Creek | 0.2 /100 | #266 | Tragic 6.2% |
| Spanish Americans | 0.2 /100 | #267 | Tragic 6.2% |
| Alaska Natives | 0.2 /100 | #268 | Tragic 6.2% |
| Immigrants | West Indies | 0.1 /100 | #269 | Tragic 6.2% |
| Immigrants | Jamaica | 0.1 /100 | #270 | Tragic 6.2% |
| Immigrants | Bahamas | 0.1 /100 | #271 | Tragic 6.2% |
| Trinidadians and Tobagonians | 0.1 /100 | #272 | Tragic 6.2% |
| Colville | 0.1 /100 | #273 | Tragic 6.3% |