Dutch Receiving Food Stamps
COMPARE
Dutch
Select to Compare
Receiving Food Stamps
Dutch Receiving Food Stamps
10.0%
PUBLIC INCOME | FOOD STAMPS
98.6/ 100
METRIC RATING
83rd/ 347
METRIC RANK
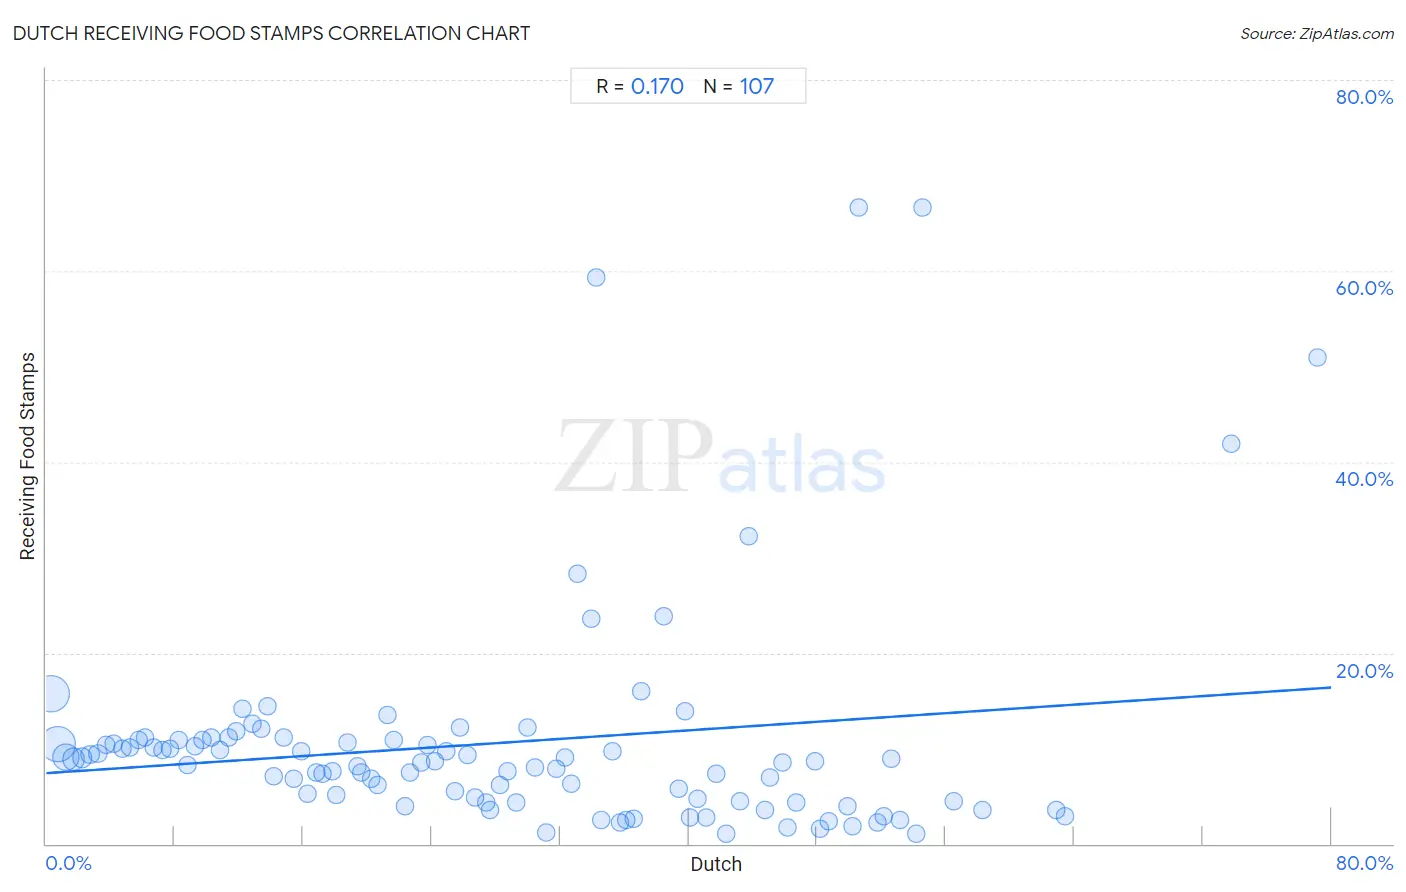
Dutch Receiving Food Stamps Correlation Chart
The statistical analysis conducted on geographies consisting of 551,299,483 people shows a poor positive correlation between the proportion of Dutch and percentage of population receiving government assistance and/or food stamps in the United States with a correlation coefficient (R) of 0.170 and weighted average of 10.0%. On average, for every 1% (one percent) increase in Dutch within a typical geography, there is an increase of 0.11% in percentage of population receiving government assistance and/or food stamps.
It is essential to understand that the correlation between the percentage of Dutch and percentage of population receiving government assistance and/or food stamps does not imply a direct cause-and-effect relationship. It remains uncertain whether the presence of Dutch influences an upward or downward trend in the level of percentage of population receiving government assistance and/or food stamps within an area, or if Dutch simply ended up residing in those areas with higher or lower levels of percentage of population receiving government assistance and/or food stamps due to other factors.
Demographics Similar to Dutch by Receiving Food Stamps
In terms of receiving food stamps, the demographic groups most similar to Dutch are Austrian (10.0%, a difference of 0.0%), Immigrants from Israel (10.0%, a difference of 0.070%), Immigrants from England (10.0%, a difference of 0.13%), Immigrants from Romania (10.0%, a difference of 0.25%), and Polish (10.0%, a difference of 0.27%).
| Demographics | Rating | Rank | Receiving Food Stamps |
| Immigrants from Croatia | 98.7 /100 | #76 | Exceptional 10.0% |
| Immigrants from North Macedonia | 98.7 /100 | #77 | Exceptional 10.0% |
| South Africans | 98.7 /100 | #78 | Exceptional 10.0% |
| Laotians | 98.7 /100 | #79 | Exceptional 10.0% |
| Poles | 98.6 /100 | #80 | Exceptional 10.0% |
| Immigrants from England | 98.6 /100 | #81 | Exceptional 10.0% |
| Austrians | 98.6 /100 | #82 | Exceptional 10.0% |
| Dutch | 98.6 /100 | #83 | Exceptional 10.0% |
| Immigrants from Israel | 98.5 /100 | #84 | Exceptional 10.0% |
| Immigrants from Romania | 98.5 /100 | #85 | Exceptional 10.0% |
| Immigrants from Norway | 98.4 /100 | #86 | Exceptional 10.0% |
| Egyptians | 98.4 /100 | #87 | Exceptional 10.0% |
| Immigrants from Kuwait | 98.4 /100 | #88 | Exceptional 10.0% |
| Immigrants from France | 98.3 /100 | #89 | Exceptional 10.1% |
| Finns | 97.9 /100 | #90 | Exceptional 10.2% |
Dutch Receiving Food Stamps Correlation Summary
| Measurement | Dutch Data | Receiving Food Stamps Data |
| Minimum | 0.27% | 0.99% |
| Maximum | 79.1% | 66.7% |
| Range | 78.8% | 65.7% |
| Mean | 28.2% | 10.6% |
| Median | 26.7% | 8.5% |
| Interquartile 25% (IQ1) | 13.4% | 4.5% |
| Interquartile 75% (IQ3) | 41.7% | 10.8% |
| Interquartile Range (IQR) | 28.3% | 6.3% |
| Standard Deviation (Sample) | 17.9% | 11.8% |
| Standard Deviation (Population) | 17.8% | 11.7% |
Correlation Details
| Dutch Percentile | Sample Size | Receiving Food Stamps |
[ 0.0% - 0.5% ] 0.27% | 192,458,785 | 15.7% |
[ 0.5% - 1.0% ] 0.74% | 172,618,907 | 10.5% |
[ 1.0% - 1.5% ] 1.22% | 97,315,581 | 9.1% |
[ 1.5% - 2.0% ] 1.72% | 42,080,748 | 8.9% |
[ 2.0% - 2.5% ] 2.23% | 18,994,351 | 9.0% |
[ 2.5% - 3.0% ] 2.71% | 9,608,983 | 9.4% |
[ 3.0% - 3.5% ] 3.23% | 5,170,721 | 9.4% |
[ 3.5% - 4.0% ] 3.73% | 2,957,499 | 10.4% |
[ 4.0% - 4.5% ] 4.22% | 1,836,423 | 10.5% |
[ 4.5% - 5.0% ] 4.75% | 1,291,681 | 10.0% |
[ 5.0% - 5.5% ] 5.24% | 894,981 | 10.0% |
[ 5.5% - 6.0% ] 5.77% | 783,309 | 10.9% |
[ 6.0% - 6.5% ] 6.18% | 592,794 | 11.2% |
[ 6.5% - 7.0% ] 6.72% | 391,858 | 10.1% |
[ 7.0% - 7.5% ] 7.23% | 358,187 | 9.8% |
[ 7.5% - 8.0% ] 7.69% | 314,159 | 10.0% |
[ 8.0% - 8.5% ] 8.24% | 252,069 | 10.8% |
[ 8.5% - 9.0% ] 8.78% | 338,994 | 8.2% |
[ 9.0% - 9.5% ] 9.25% | 256,230 | 10.2% |
[ 9.5% - 10.0% ] 9.72% | 143,259 | 10.9% |
[ 10.0% - 10.5% ] 10.26% | 189,769 | 11.2% |
[ 10.5% - 11.0% ] 10.79% | 126,766 | 9.9% |
[ 11.0% - 11.5% ] 11.38% | 99,663 | 11.2% |
[ 11.5% - 12.0% ] 11.79% | 79,002 | 11.8% |
[ 12.0% - 12.5% ] 12.20% | 262,667 | 14.1% |
[ 12.5% - 13.0% ] 12.81% | 113,257 | 12.6% |
[ 13.0% - 13.5% ] 13.40% | 85,570 | 12.1% |
[ 13.5% - 14.0% ] 13.78% | 82,676 | 14.5% |
[ 14.0% - 14.5% ] 14.16% | 65,687 | 7.0% |
[ 14.5% - 15.0% ] 14.76% | 102,889 | 11.2% |
[ 15.0% - 15.5% ] 15.40% | 49,649 | 6.8% |
[ 15.5% - 16.0% ] 15.84% | 177,027 | 9.7% |
[ 16.0% - 16.5% ] 16.23% | 189,265 | 5.3% |
[ 16.5% - 17.0% ] 16.77% | 23,785 | 7.4% |
[ 17.0% - 17.5% ] 17.21% | 58,443 | 7.3% |
[ 17.5% - 18.0% ] 17.81% | 77,989 | 7.5% |
[ 18.0% - 18.5% ] 18.08% | 46,757 | 5.1% |
[ 18.5% - 19.0% ] 18.73% | 35,292 | 10.6% |
[ 19.0% - 19.5% ] 19.37% | 64,433 | 8.2% |
[ 19.5% - 20.0% ] 19.60% | 19,690 | 7.5% |
[ 20.0% - 20.5% ] 20.23% | 10,320 | 6.7% |
[ 20.5% - 21.0% ] 20.66% | 16,075 | 6.2% |
[ 21.0% - 21.5% ] 21.25% | 6,505 | 13.5% |
[ 21.5% - 22.0% ] 21.65% | 3,423 | 10.8% |
[ 22.0% - 22.5% ] 22.33% | 36,955 | 3.9% |
[ 22.5% - 23.0% ] 22.65% | 83,435 | 7.5% |
[ 23.0% - 23.5% ] 23.31% | 5,473 | 8.4% |
[ 23.5% - 24.0% ] 23.77% | 18,058 | 10.4% |
[ 24.0% - 24.5% ] 24.23% | 49,511 | 8.7% |
[ 24.5% - 25.0% ] 24.93% | 1,051 | 9.7% |
[ 25.0% - 25.5% ] 25.47% | 33,366 | 5.5% |
[ 25.5% - 26.0% ] 25.77% | 1,696 | 12.1% |
[ 26.0% - 26.5% ] 26.23% | 8,367 | 9.2% |
[ 26.5% - 27.0% ] 26.67% | 30,070 | 4.9% |
[ 27.0% - 27.5% ] 27.41% | 21,474 | 4.3% |
[ 27.5% - 28.0% ] 27.63% | 5,403 | 3.6% |
[ 28.0% - 28.5% ] 28.22% | 3,809 | 6.1% |
[ 28.5% - 29.0% ] 28.73% | 63,828 | 7.6% |
[ 29.0% - 29.5% ] 29.26% | 17,469 | 4.3% |
[ 29.5% - 30.0% ] 29.93% | 578 | 12.2% |
[ 30.0% - 30.5% ] 30.41% | 7,050 | 8.0% |
[ 31.0% - 31.5% ] 31.13% | 30,444 | 1.1% |
[ 31.5% - 32.0% ] 31.79% | 7,365 | 7.9% |
[ 32.0% - 32.5% ] 32.30% | 1,972 | 9.0% |
[ 32.5% - 33.0% ] 32.68% | 1,536 | 6.3% |
[ 33.0% - 33.5% ] 33.06% | 121 | 28.3% |
[ 33.5% - 34.0% ] 33.93% | 843 | 23.6% |
[ 34.0% - 34.5% ] 34.26% | 108 | 59.3% |
[ 34.5% - 35.0% ] 34.59% | 691 | 2.5% |
[ 35.0% - 35.5% ] 35.26% | 984 | 9.7% |
[ 35.5% - 36.0% ] 35.72% | 4,972 | 2.3% |
[ 36.0% - 36.5% ] 36.07% | 28,428 | 2.5% |
[ 36.5% - 37.0% ] 36.60% | 3,989 | 2.6% |
[ 37.0% - 37.5% ] 37.04% | 1,142 | 16.0% |
[ 38.0% - 38.5% ] 38.46% | 104 | 23.8% |
[ 39.0% - 39.5% ] 39.36% | 719 | 5.8% |
[ 39.5% - 40.0% ] 39.75% | 478 | 13.9% |
[ 40.0% - 40.5% ] 40.09% | 23,394 | 2.7% |
[ 40.5% - 41.0% ] 40.54% | 30,231 | 4.7% |
[ 41.0% - 41.5% ] 41.12% | 40,985 | 2.7% |
[ 41.5% - 42.0% ] 41.74% | 5,326 | 7.3% |
[ 42.0% - 42.5% ] 42.37% | 7,116 | 0.99% |
[ 43.0% - 43.5% ] 43.16% | 7,825 | 4.5% |
[ 43.5% - 44.0% ] 43.71% | 318 | 32.2% |
[ 44.5% - 45.0% ] 44.78% | 8,483 | 3.5% |
[ 45.0% - 45.5% ] 45.08% | 4,887 | 6.9% |
[ 45.5% - 46.0% ] 45.87% | 351 | 8.5% |
[ 46.0% - 46.5% ] 46.12% | 10,567 | 1.7% |
[ 46.5% - 47.0% ] 46.65% | 1,629 | 4.3% |
[ 47.5% - 48.0% ] 47.84% | 1,595 | 8.6% |
[ 48.0% - 48.5% ] 48.17% | 1,478 | 1.6% |
[ 48.5% - 49.0% ] 48.68% | 7,130 | 2.3% |
[ 49.5% - 50.0% ] 49.87% | 1,179 | 3.9% |
[ 50.0% - 50.5% ] 50.22% | 20,042 | 1.8% |
[ 50.5% - 51.0% ] 50.62% | 81 | 66.7% |
[ 51.5% - 52.0% ] 51.76% | 1,022 | 2.2% |
[ 52.0% - 52.5% ] 52.16% | 1,298 | 2.9% |
[ 52.5% - 53.0% ] 52.61% | 612 | 8.9% |
[ 53.0% - 53.5% ] 53.12% | 642 | 2.5% |
[ 54.0% - 54.5% ] 54.14% | 2,063 | 1.0% |
[ 54.5% - 55.0% ] 54.55% | 473 | 66.7% |
[ 56.5% - 57.0% ] 56.52% | 575 | 4.5% |
[ 58.0% - 58.5% ] 58.30% | 578 | 3.5% |
[ 62.5% - 63.0% ] 62.87% | 676 | 3.6% |
[ 63.0% - 63.5% ] 63.44% | 1,012 | 2.9% |
[ 73.5% - 74.0% ] 73.81% | 126 | 41.9% |
[ 79.0% - 79.5% ] 79.12% | 182 | 50.9% |