Dutch Self-Care Disability
COMPARE
Dutch
Select to Compare
Self-Care Disability
Dutch Self-Care Disability
2.4%
SELF-CARE DISABILITY
77.5/ 100
METRIC RATING
147th/ 347
METRIC RANK
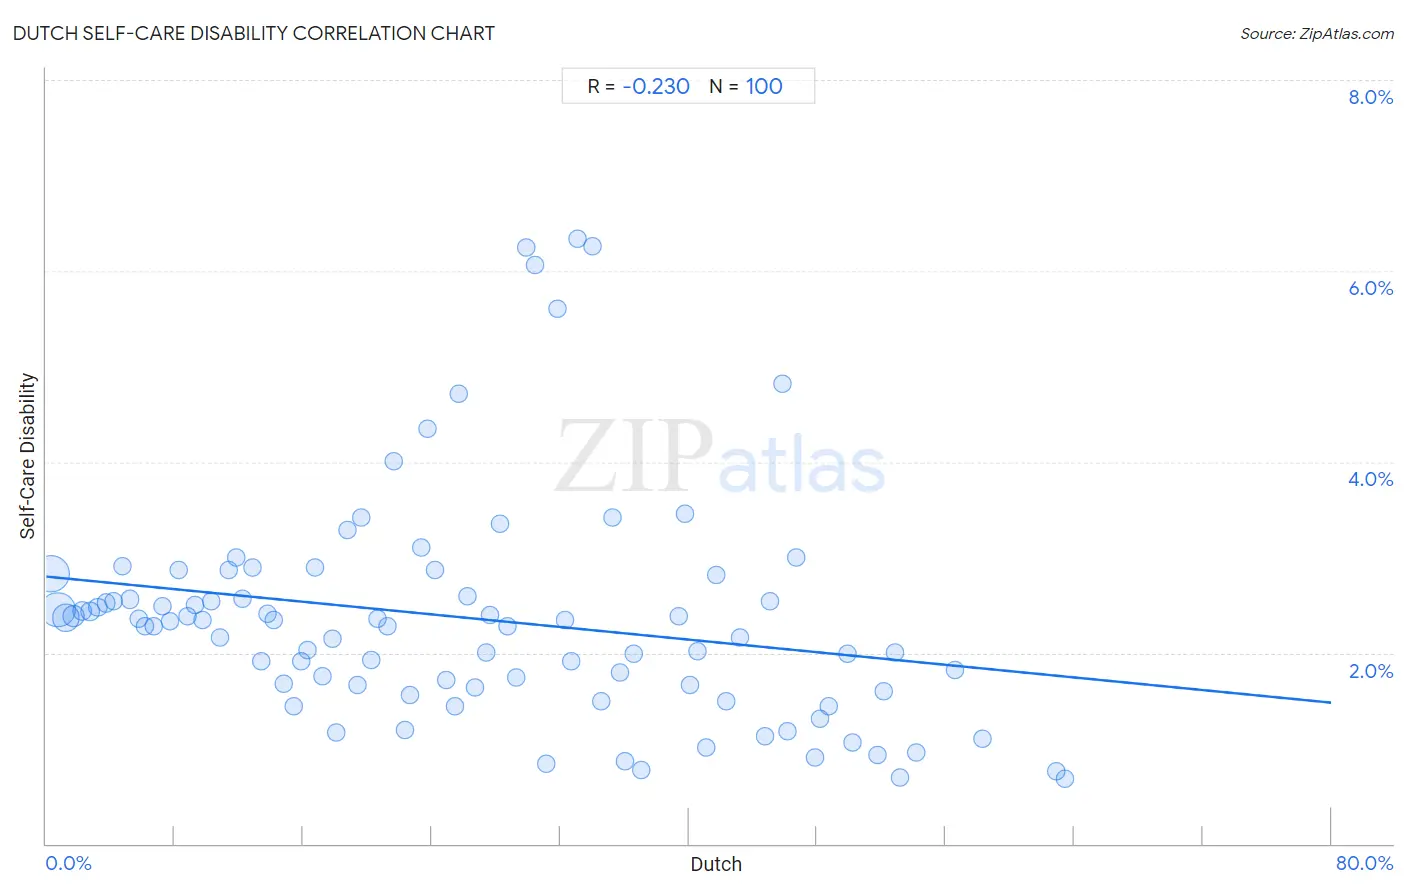
Dutch Self-Care Disability Correlation Chart
The statistical analysis conducted on geographies consisting of 552,476,439 people shows a weak negative correlation between the proportion of Dutch and percentage of population with self-care disability in the United States with a correlation coefficient (R) of -0.230 and weighted average of 2.4%. On average, for every 1% (one percent) increase in Dutch within a typical geography, there is a decrease of 0.017% in percentage of population with self-care disability.
It is essential to understand that the correlation between the percentage of Dutch and percentage of population with self-care disability does not imply a direct cause-and-effect relationship. It remains uncertain whether the presence of Dutch influences an upward or downward trend in the level of percentage of population with self-care disability within an area, or if Dutch simply ended up residing in those areas with higher or lower levels of percentage of population with self-care disability due to other factors.
Demographics Similar to Dutch by Self-Care Disability
In terms of self-care disability, the demographic groups most similar to Dutch are Romanian (2.4%, a difference of 0.11%), Arab (2.4%, a difference of 0.12%), Immigrants from Costa Rica (2.4%, a difference of 0.16%), Israeli (2.4%, a difference of 0.18%), and German (2.4%, a difference of 0.19%).
| Demographics | Rating | Rank | Self-Care Disability |
| Immigrants from Uruguay | 85.4 /100 | #140 | Excellent 2.4% |
| Alaska Natives | 84.5 /100 | #141 | Excellent 2.4% |
| Immigrants from Peru | 83.2 /100 | #142 | Excellent 2.4% |
| Afghans | 82.3 /100 | #143 | Excellent 2.4% |
| Costa Ricans | 80.8 /100 | #144 | Excellent 2.4% |
| Germans | 80.1 /100 | #145 | Excellent 2.4% |
| Israelis | 80.0 /100 | #146 | Good 2.4% |
| Dutch | 77.5 /100 | #147 | Good 2.4% |
| Romanians | 75.8 /100 | #148 | Good 2.4% |
| Arabs | 75.7 /100 | #149 | Good 2.4% |
| Immigrants from Costa Rica | 75.1 /100 | #150 | Good 2.4% |
| Basques | 74.0 /100 | #151 | Good 2.4% |
| Tlingit-Haida | 73.5 /100 | #152 | Good 2.4% |
| Immigrants from England | 73.5 /100 | #153 | Good 2.4% |
| Italians | 72.2 /100 | #154 | Good 2.4% |
Dutch Self-Care Disability Correlation Summary
| Measurement | Dutch Data | Self-Care Disability Data |
| Minimum | 0.27% | 0.69% |
| Maximum | 63.4% | 6.3% |
| Range | 63.2% | 5.7% |
| Mean | 26.5% | 2.4% |
| Median | 25.2% | 2.3% |
| Interquartile 25% (IQ1) | 12.5% | 1.6% |
| Interquartile 75% (IQ3) | 39.9% | 2.7% |
| Interquartile Range (IQR) | 27.4% | 1.1% |
| Standard Deviation (Sample) | 16.6% | 1.2% |
| Standard Deviation (Population) | 16.5% | 1.2% |
Correlation Details
| Dutch Percentile | Sample Size | Self-Care Disability |
[ 0.0% - 0.5% ] 0.27% | 192,686,551 | 2.8% |
[ 0.5% - 1.0% ] 0.74% | 173,052,174 | 2.4% |
[ 1.0% - 1.5% ] 1.22% | 97,566,914 | 2.4% |
[ 1.5% - 2.0% ] 1.72% | 42,176,406 | 2.4% |
[ 2.0% - 2.5% ] 2.23% | 19,079,155 | 2.4% |
[ 2.5% - 3.0% ] 2.71% | 9,640,475 | 2.4% |
[ 3.0% - 3.5% ] 3.23% | 5,191,782 | 2.5% |
[ 3.5% - 4.0% ] 3.73% | 2,981,767 | 2.5% |
[ 4.0% - 4.5% ] 4.22% | 1,859,533 | 2.5% |
[ 4.5% - 5.0% ] 4.75% | 1,290,350 | 2.9% |
[ 5.0% - 5.5% ] 5.24% | 894,450 | 2.6% |
[ 5.5% - 6.0% ] 5.77% | 777,397 | 2.4% |
[ 6.0% - 6.5% ] 6.18% | 590,098 | 2.3% |
[ 6.5% - 7.0% ] 6.72% | 397,938 | 2.3% |
[ 7.0% - 7.5% ] 7.23% | 365,893 | 2.5% |
[ 7.5% - 8.0% ] 7.70% | 321,105 | 2.3% |
[ 8.0% - 8.5% ] 8.24% | 249,182 | 2.9% |
[ 8.5% - 9.0% ] 8.78% | 337,464 | 2.4% |
[ 9.0% - 9.5% ] 9.25% | 261,220 | 2.5% |
[ 9.5% - 10.0% ] 9.72% | 145,409 | 2.3% |
[ 10.0% - 10.5% ] 10.26% | 191,446 | 2.5% |
[ 10.5% - 11.0% ] 10.79% | 124,905 | 2.2% |
[ 11.0% - 11.5% ] 11.38% | 99,193 | 2.9% |
[ 11.5% - 12.0% ] 11.79% | 78,694 | 3.0% |
[ 12.0% - 12.5% ] 12.20% | 261,811 | 2.6% |
[ 12.5% - 13.0% ] 12.81% | 110,206 | 2.9% |
[ 13.0% - 13.5% ] 13.40% | 84,520 | 1.9% |
[ 13.5% - 14.0% ] 13.78% | 82,002 | 2.4% |
[ 14.0% - 14.5% ] 14.16% | 65,919 | 2.3% |
[ 14.5% - 15.0% ] 14.76% | 103,265 | 1.7% |
[ 15.0% - 15.5% ] 15.40% | 49,114 | 1.4% |
[ 15.5% - 16.0% ] 15.84% | 176,404 | 1.9% |
[ 16.0% - 16.5% ] 16.23% | 187,865 | 2.0% |
[ 16.5% - 17.0% ] 16.77% | 21,740 | 2.9% |
[ 17.0% - 17.5% ] 17.21% | 54,653 | 1.8% |
[ 17.5% - 18.0% ] 17.81% | 77,668 | 2.1% |
[ 18.0% - 18.5% ] 18.08% | 46,382 | 1.2% |
[ 18.5% - 19.0% ] 18.73% | 33,522 | 3.3% |
[ 19.0% - 19.5% ] 19.37% | 64,327 | 1.7% |
[ 19.5% - 20.0% ] 19.61% | 19,336 | 3.4% |
[ 20.0% - 20.5% ] 20.24% | 9,467 | 1.9% |
[ 20.5% - 21.0% ] 20.66% | 15,798 | 2.4% |
[ 21.0% - 21.5% ] 21.25% | 5,966 | 2.3% |
[ 21.5% - 22.0% ] 21.60% | 2,880 | 4.0% |
[ 22.0% - 22.5% ] 22.34% | 34,282 | 1.2% |
[ 22.5% - 23.0% ] 22.65% | 84,018 | 1.6% |
[ 23.0% - 23.5% ] 23.31% | 5,852 | 3.1% |
[ 23.5% - 24.0% ] 23.76% | 16,286 | 4.4% |
[ 24.0% - 24.5% ] 24.23% | 49,480 | 2.9% |
[ 24.5% - 25.0% ] 24.93% | 1,003 | 1.7% |
[ 25.0% - 25.5% ] 25.48% | 32,572 | 1.4% |
[ 25.5% - 26.0% ] 25.69% | 2,304 | 4.7% |
[ 26.0% - 26.5% ] 26.23% | 8,281 | 2.6% |
[ 26.5% - 27.0% ] 26.68% | 29,010 | 1.6% |
[ 27.0% - 27.5% ] 27.41% | 21,038 | 2.0% |
[ 27.5% - 28.0% ] 27.63% | 5,277 | 2.4% |
[ 28.0% - 28.5% ] 28.22% | 3,809 | 3.4% |
[ 28.5% - 29.0% ] 28.73% | 63,301 | 2.3% |
[ 29.0% - 29.5% ] 29.28% | 16,651 | 1.7% |
[ 29.5% - 30.0% ] 29.87% | 1,299 | 6.2% |
[ 30.0% - 30.5% ] 30.43% | 6,358 | 6.1% |
[ 31.0% - 31.5% ] 31.13% | 30,444 | 0.84% |
[ 31.5% - 32.0% ] 31.79% | 7,612 | 5.6% |
[ 32.0% - 32.5% ] 32.31% | 1,860 | 2.3% |
[ 32.5% - 33.0% ] 32.68% | 1,536 | 1.9% |
[ 33.0% - 33.5% ] 33.10% | 142 | 6.3% |
[ 33.5% - 34.0% ] 33.97% | 839 | 6.3% |
[ 34.5% - 35.0% ] 34.59% | 876 | 1.5% |
[ 35.0% - 35.5% ] 35.27% | 879 | 3.4% |
[ 35.5% - 36.0% ] 35.72% | 4,972 | 1.8% |
[ 36.0% - 36.5% ] 36.06% | 27,793 | 0.86% |
[ 36.5% - 37.0% ] 36.58% | 3,734 | 2.0% |
[ 37.0% - 37.5% ] 37.04% | 1,142 | 0.78% |
[ 39.0% - 39.5% ] 39.36% | 719 | 2.4% |
[ 39.5% - 40.0% ] 39.75% | 478 | 3.5% |
[ 40.0% - 40.5% ] 40.09% | 23,394 | 1.7% |
[ 40.5% - 41.0% ] 40.54% | 30,231 | 2.0% |
[ 41.0% - 41.5% ] 41.12% | 40,439 | 1.0% |
[ 41.5% - 42.0% ] 41.74% | 5,326 | 2.8% |
[ 42.0% - 42.5% ] 42.37% | 6,988 | 1.5% |
[ 43.0% - 43.5% ] 43.16% | 7,714 | 2.2% |
[ 44.5% - 45.0% ] 44.78% | 8,483 | 1.1% |
[ 45.0% - 45.5% ] 45.08% | 4,887 | 2.5% |
[ 45.5% - 46.0% ] 45.87% | 351 | 4.8% |
[ 46.0% - 46.5% ] 46.12% | 10,567 | 1.2% |
[ 46.5% - 47.0% ] 46.66% | 1,749 | 3.0% |
[ 47.5% - 48.0% ] 47.85% | 1,421 | 0.90% |
[ 48.0% - 48.5% ] 48.18% | 1,509 | 1.3% |
[ 48.5% - 49.0% ] 48.68% | 7,130 | 1.4% |
[ 49.5% - 50.0% ] 49.85% | 1,314 | 2.0% |
[ 50.0% - 50.5% ] 50.22% | 19,798 | 1.1% |
[ 51.5% - 52.0% ] 51.76% | 1,022 | 0.93% |
[ 52.0% - 52.5% ] 52.15% | 1,256 | 1.6% |
[ 52.5% - 53.0% ] 52.80% | 1,017 | 2.0% |
[ 53.0% - 53.5% ] 53.12% | 642 | 0.69% |
[ 54.0% - 54.5% ] 54.14% | 2,063 | 0.96% |
[ 56.5% - 57.0% ] 56.55% | 679 | 1.8% |
[ 58.0% - 58.5% ] 58.30% | 578 | 1.1% |
[ 62.5% - 63.0% ] 62.87% | 676 | 0.76% |
[ 63.0% - 63.5% ] 63.44% | 1,012 | 0.69% |