Zip Codes with the Highest Percentage of Families with Income Above $200,000 in Florissant, MO
RELATED REPORTS & OPTIONS
Family Income | $200k+
Florissant
Compare Zip Codes
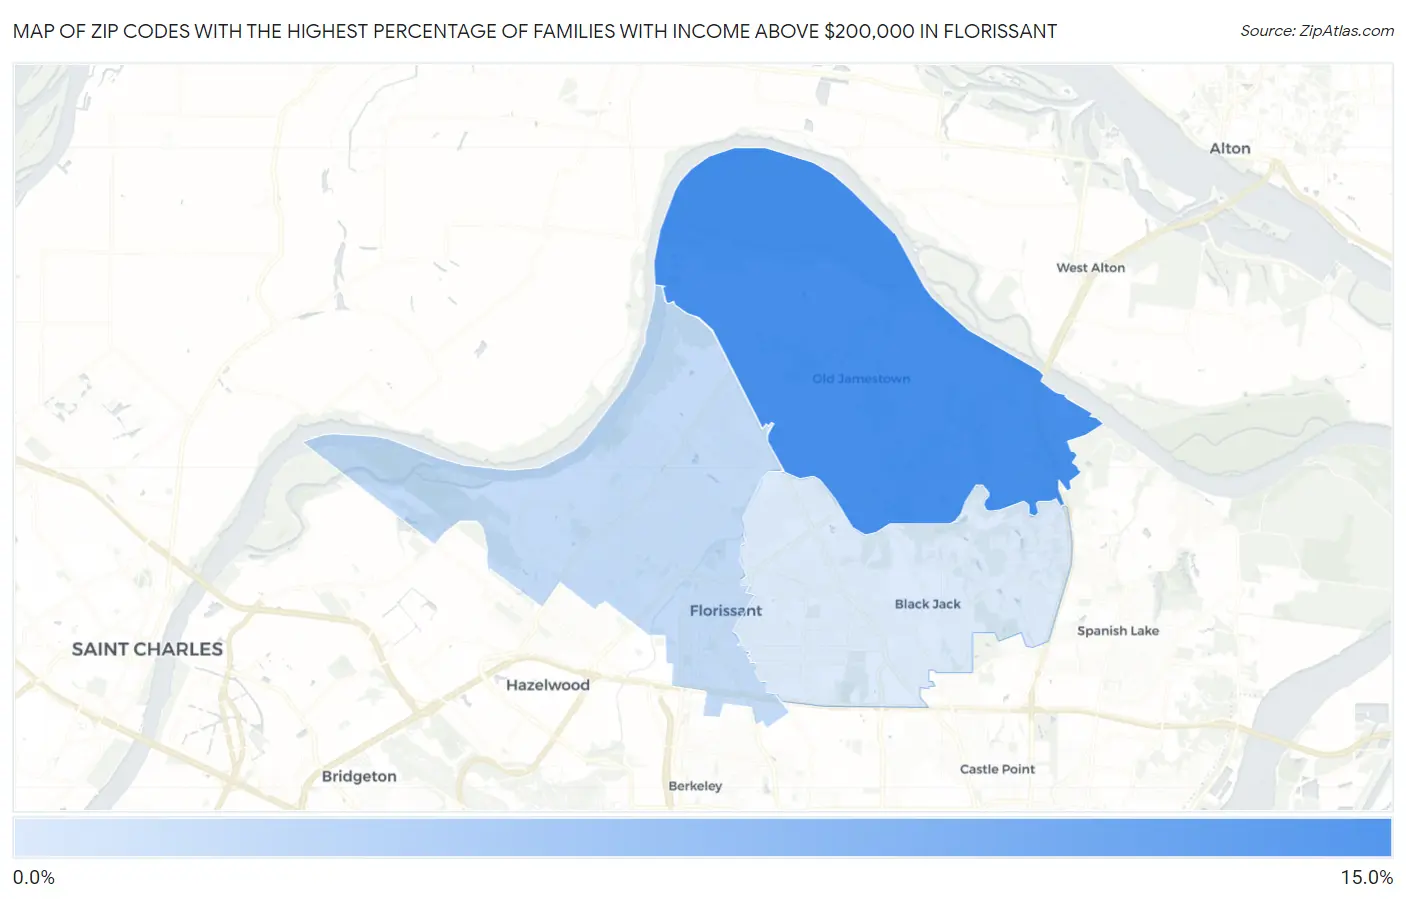
Map of Zip Codes with the Highest Percentage of Families with Income Above $200,000 in Florissant
2.8%
13.5%
Zip Codes with the Highest Percentage of Families with Income Above $200,000 in Florissant, MO
| Zip Code | Families with Income > $200k | vs State | vs National | |
| 1. | 63034 | 13.5% | 10.1%(+3.40)#118 | 14.8%(-1.30)#7,869 |
| 2. | 63031 | 4.5% | 10.1%(-5.60)#427 | 14.8%(-10.3)#19,364 |
| 3. | 63033 | 2.8% | 10.1%(-7.30)#559 | 14.8%(-12.0)#22,882 |
1
Common Questions
What are the Top Zip Codes with the Highest Percentage of Families with Income Above $200,000 in Florissant, MO?
Top Zip Codes with the Highest Percentage of Families with Income Above $200,000 in Florissant, MO are:
What zip code has the Highest Percentage of Families with Income Above $200,000 in Florissant, MO?
63034 has the Highest Percentage of Families with Income Above $200,000 in Florissant, MO with 13.5%.
What is the Percentage of Families with Income Above $200,000 in Florissant, MO?
Percentage of Families with Income Above $200,000 in Florissant is 2.4%.
What is the Percentage of Families with Income Above $200,000 in Missouri?
Percentage of Families with Income Above $200,000 in Missouri is 10.1%.
What is the Percentage of Families with Income Above $200,000 in the United States?
Percentage of Families with Income Above $200,000 in the United States is 14.8%.