Bellerive Acres, MO Map & Demographics
Bellerive Acres Map
Bellerive Acres Overview
$55,126
PER CAPITA INCOME
$151,250
AVG FAMILY INCOME
$116,979
AVG HOUSEHOLD INCOME
10.4%
WAGE / INCOME GAP [ % ]
89.6¢/ $1
WAGE / INCOME GAP [ $ ]
0.37
INEQUALITY / GINI INDEX
421
TOTAL POPULATION
176
MALE POPULATION
245
FEMALE POPULATION
71.84
MALES / 100 FEMALES
139.20
FEMALES / 100 MALES
51.3
MEDIAN AGE
3.1
AVG FAMILY SIZE
2.6
AVG HOUSEHOLD SIZE
220
LABOR FORCE [ PEOPLE ]
62.1%
PERCENT IN LABOR FORCE
5.5%
UNEMPLOYMENT RATE
Income in Bellerive Acres
Income Overview in Bellerive Acres
Per Capita Income in Bellerive Acres is $55,126, while median incomes of families and households are $151,250 and $116,979 respectively.
| Characteristic | Number | Measure |
| Per Capita Income | 421 | $55,126 |
| Median Family Income | 123 | $151,250 |
| Mean Family Income | 123 | $171,650 |
| Median Household Income | 159 | $116,979 |
| Mean Household Income | 159 | $144,435 |
| Income Deficit | 123 | $0 |
| Wage / Income Gap (%) | 421 | 10.44% |
| Wage / Income Gap ($) | 421 | 89.56¢ per $1 |
| Gini / Inequality Index | 421 | 0.37 |
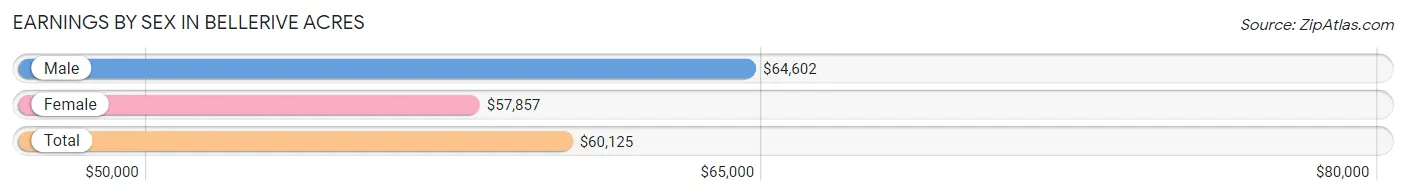
Earnings by Sex in Bellerive Acres
Average Earnings in Bellerive Acres are $60,125, $64,602 for men and $57,857 for women, a difference of 10.4%.
| Sex | Number | Average Earnings |
| Male | 121 (51.5%) | $64,602 |
| Female | 114 (48.5%) | $57,857 |
| Total | 235 (100.0%) | $60,125 |
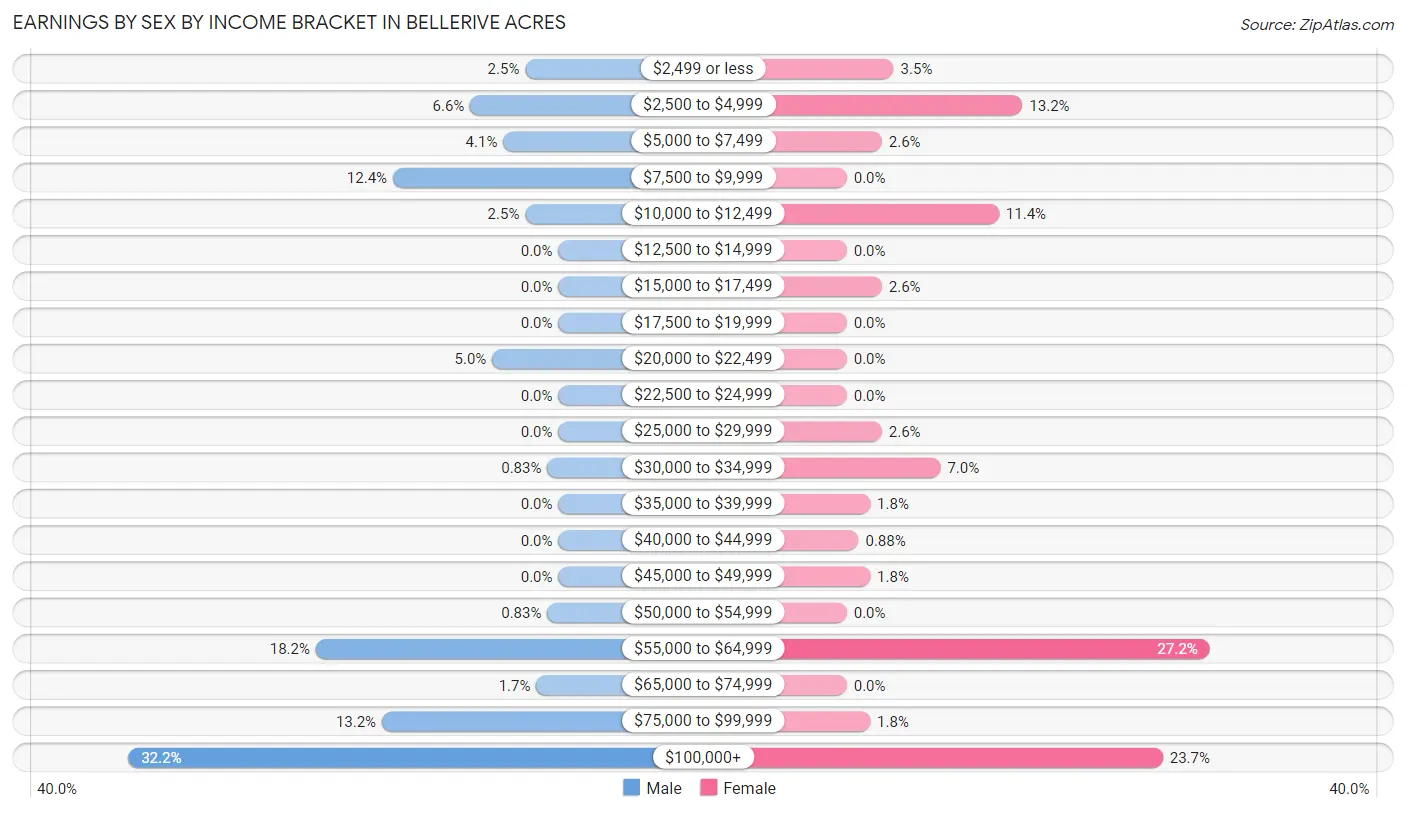
Earnings by Sex by Income Bracket in Bellerive Acres
The most common earnings brackets in Bellerive Acres are $100,000+ for men (39 | 32.2%) and $55,000 to $64,999 for women (31 | 27.2%).
| Income | Male | Female |
| $2,499 or less | 3 (2.5%) | 4 (3.5%) |
| $2,500 to $4,999 | 8 (6.6%) | 15 (13.2%) |
| $5,000 to $7,499 | 5 (4.1%) | 3 (2.6%) |
| $7,500 to $9,999 | 15 (12.4%) | 0 (0.0%) |
| $10,000 to $12,499 | 3 (2.5%) | 13 (11.4%) |
| $12,500 to $14,999 | 0 (0.0%) | 0 (0.0%) |
| $15,000 to $17,499 | 0 (0.0%) | 3 (2.6%) |
| $17,500 to $19,999 | 0 (0.0%) | 0 (0.0%) |
| $20,000 to $22,499 | 6 (5.0%) | 0 (0.0%) |
| $22,500 to $24,999 | 0 (0.0%) | 0 (0.0%) |
| $25,000 to $29,999 | 0 (0.0%) | 3 (2.6%) |
| $30,000 to $34,999 | 1 (0.8%) | 8 (7.0%) |
| $35,000 to $39,999 | 0 (0.0%) | 2 (1.8%) |
| $40,000 to $44,999 | 0 (0.0%) | 1 (0.9%) |
| $45,000 to $49,999 | 0 (0.0%) | 2 (1.8%) |
| $50,000 to $54,999 | 1 (0.8%) | 0 (0.0%) |
| $55,000 to $64,999 | 22 (18.2%) | 31 (27.2%) |
| $65,000 to $74,999 | 2 (1.7%) | 0 (0.0%) |
| $75,000 to $99,999 | 16 (13.2%) | 2 (1.8%) |
| $100,000+ | 39 (32.2%) | 27 (23.7%) |
| Total | 121 (100.0%) | 114 (100.0%) |
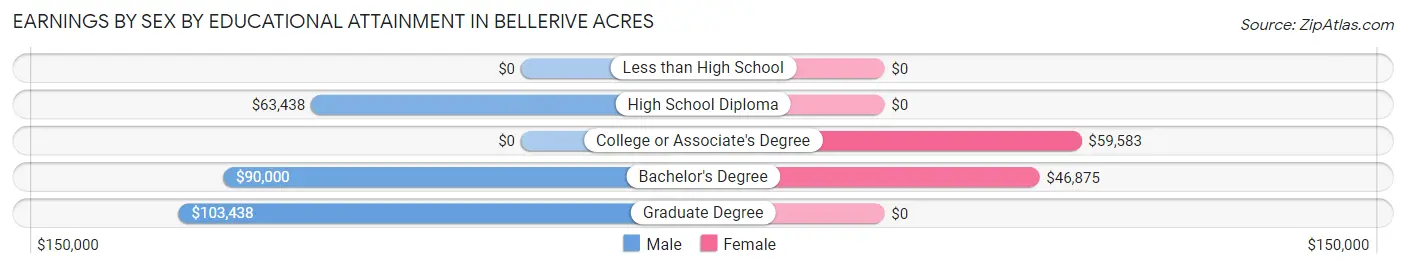
Earnings by Sex by Educational Attainment in Bellerive Acres
Average earnings in Bellerive Acres are $81,389 for men and $58,819 for women, a difference of 27.7%. Men with an educational attainment of graduate degree enjoy the highest average annual earnings of $103,438, while those with high school diploma education earn the least with $63,438. Women with an educational attainment of college or associate's degree earn the most with the average annual earnings of $59,583, while those with bachelor's degree education have the smallest earnings of $46,875.
| Educational Attainment | Male Income | Female Income |
| Less than High School | - | - |
| High School Diploma | $63,438 | $0 |
| College or Associate's Degree | - | - |
| Bachelor's Degree | $90,000 | $46,875 |
| Graduate Degree | $103,438 | $0 |
| Total | $81,389 | $58,819 |
Family Income in Bellerive Acres
Family Income Brackets in Bellerive Acres
According to the Bellerive Acres family income data, there are 43 families falling into the $100,000 to $149,999 income range, which is the most common income bracket and makes up 35.0% of all families.
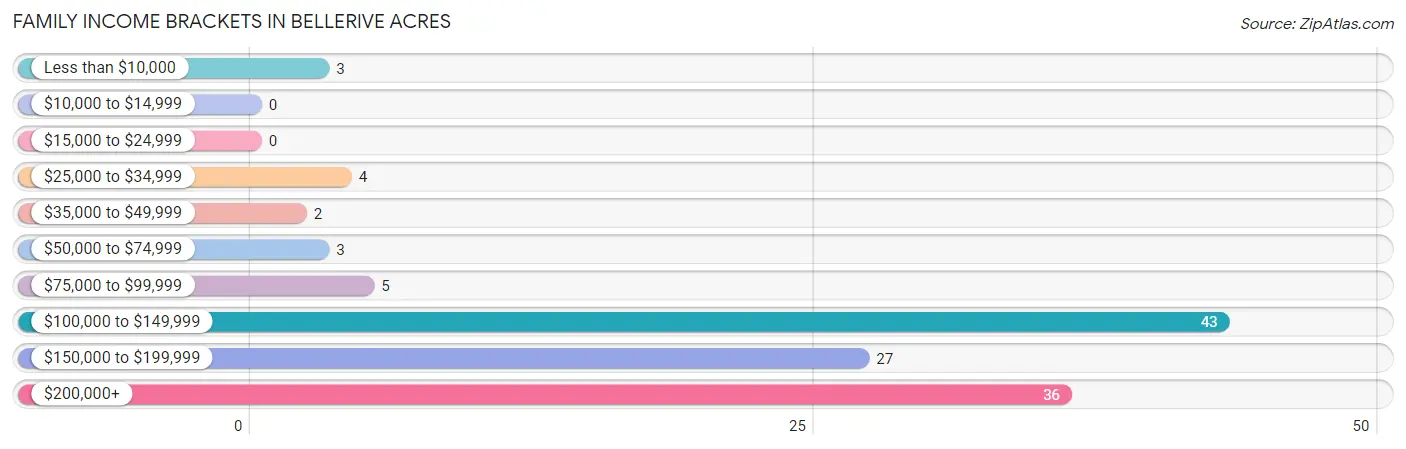
| Income Bracket | # Families | % Families |
| Less than $10,000 | 3 | 2.4% |
| $10,000 to $14,999 | 0 | 0.0% |
| $15,000 to $24,999 | 0 | 0.0% |
| $25,000 to $34,999 | 4 | 3.3% |
| $35,000 to $49,999 | 2 | 1.6% |
| $50,000 to $74,999 | 3 | 2.4% |
| $75,000 to $99,999 | 5 | 4.1% |
| $100,000 to $149,999 | 43 | 35.0% |
| $150,000 to $199,999 | 27 | 22.0% |
| $200,000+ | 36 | 29.3% |
Family Income by Famaliy Size in Bellerive Acres
3-person families (31 | 25.2%) account for the highest median family income in Bellerive Acres with $250,001 per family, while 3-person families (31 | 25.2%) have the highest median income of $83,334 per family member.
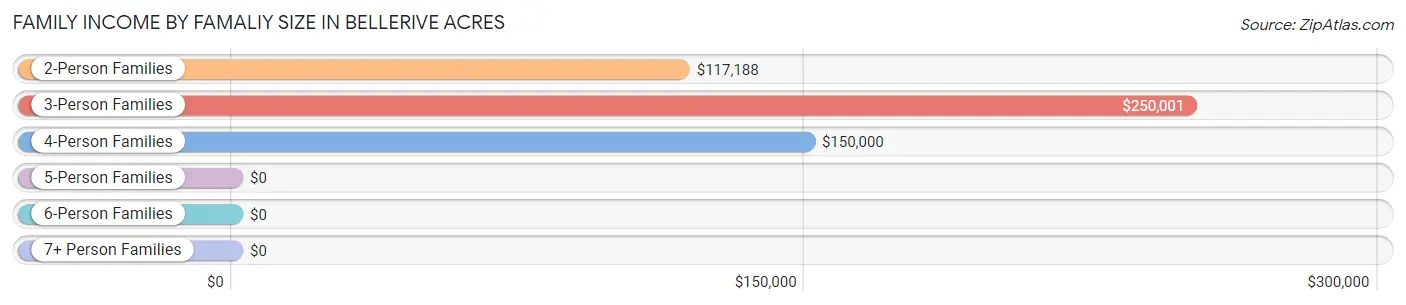
| Income Bracket | # Families | Median Income |
| 2-Person Families | 63 (51.2%) | $117,188 |
| 3-Person Families | 31 (25.2%) | $250,001 |
| 4-Person Families | 28 (22.8%) | $150,000 |
| 5-Person Families | 1 (0.8%) | $0 |
| 6-Person Families | 0 (0.0%) | $0 |
| 7+ Person Families | 0 (0.0%) | $0 |
| Total | 123 (100.0%) | $151,250 |
Family Income by Number of Earners in Bellerive Acres
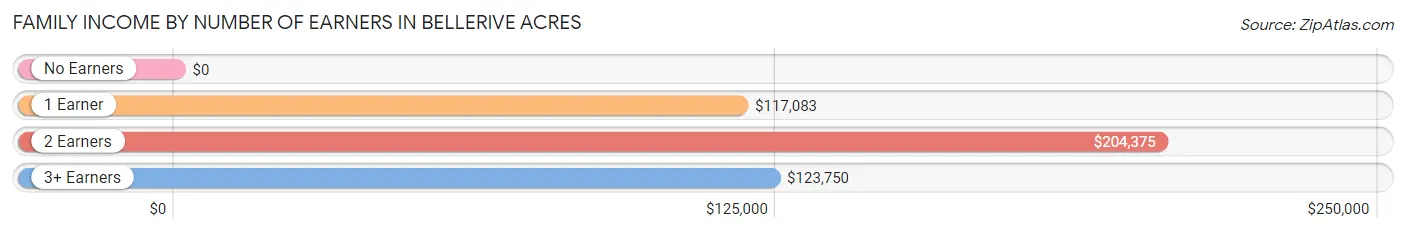
| Number of Earners | # Families | Median Income |
| No Earners | 13 (10.6%) | $0 |
| 1 Earner | 42 (34.2%) | $117,083 |
| 2 Earners | 50 (40.6%) | $204,375 |
| 3+ Earners | 18 (14.6%) | $123,750 |
| Total | 123 (100.0%) | $151,250 |
Household Income in Bellerive Acres
Household Income Brackets in Bellerive Acres
With 43 households falling in the category, the $100,000 to $149,999 income range is the most frequent in Bellerive Acres, accounting for 27.0% of all households.
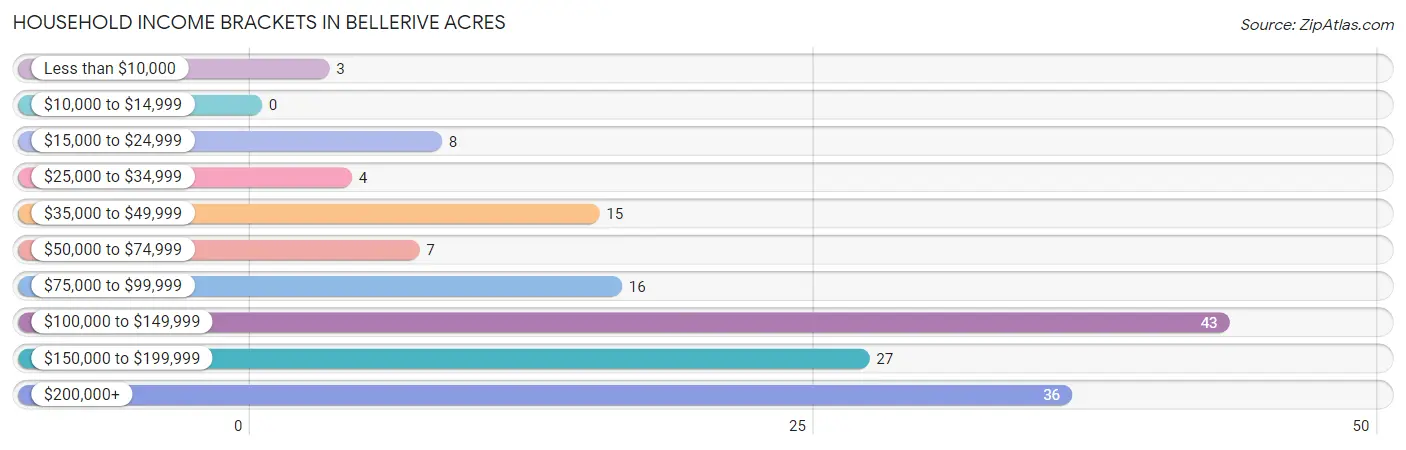
| Income Bracket | # Households | % Households |
| Less than $10,000 | 3 | 1.9% |
| $10,000 to $14,999 | 0 | 0.0% |
| $15,000 to $24,999 | 8 | 5.0% |
| $25,000 to $34,999 | 4 | 2.5% |
| $35,000 to $49,999 | 15 | 9.4% |
| $50,000 to $74,999 | 7 | 4.4% |
| $75,000 to $99,999 | 16 | 10.1% |
| $100,000 to $149,999 | 43 | 27.0% |
| $150,000 to $199,999 | 27 | 17.0% |
| $200,000+ | 36 | 22.6% |
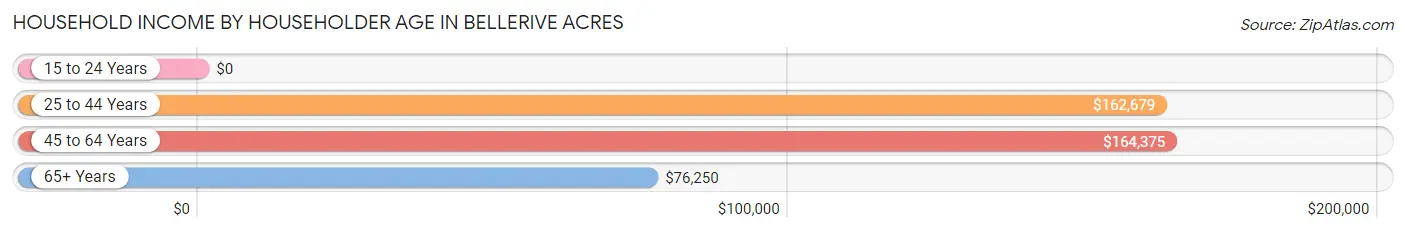
Household Income by Householder Age in Bellerive Acres
The median household income in Bellerive Acres is $116,979, with the highest median household income of $164,375 found in the 45 to 64 years age bracket for the primary householder. A total of 73 households (45.9%) fall into this category.
| Income Bracket | # Households | Median Income |
| 15 to 24 Years | 0 (0.0%) | $0 |
| 25 to 44 Years | 19 (11.9%) | $162,679 |
| 45 to 64 Years | 73 (45.9%) | $164,375 |
| 65+ Years | 67 (42.1%) | $76,250 |
| Total | 159 (100.0%) | $116,979 |
Poverty in Bellerive Acres
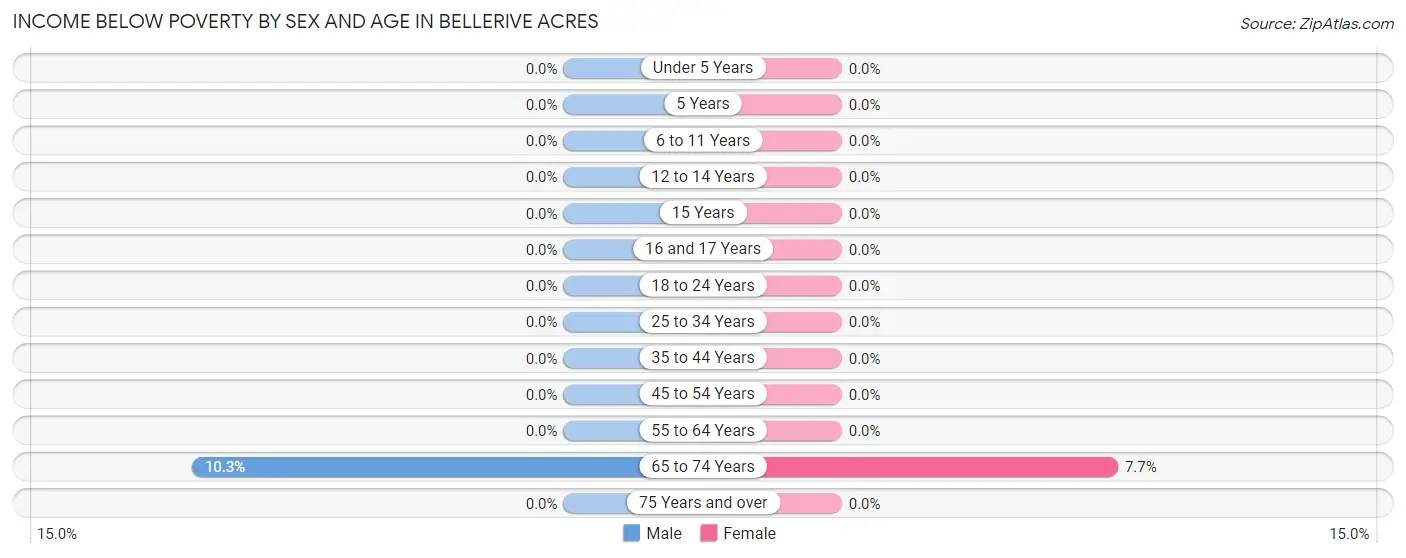
Income Below Poverty by Sex and Age in Bellerive Acres
With 1.7% poverty level for males and 1.2% for females among the residents of Bellerive Acres, 65 to 74 year old males and 65 to 74 year old females are the most vulnerable to poverty, with 3 males (10.3%) and 3 females (7.7%) in their respective age groups living below the poverty level.
| Age Bracket | Male | Female |
| Under 5 Years | 0 (0.0%) | 0 (0.0%) |
| 5 Years | 0 (0.0%) | 0 (0.0%) |
| 6 to 11 Years | 0 (0.0%) | 0 (0.0%) |
| 12 to 14 Years | 0 (0.0%) | 0 (0.0%) |
| 15 Years | 0 (0.0%) | 0 (0.0%) |
| 16 and 17 Years | 0 (0.0%) | 0 (0.0%) |
| 18 to 24 Years | 0 (0.0%) | 0 (0.0%) |
| 25 to 34 Years | 0 (0.0%) | 0 (0.0%) |
| 35 to 44 Years | 0 (0.0%) | 0 (0.0%) |
| 45 to 54 Years | 0 (0.0%) | 0 (0.0%) |
| 55 to 64 Years | 0 (0.0%) | 0 (0.0%) |
| 65 to 74 Years | 3 (10.3%) | 3 (7.7%) |
| 75 Years and over | 0 (0.0%) | 0 (0.0%) |
| Total | 3 (1.7%) | 3 (1.2%) |
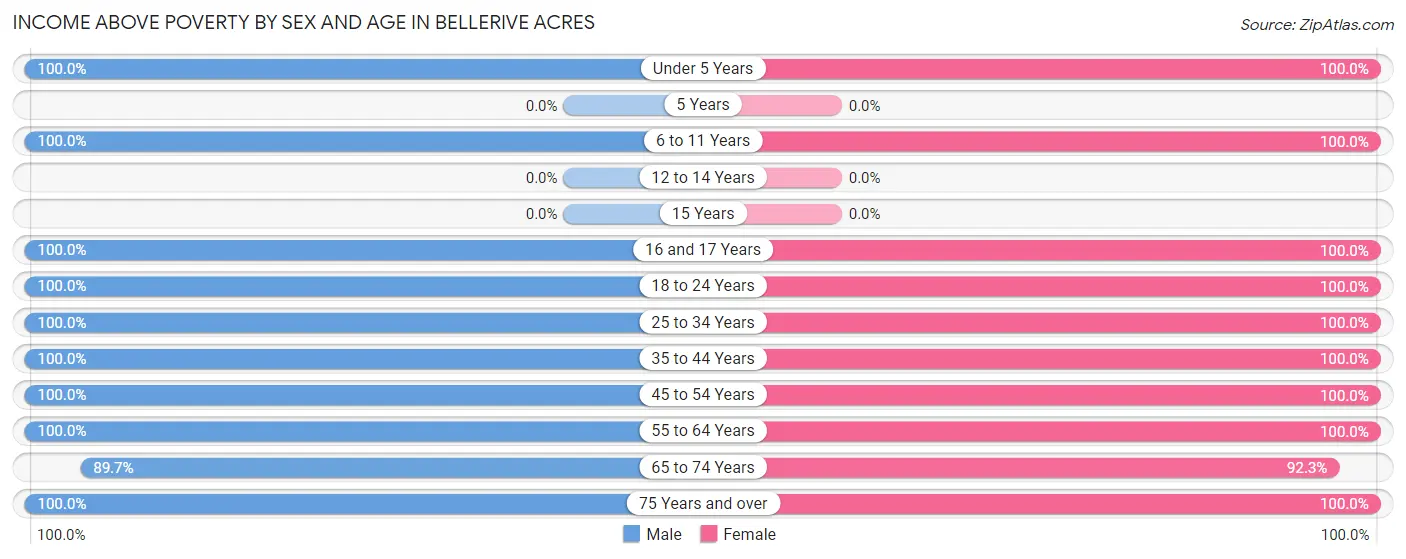
Income Above Poverty by Sex and Age in Bellerive Acres
According to the poverty statistics in Bellerive Acres, males aged under 5 years and females aged under 5 years are the age groups that are most secure financially, with 100.0% of males and 100.0% of females in these age groups living above the poverty line.
| Age Bracket | Male | Female |
| Under 5 Years | 3 (100.0%) | 54 (100.0%) |
| 5 Years | 0 (0.0%) | 0 (0.0%) |
| 6 to 11 Years | 1 (100.0%) | 9 (100.0%) |
| 12 to 14 Years | 0 (0.0%) | 0 (0.0%) |
| 15 Years | 0 (0.0%) | 0 (0.0%) |
| 16 and 17 Years | 1 (100.0%) | 16 (100.0%) |
| 18 to 24 Years | 33 (100.0%) | 4 (100.0%) |
| 25 to 34 Years | 4 (100.0%) | 8 (100.0%) |
| 35 to 44 Years | 24 (100.0%) | 12 (100.0%) |
| 45 to 54 Years | 33 (100.0%) | 40 (100.0%) |
| 55 to 64 Years | 43 (100.0%) | 37 (100.0%) |
| 65 to 74 Years | 26 (89.7%) | 36 (92.3%) |
| 75 Years and over | 5 (100.0%) | 26 (100.0%) |
| Total | 173 (98.3%) | 242 (98.8%) |
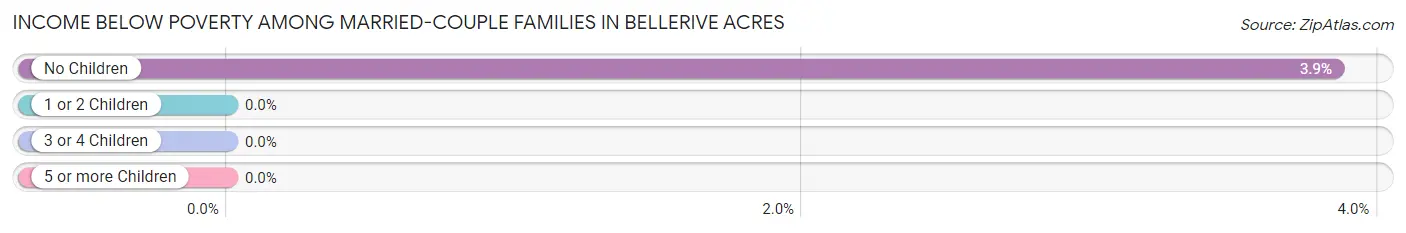
Income Below Poverty Among Married-Couple Families in Bellerive Acres
The poverty statistics for married-couple families in Bellerive Acres show that 2.6% or 3 of the total 115 families live below the poverty line. Families with no children have the highest poverty rate of 3.8%, comprising of 3 families. On the other hand, families with 1 or 2 children have the lowest poverty rate of 0.0%, which includes 0 families.
| Children | Above Poverty | Below Poverty |
| No Children | 75 (96.2%) | 3 (3.8%) |
| 1 or 2 Children | 36 (100.0%) | 0 (0.0%) |
| 3 or 4 Children | 1 (100.0%) | 0 (0.0%) |
| 5 or more Children | 0 (0.0%) | 0 (0.0%) |
| Total | 112 (97.4%) | 3 (2.6%) |
Income Below Poverty Among Single-Parent Households in Bellerive Acres
| Children | Single Father | Single Mother |
| No Children | 0 (0.0%) | 0 (0.0%) |
| 1 or 2 Children | 0 (0.0%) | 0 (0.0%) |
| 3 or 4 Children | 0 (0.0%) | 0 (0.0%) |
| 5 or more Children | 0 (0.0%) | 0 (0.0%) |
| Total | 0 (0.0%) | 0 (0.0%) |
Income Below Poverty Among Married-Couple vs Single-Parent Households in Bellerive Acres
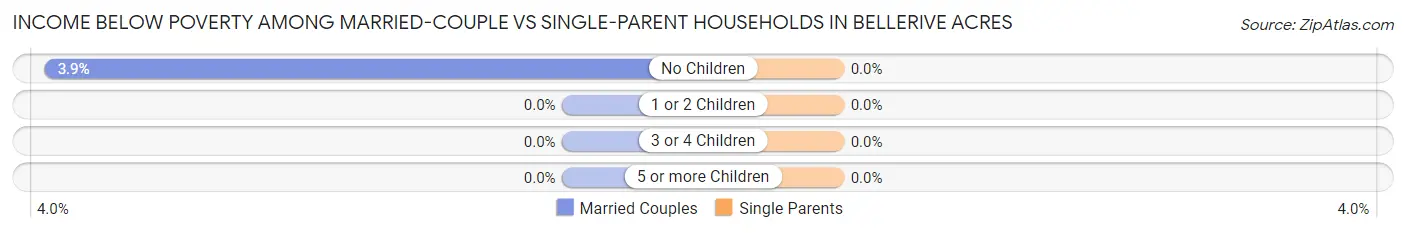
| Children | Married-Couple Families | Single-Parent Households |
| No Children | 3 (3.8%) | 0 (0.0%) |
| 1 or 2 Children | 0 (0.0%) | 0 (0.0%) |
| 3 or 4 Children | 0 (0.0%) | 0 (0.0%) |
| 5 or more Children | 0 (0.0%) | 0 (0.0%) |
| Total | 3 (2.6%) | 0 (0.0%) |
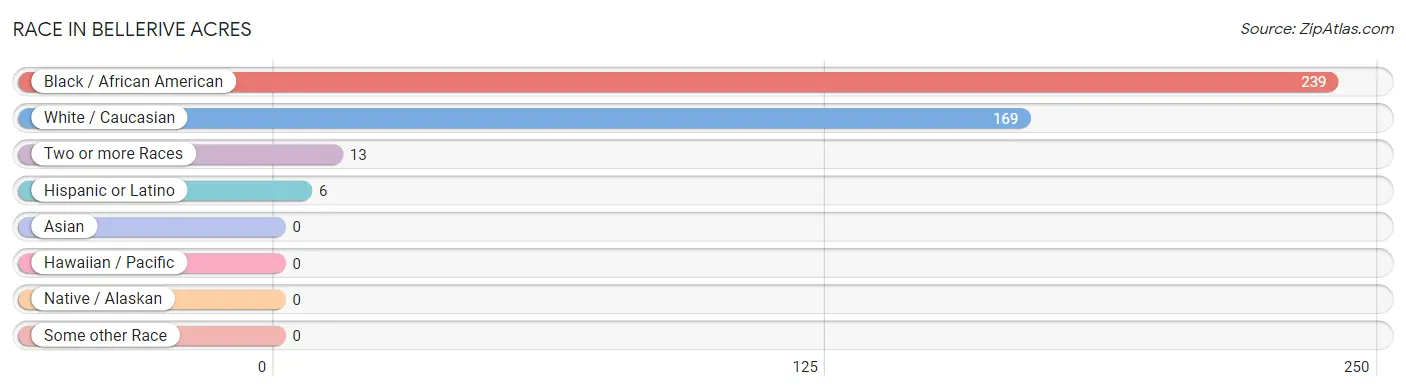
Race in Bellerive Acres
The most populous races in Bellerive Acres are Black / African American (239 | 56.8%), White / Caucasian (169 | 40.1%), and Two or more Races (13 | 3.1%).
| Race | # Population | % Population |
| Asian | 0 | 0.0% |
| Black / African American | 239 | 56.8% |
| Hawaiian / Pacific | 0 | 0.0% |
| Hispanic or Latino | 6 | 1.4% |
| Native / Alaskan | 0 | 0.0% |
| White / Caucasian | 169 | 40.1% |
| Two or more Races | 13 | 3.1% |
| Some other Race | 0 | 0.0% |
| Total | 421 | 100.0% |
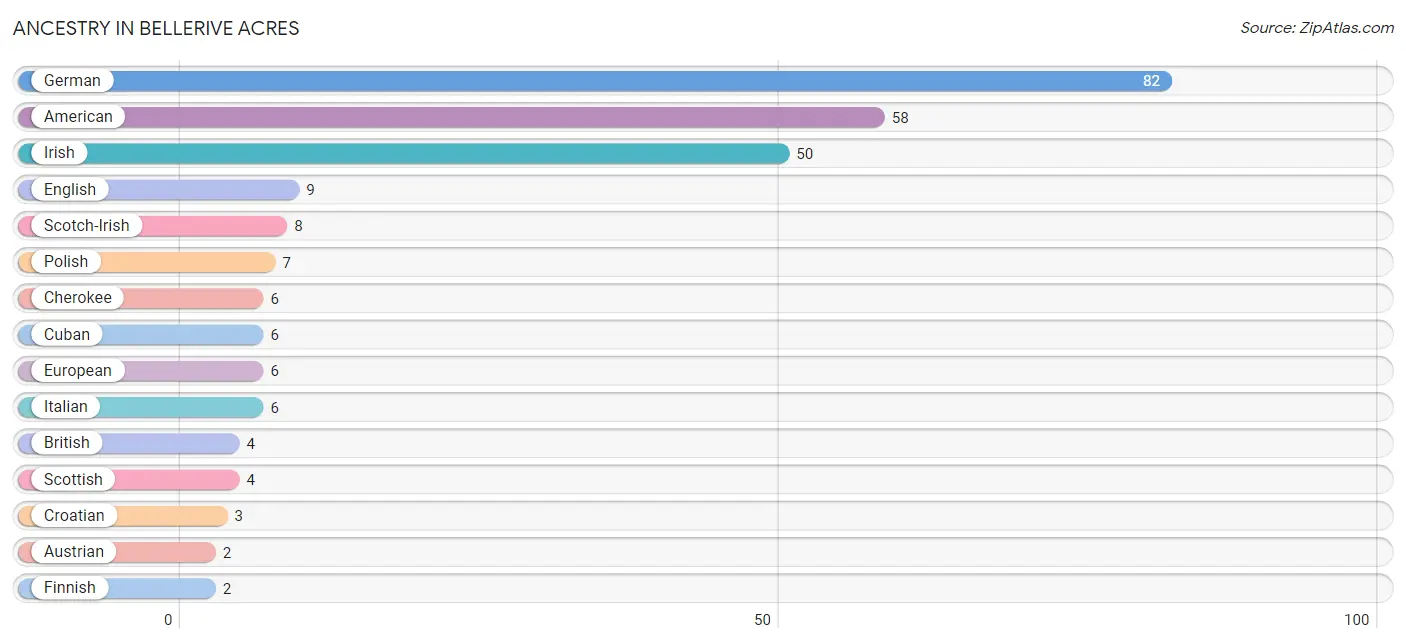
Ancestry in Bellerive Acres
The most populous ancestries reported in Bellerive Acres are German (82 | 19.5%), American (58 | 13.8%), Irish (50 | 11.9%), English (9 | 2.1%), and Scotch-Irish (8 | 1.9%), together accounting for 49.2% of all Bellerive Acres residents.
| Ancestry | # Population | % Population |
| American | 58 | 13.8% |
| Austrian | 2 | 0.5% |
| British | 4 | 0.9% |
| Cherokee | 6 | 1.4% |
| Croatian | 3 | 0.7% |
| Cuban | 6 | 1.4% |
| English | 9 | 2.1% |
| European | 6 | 1.4% |
| Finnish | 2 | 0.5% |
| German | 82 | 19.5% |
| Guyanese | 1 | 0.2% |
| Irish | 50 | 11.9% |
| Italian | 6 | 1.4% |
| Polish | 7 | 1.7% |
| Scotch-Irish | 8 | 1.9% |
| Scottish | 4 | 0.9% |
| Welsh | 2 | 0.5% | View All 17 Rows |
Immigrants in Bellerive Acres
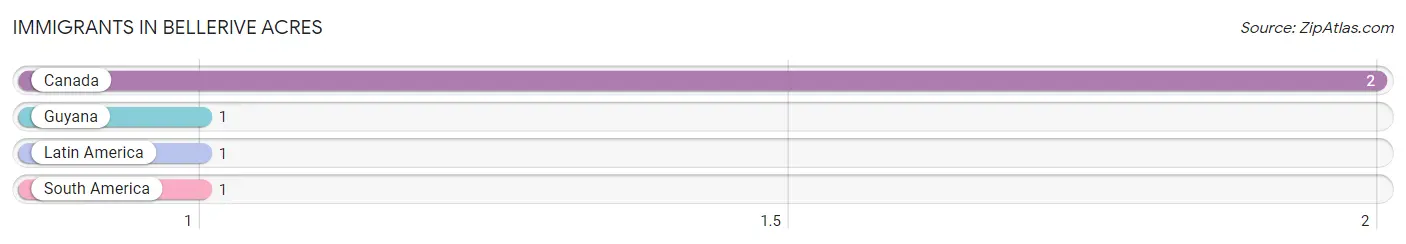
The most numerous immigrant groups reported in Bellerive Acres came from Canada (2 | 0.5%), Guyana (1 | 0.2%), Latin America (1 | 0.2%), and South America (1 | 0.2%), together accounting for 1.2% of all Bellerive Acres residents.
| Immigration Origin | # Population | % Population |
| Canada | 2 | 0.5% |
| Guyana | 1 | 0.2% |
| Latin America | 1 | 0.2% |
| South America | 1 | 0.2% | View All 4 Rows |
Sex and Age in Bellerive Acres
Sex and Age in Bellerive Acres
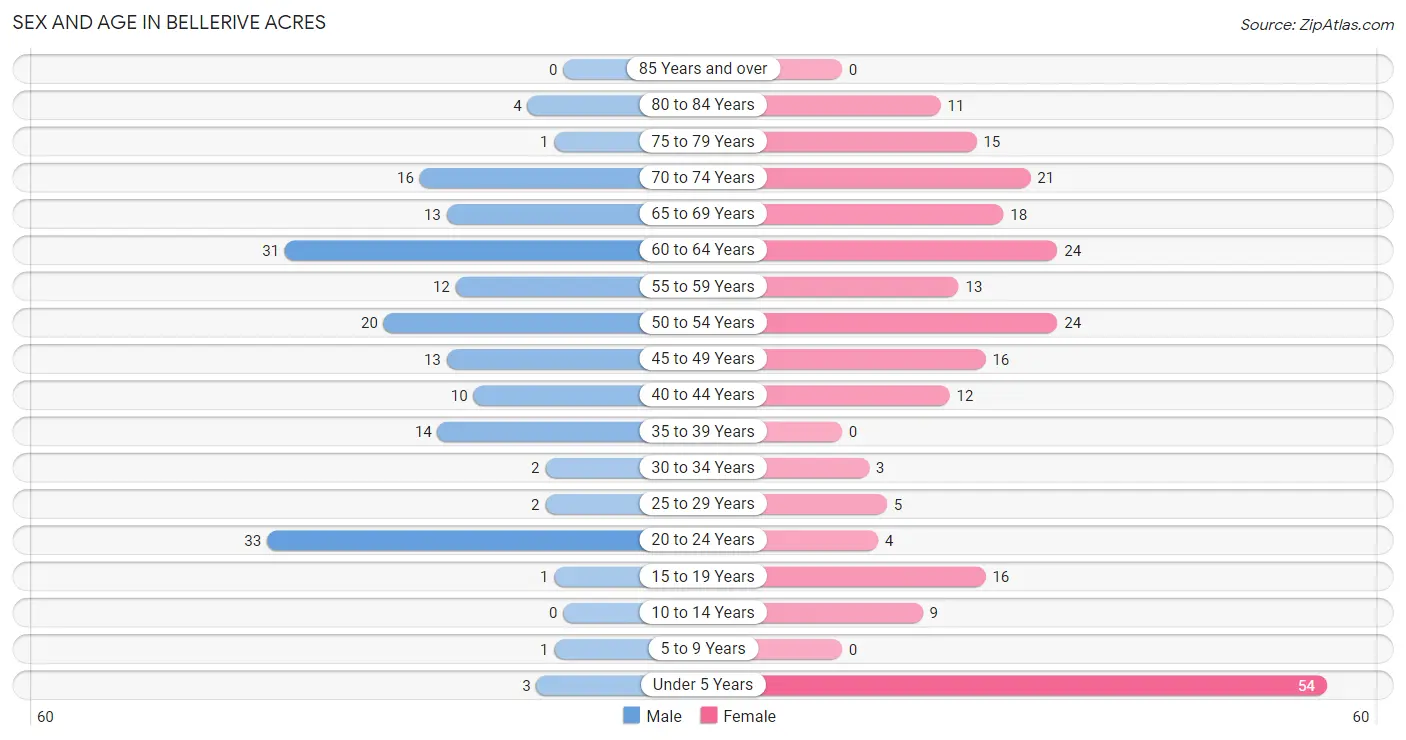
The most populous age groups in Bellerive Acres are 20 to 24 Years (33 | 18.8%) for men and Under 5 Years (54 | 22.0%) for women.
| Age Bracket | Male | Female |
| Under 5 Years | 3 (1.7%) | 54 (22.0%) |
| 5 to 9 Years | 1 (0.6%) | 0 (0.0%) |
| 10 to 14 Years | 0 (0.0%) | 9 (3.7%) |
| 15 to 19 Years | 1 (0.6%) | 16 (6.5%) |
| 20 to 24 Years | 33 (18.8%) | 4 (1.6%) |
| 25 to 29 Years | 2 (1.1%) | 5 (2.0%) |
| 30 to 34 Years | 2 (1.1%) | 3 (1.2%) |
| 35 to 39 Years | 14 (8.0%) | 0 (0.0%) |
| 40 to 44 Years | 10 (5.7%) | 12 (4.9%) |
| 45 to 49 Years | 13 (7.4%) | 16 (6.5%) |
| 50 to 54 Years | 20 (11.4%) | 24 (9.8%) |
| 55 to 59 Years | 12 (6.8%) | 13 (5.3%) |
| 60 to 64 Years | 31 (17.6%) | 24 (9.8%) |
| 65 to 69 Years | 13 (7.4%) | 18 (7.3%) |
| 70 to 74 Years | 16 (9.1%) | 21 (8.6%) |
| 75 to 79 Years | 1 (0.6%) | 15 (6.1%) |
| 80 to 84 Years | 4 (2.3%) | 11 (4.5%) |
| 85 Years and over | 0 (0.0%) | 0 (0.0%) |
| Total | 176 (100.0%) | 245 (100.0%) |
Families and Households in Bellerive Acres
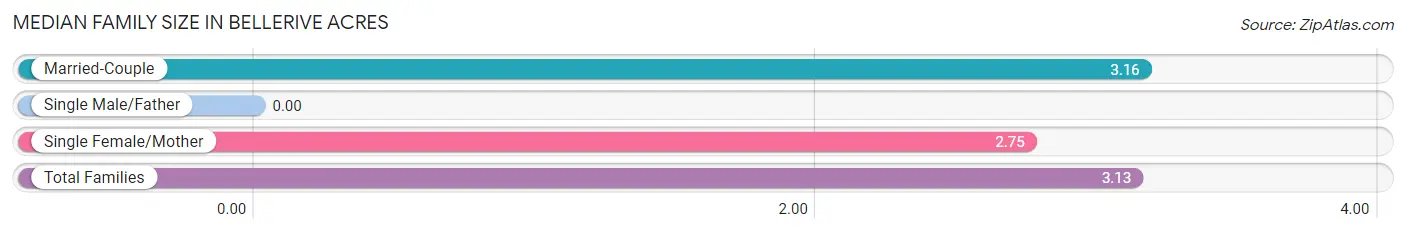
Median Family Size in Bellerive Acres
| Family Type | # Families | Family Size |
| Married-Couple | 115 (93.5%) | 3.16 |
| Single Male/Father | 0 (0.0%) | - |
| Single Female/Mother | 8 (6.5%) | 2.75 |
| Total Families | 123 (100.0%) | 3.13 |
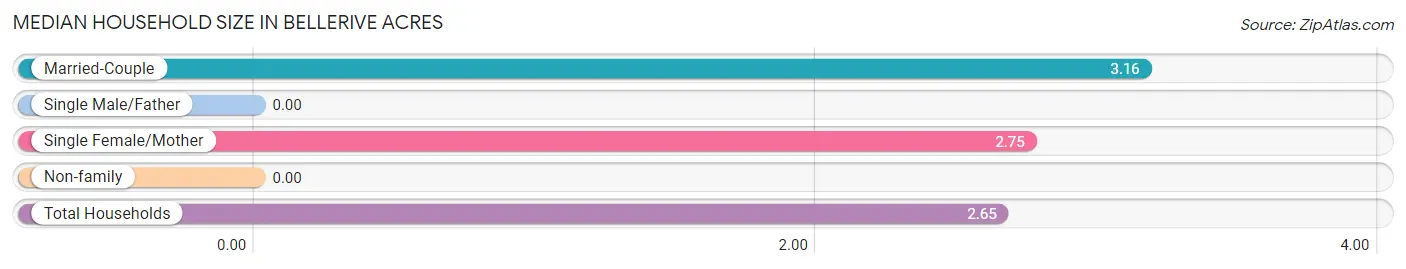
Median Household Size in Bellerive Acres
| Household Type | # Households | Household Size |
| Married-Couple | 115 (72.3%) | 3.16 |
| Single Male/Father | 0 (0.0%) | - |
| Single Female/Mother | 8 (5.0%) | 2.75 |
| Non-family | 36 (22.6%) | - |
| Total Households | 159 (100.0%) | 2.65 |
Household Size by Marriage Status in Bellerive Acres
Out of a total of 159 households in Bellerive Acres, 123 (77.4%) are family households, while 36 (22.6%) are nonfamily households. The most numerous type of family households are 2-person households, comprising 63, and the most common type of nonfamily households are 1-person households, comprising 36.
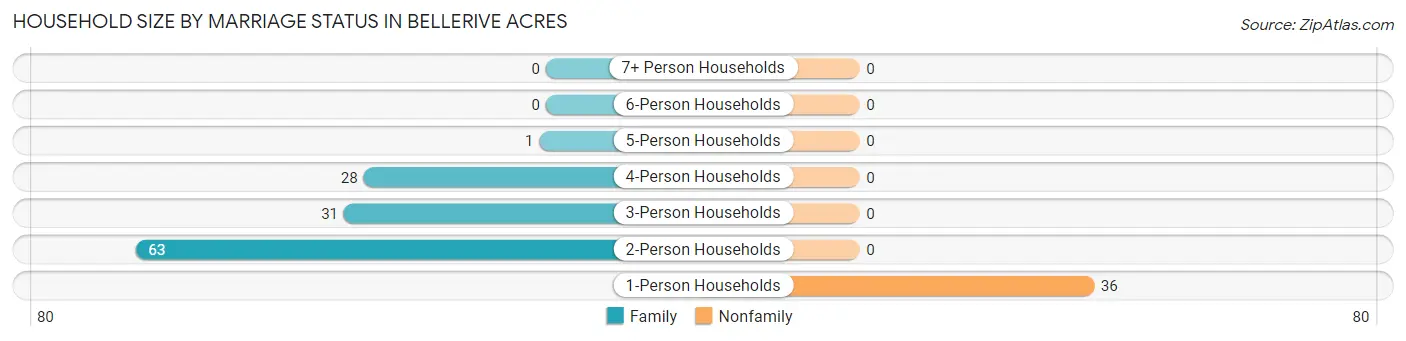
| Household Size | Family Households | Nonfamily Households |
| 1-Person Households | - | 36 (22.6%) |
| 2-Person Households | 63 (39.6%) | 0 (0.0%) |
| 3-Person Households | 31 (19.5%) | 0 (0.0%) |
| 4-Person Households | 28 (17.6%) | 0 (0.0%) |
| 5-Person Households | 1 (0.6%) | 0 (0.0%) |
| 6-Person Households | 0 (0.0%) | 0 (0.0%) |
| 7+ Person Households | 0 (0.0%) | 0 (0.0%) |
| Total | 123 (77.4%) | 36 (22.6%) |
Female Fertility in Bellerive Acres
Fertility by Age in Bellerive Acres
Average fertility rate in Bellerive Acres is 123.0 births per 1,000 women. Women in the age bracket of 35 to 50 years have the highest fertility rate with 241.0 births per 1,000 women. Women in the age bracket of 35 to 50 years acount for 100.0% of all women with births.
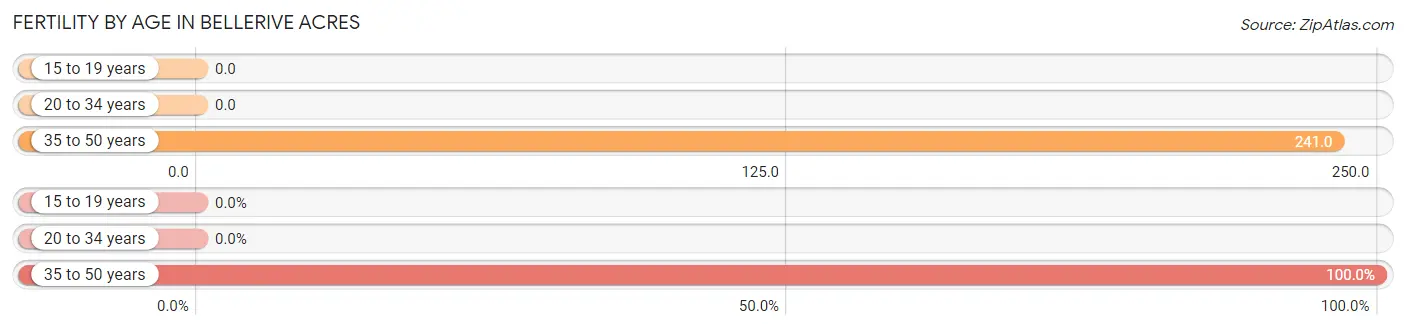
| Age Bracket | Women with Births | Births / 1,000 Women |
| 15 to 19 years | 0 (0.0%) | 0.0 |
| 20 to 34 years | 0 (0.0%) | 0.0 |
| 35 to 50 years | 7 (100.0%) | 241.0 |
| Total | 7 (100.0%) | 123.0 |
Fertility by Age by Marriage Status in Bellerive Acres
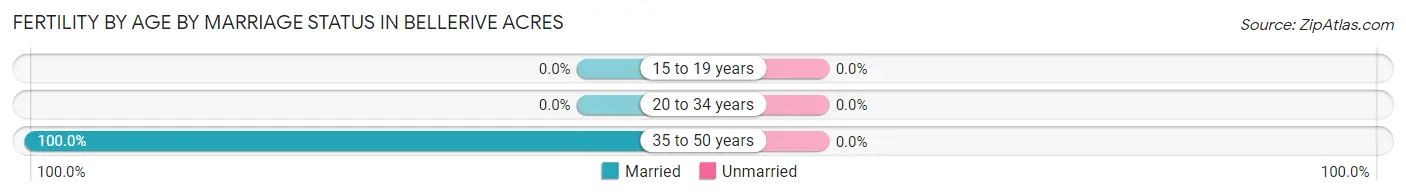
| Age Bracket | Married | Unmarried |
| 15 to 19 years | 0 (0.0%) | 0 (0.0%) |
| 20 to 34 years | 0 (0.0%) | 0 (0.0%) |
| 35 to 50 years | 7 (100.0%) | 0 (0.0%) |
| Total | 7 (100.0%) | 0 (0.0%) |
Fertility by Education in Bellerive Acres
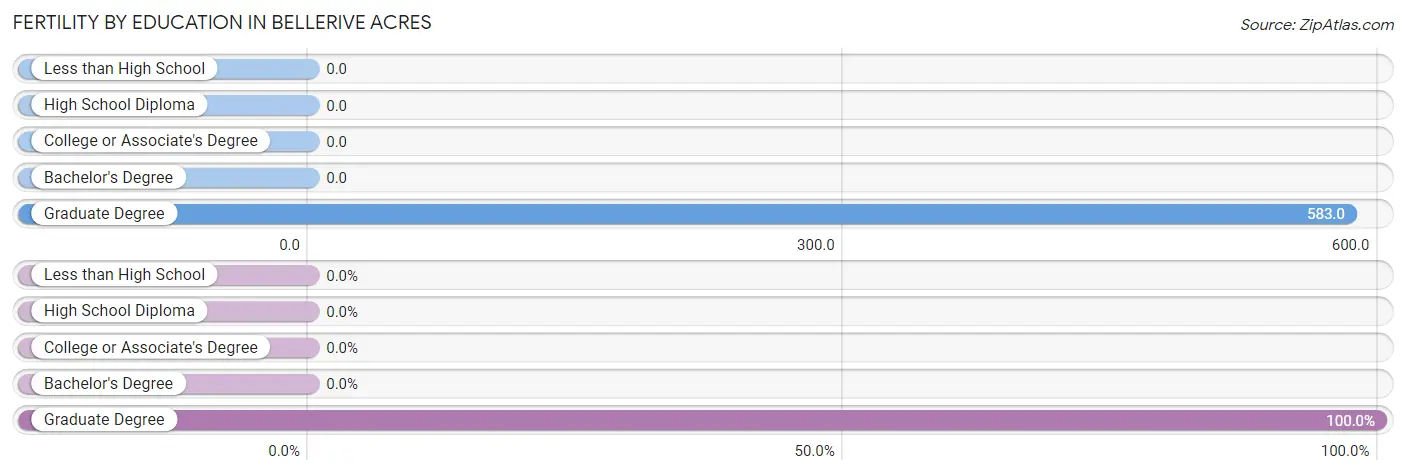
| Educational Attainment | Women with Births | Births / 1,000 Women |
| Less than High School | 0 (0.0%) | 0.0 |
| High School Diploma | 0 (0.0%) | 0.0 |
| College or Associate's Degree | 0 (0.0%) | 0.0 |
| Bachelor's Degree | 0 (0.0%) | 0.0 |
| Graduate Degree | 7 (100.0%) | 583.0 |
| Total | 7 (100.0%) | 123.0 |
Fertility by Education by Marriage Status in Bellerive Acres
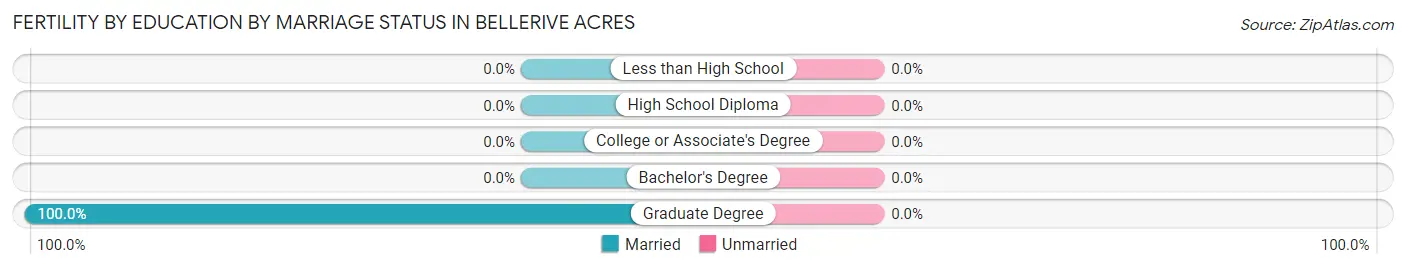
| Educational Attainment | Married | Unmarried |
| Less than High School | 0 (0.0%) | 0 (0.0%) |
| High School Diploma | 0 (0.0%) | 0 (0.0%) |
| College or Associate's Degree | 0 (0.0%) | 0 (0.0%) |
| Bachelor's Degree | 0 (0.0%) | 0 (0.0%) |
| Graduate Degree | 7 (100.0%) | 0 (0.0%) |
| Total | 7 (100.0%) | 0 (0.0%) |
Employment Characteristics in Bellerive Acres
Employment by Class of Employer in Bellerive Acres
Among the 204 employed individuals in Bellerive Acres, private company employees (136 | 66.7%), not-for-profit organizations (21 | 10.3%), and state government employees (18 | 8.8%) make up the most common classes of employment.
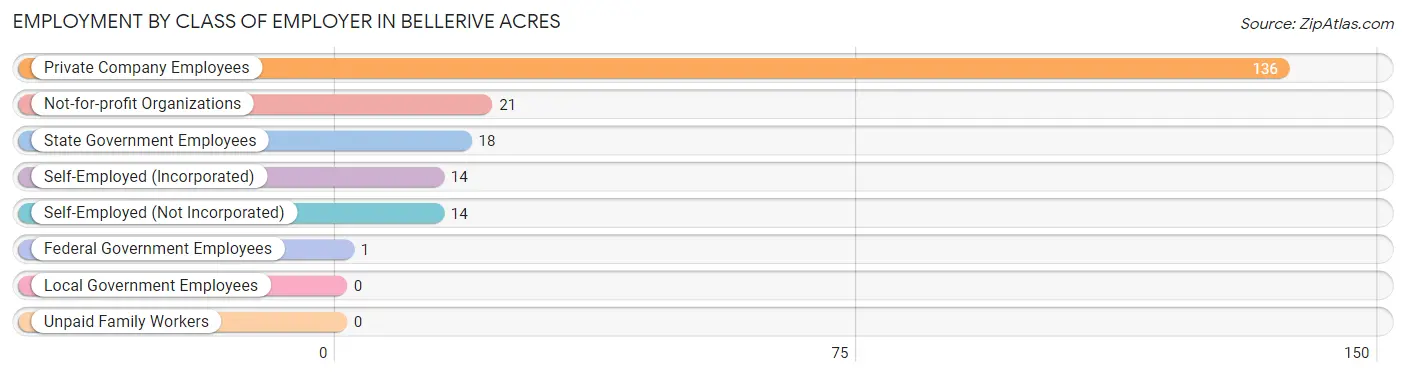
| Employer Class | # Employees | % Employees |
| Private Company Employees | 136 | 66.7% |
| Self-Employed (Incorporated) | 14 | 6.9% |
| Self-Employed (Not Incorporated) | 14 | 6.9% |
| Not-for-profit Organizations | 21 | 10.3% |
| Local Government Employees | 0 | 0.0% |
| State Government Employees | 18 | 8.8% |
| Federal Government Employees | 1 | 0.5% |
| Unpaid Family Workers | 0 | 0.0% |
| Total | 204 | 100.0% |
Employment Status by Age in Bellerive Acres
According to the labor force statistics for Bellerive Acres, out of the total population over 16 years of age (354), 62.1% or 220 individuals are in the labor force, with 5.5% or 12 of them unemployed. The age group with the highest labor force participation rate is 30 to 34 years, with 100.0% or 5 individuals in the labor force. Within the labor force, the 20 to 24 years age range has the highest percentage of unemployed individuals, with 48.0% or 12 of them being unemployed.
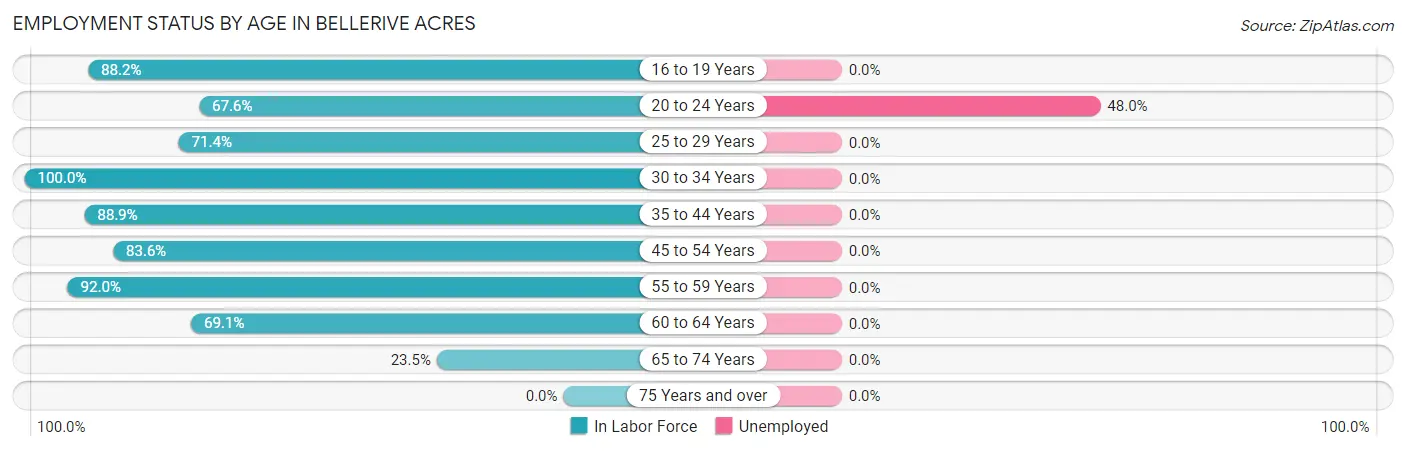
| Age Bracket | In Labor Force | Unemployed |
| 16 to 19 Years | 15 (88.2%) | 0 (0.0%) |
| 20 to 24 Years | 25 (67.6%) | 12 (48.0%) |
| 25 to 29 Years | 5 (71.4%) | 0 (0.0%) |
| 30 to 34 Years | 5 (100.0%) | 0 (0.0%) |
| 35 to 44 Years | 32 (88.9%) | 0 (0.0%) |
| 45 to 54 Years | 61 (83.6%) | 0 (0.0%) |
| 55 to 59 Years | 23 (92.0%) | 0 (0.0%) |
| 60 to 64 Years | 38 (69.1%) | 0 (0.0%) |
| 65 to 74 Years | 16 (23.5%) | 0 (0.0%) |
| 75 Years and over | 0 (0.0%) | 0 (0.0%) |
| Total | 220 (62.1%) | 12 (5.5%) |
Employment Status by Educational Attainment in Bellerive Acres
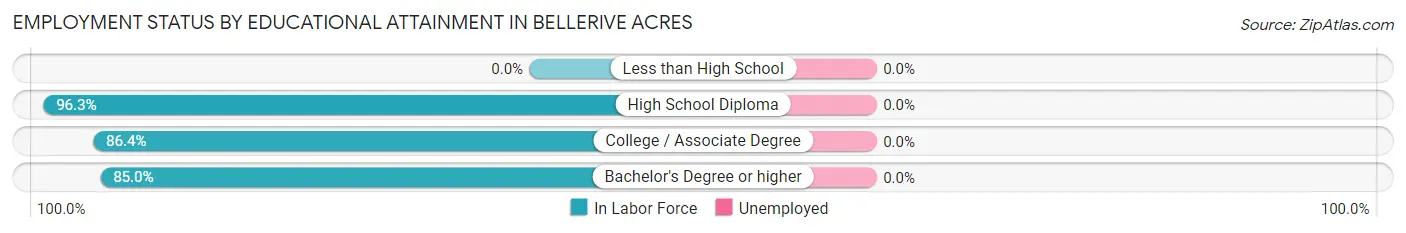
| Educational Attainment | In Labor Force | Unemployed |
| Less than High School | 0 (0.0%) | 0 (0.0%) |
| High School Diploma | 26 (96.3%) | 0 (0.0%) |
| College / Associate Degree | 19 (86.4%) | 0 (0.0%) |
| Bachelor's Degree or higher | 119 (85.0%) | 0 (0.0%) |
| Total | 164 (81.6%) | 0 (0.0%) |
Employment Occupations by Sex in Bellerive Acres
Management, Business, Science and Arts Occupations
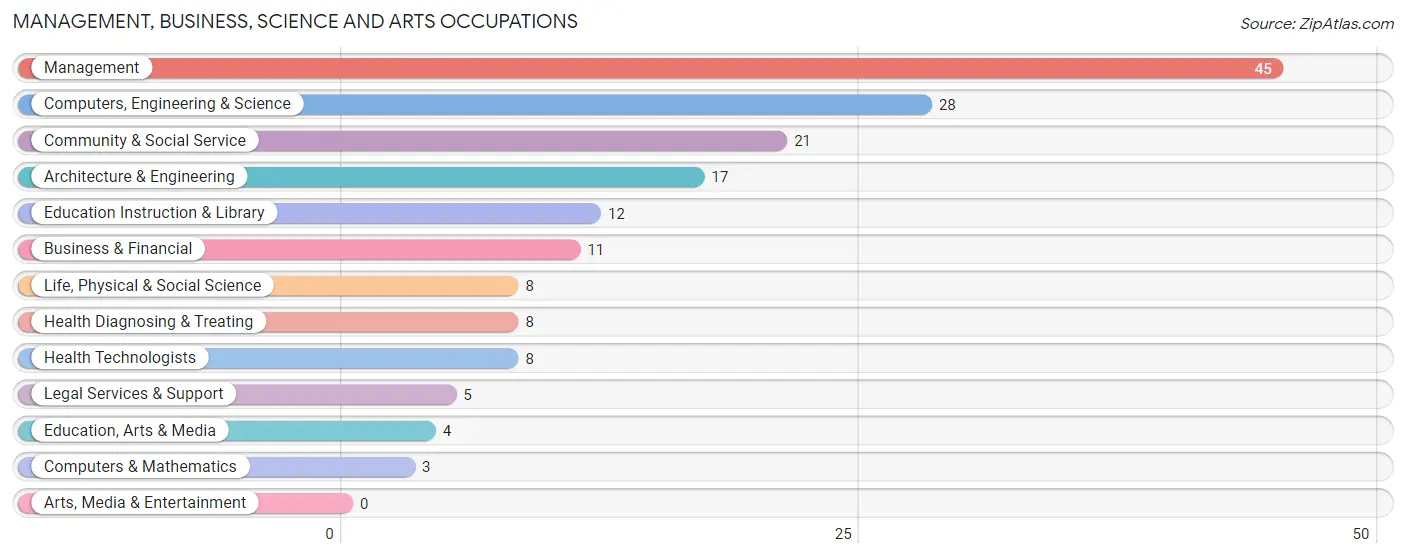
The most common Management, Business, Science and Arts occupations in Bellerive Acres are Management (45 | 21.6%), Computers, Engineering & Science (28 | 13.5%), Community & Social Service (21 | 10.1%), Architecture & Engineering (17 | 8.2%), and Education Instruction & Library (12 | 5.8%).
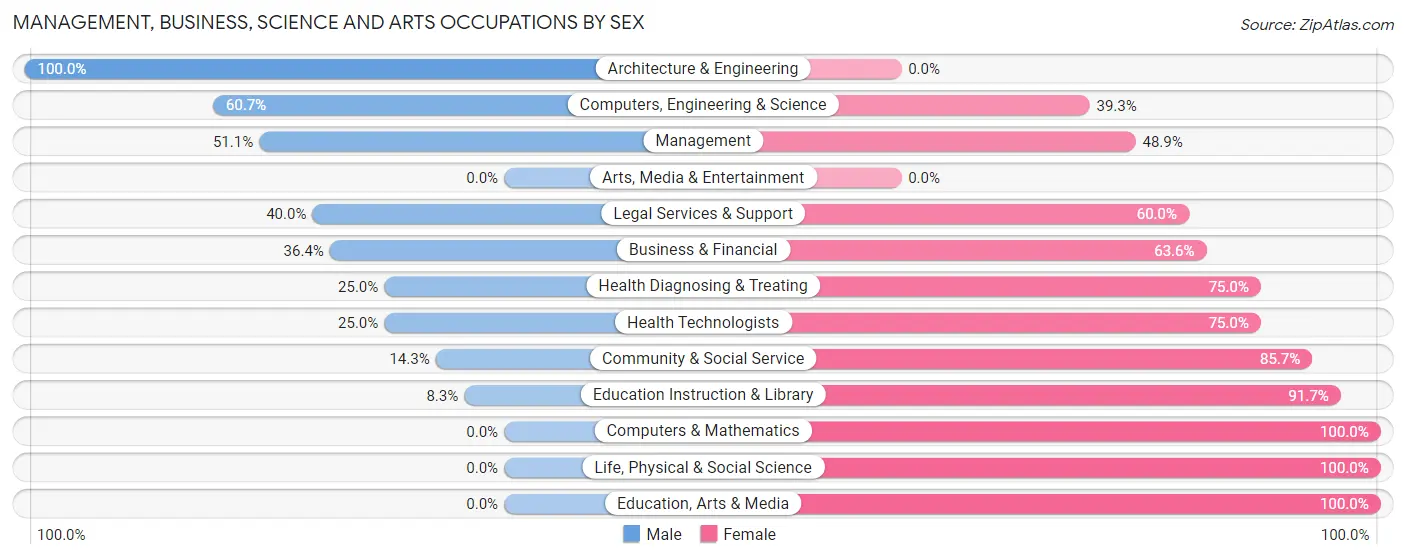
Management, Business, Science and Arts Occupations by Sex
Within the Management, Business, Science and Arts occupations in Bellerive Acres, the most male-oriented occupations are Architecture & Engineering (100.0%), Computers, Engineering & Science (60.7%), and Management (51.1%), while the most female-oriented occupations are Computers & Mathematics (100.0%), Life, Physical & Social Science (100.0%), and Education, Arts & Media (100.0%).
| Occupation | Male | Female |
| Management | 23 (51.1%) | 22 (48.9%) |
| Business & Financial | 4 (36.4%) | 7 (63.6%) |
| Computers, Engineering & Science | 17 (60.7%) | 11 (39.3%) |
| Computers & Mathematics | 0 (0.0%) | 3 (100.0%) |
| Architecture & Engineering | 17 (100.0%) | 0 (0.0%) |
| Life, Physical & Social Science | 0 (0.0%) | 8 (100.0%) |
| Community & Social Service | 3 (14.3%) | 18 (85.7%) |
| Education, Arts & Media | 0 (0.0%) | 4 (100.0%) |
| Legal Services & Support | 2 (40.0%) | 3 (60.0%) |
| Education Instruction & Library | 1 (8.3%) | 11 (91.7%) |
| Arts, Media & Entertainment | 0 (0.0%) | 0 (0.0%) |
| Health Diagnosing & Treating | 2 (25.0%) | 6 (75.0%) |
| Health Technologists | 2 (25.0%) | 6 (75.0%) |
| Total (Category) | 49 (43.4%) | 64 (56.6%) |
| Total (Overall) | 109 (52.4%) | 99 (47.6%) |
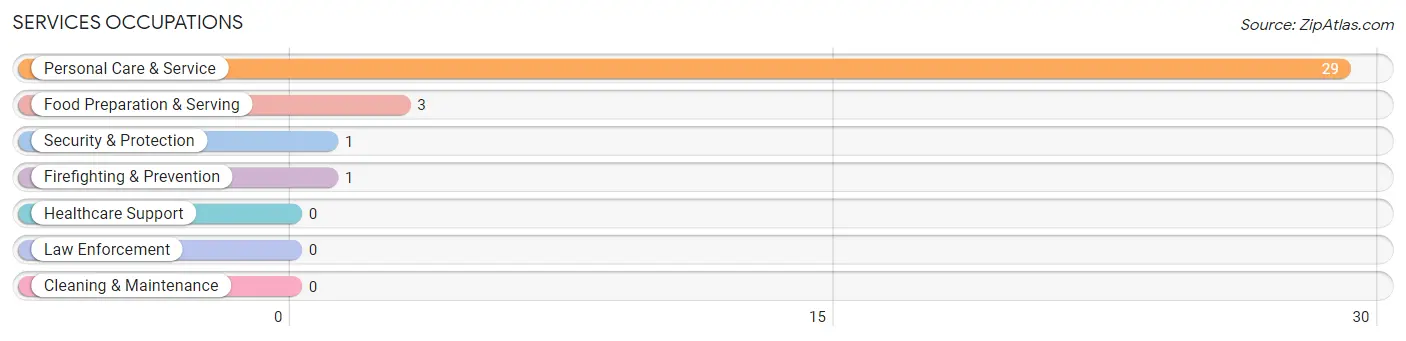
Services Occupations
The most common Services occupations in Bellerive Acres are Personal Care & Service (29 | 13.9%), Food Preparation & Serving (3 | 1.4%), Security & Protection (1 | 0.5%), and Firefighting & Prevention (1 | 0.5%).
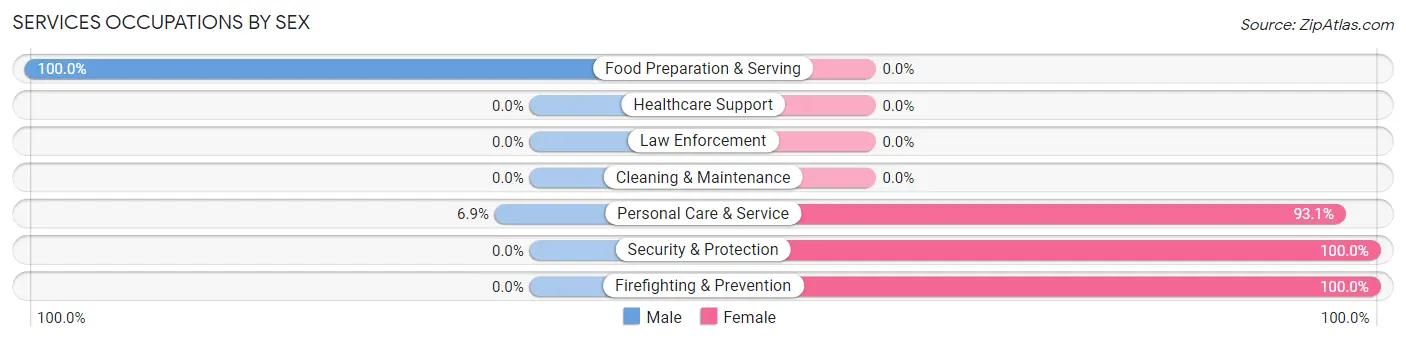
Services Occupations by Sex
Within the Services occupations in Bellerive Acres, the most male-oriented occupations are Food Preparation & Serving (100.0%), and Personal Care & Service (6.9%), while the most female-oriented occupations are Security & Protection (100.0%), Firefighting & Prevention (100.0%), and Personal Care & Service (93.1%).
| Occupation | Male | Female |
| Healthcare Support | 0 (0.0%) | 0 (0.0%) |
| Security & Protection | 0 (0.0%) | 1 (100.0%) |
| Firefighting & Prevention | 0 (0.0%) | 1 (100.0%) |
| Law Enforcement | 0 (0.0%) | 0 (0.0%) |
| Food Preparation & Serving | 3 (100.0%) | 0 (0.0%) |
| Cleaning & Maintenance | 0 (0.0%) | 0 (0.0%) |
| Personal Care & Service | 2 (6.9%) | 27 (93.1%) |
| Total (Category) | 5 (15.1%) | 28 (84.9%) |
| Total (Overall) | 109 (52.4%) | 99 (47.6%) |
Sales and Office Occupations
The most common Sales and Office occupations in Bellerive Acres are Sales & Related (16 | 7.7%), and Office & Administration (9 | 4.3%).
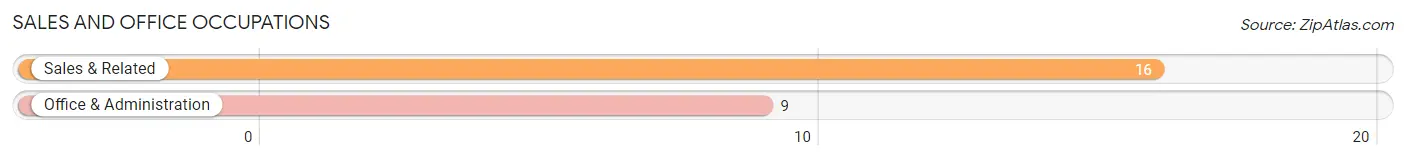
Sales and Office Occupations by Sex

| Occupation | Male | Female |
| Sales & Related | 16 (100.0%) | 0 (0.0%) |
| Office & Administration | 5 (55.6%) | 4 (44.4%) |
| Total (Category) | 21 (84.0%) | 4 (16.0%) |
| Total (Overall) | 109 (52.4%) | 99 (47.6%) |
Natural Resources, Construction and Maintenance Occupations
The most common Natural Resources, Construction and Maintenance occupations in Bellerive Acres are Installation, Maintenance & Repair (6 | 2.9%), and Construction & Extraction (4 | 1.9%).
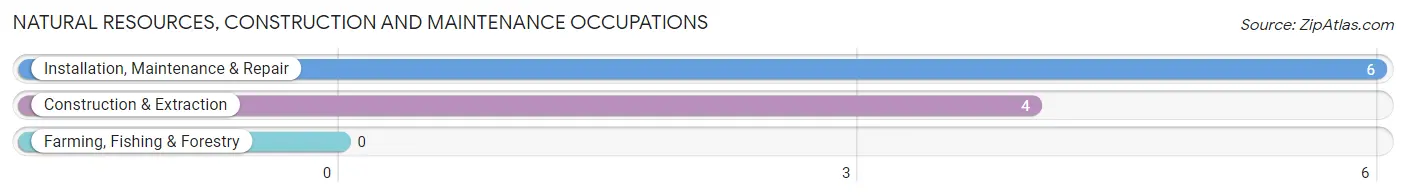
Natural Resources, Construction and Maintenance Occupations by Sex
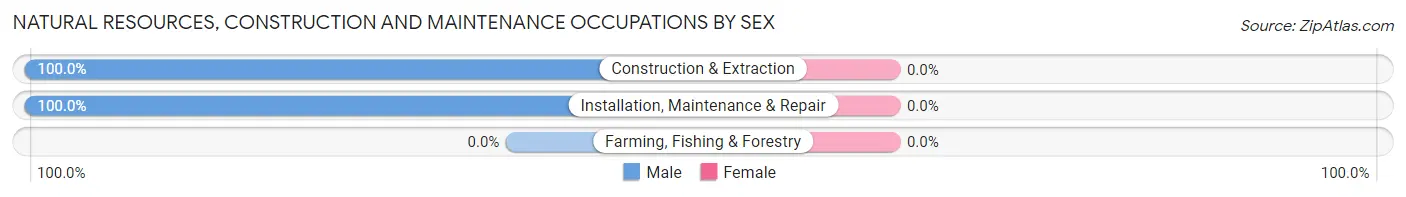
| Occupation | Male | Female |
| Farming, Fishing & Forestry | 0 (0.0%) | 0 (0.0%) |
| Construction & Extraction | 4 (100.0%) | 0 (0.0%) |
| Installation, Maintenance & Repair | 6 (100.0%) | 0 (0.0%) |
| Total (Category) | 10 (100.0%) | 0 (0.0%) |
| Total (Overall) | 109 (52.4%) | 99 (47.6%) |
Production, Transportation and Moving Occupations
The most common Production, Transportation and Moving occupations in Bellerive Acres are Transportation (15 | 7.2%), and Production (12 | 5.8%).
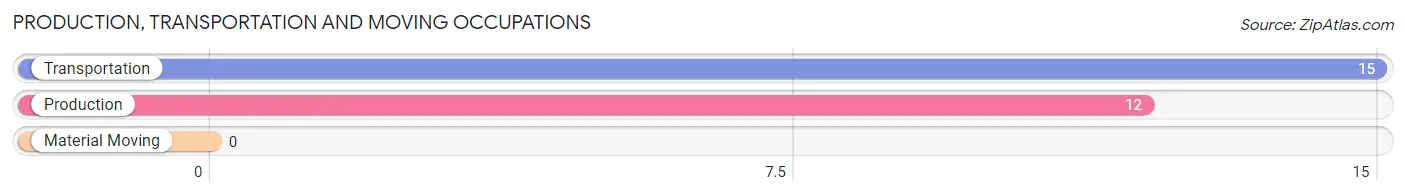
Production, Transportation and Moving Occupations by Sex
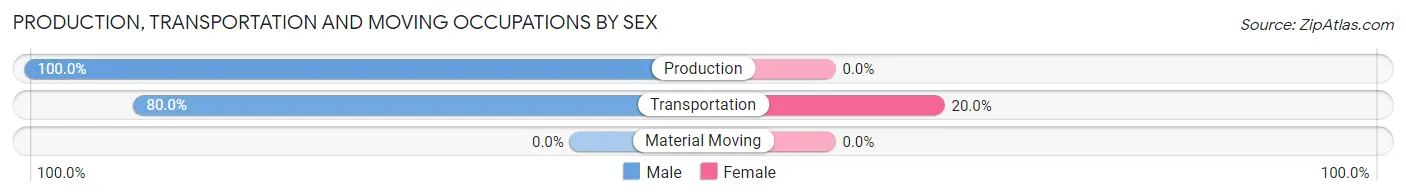
| Occupation | Male | Female |
| Production | 12 (100.0%) | 0 (0.0%) |
| Transportation | 12 (80.0%) | 3 (20.0%) |
| Material Moving | 0 (0.0%) | 0 (0.0%) |
| Total (Category) | 24 (88.9%) | 3 (11.1%) |
| Total (Overall) | 109 (52.4%) | 99 (47.6%) |
Employment Industries by Sex in Bellerive Acres
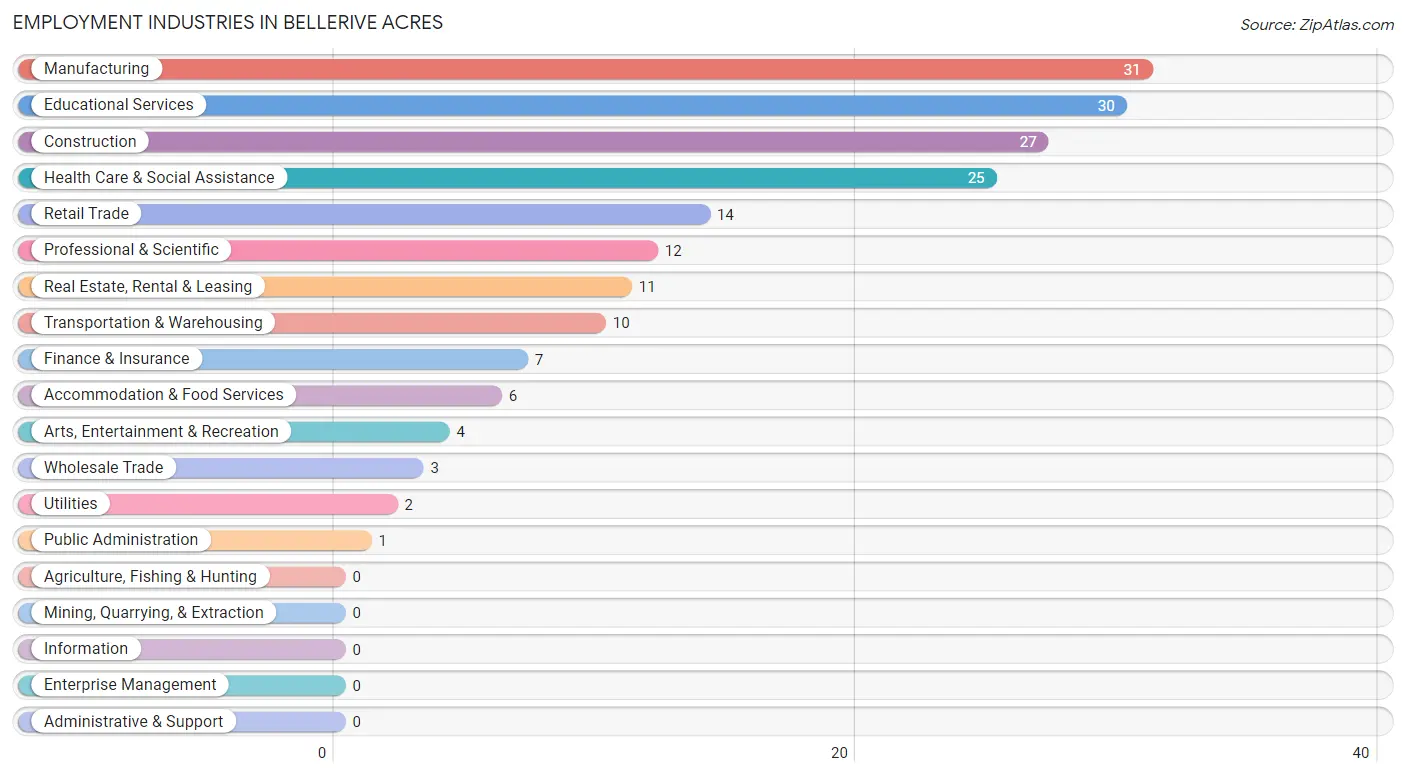
Employment Industries in Bellerive Acres
The major employment industries in Bellerive Acres include Manufacturing (31 | 14.9%), Educational Services (30 | 14.4%), Construction (27 | 13.0%), Health Care & Social Assistance (25 | 12.0%), and Retail Trade (14 | 6.7%).
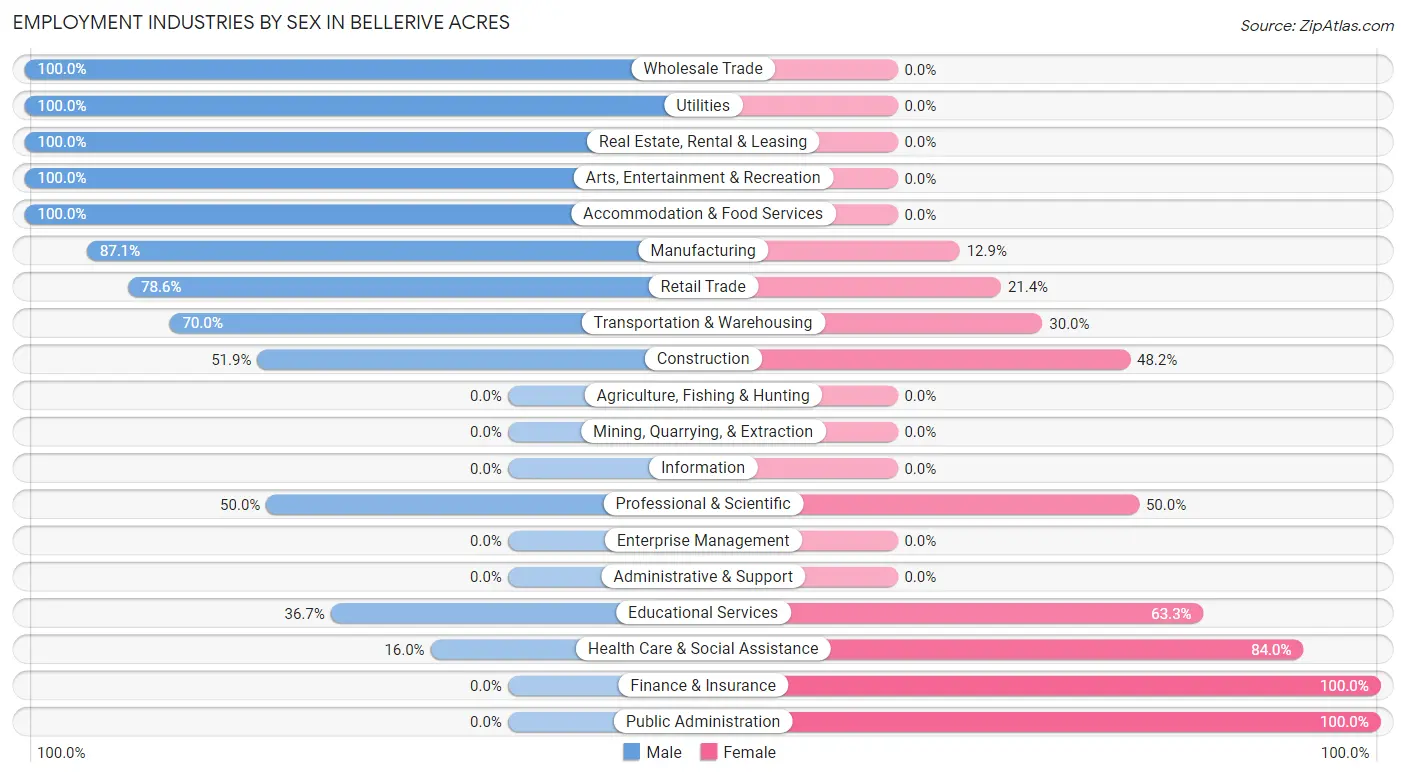
Employment Industries by Sex in Bellerive Acres
The Bellerive Acres industries that see more men than women are Wholesale Trade (100.0%), Utilities (100.0%), and Real Estate, Rental & Leasing (100.0%), whereas the industries that tend to have a higher number of women are Finance & Insurance (100.0%), Public Administration (100.0%), and Health Care & Social Assistance (84.0%).
| Industry | Male | Female |
| Agriculture, Fishing & Hunting | 0 (0.0%) | 0 (0.0%) |
| Mining, Quarrying, & Extraction | 0 (0.0%) | 0 (0.0%) |
| Construction | 14 (51.8%) | 13 (48.1%) |
| Manufacturing | 27 (87.1%) | 4 (12.9%) |
| Wholesale Trade | 3 (100.0%) | 0 (0.0%) |
| Retail Trade | 11 (78.6%) | 3 (21.4%) |
| Transportation & Warehousing | 7 (70.0%) | 3 (30.0%) |
| Utilities | 2 (100.0%) | 0 (0.0%) |
| Information | 0 (0.0%) | 0 (0.0%) |
| Finance & Insurance | 0 (0.0%) | 7 (100.0%) |
| Real Estate, Rental & Leasing | 11 (100.0%) | 0 (0.0%) |
| Professional & Scientific | 6 (50.0%) | 6 (50.0%) |
| Enterprise Management | 0 (0.0%) | 0 (0.0%) |
| Administrative & Support | 0 (0.0%) | 0 (0.0%) |
| Educational Services | 11 (36.7%) | 19 (63.3%) |
| Health Care & Social Assistance | 4 (16.0%) | 21 (84.0%) |
| Arts, Entertainment & Recreation | 4 (100.0%) | 0 (0.0%) |
| Accommodation & Food Services | 6 (100.0%) | 0 (0.0%) |
| Public Administration | 0 (0.0%) | 1 (100.0%) |
| Total | 109 (52.4%) | 99 (47.6%) |
Education in Bellerive Acres
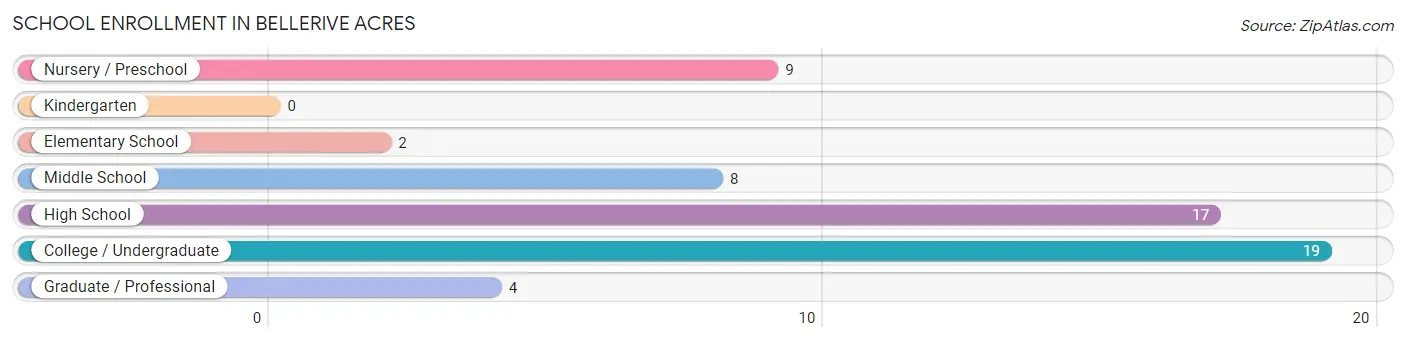
School Enrollment in Bellerive Acres
The most common levels of schooling among the 59 students in Bellerive Acres are college / undergraduate (19 | 32.2%), high school (17 | 28.8%), and nursery / preschool (9 | 15.2%).
| School Level | # Students | % Students |
| Nursery / Preschool | 9 | 15.2% |
| Kindergarten | 0 | 0.0% |
| Elementary School | 2 | 3.4% |
| Middle School | 8 | 13.6% |
| High School | 17 | 28.8% |
| College / Undergraduate | 19 | 32.2% |
| Graduate / Professional | 4 | 6.8% |
| Total | 59 | 100.0% |
School Enrollment by Age by Funding Source in Bellerive Acres
Out of a total of 59 students who are enrolled in schools in Bellerive Acres, 37 (62.7%) attend a private institution, while the remaining 22 (37.3%) are enrolled in public schools. The age group of 3 to 4 year olds has the highest likelihood of being enrolled in private schools, with 9 (100.0% in the age bracket) enrolled. Conversely, the age group of 15 to 17 year olds has the lowest likelihood of being enrolled in a private school, with 17 (100.0% in the age bracket) attending a public institution.
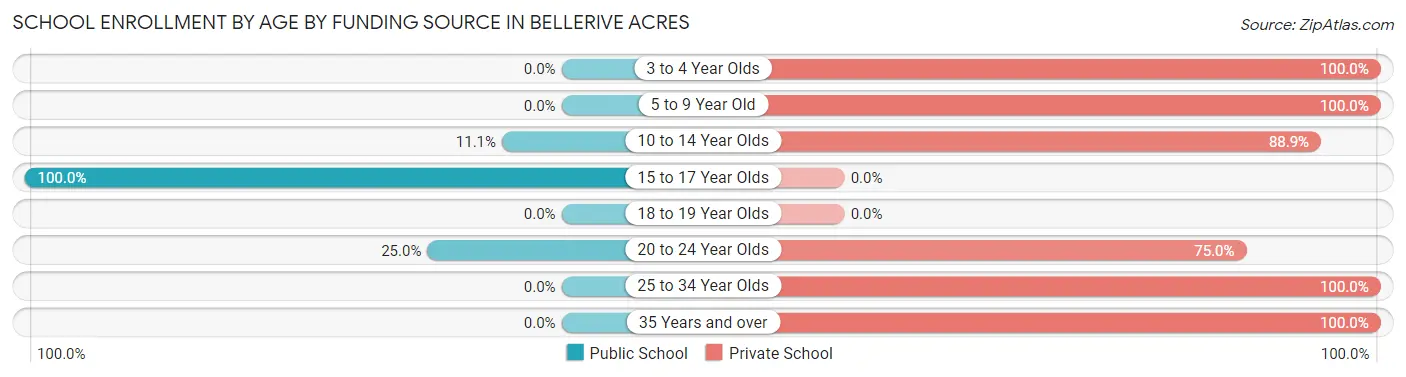
| Age Bracket | Public School | Private School |
| 3 to 4 Year Olds | 0 (0.0%) | 9 (100.0%) |
| 5 to 9 Year Old | 0 (0.0%) | 1 (100.0%) |
| 10 to 14 Year Olds | 1 (11.1%) | 8 (88.9%) |
| 15 to 17 Year Olds | 17 (100.0%) | 0 (0.0%) |
| 18 to 19 Year Olds | 0 (0.0%) | 0 (0.0%) |
| 20 to 24 Year Olds | 4 (25.0%) | 12 (75.0%) |
| 25 to 34 Year Olds | 0 (0.0%) | 4 (100.0%) |
| 35 Years and over | 0 (0.0%) | 3 (100.0%) |
| Total | 22 (37.3%) | 37 (62.7%) |
Educational Attainment by Field of Study in Bellerive Acres
Business (40 | 19.1%), engineering (28 | 13.3%), education (28 | 13.3%), psychology (21 | 10.0%), and communications (21 | 10.0%) are the most common fields of study among 210 individuals in Bellerive Acres who have obtained a bachelor's degree or higher.
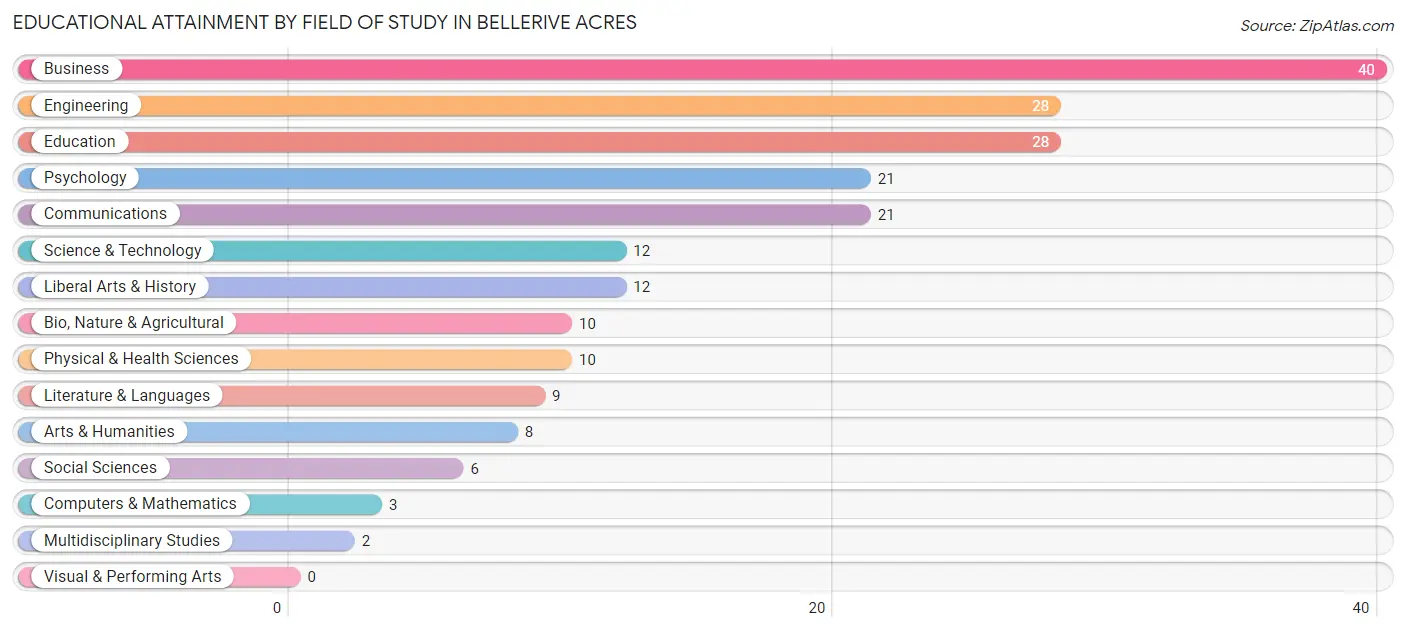
| Field of Study | # Graduates | % Graduates |
| Computers & Mathematics | 3 | 1.4% |
| Bio, Nature & Agricultural | 10 | 4.8% |
| Physical & Health Sciences | 10 | 4.8% |
| Psychology | 21 | 10.0% |
| Social Sciences | 6 | 2.9% |
| Engineering | 28 | 13.3% |
| Multidisciplinary Studies | 2 | 0.9% |
| Science & Technology | 12 | 5.7% |
| Business | 40 | 19.1% |
| Education | 28 | 13.3% |
| Literature & Languages | 9 | 4.3% |
| Liberal Arts & History | 12 | 5.7% |
| Visual & Performing Arts | 0 | 0.0% |
| Communications | 21 | 10.0% |
| Arts & Humanities | 8 | 3.8% |
| Total | 210 | 100.0% |
Transportation & Commute in Bellerive Acres
Vehicle Availability by Sex in Bellerive Acres
The most prevalent vehicle ownership categories in Bellerive Acres are males with 2 vehicles (38, accounting for 34.9%) and females with 2 vehicles (19, making up 40.0%).
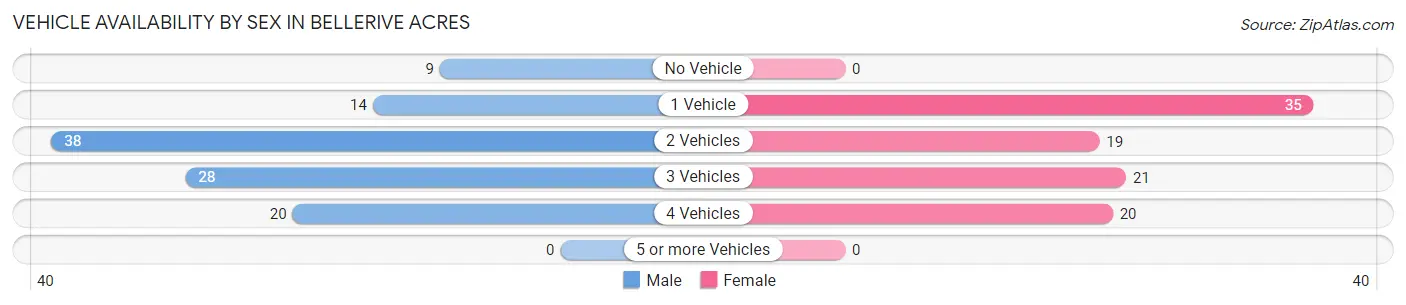
| Vehicles Available | Male | Female |
| No Vehicle | 9 (8.3%) | 0 (0.0%) |
| 1 Vehicle | 14 (12.8%) | 35 (36.8%) |
| 2 Vehicles | 38 (34.9%) | 19 (20.0%) |
| 3 Vehicles | 28 (25.7%) | 21 (22.1%) |
| 4 Vehicles | 20 (18.3%) | 20 (21.0%) |
| 5 or more Vehicles | 0 (0.0%) | 0 (0.0%) |
| Total | 109 (100.0%) | 95 (100.0%) |
Commute Time in Bellerive Acres
The most frequently occuring commute durations in Bellerive Acres are 15 to 19 minutes (34 commuters, 18.8%), 20 to 24 minutes (32 commuters, 17.7%), and 30 to 34 minutes (29 commuters, 16.0%).
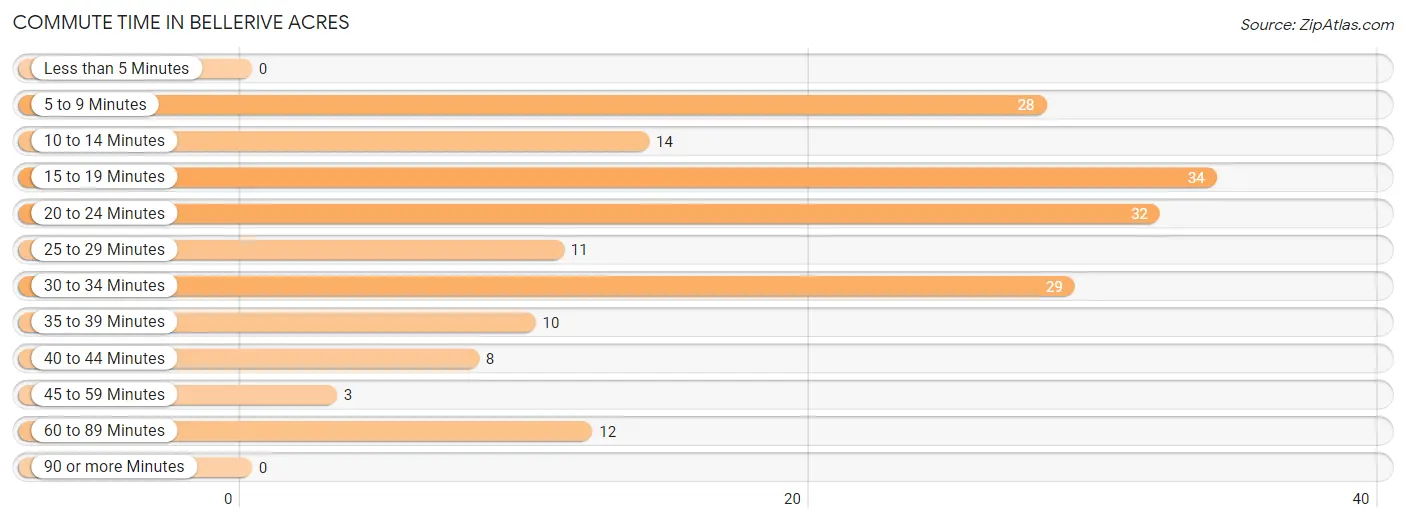
| Commute Time | # Commuters | % Commuters |
| Less than 5 Minutes | 0 | 0.0% |
| 5 to 9 Minutes | 28 | 15.5% |
| 10 to 14 Minutes | 14 | 7.7% |
| 15 to 19 Minutes | 34 | 18.8% |
| 20 to 24 Minutes | 32 | 17.7% |
| 25 to 29 Minutes | 11 | 6.1% |
| 30 to 34 Minutes | 29 | 16.0% |
| 35 to 39 Minutes | 10 | 5.5% |
| 40 to 44 Minutes | 8 | 4.4% |
| 45 to 59 Minutes | 3 | 1.7% |
| 60 to 89 Minutes | 12 | 6.6% |
| 90 or more Minutes | 0 | 0.0% |
Commute Time by Sex in Bellerive Acres
The most common commute times in Bellerive Acres are 30 to 34 minutes (16 commuters, 15.7%) for males and 15 to 19 minutes (22 commuters, 27.9%) for females.
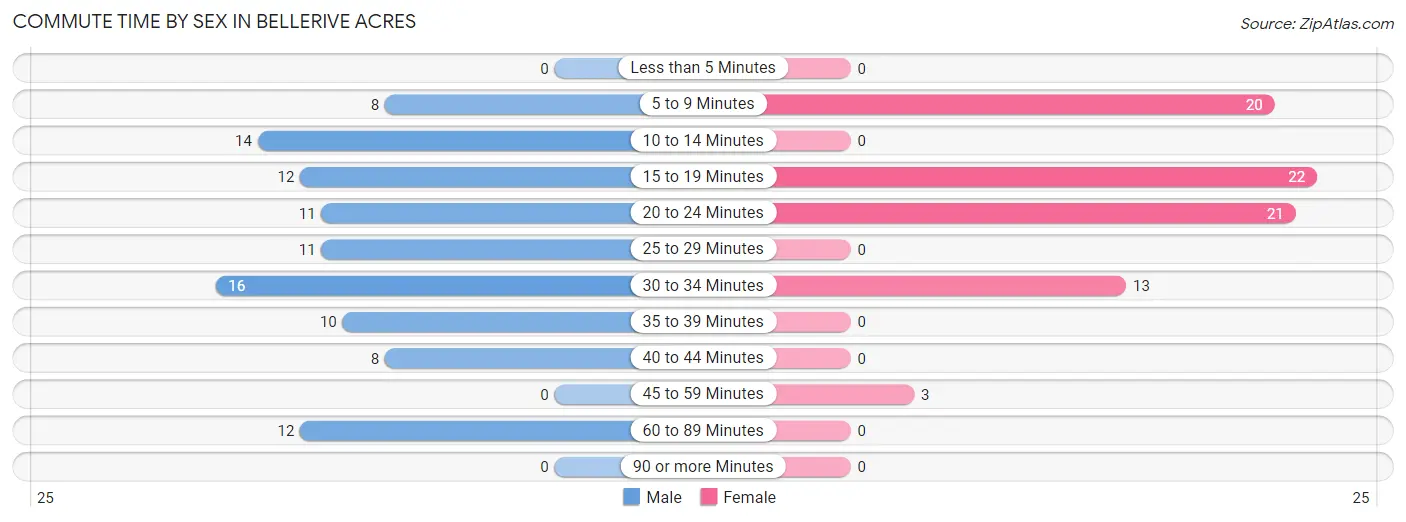
| Commute Time | Male | Female |
| Less than 5 Minutes | 0 (0.0%) | 0 (0.0%) |
| 5 to 9 Minutes | 8 (7.8%) | 20 (25.3%) |
| 10 to 14 Minutes | 14 (13.7%) | 0 (0.0%) |
| 15 to 19 Minutes | 12 (11.8%) | 22 (27.9%) |
| 20 to 24 Minutes | 11 (10.8%) | 21 (26.6%) |
| 25 to 29 Minutes | 11 (10.8%) | 0 (0.0%) |
| 30 to 34 Minutes | 16 (15.7%) | 13 (16.5%) |
| 35 to 39 Minutes | 10 (9.8%) | 0 (0.0%) |
| 40 to 44 Minutes | 8 (7.8%) | 0 (0.0%) |
| 45 to 59 Minutes | 0 (0.0%) | 3 (3.8%) |
| 60 to 89 Minutes | 12 (11.8%) | 0 (0.0%) |
| 90 or more Minutes | 0 (0.0%) | 0 (0.0%) |
Time of Departure to Work by Sex in Bellerive Acres
The most frequent times of departure to work in Bellerive Acres are 8:00 AM to 8:29 AM (17, 16.7%) for males and 7:00 AM to 7:29 AM (18, 22.8%) for females.
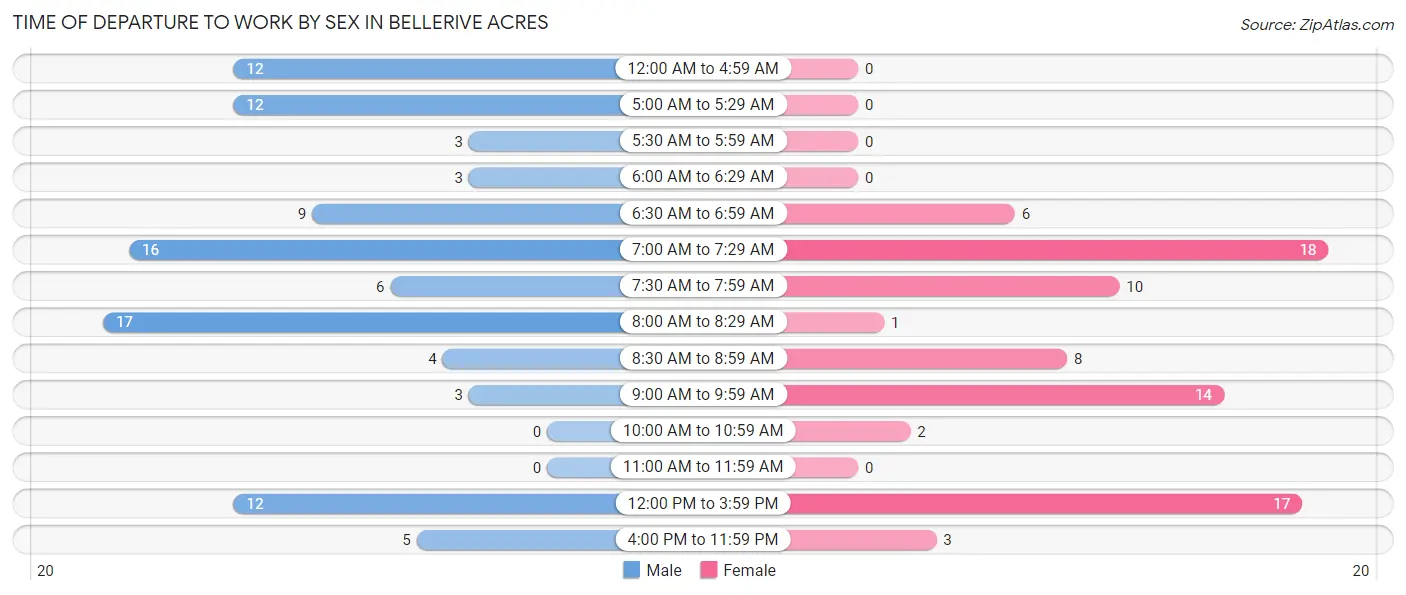
| Time of Departure | Male | Female |
| 12:00 AM to 4:59 AM | 12 (11.8%) | 0 (0.0%) |
| 5:00 AM to 5:29 AM | 12 (11.8%) | 0 (0.0%) |
| 5:30 AM to 5:59 AM | 3 (2.9%) | 0 (0.0%) |
| 6:00 AM to 6:29 AM | 3 (2.9%) | 0 (0.0%) |
| 6:30 AM to 6:59 AM | 9 (8.8%) | 6 (7.6%) |
| 7:00 AM to 7:29 AM | 16 (15.7%) | 18 (22.8%) |
| 7:30 AM to 7:59 AM | 6 (5.9%) | 10 (12.7%) |
| 8:00 AM to 8:29 AM | 17 (16.7%) | 1 (1.3%) |
| 8:30 AM to 8:59 AM | 4 (3.9%) | 8 (10.1%) |
| 9:00 AM to 9:59 AM | 3 (2.9%) | 14 (17.7%) |
| 10:00 AM to 10:59 AM | 0 (0.0%) | 2 (2.5%) |
| 11:00 AM to 11:59 AM | 0 (0.0%) | 0 (0.0%) |
| 12:00 PM to 3:59 PM | 12 (11.8%) | 17 (21.5%) |
| 4:00 PM to 11:59 PM | 5 (4.9%) | 3 (3.8%) |
| Total | 102 (100.0%) | 79 (100.0%) |
Housing Occupancy in Bellerive Acres
Occupancy by Ownership in Bellerive Acres
Of the total 159 dwellings in Bellerive Acres, owner-occupied units account for 158 (99.4%), while renter-occupied units make up 1 (0.6%).
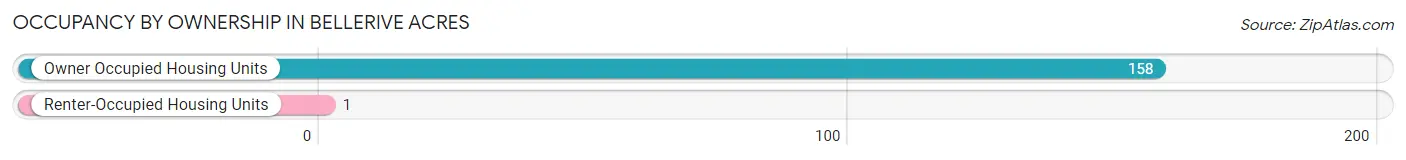
| Occupancy | # Housing Units | % Housing Units |
| Owner Occupied Housing Units | 158 | 99.4% |
| Renter-Occupied Housing Units | 1 | 0.6% |
| Total Occupied Housing Units | 159 | 100.0% |
Occupancy by Household Size in Bellerive Acres
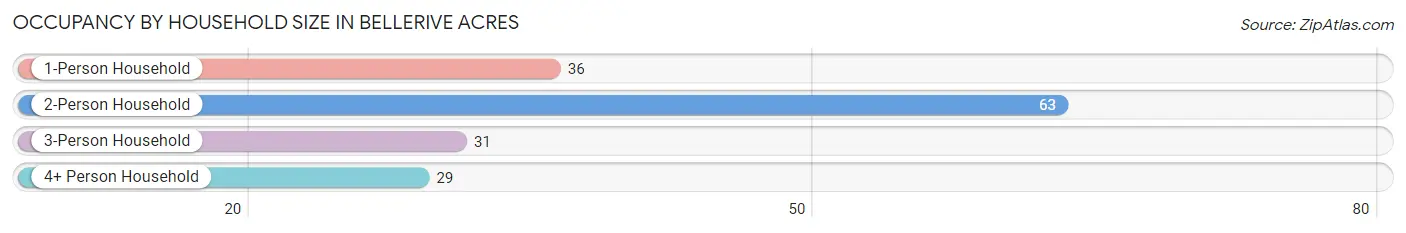
| Household Size | # Housing Units | % Housing Units |
| 1-Person Household | 36 | 22.6% |
| 2-Person Household | 63 | 39.6% |
| 3-Person Household | 31 | 19.5% |
| 4+ Person Household | 29 | 18.2% |
| Total Housing Units | 159 | 100.0% |
Occupancy by Ownership by Household Size in Bellerive Acres
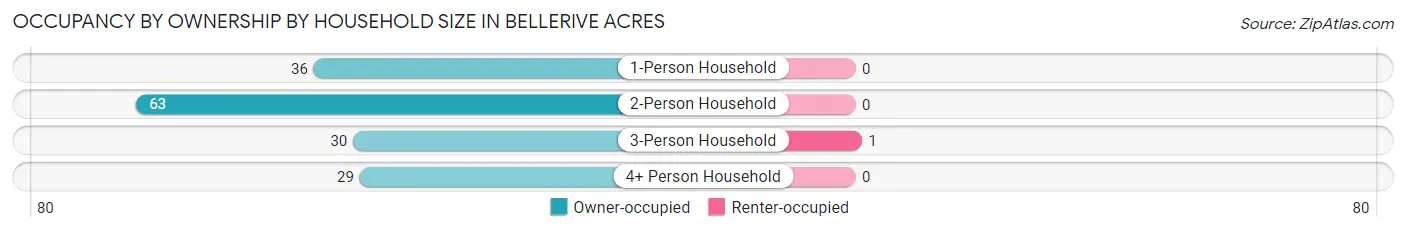
| Household Size | Owner-occupied | Renter-occupied |
| 1-Person Household | 36 (100.0%) | 0 (0.0%) |
| 2-Person Household | 63 (100.0%) | 0 (0.0%) |
| 3-Person Household | 30 (96.8%) | 1 (3.2%) |
| 4+ Person Household | 29 (100.0%) | 0 (0.0%) |
| Total Housing Units | 158 (99.4%) | 1 (0.6%) |
Occupancy by Educational Attainment in Bellerive Acres
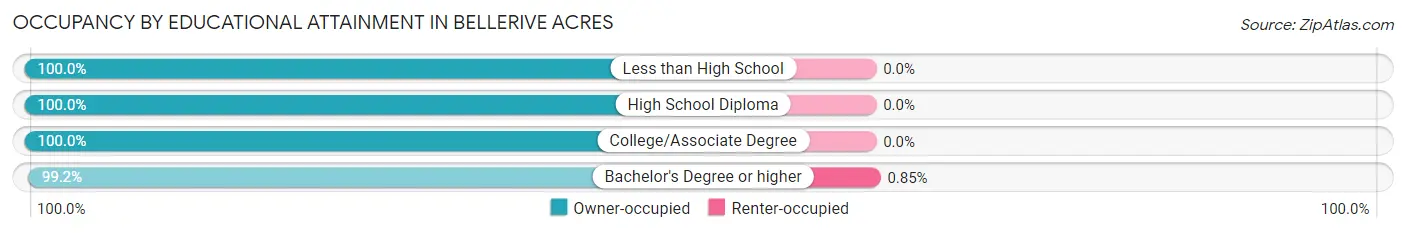
| Household Size | Owner-occupied | Renter-occupied |
| Less than High School | 3 (100.0%) | 0 (0.0%) |
| High School Diploma | 18 (100.0%) | 0 (0.0%) |
| College/Associate Degree | 21 (100.0%) | 0 (0.0%) |
| Bachelor's Degree or higher | 116 (99.2%) | 1 (0.9%) |
Occupancy by Age of Householder in Bellerive Acres
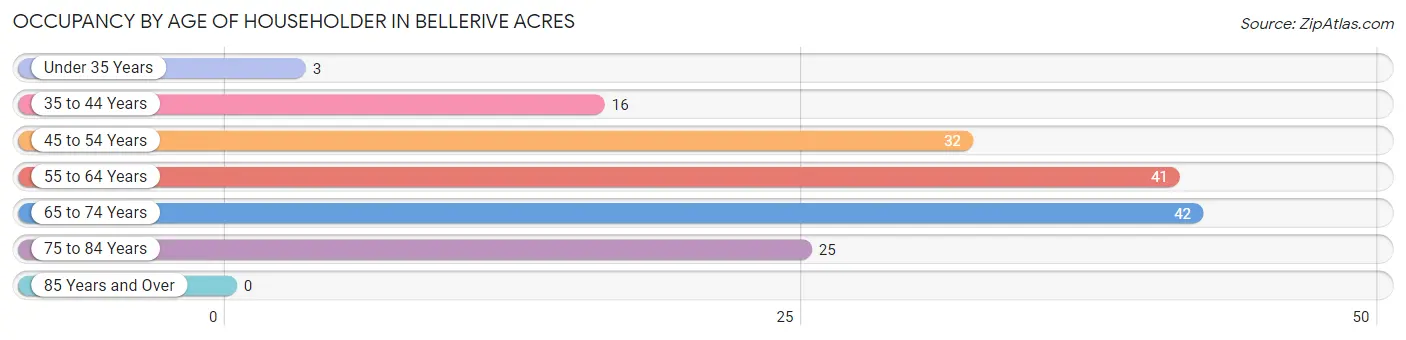
| Age Bracket | # Households | % Households |
| Under 35 Years | 3 | 1.9% |
| 35 to 44 Years | 16 | 10.1% |
| 45 to 54 Years | 32 | 20.1% |
| 55 to 64 Years | 41 | 25.8% |
| 65 to 74 Years | 42 | 26.4% |
| 75 to 84 Years | 25 | 15.7% |
| 85 Years and Over | 0 | 0.0% |
| Total | 159 | 100.0% |
Housing Finances in Bellerive Acres
Median Income by Occupancy in Bellerive Acres
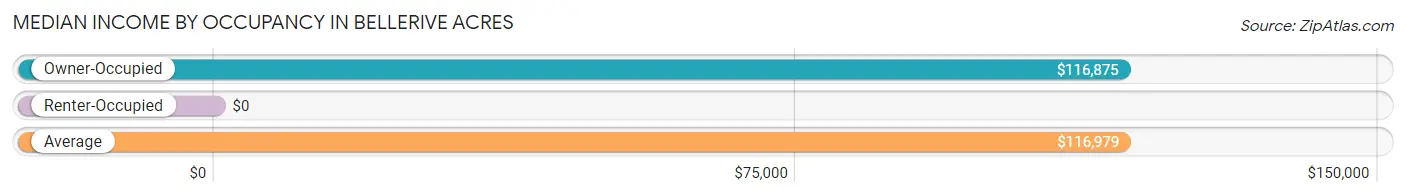
| Occupancy Type | # Households | Median Income |
| Owner-Occupied | 158 (99.4%) | $116,875 |
| Renter-Occupied | 1 (0.6%) | $0 |
| Average | 159 (100.0%) | $116,979 |
Occupancy by Householder Income Bracket in Bellerive Acres
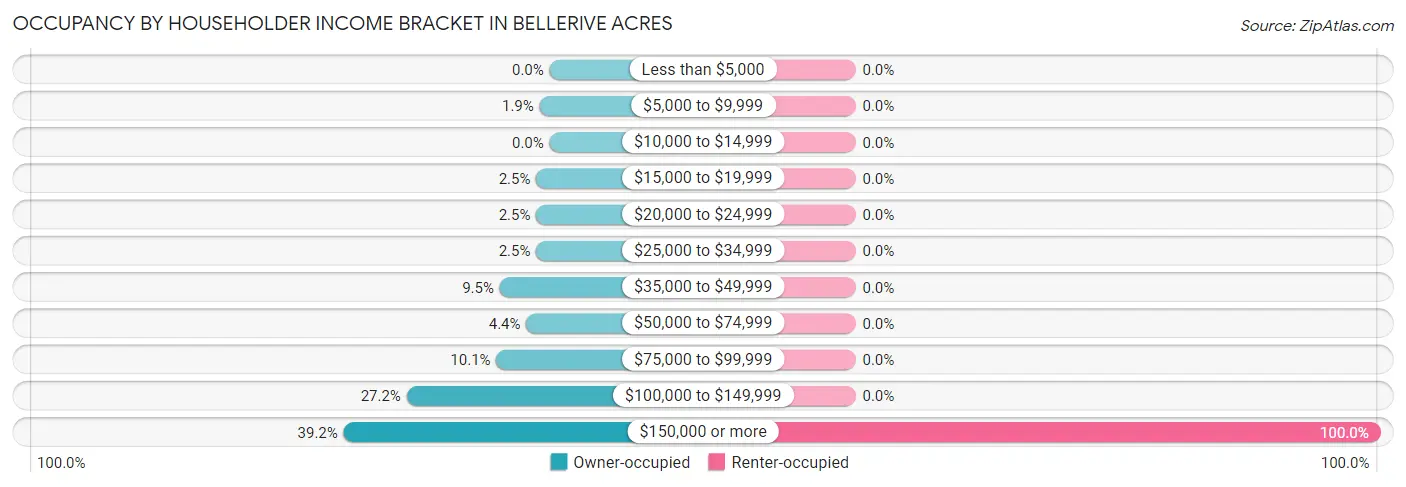
| Income Bracket | Owner-occupied | Renter-occupied |
| Less than $5,000 | 0 (0.0%) | 0 (0.0%) |
| $5,000 to $9,999 | 3 (1.9%) | 0 (0.0%) |
| $10,000 to $14,999 | 0 (0.0%) | 0 (0.0%) |
| $15,000 to $19,999 | 4 (2.5%) | 0 (0.0%) |
| $20,000 to $24,999 | 4 (2.5%) | 0 (0.0%) |
| $25,000 to $34,999 | 4 (2.5%) | 0 (0.0%) |
| $35,000 to $49,999 | 15 (9.5%) | 0 (0.0%) |
| $50,000 to $74,999 | 7 (4.4%) | 0 (0.0%) |
| $75,000 to $99,999 | 16 (10.1%) | 0 (0.0%) |
| $100,000 to $149,999 | 43 (27.2%) | 0 (0.0%) |
| $150,000 or more | 62 (39.2%) | 1 (100.0%) |
| Total | 158 (100.0%) | 1 (100.0%) |
Monthly Housing Cost Tiers in Bellerive Acres
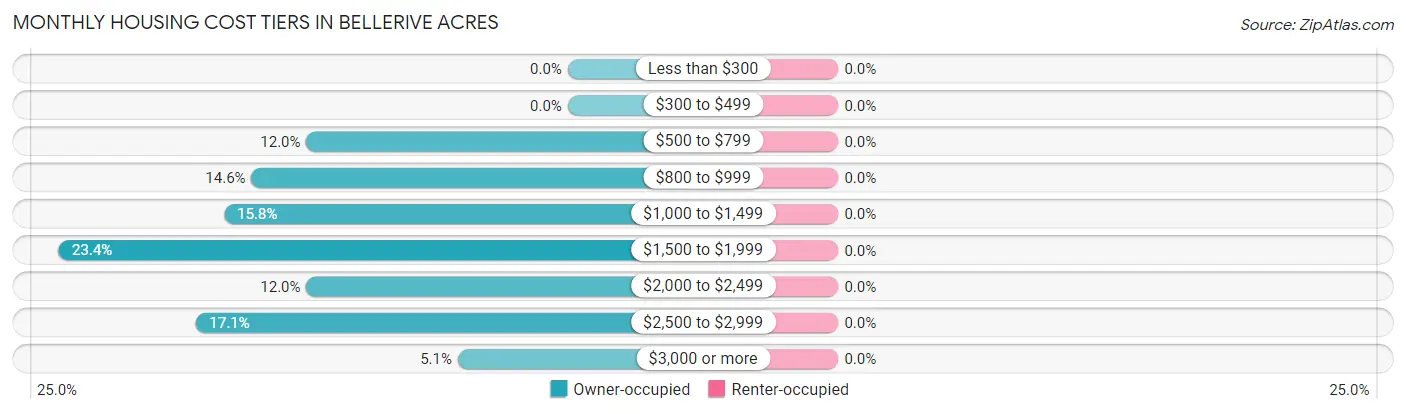
| Monthly Cost | Owner-occupied | Renter-occupied |
| Less than $300 | 0 (0.0%) | 0 (0.0%) |
| $300 to $499 | 0 (0.0%) | 0 (0.0%) |
| $500 to $799 | 19 (12.0%) | 0 (0.0%) |
| $800 to $999 | 23 (14.6%) | 0 (0.0%) |
| $1,000 to $1,499 | 25 (15.8%) | 0 (0.0%) |
| $1,500 to $1,999 | 37 (23.4%) | 0 (0.0%) |
| $2,000 to $2,499 | 19 (12.0%) | 0 (0.0%) |
| $2,500 to $2,999 | 27 (17.1%) | 0 (0.0%) |
| $3,000 or more | 8 (5.1%) | 0 (0.0%) |
| Total | 158 (100.0%) | 1 (100.0%) |
Physical Housing Characteristics in Bellerive Acres
Housing Structures in Bellerive Acres
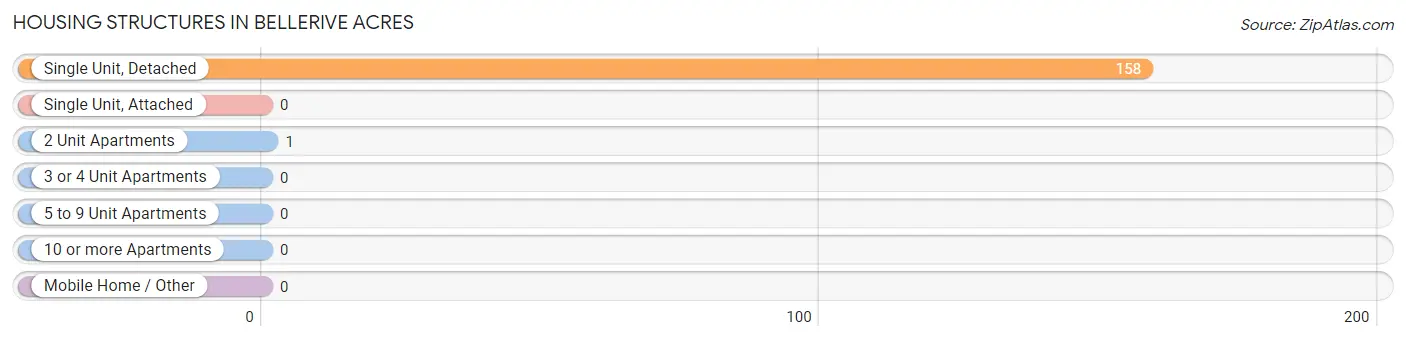
| Structure Type | # Housing Units | % Housing Units |
| Single Unit, Detached | 158 | 99.4% |
| Single Unit, Attached | 0 | 0.0% |
| 2 Unit Apartments | 1 | 0.6% |
| 3 or 4 Unit Apartments | 0 | 0.0% |
| 5 to 9 Unit Apartments | 0 | 0.0% |
| 10 or more Apartments | 0 | 0.0% |
| Mobile Home / Other | 0 | 0.0% |
| Total | 159 | 100.0% |
Housing Structures by Occupancy in Bellerive Acres
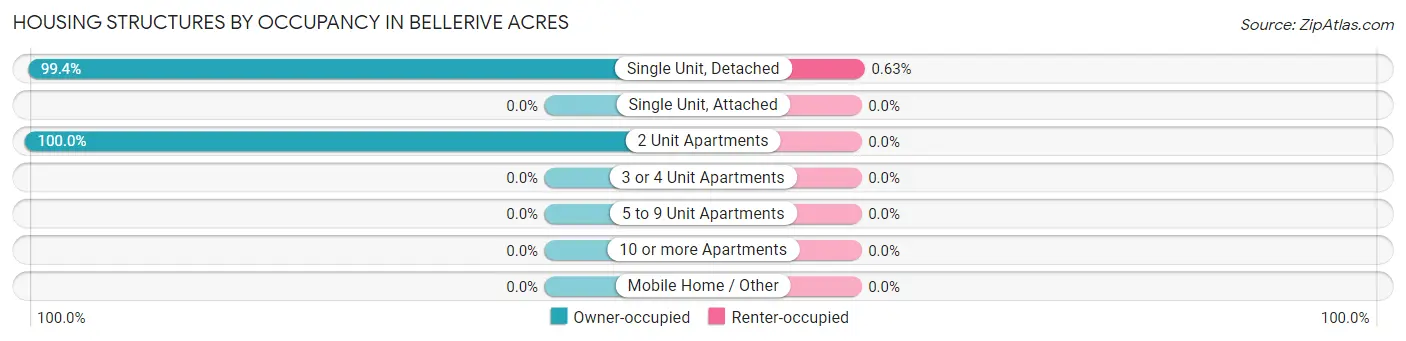
| Structure Type | Owner-occupied | Renter-occupied |
| Single Unit, Detached | 157 (99.4%) | 1 (0.6%) |
| Single Unit, Attached | 0 (0.0%) | 0 (0.0%) |
| 2 Unit Apartments | 1 (100.0%) | 0 (0.0%) |
| 3 or 4 Unit Apartments | 0 (0.0%) | 0 (0.0%) |
| 5 to 9 Unit Apartments | 0 (0.0%) | 0 (0.0%) |
| 10 or more Apartments | 0 (0.0%) | 0 (0.0%) |
| Mobile Home / Other | 0 (0.0%) | 0 (0.0%) |
| Total | 158 (99.4%) | 1 (0.6%) |
Housing Structures by Number of Rooms in Bellerive Acres
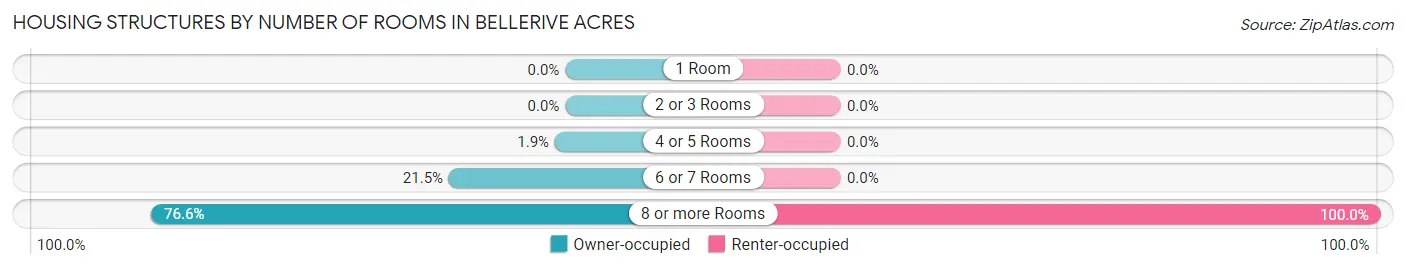
| Number of Rooms | Owner-occupied | Renter-occupied |
| 1 Room | 0 (0.0%) | 0 (0.0%) |
| 2 or 3 Rooms | 0 (0.0%) | 0 (0.0%) |
| 4 or 5 Rooms | 3 (1.9%) | 0 (0.0%) |
| 6 or 7 Rooms | 34 (21.5%) | 0 (0.0%) |
| 8 or more Rooms | 121 (76.6%) | 1 (100.0%) |
| Total | 158 (100.0%) | 1 (100.0%) |
Housing Structure by Heating Type in Bellerive Acres
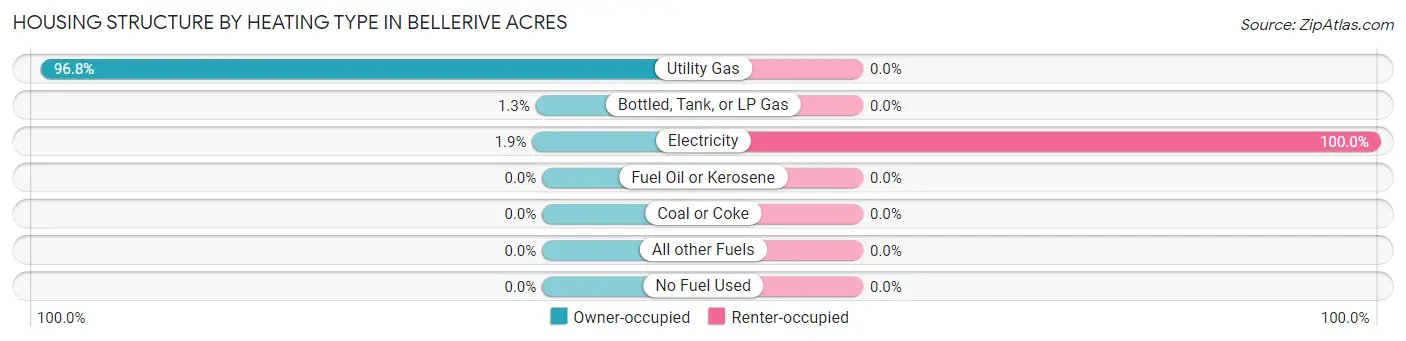
| Heating Type | Owner-occupied | Renter-occupied |
| Utility Gas | 153 (96.8%) | 0 (0.0%) |
| Bottled, Tank, or LP Gas | 2 (1.3%) | 0 (0.0%) |
| Electricity | 3 (1.9%) | 1 (100.0%) |
| Fuel Oil or Kerosene | 0 (0.0%) | 0 (0.0%) |
| Coal or Coke | 0 (0.0%) | 0 (0.0%) |
| All other Fuels | 0 (0.0%) | 0 (0.0%) |
| No Fuel Used | 0 (0.0%) | 0 (0.0%) |
| Total | 158 (100.0%) | 1 (100.0%) |
Household Vehicle Usage in Bellerive Acres
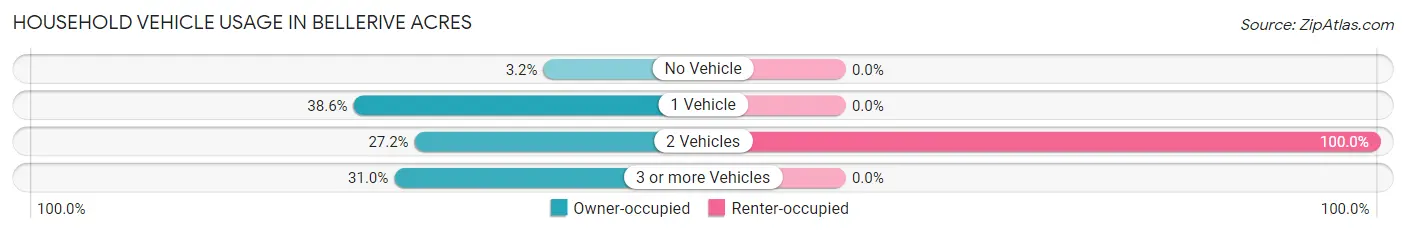
| Vehicles per Household | Owner-occupied | Renter-occupied |
| No Vehicle | 5 (3.2%) | 0 (0.0%) |
| 1 Vehicle | 61 (38.6%) | 0 (0.0%) |
| 2 Vehicles | 43 (27.2%) | 1 (100.0%) |
| 3 or more Vehicles | 49 (31.0%) | 0 (0.0%) |
| Total | 158 (100.0%) | 1 (100.0%) |
Real Estate & Mortgages in Bellerive Acres
Real Estate and Mortgage Overview in Bellerive Acres
| Characteristic | Without Mortgage | With Mortgage |
| Housing Units | 60 | 98 |
| Median Property Value | $268,400 | $336,700 |
| Median Household Income | $111,667 | $55 |
| Monthly Housing Costs | $858 | $8 |
| Real Estate Taxes | $5,833 | $0 |
Property Value by Mortgage Status in Bellerive Acres
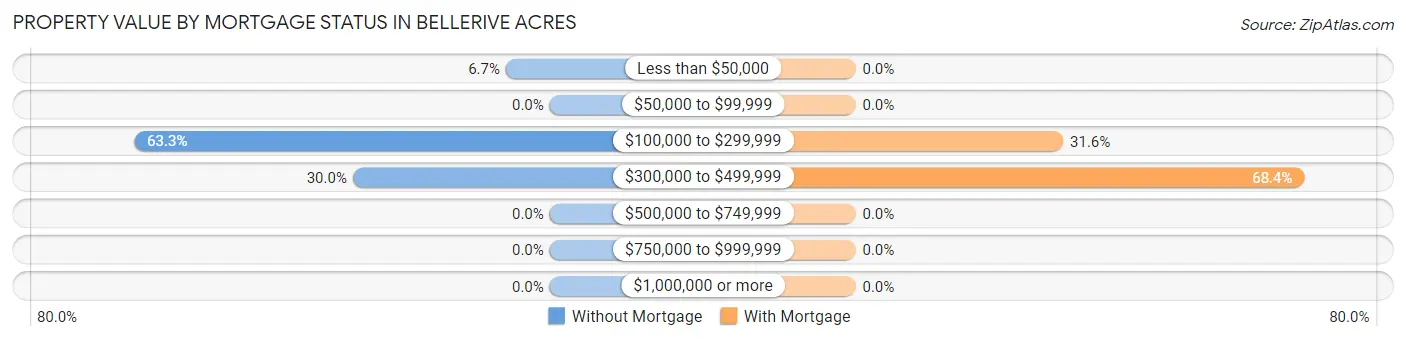
| Property Value | Without Mortgage | With Mortgage |
| Less than $50,000 | 4 (6.7%) | 0 (0.0%) |
| $50,000 to $99,999 | 0 (0.0%) | 0 (0.0%) |
| $100,000 to $299,999 | 38 (63.3%) | 31 (31.6%) |
| $300,000 to $499,999 | 18 (30.0%) | 67 (68.4%) |
| $500,000 to $749,999 | 0 (0.0%) | 0 (0.0%) |
| $750,000 to $999,999 | 0 (0.0%) | 0 (0.0%) |
| $1,000,000 or more | 0 (0.0%) | 0 (0.0%) |
| Total | 60 (100.0%) | 98 (100.0%) |
Household Income by Mortgage Status in Bellerive Acres
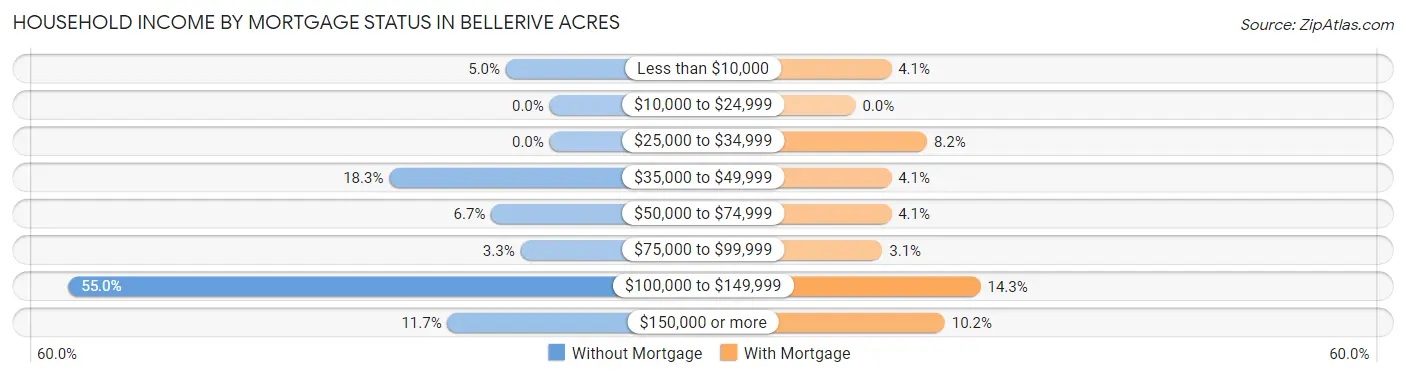
| Household Income | Without Mortgage | With Mortgage |
| Less than $10,000 | 3 (5.0%) | 4 (4.1%) |
| $10,000 to $24,999 | 0 (0.0%) | 0 (0.0%) |
| $25,000 to $34,999 | 0 (0.0%) | 8 (8.2%) |
| $35,000 to $49,999 | 11 (18.3%) | 4 (4.1%) |
| $50,000 to $74,999 | 4 (6.7%) | 4 (4.1%) |
| $75,000 to $99,999 | 2 (3.3%) | 3 (3.1%) |
| $100,000 to $149,999 | 33 (55.0%) | 14 (14.3%) |
| $150,000 or more | 7 (11.7%) | 10 (10.2%) |
| Total | 60 (100.0%) | 98 (100.0%) |
Property Value to Household Income Ratio in Bellerive Acres
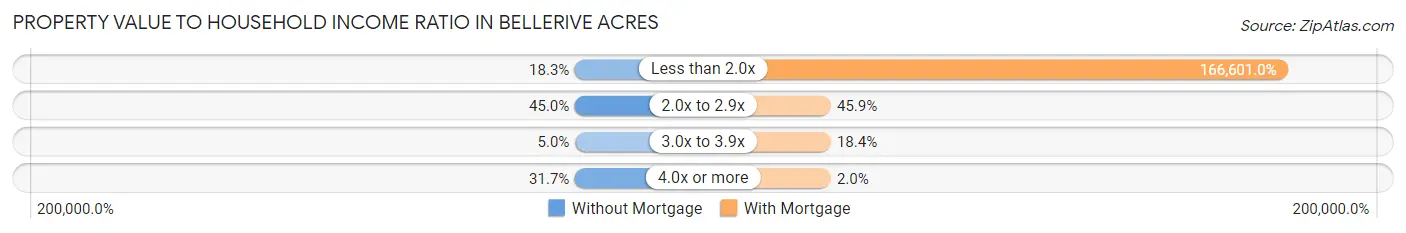
| Value-to-Income Ratio | Without Mortgage | With Mortgage |
| Less than 2.0x | 11 (18.3%) | 163,269 (166,601.0%) |
| 2.0x to 2.9x | 27 (45.0%) | 45 (45.9%) |
| 3.0x to 3.9x | 3 (5.0%) | 18 (18.4%) |
| 4.0x or more | 19 (31.7%) | 2 (2.0%) |
| Total | 60 (100.0%) | 98 (100.0%) |
Real Estate Taxes by Mortgage Status in Bellerive Acres
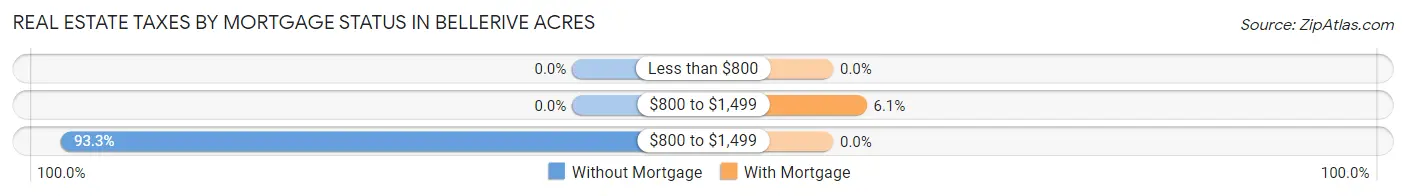
| Property Taxes | Without Mortgage | With Mortgage |
| Less than $800 | 0 (0.0%) | 0 (0.0%) |
| $800 to $1,499 | 0 (0.0%) | 6 (6.1%) |
| $800 to $1,499 | 56 (93.3%) | 0 (0.0%) |
| Total | 60 (100.0%) | 98 (100.0%) |
Health & Disability in Bellerive Acres
Health Insurance Coverage by Age in Bellerive Acres
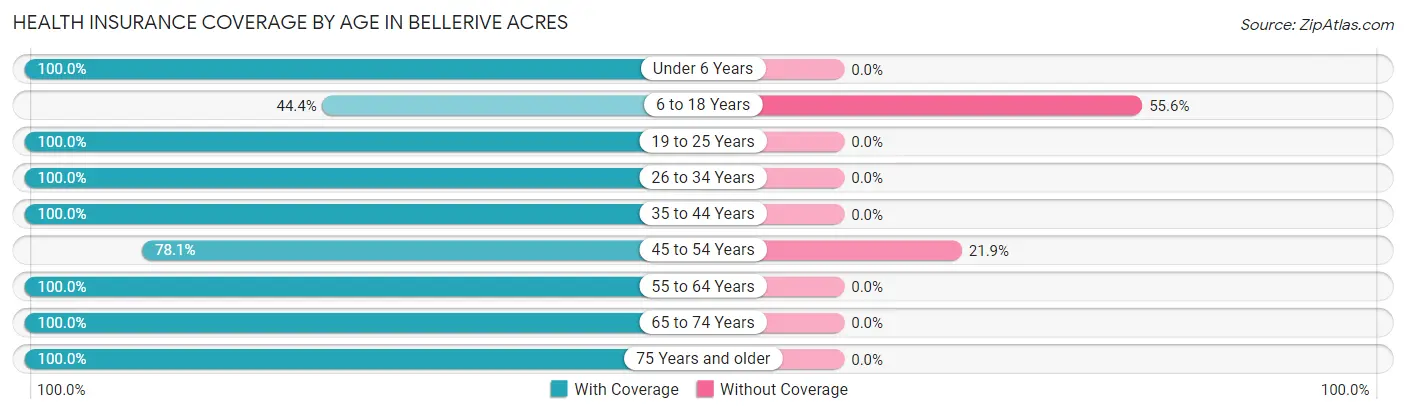
| Age Bracket | With Coverage | Without Coverage |
| Under 6 Years | 57 (100.0%) | 0 (0.0%) |
| 6 to 18 Years | 12 (44.4%) | 15 (55.6%) |
| 19 to 25 Years | 39 (100.0%) | 0 (0.0%) |
| 26 to 34 Years | 10 (100.0%) | 0 (0.0%) |
| 35 to 44 Years | 36 (100.0%) | 0 (0.0%) |
| 45 to 54 Years | 57 (78.1%) | 16 (21.9%) |
| 55 to 64 Years | 80 (100.0%) | 0 (0.0%) |
| 65 to 74 Years | 68 (100.0%) | 0 (0.0%) |
| 75 Years and older | 31 (100.0%) | 0 (0.0%) |
| Total | 390 (92.6%) | 31 (7.4%) |
Health Insurance Coverage by Citizenship Status in Bellerive Acres
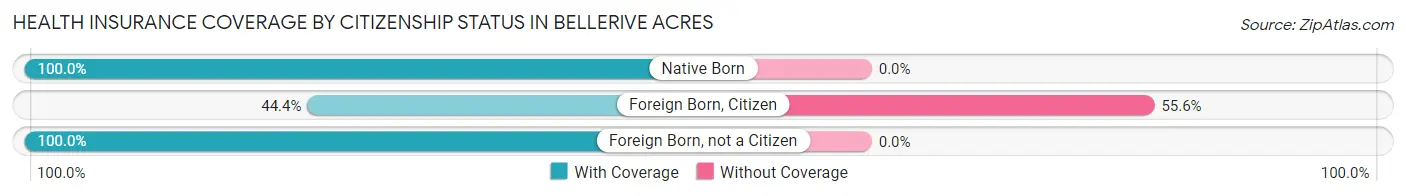
| Citizenship Status | With Coverage | Without Coverage |
| Native Born | 57 (100.0%) | 0 (0.0%) |
| Foreign Born, Citizen | 12 (44.4%) | 15 (55.6%) |
| Foreign Born, not a Citizen | 39 (100.0%) | 0 (0.0%) |
Health Insurance Coverage by Household Income in Bellerive Acres
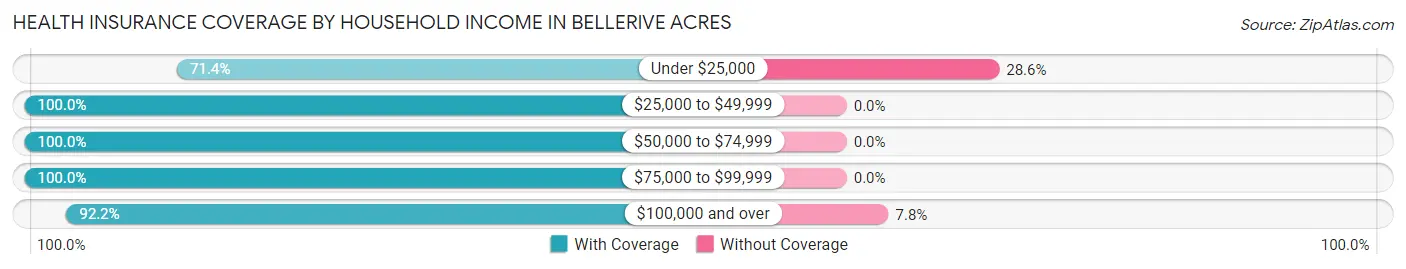
| Household Income | With Coverage | Without Coverage |
| Under $25,000 | 10 (71.4%) | 4 (28.6%) |
| $25,000 to $49,999 | 28 (100.0%) | 0 (0.0%) |
| $50,000 to $74,999 | 10 (100.0%) | 0 (0.0%) |
| $75,000 to $99,999 | 24 (100.0%) | 0 (0.0%) |
| $100,000 and over | 318 (92.2%) | 27 (7.8%) |
Public vs Private Health Insurance Coverage by Age in Bellerive Acres
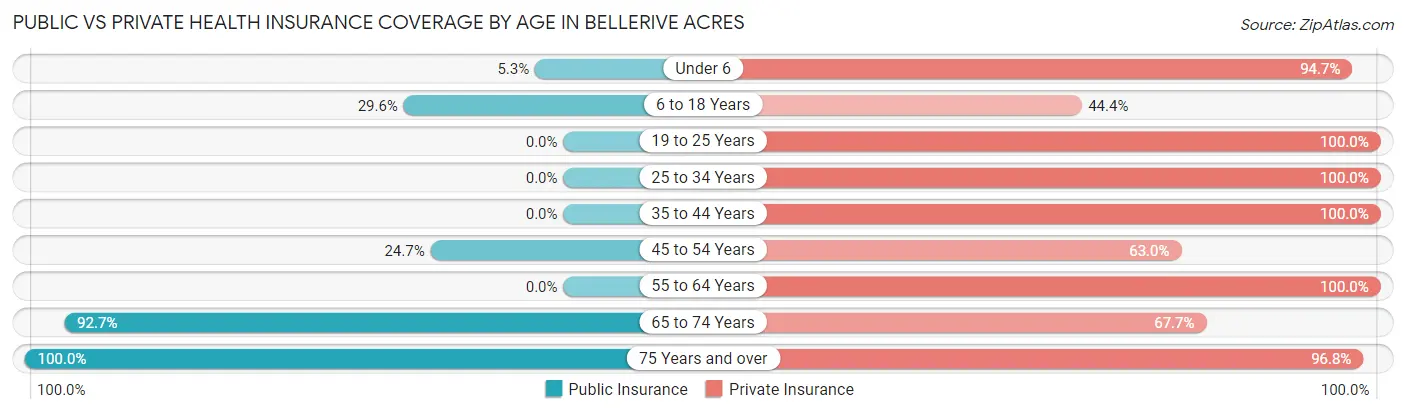
| Age Bracket | Public Insurance | Private Insurance |
| Under 6 | 3 (5.3%) | 54 (94.7%) |
| 6 to 18 Years | 8 (29.6%) | 12 (44.4%) |
| 19 to 25 Years | 0 (0.0%) | 39 (100.0%) |
| 25 to 34 Years | 0 (0.0%) | 10 (100.0%) |
| 35 to 44 Years | 0 (0.0%) | 36 (100.0%) |
| 45 to 54 Years | 18 (24.7%) | 46 (63.0%) |
| 55 to 64 Years | 0 (0.0%) | 80 (100.0%) |
| 65 to 74 Years | 63 (92.6%) | 46 (67.6%) |
| 75 Years and over | 31 (100.0%) | 30 (96.8%) |
| Total | 123 (29.2%) | 353 (83.9%) |
Disability Status by Sex by Age in Bellerive Acres
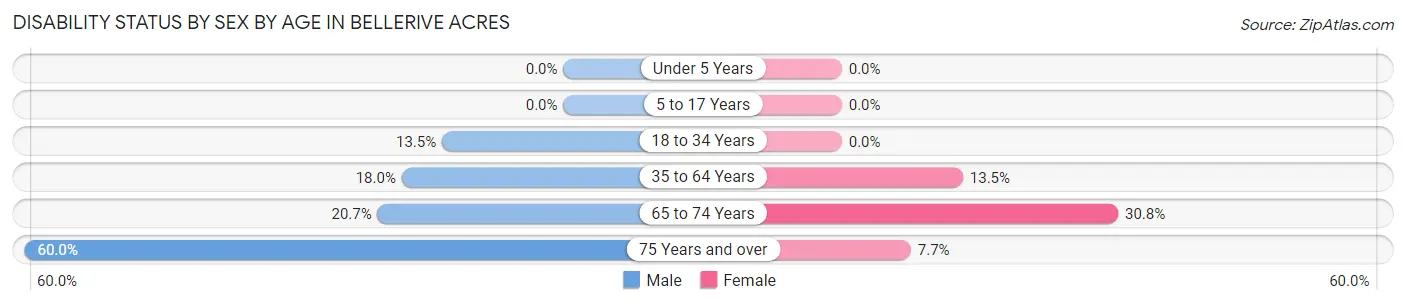
| Age Bracket | Male | Female |
| Under 5 Years | 0 (0.0%) | 0 (0.0%) |
| 5 to 17 Years | 0 (0.0%) | 0 (0.0%) |
| 18 to 34 Years | 5 (13.5%) | 0 (0.0%) |
| 35 to 64 Years | 18 (18.0%) | 12 (13.5%) |
| 65 to 74 Years | 6 (20.7%) | 12 (30.8%) |
| 75 Years and over | 3 (60.0%) | 2 (7.7%) |
Disability Class by Sex by Age in Bellerive Acres
Disability Class: Hearing Difficulty
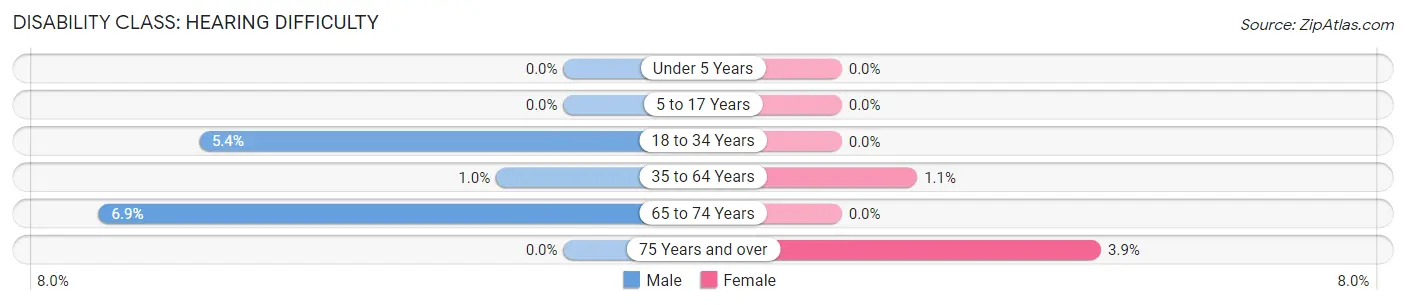
| Age Bracket | Male | Female |
| Under 5 Years | 0 (0.0%) | 0 (0.0%) |
| 5 to 17 Years | 0 (0.0%) | 0 (0.0%) |
| 18 to 34 Years | 2 (5.4%) | 0 (0.0%) |
| 35 to 64 Years | 1 (1.0%) | 1 (1.1%) |
| 65 to 74 Years | 2 (6.9%) | 0 (0.0%) |
| 75 Years and over | 0 (0.0%) | 1 (3.8%) |
Disability Class: Vision Difficulty
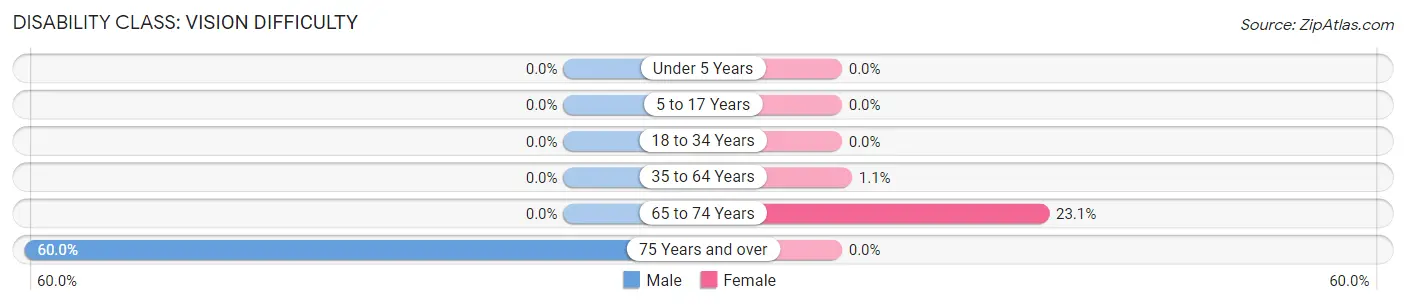
| Age Bracket | Male | Female |
| Under 5 Years | 0 (0.0%) | 0 (0.0%) |
| 5 to 17 Years | 0 (0.0%) | 0 (0.0%) |
| 18 to 34 Years | 0 (0.0%) | 0 (0.0%) |
| 35 to 64 Years | 0 (0.0%) | 1 (1.1%) |
| 65 to 74 Years | 0 (0.0%) | 9 (23.1%) |
| 75 Years and over | 3 (60.0%) | 0 (0.0%) |
Disability Class: Cognitive Difficulty

| Age Bracket | Male | Female |
| 5 to 17 Years | 0 (0.0%) | 0 (0.0%) |
| 18 to 34 Years | 3 (8.1%) | 0 (0.0%) |
| 35 to 64 Years | 0 (0.0%) | 5 (5.6%) |
| 65 to 74 Years | 0 (0.0%) | 6 (15.4%) |
| 75 Years and over | 0 (0.0%) | 0 (0.0%) |
Disability Class: Ambulatory Difficulty
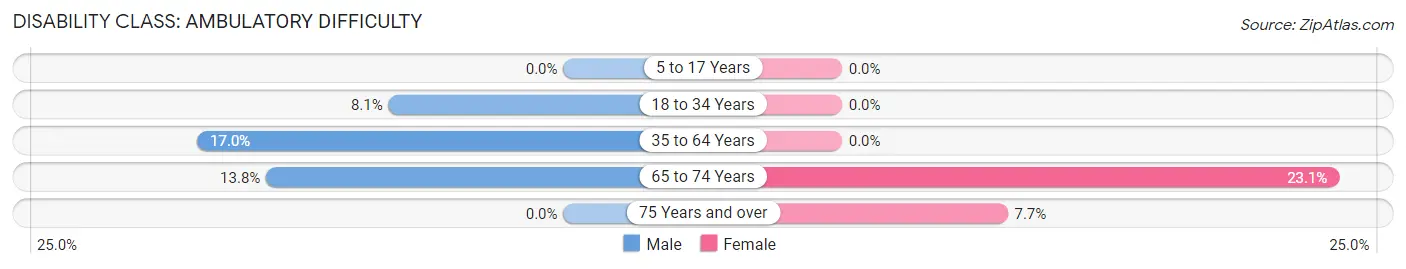
| Age Bracket | Male | Female |
| 5 to 17 Years | 0 (0.0%) | 0 (0.0%) |
| 18 to 34 Years | 3 (8.1%) | 0 (0.0%) |
| 35 to 64 Years | 17 (17.0%) | 0 (0.0%) |
| 65 to 74 Years | 4 (13.8%) | 9 (23.1%) |
| 75 Years and over | 0 (0.0%) | 2 (7.7%) |
Disability Class: Self-Care Difficulty
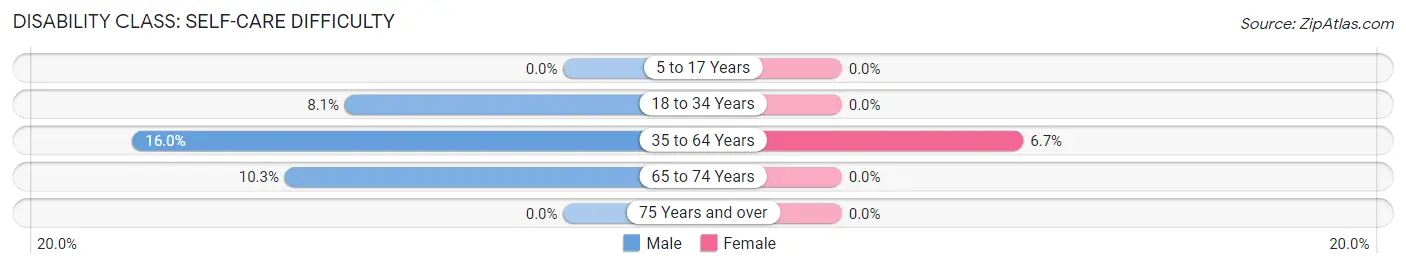
| Age Bracket | Male | Female |
| 5 to 17 Years | 0 (0.0%) | 0 (0.0%) |
| 18 to 34 Years | 3 (8.1%) | 0 (0.0%) |
| 35 to 64 Years | 16 (16.0%) | 6 (6.7%) |
| 65 to 74 Years | 3 (10.3%) | 0 (0.0%) |
| 75 Years and over | 0 (0.0%) | 0 (0.0%) |
Technology Access in Bellerive Acres
Computing Device Access in Bellerive Acres
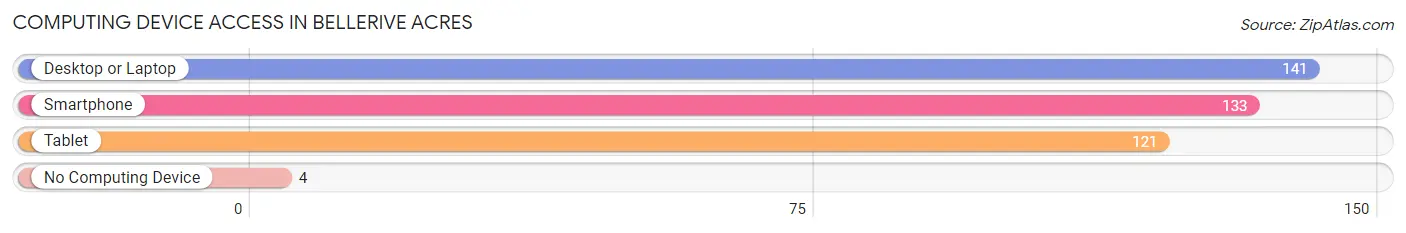
| Device Type | # Households | % Households |
| Desktop or Laptop | 141 | 88.7% |
| Smartphone | 133 | 83.7% |
| Tablet | 121 | 76.1% |
| No Computing Device | 4 | 2.5% |
| Total | 159 | 100.0% |
Internet Access in Bellerive Acres
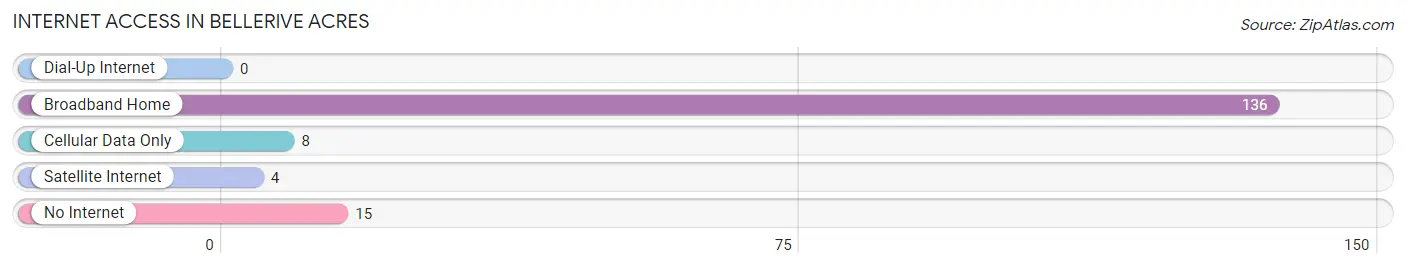
| Internet Type | # Households | % Households |
| Dial-Up Internet | 0 | 0.0% |
| Broadband Home | 136 | 85.5% |
| Cellular Data Only | 8 | 5.0% |
| Satellite Internet | 4 | 2.5% |
| No Internet | 15 | 9.4% |
| Total | 159 | 100.0% |
Bellerive Acres Summary
Bellerive Acres is a small city located in St. Louis County, Missouri. It is situated on the banks of the Mississippi River, just south of the city of St. Louis. The city has a population of approximately 1,500 people and is part of the Greater St. Louis metropolitan area.
Geography
Bellerive Acres is located in the southwestern corner of St. Louis County, Missouri. It is situated on the banks of the Mississippi River, just south of the city of St. Louis. The city is bordered by the cities of St. Louis, St. Charles, and St. Peters. The city is located in the Central Lowland physiographic region of the United States. The city has a total area of 0.9 square miles, all of which is land.
History
Bellerive Acres was founded in the early 1950s by a group of developers who wanted to create a suburban community in the St. Louis area. The city was named after the Bellerive Country Club, which was located nearby. The city was incorporated in 1954 and has remained relatively unchanged since then.
Economy
Bellerive Acres is primarily a residential community, with most of its residents employed in the nearby cities of St. Louis, St. Charles, and St. Peters. The city does not have any major employers, but there are several small businesses located in the city. These include a grocery store, a gas station, a pharmacy, and a few restaurants.
Demographics
As of the 2010 census, there were 1,500 people, 602 households, and 437 families residing in the city. The population density was 1,636.7 people per square mile. The racial makeup of the city was 94.7% White, 1.3% African American, 0.2% Native American, 0.7% Asian, 0.1% Pacific Islander, 0.7% from other races, and 2.3% from two or more races. Hispanic or Latino of any race were 2.3% of the population.
The median income for a household in the city was $50,000, and the median income for a family was $60,000. Males had a median income of $45,000 versus $30,000 for females. The per capita income for the city was $25,000. About 4.3% of families and 5.3% of the population were below the poverty line, including 6.7% of those under age 18 and 4.3% of those age 65 or over.
Conclusion
Bellerive Acres is a small city located in St. Louis County, Missouri. It is situated on the banks of the Mississippi River, just south of the city of St. Louis. The city has a population of approximately 1,500 people and is part of the Greater St. Louis metropolitan area. The city was founded in the early 1950s and has remained relatively unchanged since then. The economy of the city is primarily residential, with most of its residents employed in the nearby cities of St. Louis, St. Charles, and St. Peters. The population of the city is predominantly white, with a small percentage of African Americans, Native Americans, Asians, and other races. The median income for a household in the city is $50,000, and the median income for a family is $60,000.
Common Questions
What is Per Capita Income in Bellerive Acres?
Per Capita income in Bellerive Acres is $55,126.
What is the Median Family Income in Bellerive Acres?
Median Family Income in Bellerive Acres is $151,250.
What is the Median Household income in Bellerive Acres?
Median Household Income in Bellerive Acres is $116,979.
What is Income or Wage Gap in Bellerive Acres?
Income or Wage Gap in Bellerive Acres is 10.4%.
Women in Bellerive Acres earn 89.6 cents for every dollar earned by a man.
What is Inequality or Gini Index in Bellerive Acres?
Inequality or Gini Index in Bellerive Acres is 0.37.
What is the Total Population of Bellerive Acres?
Total Population of Bellerive Acres is 421.
What is the Total Male Population of Bellerive Acres?
Total Male Population of Bellerive Acres is 176.
What is the Total Female Population of Bellerive Acres?
Total Female Population of Bellerive Acres is 245.
What is the Ratio of Males per 100 Females in Bellerive Acres?
There are 71.84 Males per 100 Females in Bellerive Acres.
What is the Ratio of Females per 100 Males in Bellerive Acres?
There are 139.20 Females per 100 Males in Bellerive Acres.
What is the Median Population Age in Bellerive Acres?
Median Population Age in Bellerive Acres is 51.3 Years.
What is the Average Family Size in Bellerive Acres
Average Family Size in Bellerive Acres is 3.1 People.
What is the Average Household Size in Bellerive Acres
Average Household Size in Bellerive Acres is 2.6 People.
How Large is the Labor Force in Bellerive Acres?
There are 220 People in the Labor Forcein in Bellerive Acres.
What is the Percentage of People in the Labor Force in Bellerive Acres?
62.1% of People are in the Labor Force in Bellerive Acres.
What is the Unemployment Rate in Bellerive Acres?
Unemployment Rate in Bellerive Acres is 5.5%.