Lake Winnebago, MO Map & Demographics
Lake Winnebago Map
Lake Winnebago Overview
$76,821
PER CAPITA INCOME
$173,194
AVG FAMILY INCOME
$173,194
AVG HOUSEHOLD INCOME
40.0%
WAGE / INCOME GAP [ % ]
60.0¢/ $1
WAGE / INCOME GAP [ $ ]
0.37
INEQUALITY / GINI INDEX
1,263
TOTAL POPULATION
662
MALE POPULATION
601
FEMALE POPULATION
110.15
MALES / 100 FEMALES
90.79
FEMALES / 100 MALES
50.6
MEDIAN AGE
2.8
AVG FAMILY SIZE
2.6
AVG HOUSEHOLD SIZE
615
LABOR FORCE [ PEOPLE ]
57.4%
PERCENT IN LABOR FORCE
1.3%
UNEMPLOYMENT RATE
Lake Winnebago Area Codes
Income in Lake Winnebago
Income Overview in Lake Winnebago
Per Capita Income in Lake Winnebago is $76,821, while median incomes of families and households are $173,194 and $173,194 respectively.
| Characteristic | Number | Measure |
| Per Capita Income | 1,263 | $76,821 |
| Median Family Income | 399 | $173,194 |
| Mean Family Income | 399 | $195,017 |
| Median Household Income | 491 | $173,194 |
| Mean Household Income | 491 | $190,095 |
| Income Deficit | 399 | $0 |
| Wage / Income Gap (%) | 1,263 | 39.97% |
| Wage / Income Gap ($) | 1,263 | 60.03¢ per $1 |
| Gini / Inequality Index | 1,263 | 0.37 |
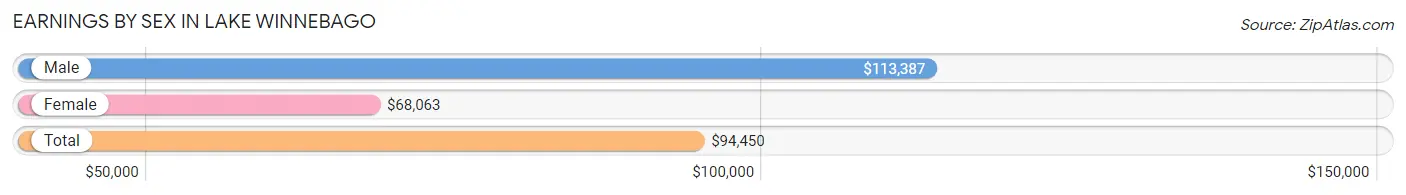
Earnings by Sex in Lake Winnebago
Average Earnings in Lake Winnebago are $94,450, $113,387 for men and $68,063 for women, a difference of 40.0%.
| Sex | Number | Average Earnings |
| Male | 384 (57.1%) | $113,387 |
| Female | 289 (42.9%) | $68,063 |
| Total | 673 (100.0%) | $94,450 |
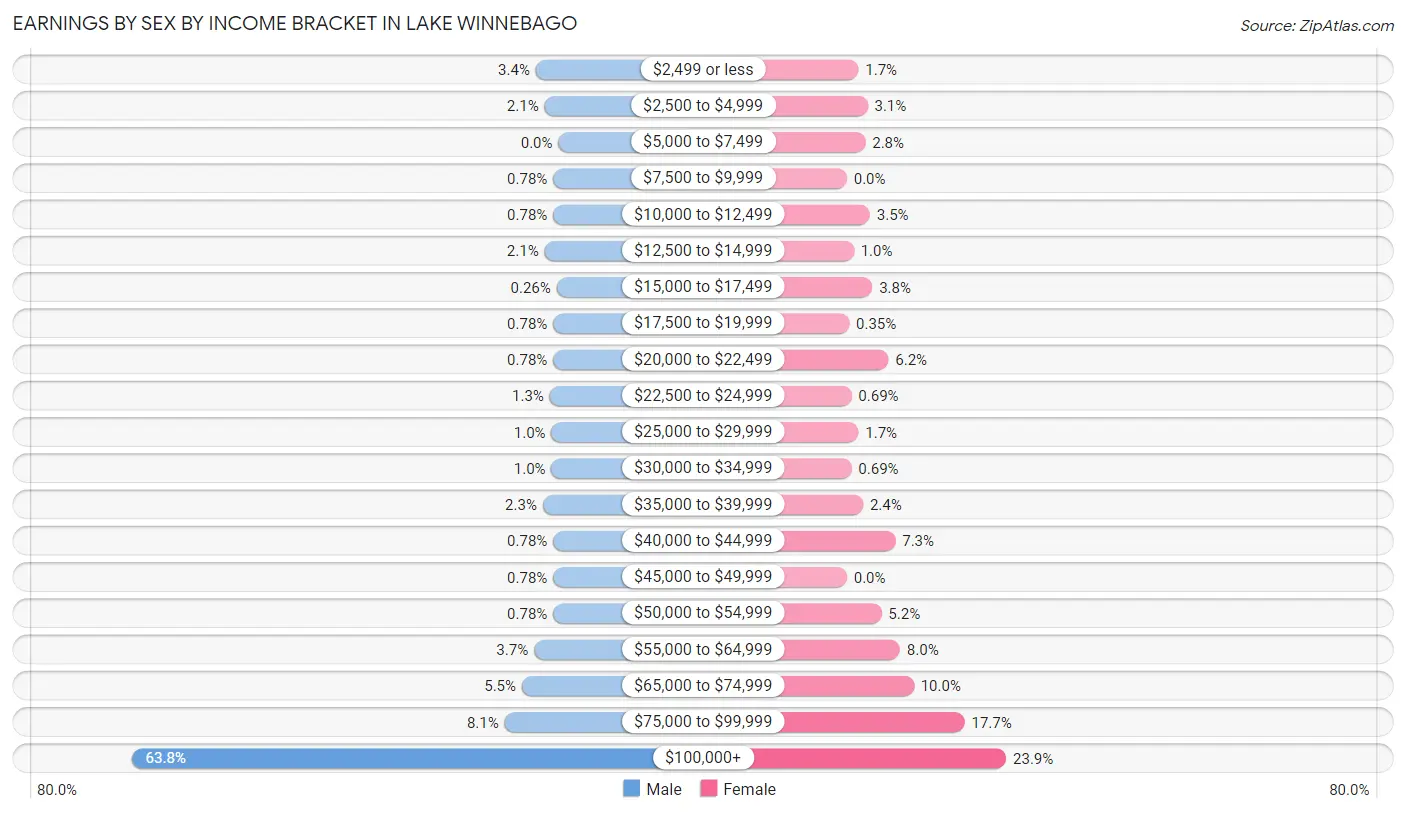
Earnings by Sex by Income Bracket in Lake Winnebago
The most common earnings brackets in Lake Winnebago are $100,000+ for men (245 | 63.8%) and $100,000+ for women (69 | 23.9%).
| Income | Male | Female |
| $2,499 or less | 13 (3.4%) | 5 (1.7%) |
| $2,500 to $4,999 | 8 (2.1%) | 9 (3.1%) |
| $5,000 to $7,499 | 0 (0.0%) | 8 (2.8%) |
| $7,500 to $9,999 | 3 (0.8%) | 0 (0.0%) |
| $10,000 to $12,499 | 3 (0.8%) | 10 (3.5%) |
| $12,500 to $14,999 | 8 (2.1%) | 3 (1.0%) |
| $15,000 to $17,499 | 1 (0.3%) | 11 (3.8%) |
| $17,500 to $19,999 | 3 (0.8%) | 1 (0.4%) |
| $20,000 to $22,499 | 3 (0.8%) | 18 (6.2%) |
| $22,500 to $24,999 | 5 (1.3%) | 2 (0.7%) |
| $25,000 to $29,999 | 4 (1.0%) | 5 (1.7%) |
| $30,000 to $34,999 | 4 (1.0%) | 2 (0.7%) |
| $35,000 to $39,999 | 9 (2.3%) | 7 (2.4%) |
| $40,000 to $44,999 | 3 (0.8%) | 21 (7.3%) |
| $45,000 to $49,999 | 3 (0.8%) | 0 (0.0%) |
| $50,000 to $54,999 | 3 (0.8%) | 15 (5.2%) |
| $55,000 to $64,999 | 14 (3.6%) | 23 (8.0%) |
| $65,000 to $74,999 | 21 (5.5%) | 29 (10.0%) |
| $75,000 to $99,999 | 31 (8.1%) | 51 (17.6%) |
| $100,000+ | 245 (63.8%) | 69 (23.9%) |
| Total | 384 (100.0%) | 289 (100.0%) |
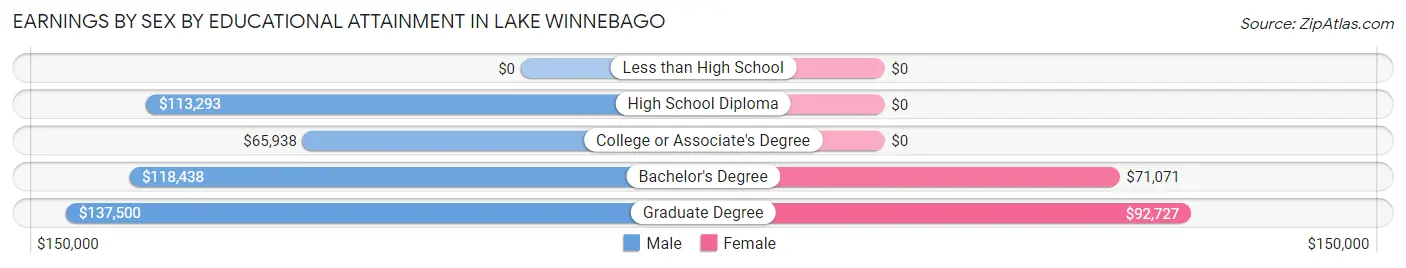
Earnings by Sex by Educational Attainment in Lake Winnebago
Average earnings in Lake Winnebago are $113,790 for men and $68,875 for women, a difference of 39.5%. Men with an educational attainment of graduate degree enjoy the highest average annual earnings of $137,500, while those with college or associate's degree education earn the least with $65,938. Women with an educational attainment of graduate degree earn the most with the average annual earnings of $92,727, while those with bachelor's degree education have the smallest earnings of $71,071.
| Educational Attainment | Male Income | Female Income |
| Less than High School | - | - |
| High School Diploma | $113,293 | $0 |
| College or Associate's Degree | $65,938 | $0 |
| Bachelor's Degree | $118,438 | $71,071 |
| Graduate Degree | $137,500 | $92,727 |
| Total | $113,790 | $68,875 |
Family Income in Lake Winnebago
Family Income Brackets in Lake Winnebago
According to the Lake Winnebago family income data, there are 151 families falling into the $200,000+ income range, which is the most common income bracket and makes up 37.8% of all families.
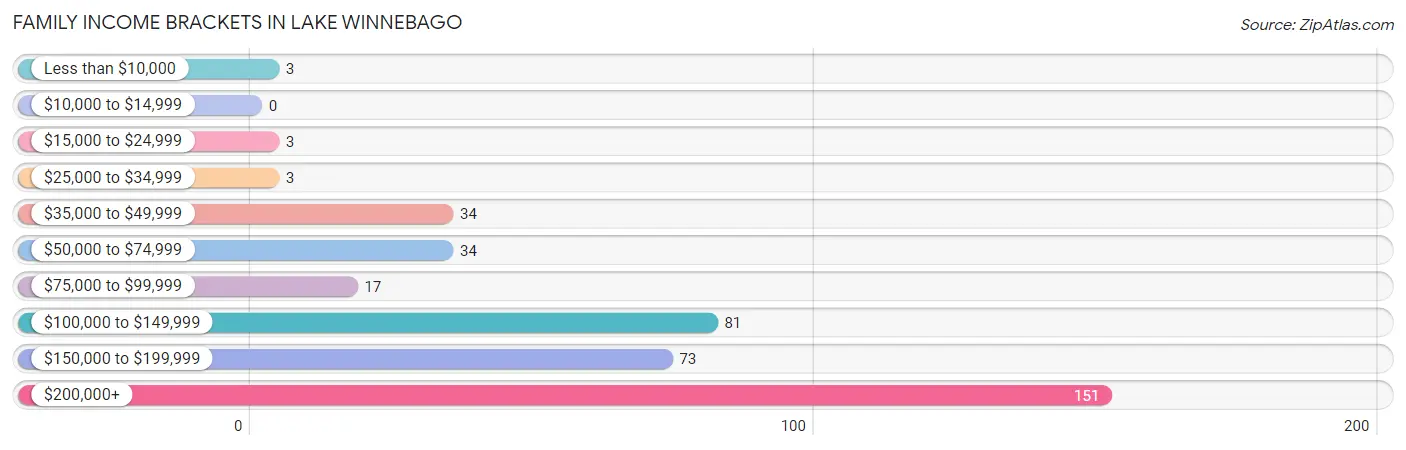
| Income Bracket | # Families | % Families |
| Less than $10,000 | 3 | 0.8% |
| $10,000 to $14,999 | 0 | 0.0% |
| $15,000 to $24,999 | 3 | 0.8% |
| $25,000 to $34,999 | 3 | 0.8% |
| $35,000 to $49,999 | 34 | 8.5% |
| $50,000 to $74,999 | 34 | 8.5% |
| $75,000 to $99,999 | 17 | 4.3% |
| $100,000 to $149,999 | 81 | 20.3% |
| $150,000 to $199,999 | 73 | 18.3% |
| $200,000+ | 151 | 37.8% |
Family Income by Famaliy Size in Lake Winnebago
4-person families (85 | 21.3%) account for the highest median family income in Lake Winnebago with $209,583 per family, while 2-person families (220 | 55.1%) have the highest median income of $71,771 per family member.
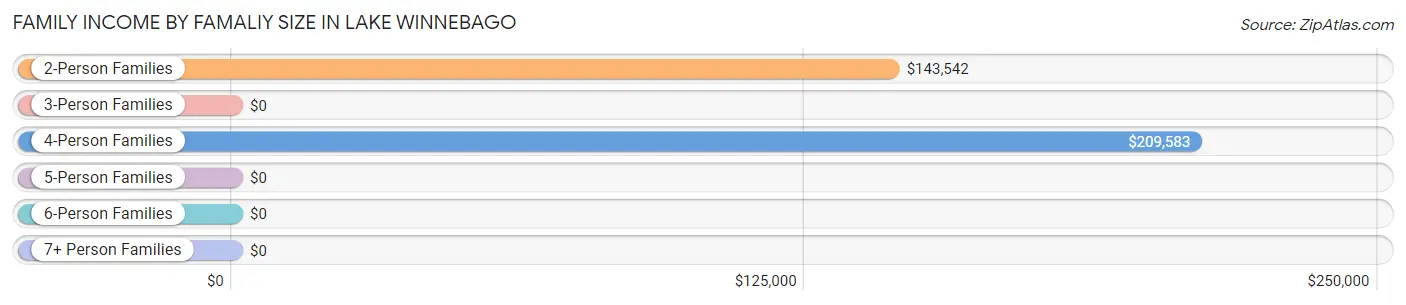
| Income Bracket | # Families | Median Income |
| 2-Person Families | 220 (55.1%) | $143,542 |
| 3-Person Families | 69 (17.3%) | $0 |
| 4-Person Families | 85 (21.3%) | $209,583 |
| 5-Person Families | 20 (5.0%) | $0 |
| 6-Person Families | 5 (1.3%) | $0 |
| 7+ Person Families | 0 (0.0%) | $0 |
| Total | 399 (100.0%) | $173,194 |
Family Income by Number of Earners in Lake Winnebago
The median family income in Lake Winnebago is $173,194, with families comprising 3+ earners (21) having the highest median family income of $214,063, while families with no earners (79) have the lowest median family income of $75,750, accounting for 5.3% and 19.8% of families, respectively.
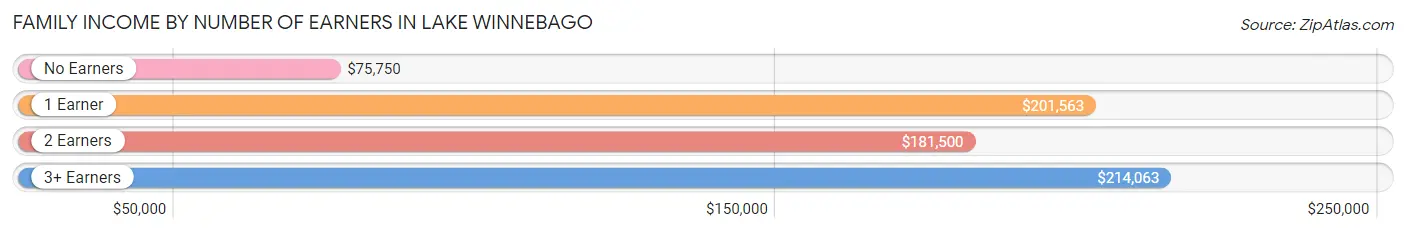
| Number of Earners | # Families | Median Income |
| No Earners | 79 (19.8%) | $75,750 |
| 1 Earner | 97 (24.3%) | $201,563 |
| 2 Earners | 202 (50.6%) | $181,500 |
| 3+ Earners | 21 (5.3%) | $214,063 |
| Total | 399 (100.0%) | $173,194 |
Household Income in Lake Winnebago
Household Income Brackets in Lake Winnebago
With 183 households falling in the category, the $200,000+ income range is the most frequent in Lake Winnebago, accounting for 37.3% of all households.
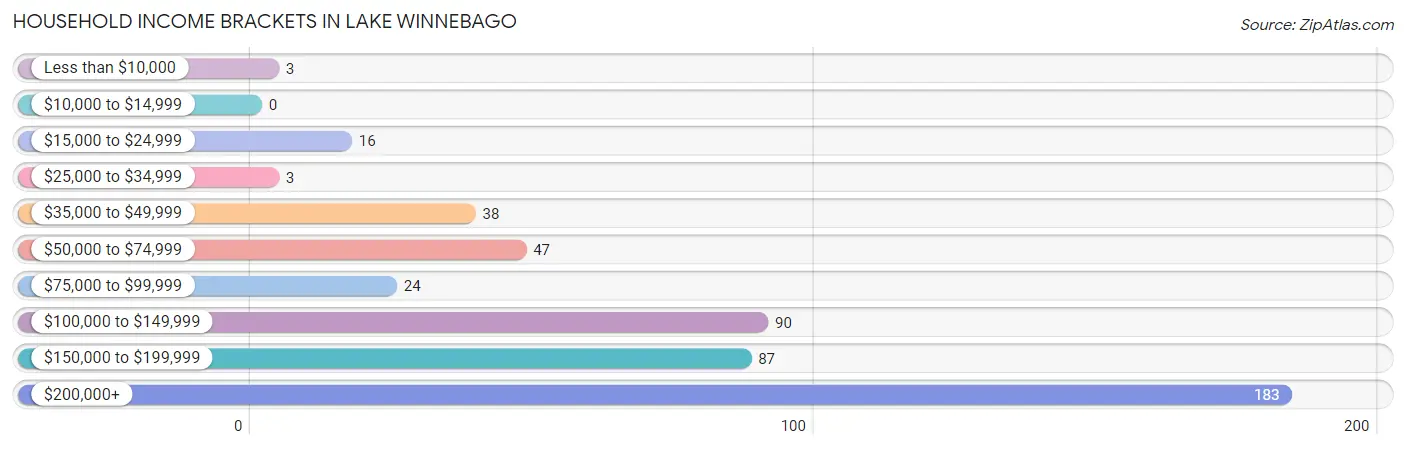
| Income Bracket | # Households | % Households |
| Less than $10,000 | 3 | 0.6% |
| $10,000 to $14,999 | 0 | 0.0% |
| $15,000 to $24,999 | 16 | 3.3% |
| $25,000 to $34,999 | 3 | 0.6% |
| $35,000 to $49,999 | 38 | 7.7% |
| $50,000 to $74,999 | 47 | 9.6% |
| $75,000 to $99,999 | 24 | 4.9% |
| $100,000 to $149,999 | 90 | 18.3% |
| $150,000 to $199,999 | 87 | 17.7% |
| $200,000+ | 183 | 37.3% |
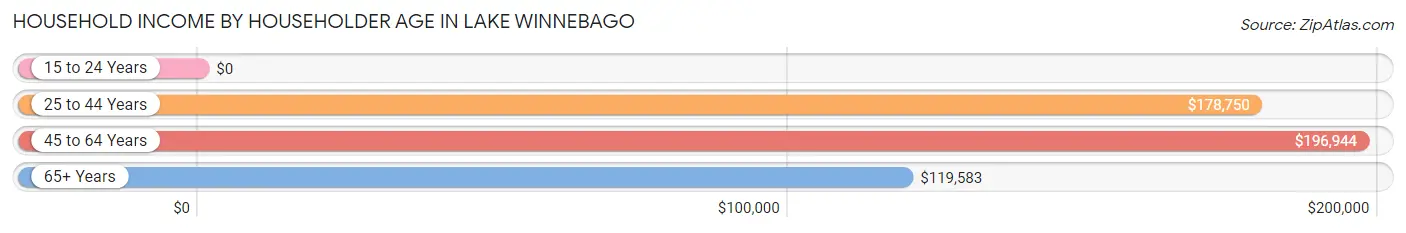
Household Income by Householder Age in Lake Winnebago
The median household income in Lake Winnebago is $173,194, with the highest median household income of $196,944 found in the 45 to 64 years age bracket for the primary householder. A total of 214 households (43.6%) fall into this category.
| Income Bracket | # Households | Median Income |
| 15 to 24 Years | 0 (0.0%) | $0 |
| 25 to 44 Years | 122 (24.8%) | $178,750 |
| 45 to 64 Years | 214 (43.6%) | $196,944 |
| 65+ Years | 155 (31.6%) | $119,583 |
| Total | 491 (100.0%) | $173,194 |
Poverty in Lake Winnebago
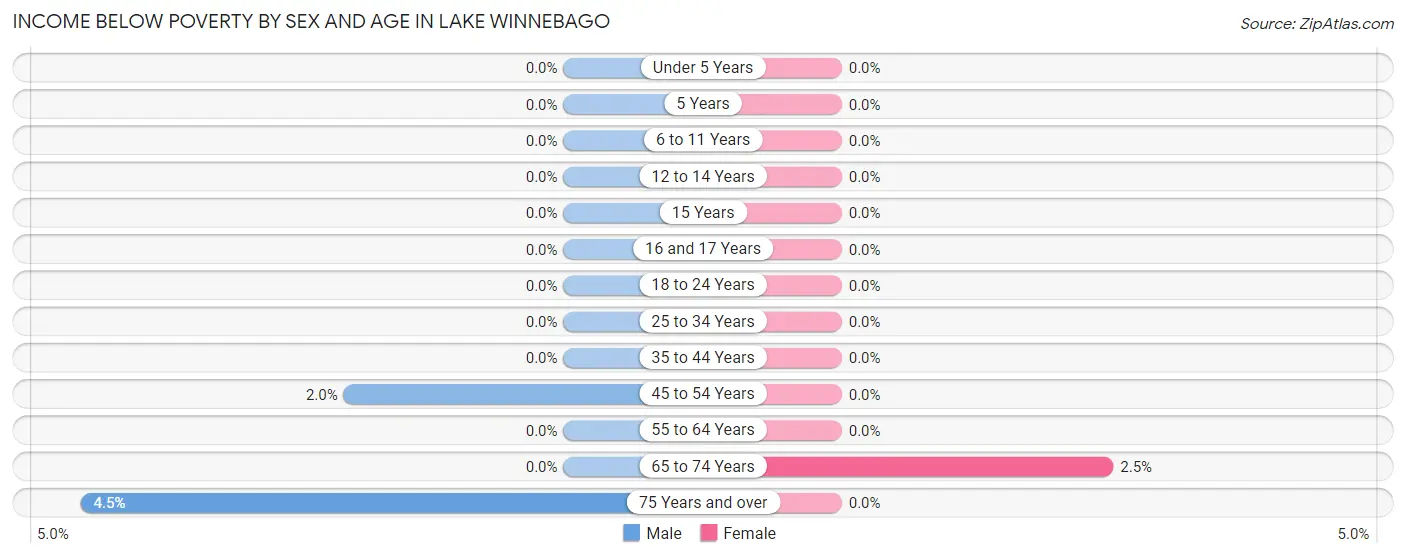
Income Below Poverty by Sex and Age in Lake Winnebago
With 0.9% poverty level for males and 0.5% for females among the residents of Lake Winnebago, 75 year old and over males and 65 to 74 year old females are the most vulnerable to poverty, with 3 males (4.5%) and 3 females (2.5%) in their respective age groups living below the poverty level.
| Age Bracket | Male | Female |
| Under 5 Years | 0 (0.0%) | 0 (0.0%) |
| 5 Years | 0 (0.0%) | 0 (0.0%) |
| 6 to 11 Years | 0 (0.0%) | 0 (0.0%) |
| 12 to 14 Years | 0 (0.0%) | 0 (0.0%) |
| 15 Years | 0 (0.0%) | 0 (0.0%) |
| 16 and 17 Years | 0 (0.0%) | 0 (0.0%) |
| 18 to 24 Years | 0 (0.0%) | 0 (0.0%) |
| 25 to 34 Years | 0 (0.0%) | 0 (0.0%) |
| 35 to 44 Years | 0 (0.0%) | 0 (0.0%) |
| 45 to 54 Years | 3 (2.0%) | 0 (0.0%) |
| 55 to 64 Years | 0 (0.0%) | 0 (0.0%) |
| 65 to 74 Years | 0 (0.0%) | 3 (2.5%) |
| 75 Years and over | 3 (4.5%) | 0 (0.0%) |
| Total | 6 (0.9%) | 3 (0.5%) |
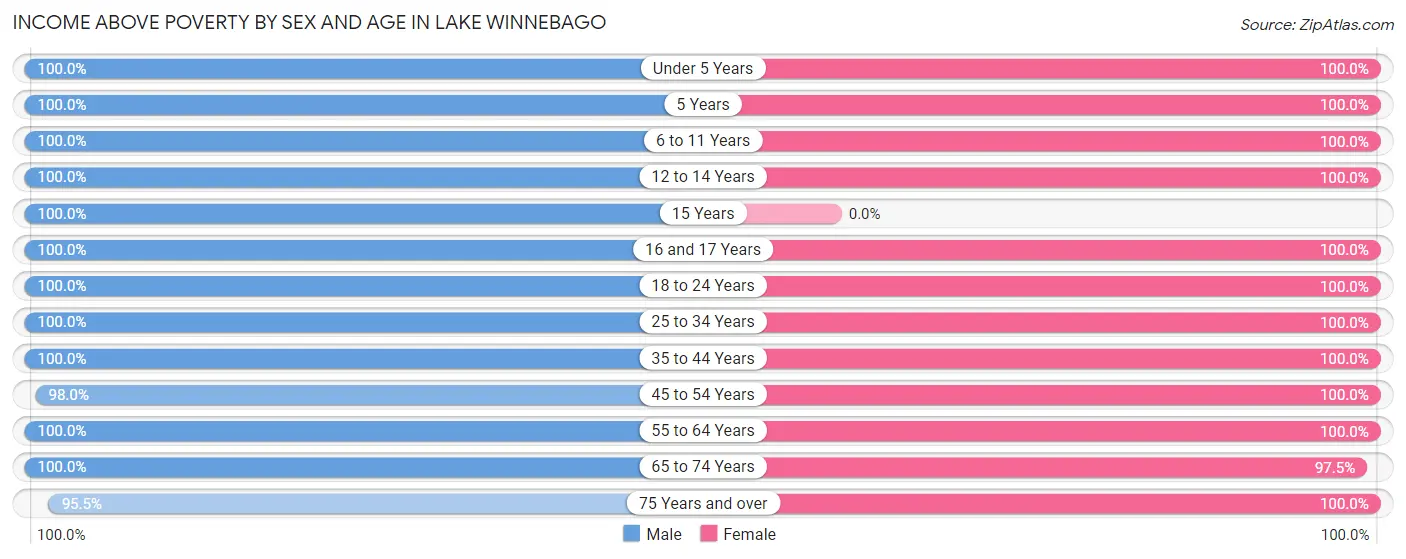
Income Above Poverty by Sex and Age in Lake Winnebago
According to the poverty statistics in Lake Winnebago, males aged under 5 years and females aged under 5 years are the age groups that are most secure financially, with 100.0% of males and 100.0% of females in these age groups living above the poverty line.
| Age Bracket | Male | Female |
| Under 5 Years | 11 (100.0%) | 7 (100.0%) |
| 5 Years | 13 (100.0%) | 8 (100.0%) |
| 6 to 11 Years | 39 (100.0%) | 58 (100.0%) |
| 12 to 14 Years | 12 (100.0%) | 38 (100.0%) |
| 15 Years | 5 (100.0%) | 0 (0.0%) |
| 16 and 17 Years | 20 (100.0%) | 17 (100.0%) |
| 18 to 24 Years | 16 (100.0%) | 9 (100.0%) |
| 25 to 34 Years | 21 (100.0%) | 32 (100.0%) |
| 35 to 44 Years | 89 (100.0%) | 85 (100.0%) |
| 45 to 54 Years | 144 (98.0%) | 107 (100.0%) |
| 55 to 64 Years | 107 (100.0%) | 84 (100.0%) |
| 65 to 74 Years | 115 (100.0%) | 116 (97.5%) |
| 75 Years and over | 64 (95.5%) | 37 (100.0%) |
| Total | 656 (99.1%) | 598 (99.5%) |
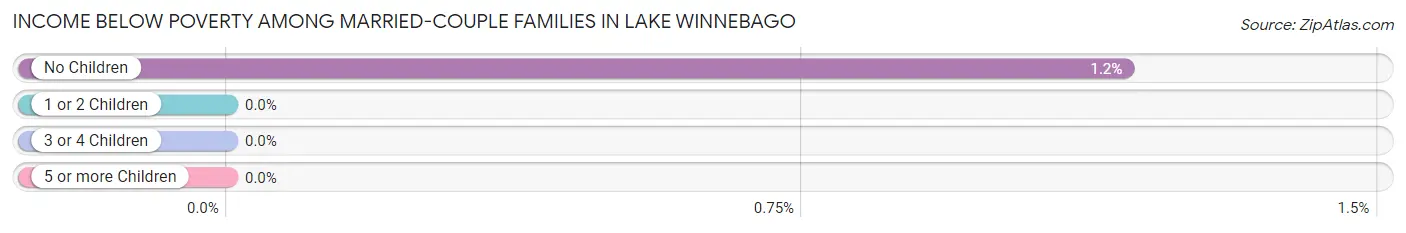
Income Below Poverty Among Married-Couple Families in Lake Winnebago
The poverty statistics for married-couple families in Lake Winnebago show that 0.8% or 3 of the total 387 families live below the poverty line. Families with no children have the highest poverty rate of 1.2%, comprising of 3 families. On the other hand, families with 1 or 2 children have the lowest poverty rate of 0.0%, which includes 0 families.
| Children | Above Poverty | Below Poverty |
| No Children | 254 (98.8%) | 3 (1.2%) |
| 1 or 2 Children | 125 (100.0%) | 0 (0.0%) |
| 3 or 4 Children | 5 (100.0%) | 0 (0.0%) |
| 5 or more Children | 0 (0.0%) | 0 (0.0%) |
| Total | 384 (99.2%) | 3 (0.8%) |
Income Below Poverty Among Single-Parent Households in Lake Winnebago
| Children | Single Father | Single Mother |
| No Children | 0 (0.0%) | 0 (0.0%) |
| 1 or 2 Children | 0 (0.0%) | 0 (0.0%) |
| 3 or 4 Children | 0 (0.0%) | 0 (0.0%) |
| 5 or more Children | 0 (0.0%) | 0 (0.0%) |
| Total | 0 (0.0%) | 0 (0.0%) |
Income Below Poverty Among Married-Couple vs Single-Parent Households in Lake Winnebago
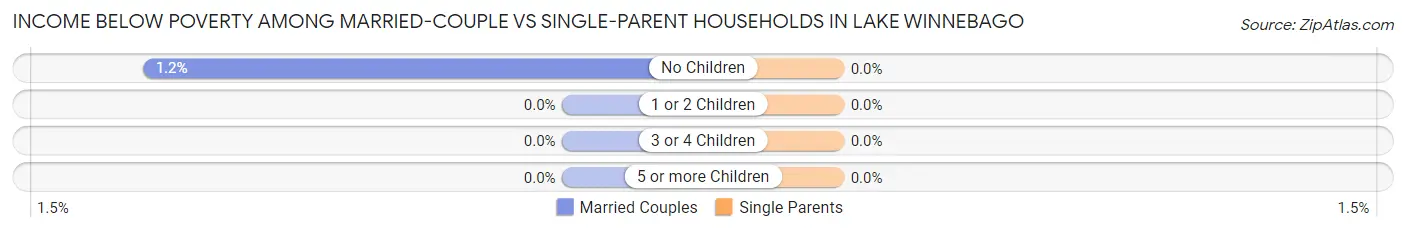
| Children | Married-Couple Families | Single-Parent Households |
| No Children | 3 (1.2%) | 0 (0.0%) |
| 1 or 2 Children | 0 (0.0%) | 0 (0.0%) |
| 3 or 4 Children | 0 (0.0%) | 0 (0.0%) |
| 5 or more Children | 0 (0.0%) | 0 (0.0%) |
| Total | 3 (0.8%) | 0 (0.0%) |
Race in Lake Winnebago
The most populous races in Lake Winnebago are White / Caucasian (1,196 | 94.7%), Black / African American (39 | 3.1%), and Two or more Races (26 | 2.1%).
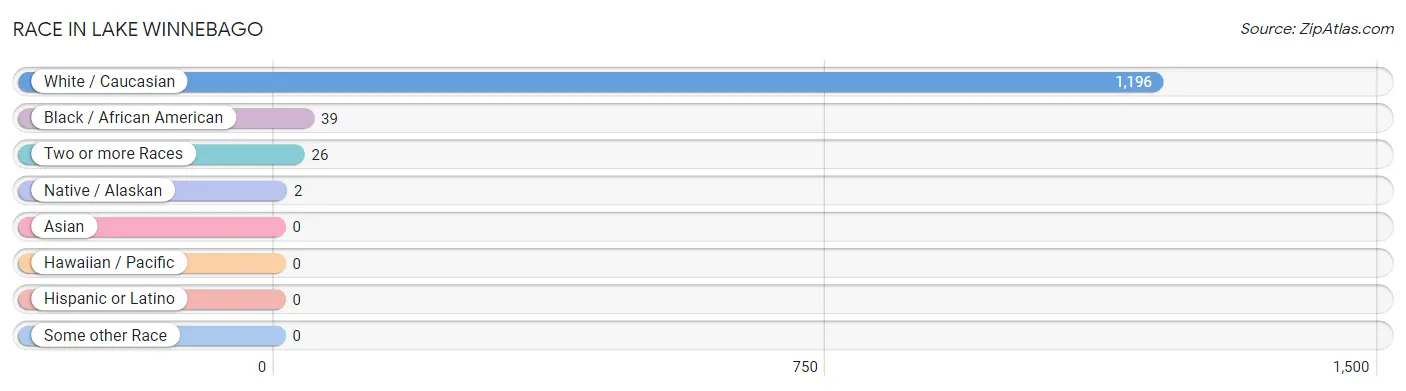
| Race | # Population | % Population |
| Asian | 0 | 0.0% |
| Black / African American | 39 | 3.1% |
| Hawaiian / Pacific | 0 | 0.0% |
| Hispanic or Latino | 0 | 0.0% |
| Native / Alaskan | 2 | 0.2% |
| White / Caucasian | 1,196 | 94.7% |
| Two or more Races | 26 | 2.1% |
| Some other Race | 0 | 0.0% |
| Total | 1,263 | 100.0% |
Ancestry in Lake Winnebago
The most populous ancestries reported in Lake Winnebago are German (311 | 24.6%), English (278 | 22.0%), Irish (157 | 12.4%), Italian (121 | 9.6%), and European (108 | 8.6%), together accounting for 77.2% of all Lake Winnebago residents.
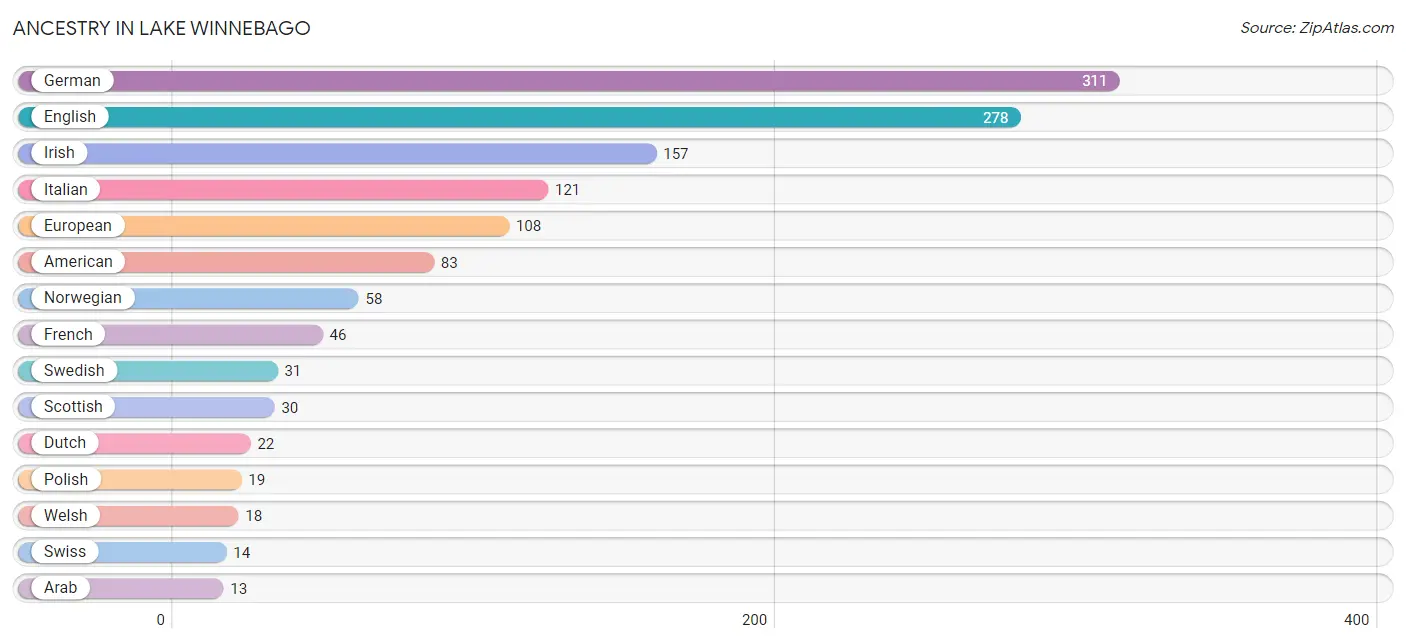
| Ancestry | # Population | % Population |
| American | 83 | 6.6% |
| Arab | 13 | 1.0% |
| Austrian | 3 | 0.2% |
| Belgian | 5 | 0.4% |
| Bhutanese | 5 | 0.4% |
| British | 2 | 0.2% |
| Cherokee | 7 | 0.5% |
| Croatian | 3 | 0.2% |
| Czech | 6 | 0.5% |
| Czechoslovakian | 3 | 0.2% |
| Danish | 13 | 1.0% |
| Dutch | 22 | 1.7% |
| English | 278 | 22.0% |
| European | 108 | 8.6% |
| French | 46 | 3.6% |
| German | 311 | 24.6% |
| Hungarian | 3 | 0.2% |
| Irish | 157 | 12.4% |
| Italian | 121 | 9.6% |
| Latvian | 3 | 0.2% |
| Lebanese | 13 | 1.0% |
| Norwegian | 58 | 4.6% |
| Polish | 19 | 1.5% |
| Russian | 2 | 0.2% |
| Scotch-Irish | 3 | 0.2% |
| Scottish | 30 | 2.4% |
| Swedish | 31 | 2.5% |
| Swiss | 14 | 1.1% |
| Ukrainian | 3 | 0.2% |
| Welsh | 18 | 1.4% | View All 30 Rows |
Immigrants in Lake Winnebago
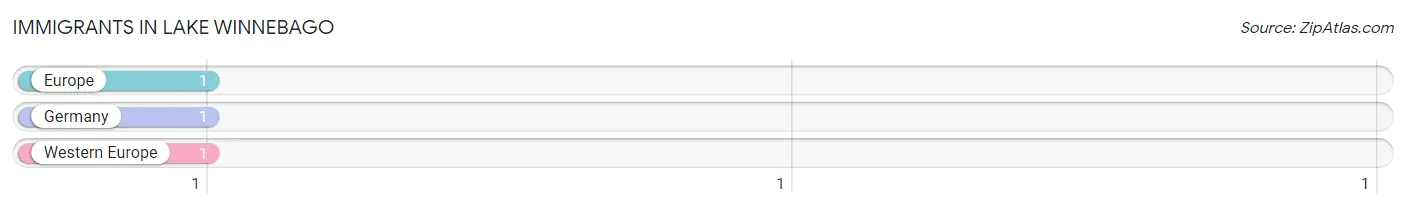
The most numerous immigrant groups reported in Lake Winnebago came from Europe (1 | 0.1%), Germany (1 | 0.1%), and Western Europe (1 | 0.1%), together accounting for 0.2% of all Lake Winnebago residents.
| Immigration Origin | # Population | % Population |
| Europe | 1 | 0.1% |
| Germany | 1 | 0.1% |
| Western Europe | 1 | 0.1% | View All 3 Rows |
Sex and Age in Lake Winnebago
Sex and Age in Lake Winnebago
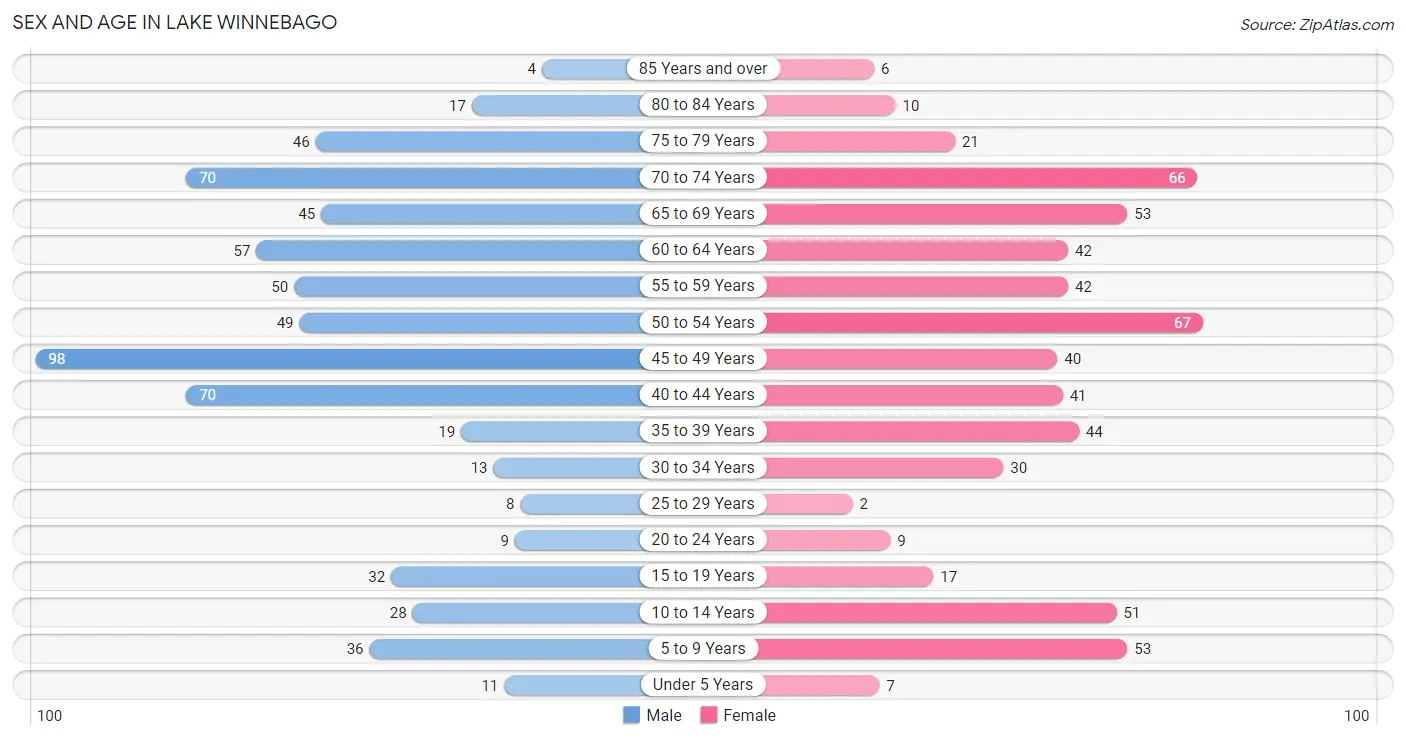
The most populous age groups in Lake Winnebago are 45 to 49 Years (98 | 14.8%) for men and 50 to 54 Years (67 | 11.2%) for women.
| Age Bracket | Male | Female |
| Under 5 Years | 11 (1.7%) | 7 (1.2%) |
| 5 to 9 Years | 36 (5.4%) | 53 (8.8%) |
| 10 to 14 Years | 28 (4.2%) | 51 (8.5%) |
| 15 to 19 Years | 32 (4.8%) | 17 (2.8%) |
| 20 to 24 Years | 9 (1.4%) | 9 (1.5%) |
| 25 to 29 Years | 8 (1.2%) | 2 (0.3%) |
| 30 to 34 Years | 13 (2.0%) | 30 (5.0%) |
| 35 to 39 Years | 19 (2.9%) | 44 (7.3%) |
| 40 to 44 Years | 70 (10.6%) | 41 (6.8%) |
| 45 to 49 Years | 98 (14.8%) | 40 (6.7%) |
| 50 to 54 Years | 49 (7.4%) | 67 (11.2%) |
| 55 to 59 Years | 50 (7.5%) | 42 (7.0%) |
| 60 to 64 Years | 57 (8.6%) | 42 (7.0%) |
| 65 to 69 Years | 45 (6.8%) | 53 (8.8%) |
| 70 to 74 Years | 70 (10.6%) | 66 (11.0%) |
| 75 to 79 Years | 46 (7.0%) | 21 (3.5%) |
| 80 to 84 Years | 17 (2.6%) | 10 (1.7%) |
| 85 Years and over | 4 (0.6%) | 6 (1.0%) |
| Total | 662 (100.0%) | 601 (100.0%) |
Families and Households in Lake Winnebago
Median Family Size in Lake Winnebago
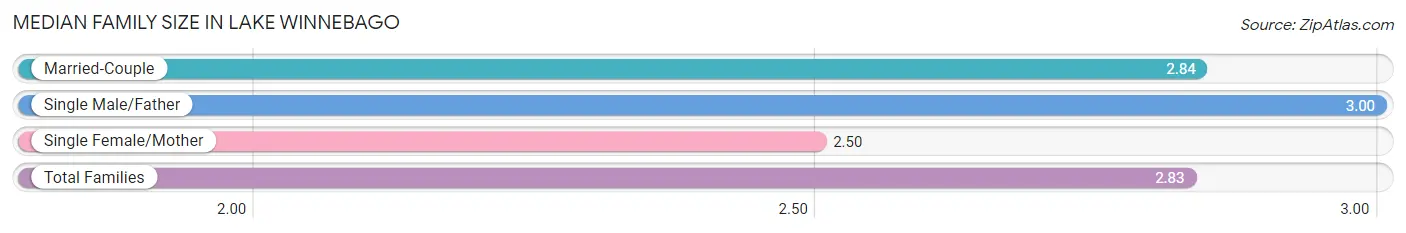
The median family size in Lake Winnebago is 2.83 persons per family, with single male/father families (2 | 0.5%) accounting for the largest median family size of 3 persons per family. On the other hand, single female/mother families (10 | 2.5%) represent the smallest median family size with 2.50 persons per family.
| Family Type | # Families | Family Size |
| Married-Couple | 387 (97.0%) | 2.84 |
| Single Male/Father | 2 (0.5%) | 3.00 |
| Single Female/Mother | 10 (2.5%) | 2.50 |
| Total Families | 399 (100.0%) | 2.83 |
Median Household Size in Lake Winnebago
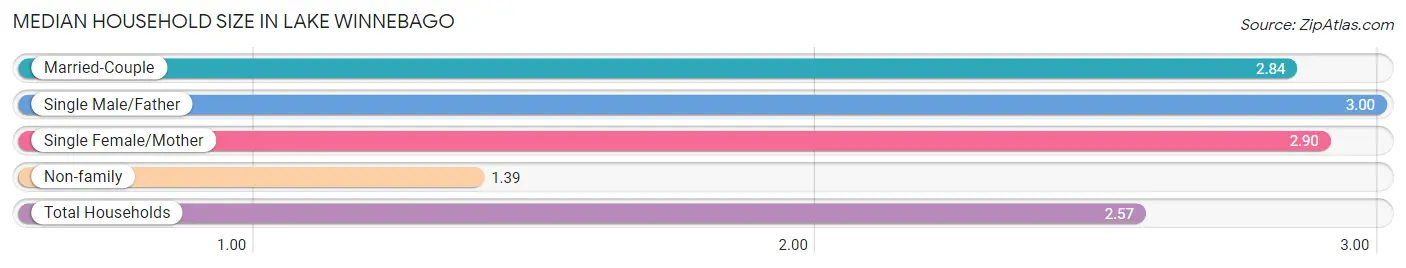
The median household size in Lake Winnebago is 2.57 persons per household, with single male/father households (2 | 0.4%) accounting for the largest median household size of 3 persons per household. non-family households (92 | 18.7%) represent the smallest median household size with 1.39 persons per household.
| Household Type | # Households | Household Size |
| Married-Couple | 387 (78.8%) | 2.84 |
| Single Male/Father | 2 (0.4%) | 3.00 |
| Single Female/Mother | 10 (2.0%) | 2.90 |
| Non-family | 92 (18.7%) | 1.39 |
| Total Households | 491 (100.0%) | 2.57 |
Household Size by Marriage Status in Lake Winnebago
Out of a total of 491 households in Lake Winnebago, 399 (81.3%) are family households, while 92 (18.7%) are nonfamily households. The most numerous type of family households are 2-person households, comprising 217, and the most common type of nonfamily households are 1-person households, comprising 66.
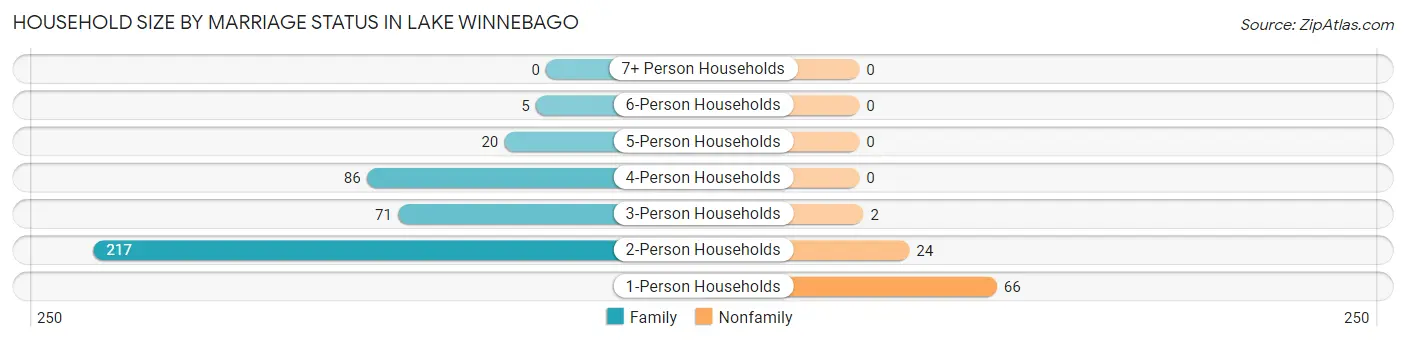
| Household Size | Family Households | Nonfamily Households |
| 1-Person Households | - | 66 (13.4%) |
| 2-Person Households | 217 (44.2%) | 24 (4.9%) |
| 3-Person Households | 71 (14.5%) | 2 (0.4%) |
| 4-Person Households | 86 (17.5%) | 0 (0.0%) |
| 5-Person Households | 20 (4.1%) | 0 (0.0%) |
| 6-Person Households | 5 (1.0%) | 0 (0.0%) |
| 7+ Person Households | 0 (0.0%) | 0 (0.0%) |
| Total | 399 (81.3%) | 92 (18.7%) |
Female Fertility in Lake Winnebago
Fertility by Age in Lake Winnebago
Average fertility rate in Lake Winnebago is 36.0 births per 1,000 women. Women in the age bracket of 20 to 34 years have the highest fertility rate with 171.0 births per 1,000 women. Women in the age bracket of 20 to 34 years acount for 100.0% of all women with births.
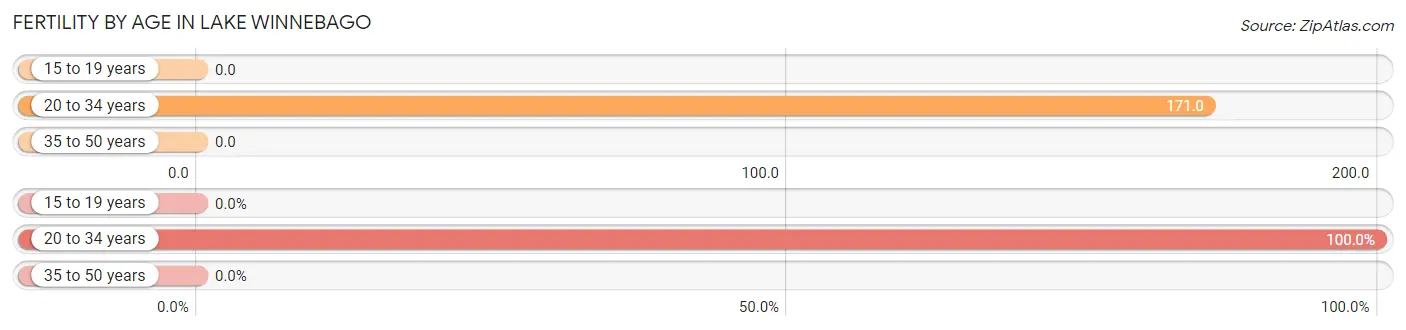
| Age Bracket | Women with Births | Births / 1,000 Women |
| 15 to 19 years | 0 (0.0%) | 0.0 |
| 20 to 34 years | 7 (100.0%) | 171.0 |
| 35 to 50 years | 0 (0.0%) | 0.0 |
| Total | 7 (100.0%) | 36.0 |
Fertility by Age by Marriage Status in Lake Winnebago
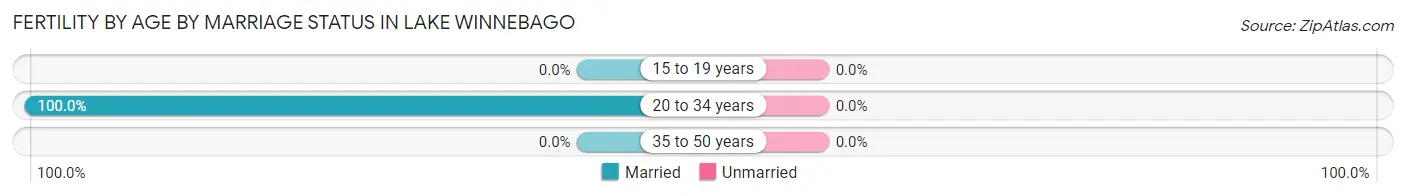
| Age Bracket | Married | Unmarried |
| 15 to 19 years | 0 (0.0%) | 0 (0.0%) |
| 20 to 34 years | 7 (100.0%) | 0 (0.0%) |
| 35 to 50 years | 0 (0.0%) | 0 (0.0%) |
| Total | 7 (100.0%) | 0 (0.0%) |
Fertility by Education in Lake Winnebago
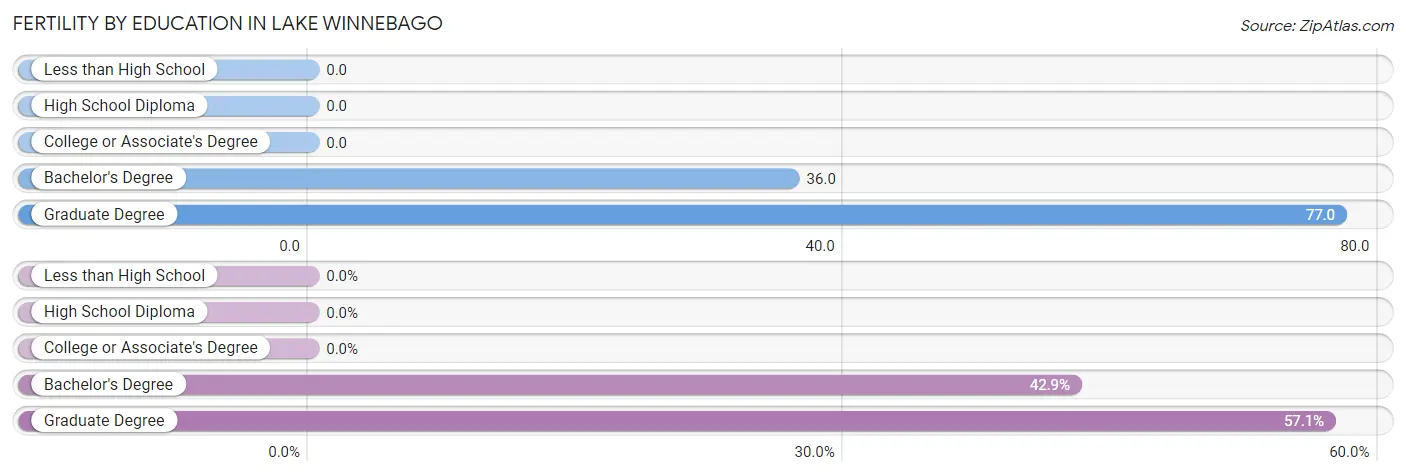
| Educational Attainment | Women with Births | Births / 1,000 Women |
| Less than High School | 0 (0.0%) | 0.0 |
| High School Diploma | 0 (0.0%) | 0.0 |
| College or Associate's Degree | 0 (0.0%) | 0.0 |
| Bachelor's Degree | 3 (42.9%) | 36.0 |
| Graduate Degree | 4 (57.1%) | 77.0 |
| Total | 7 (100.0%) | 36.0 |
Fertility by Education by Marriage Status in Lake Winnebago
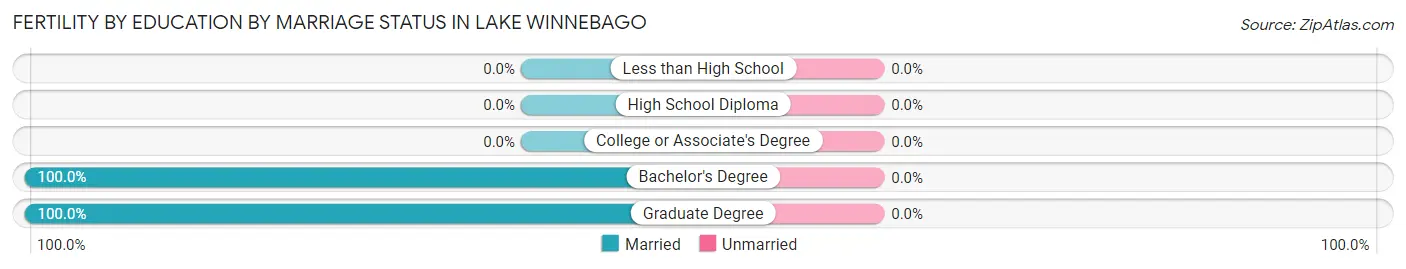
| Educational Attainment | Married | Unmarried |
| Less than High School | 0 (0.0%) | 0 (0.0%) |
| High School Diploma | 0 (0.0%) | 0 (0.0%) |
| College or Associate's Degree | 0 (0.0%) | 0 (0.0%) |
| Bachelor's Degree | 3 (100.0%) | 0 (0.0%) |
| Graduate Degree | 4 (100.0%) | 0 (0.0%) |
| Total | 7 (100.0%) | 0 (0.0%) |
Employment Characteristics in Lake Winnebago
Employment by Class of Employer in Lake Winnebago
Among the 603 employed individuals in Lake Winnebago, private company employees (337 | 55.9%), self-employed (not incorporated) (92 | 15.3%), and local government employees (74 | 12.3%) make up the most common classes of employment.
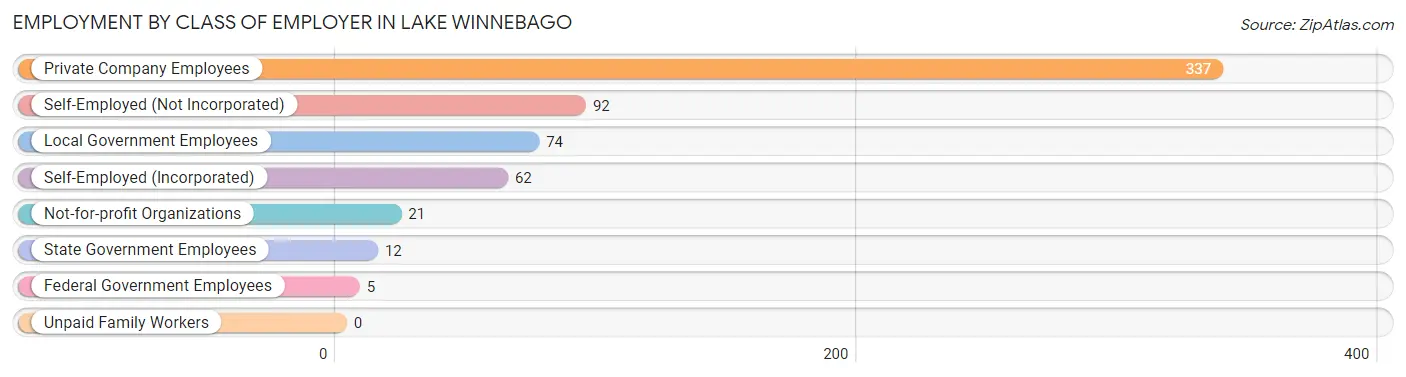
| Employer Class | # Employees | % Employees |
| Private Company Employees | 337 | 55.9% |
| Self-Employed (Incorporated) | 62 | 10.3% |
| Self-Employed (Not Incorporated) | 92 | 15.3% |
| Not-for-profit Organizations | 21 | 3.5% |
| Local Government Employees | 74 | 12.3% |
| State Government Employees | 12 | 2.0% |
| Federal Government Employees | 5 | 0.8% |
| Unpaid Family Workers | 0 | 0.0% |
| Total | 603 | 100.0% |
Employment Status by Age in Lake Winnebago
According to the labor force statistics for Lake Winnebago, out of the total population over 16 years of age (1,072), 57.4% or 615 individuals are in the labor force, with 1.3% or 8 of them unemployed. The age group with the highest labor force participation rate is 25 to 29 years, with 100.0% or 10 individuals in the labor force. Within the labor force, the 65 to 74 years age range has the highest percentage of unemployed individuals, with 4.7% or 2 of them being unemployed.
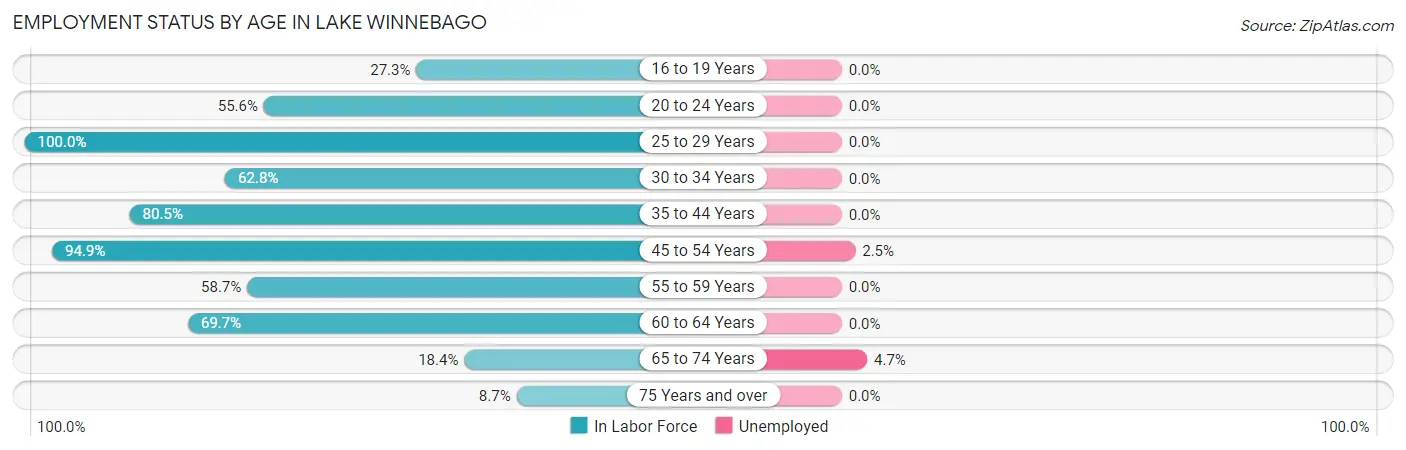
| Age Bracket | In Labor Force | Unemployed |
| 16 to 19 Years | 12 (27.3%) | 0 (0.0%) |
| 20 to 24 Years | 10 (55.6%) | 0 (0.0%) |
| 25 to 29 Years | 10 (100.0%) | 0 (0.0%) |
| 30 to 34 Years | 27 (62.8%) | 0 (0.0%) |
| 35 to 44 Years | 140 (80.5%) | 0 (0.0%) |
| 45 to 54 Years | 241 (94.9%) | 6 (2.5%) |
| 55 to 59 Years | 54 (58.7%) | 0 (0.0%) |
| 60 to 64 Years | 69 (69.7%) | 0 (0.0%) |
| 65 to 74 Years | 43 (18.4%) | 2 (4.7%) |
| 75 Years and over | 9 (8.7%) | 0 (0.0%) |
| Total | 615 (57.4%) | 8 (1.3%) |
Employment Status by Educational Attainment in Lake Winnebago
According to labor force statistics for Lake Winnebago, 80.5% of individuals (541) out of the total population between 25 and 64 years of age (672) are in the labor force, with 1.1% or 6 of them being unemployed. The group with the highest labor force participation rate are those with the educational attainment of less than high school, with 100.0% or 14 individuals in the labor force. Within the labor force, individuals with college / associate degree education have the highest percentage of unemployment, with 4.2% or 3 of them being unemployed.
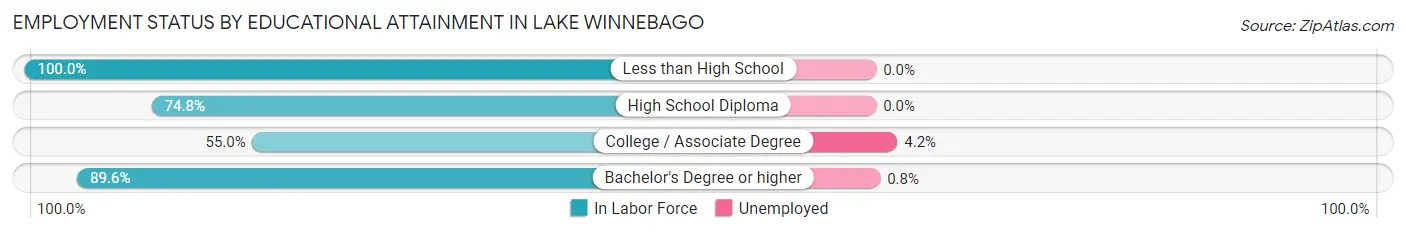
| Educational Attainment | In Labor Force | Unemployed |
| Less than High School | 14 (100.0%) | 0 (0.0%) |
| High School Diploma | 86 (74.8%) | 0 (0.0%) |
| College / Associate Degree | 72 (55.0%) | 6 (4.2%) |
| Bachelor's Degree or higher | 369 (89.6%) | 3 (0.8%) |
| Total | 541 (80.5%) | 7 (1.1%) |
Employment Occupations by Sex in Lake Winnebago
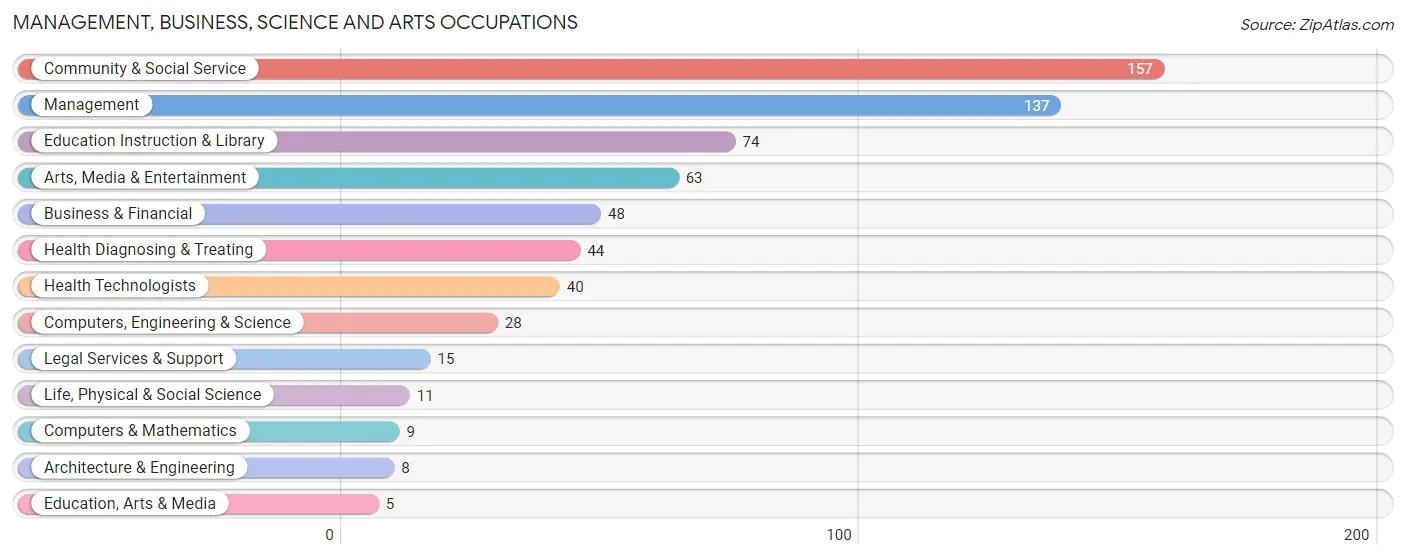
Management, Business, Science and Arts Occupations
The most common Management, Business, Science and Arts occupations in Lake Winnebago are Community & Social Service (157 | 25.9%), Management (137 | 22.6%), Education Instruction & Library (74 | 12.2%), Arts, Media & Entertainment (63 | 10.4%), and Business & Financial (48 | 7.9%).
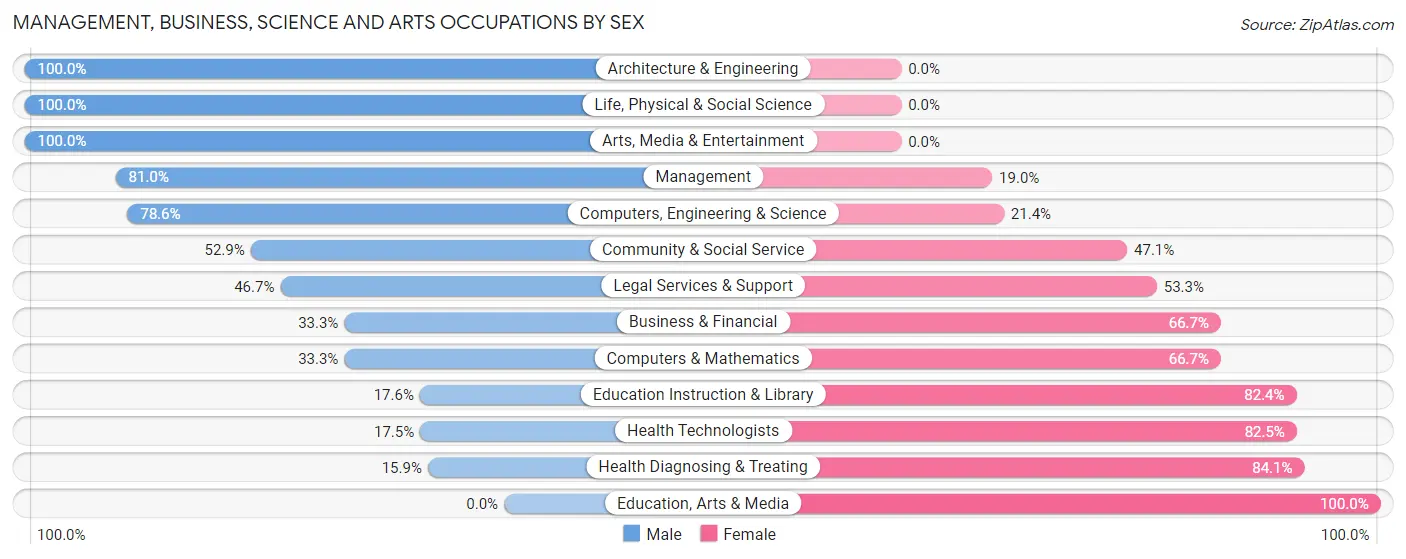
Management, Business, Science and Arts Occupations by Sex
Within the Management, Business, Science and Arts occupations in Lake Winnebago, the most male-oriented occupations are Architecture & Engineering (100.0%), Life, Physical & Social Science (100.0%), and Arts, Media & Entertainment (100.0%), while the most female-oriented occupations are Education, Arts & Media (100.0%), Health Diagnosing & Treating (84.1%), and Health Technologists (82.5%).
| Occupation | Male | Female |
| Management | 111 (81.0%) | 26 (19.0%) |
| Business & Financial | 16 (33.3%) | 32 (66.7%) |
| Computers, Engineering & Science | 22 (78.6%) | 6 (21.4%) |
| Computers & Mathematics | 3 (33.3%) | 6 (66.7%) |
| Architecture & Engineering | 8 (100.0%) | 0 (0.0%) |
| Life, Physical & Social Science | 11 (100.0%) | 0 (0.0%) |
| Community & Social Service | 83 (52.9%) | 74 (47.1%) |
| Education, Arts & Media | 0 (0.0%) | 5 (100.0%) |
| Legal Services & Support | 7 (46.7%) | 8 (53.3%) |
| Education Instruction & Library | 13 (17.6%) | 61 (82.4%) |
| Arts, Media & Entertainment | 63 (100.0%) | 0 (0.0%) |
| Health Diagnosing & Treating | 7 (15.9%) | 37 (84.1%) |
| Health Technologists | 7 (17.5%) | 33 (82.5%) |
| Total (Category) | 239 (57.7%) | 175 (42.3%) |
| Total (Overall) | 349 (57.5%) | 258 (42.5%) |
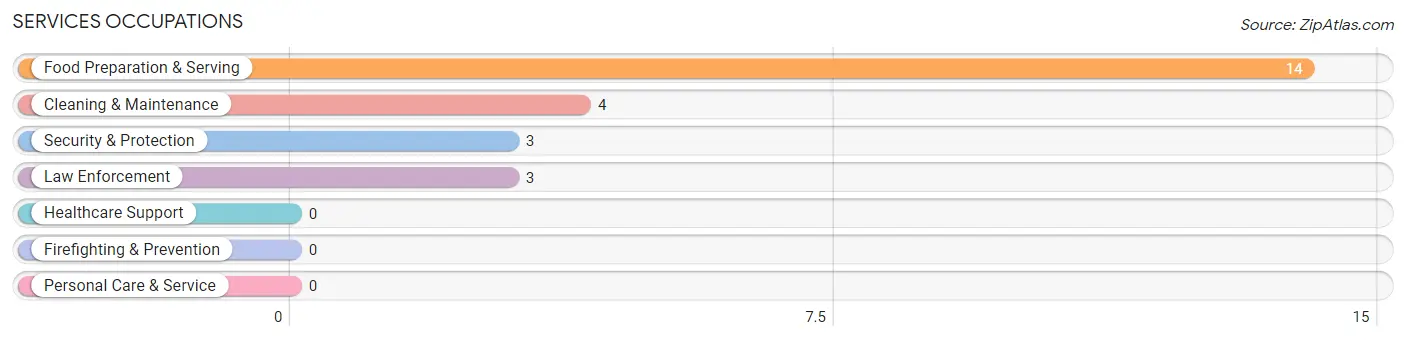
Services Occupations
The most common Services occupations in Lake Winnebago are Food Preparation & Serving (14 | 2.3%), Cleaning & Maintenance (4 | 0.7%), Security & Protection (3 | 0.5%), and Law Enforcement (3 | 0.5%).
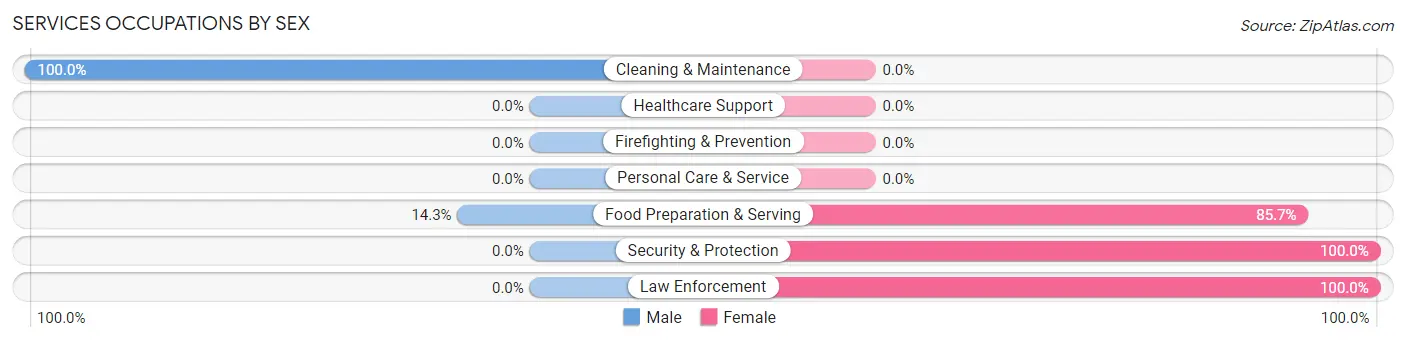
Services Occupations by Sex
Within the Services occupations in Lake Winnebago, the most male-oriented occupations are Cleaning & Maintenance (100.0%), and Food Preparation & Serving (14.3%), while the most female-oriented occupations are Security & Protection (100.0%), Law Enforcement (100.0%), and Food Preparation & Serving (85.7%).
| Occupation | Male | Female |
| Healthcare Support | 0 (0.0%) | 0 (0.0%) |
| Security & Protection | 0 (0.0%) | 3 (100.0%) |
| Firefighting & Prevention | 0 (0.0%) | 0 (0.0%) |
| Law Enforcement | 0 (0.0%) | 3 (100.0%) |
| Food Preparation & Serving | 2 (14.3%) | 12 (85.7%) |
| Cleaning & Maintenance | 4 (100.0%) | 0 (0.0%) |
| Personal Care & Service | 0 (0.0%) | 0 (0.0%) |
| Total (Category) | 6 (28.6%) | 15 (71.4%) |
| Total (Overall) | 349 (57.5%) | 258 (42.5%) |
Sales and Office Occupations
The most common Sales and Office occupations in Lake Winnebago are Sales & Related (93 | 15.3%), and Office & Administration (26 | 4.3%).
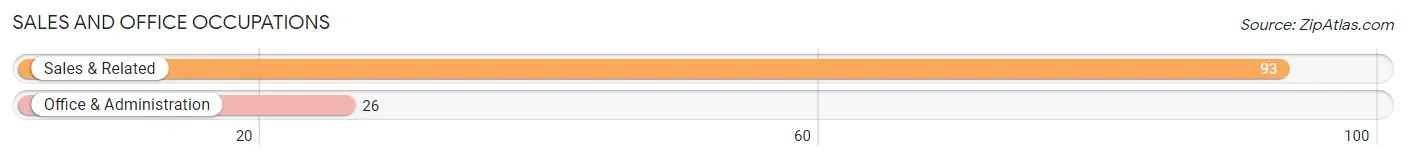
Sales and Office Occupations by Sex
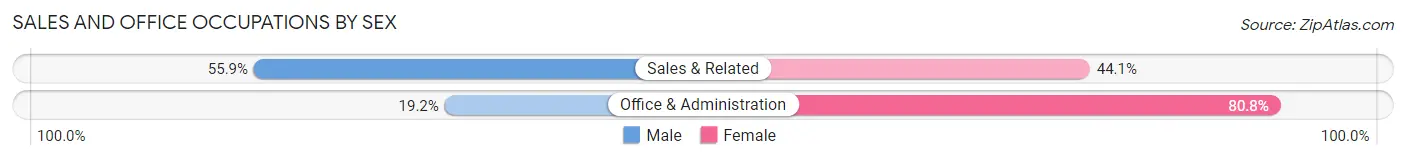
| Occupation | Male | Female |
| Sales & Related | 52 (55.9%) | 41 (44.1%) |
| Office & Administration | 5 (19.2%) | 21 (80.8%) |
| Total (Category) | 57 (47.9%) | 62 (52.1%) |
| Total (Overall) | 349 (57.5%) | 258 (42.5%) |
Natural Resources, Construction and Maintenance Occupations
The most common Natural Resources, Construction and Maintenance occupations in Lake Winnebago are Construction & Extraction (15 | 2.5%), and Installation, Maintenance & Repair (7 | 1.1%).
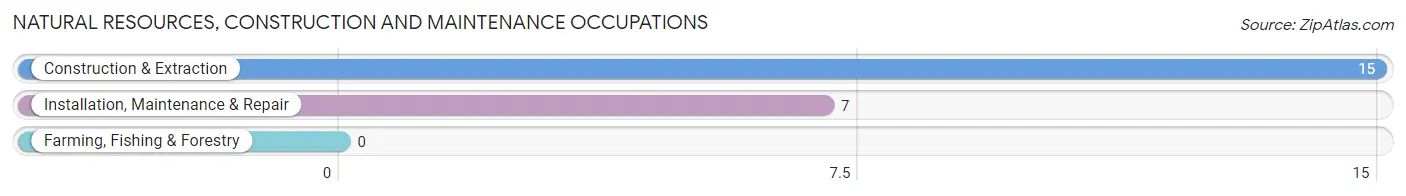
Natural Resources, Construction and Maintenance Occupations by Sex
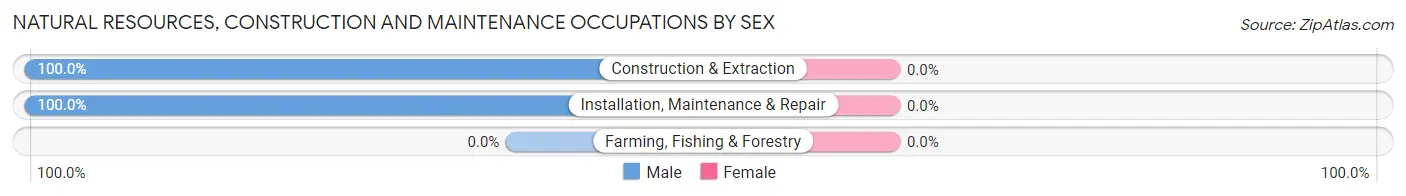
| Occupation | Male | Female |
| Farming, Fishing & Forestry | 0 (0.0%) | 0 (0.0%) |
| Construction & Extraction | 15 (100.0%) | 0 (0.0%) |
| Installation, Maintenance & Repair | 7 (100.0%) | 0 (0.0%) |
| Total (Category) | 22 (100.0%) | 0 (0.0%) |
| Total (Overall) | 349 (57.5%) | 258 (42.5%) |
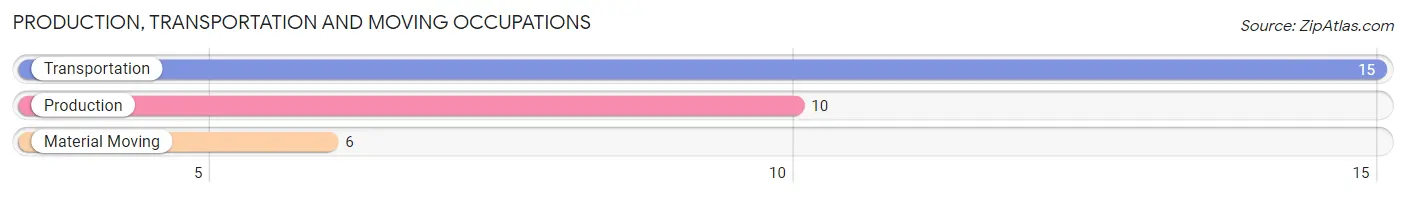
Production, Transportation and Moving Occupations
The most common Production, Transportation and Moving occupations in Lake Winnebago are Transportation (15 | 2.5%), Production (10 | 1.7%), and Material Moving (6 | 1.0%).
Production, Transportation and Moving Occupations by Sex
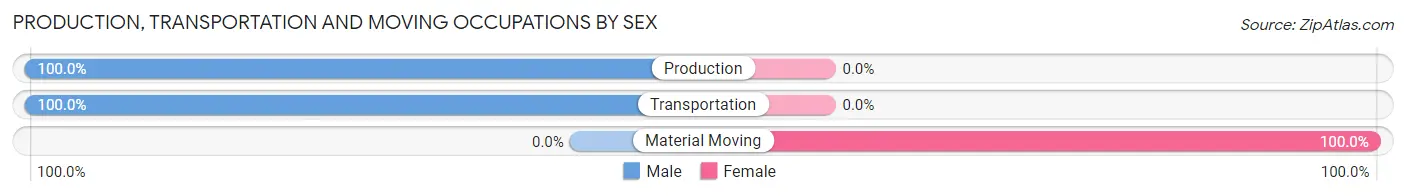
| Occupation | Male | Female |
| Production | 10 (100.0%) | 0 (0.0%) |
| Transportation | 15 (100.0%) | 0 (0.0%) |
| Material Moving | 0 (0.0%) | 6 (100.0%) |
| Total (Category) | 25 (80.6%) | 6 (19.4%) |
| Total (Overall) | 349 (57.5%) | 258 (42.5%) |
Employment Industries by Sex in Lake Winnebago
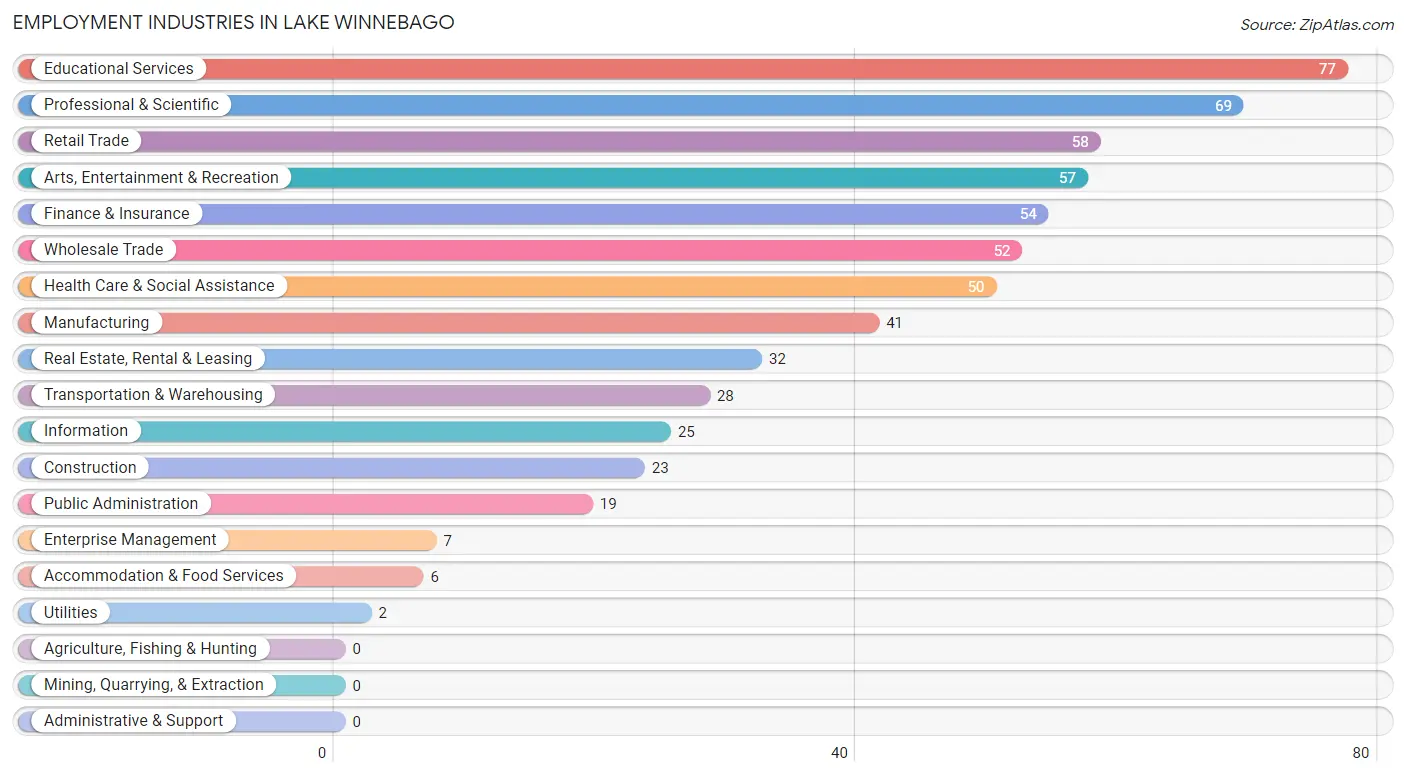
Employment Industries in Lake Winnebago
The major employment industries in Lake Winnebago include Educational Services (77 | 12.7%), Professional & Scientific (69 | 11.4%), Retail Trade (58 | 9.6%), Arts, Entertainment & Recreation (57 | 9.4%), and Finance & Insurance (54 | 8.9%).
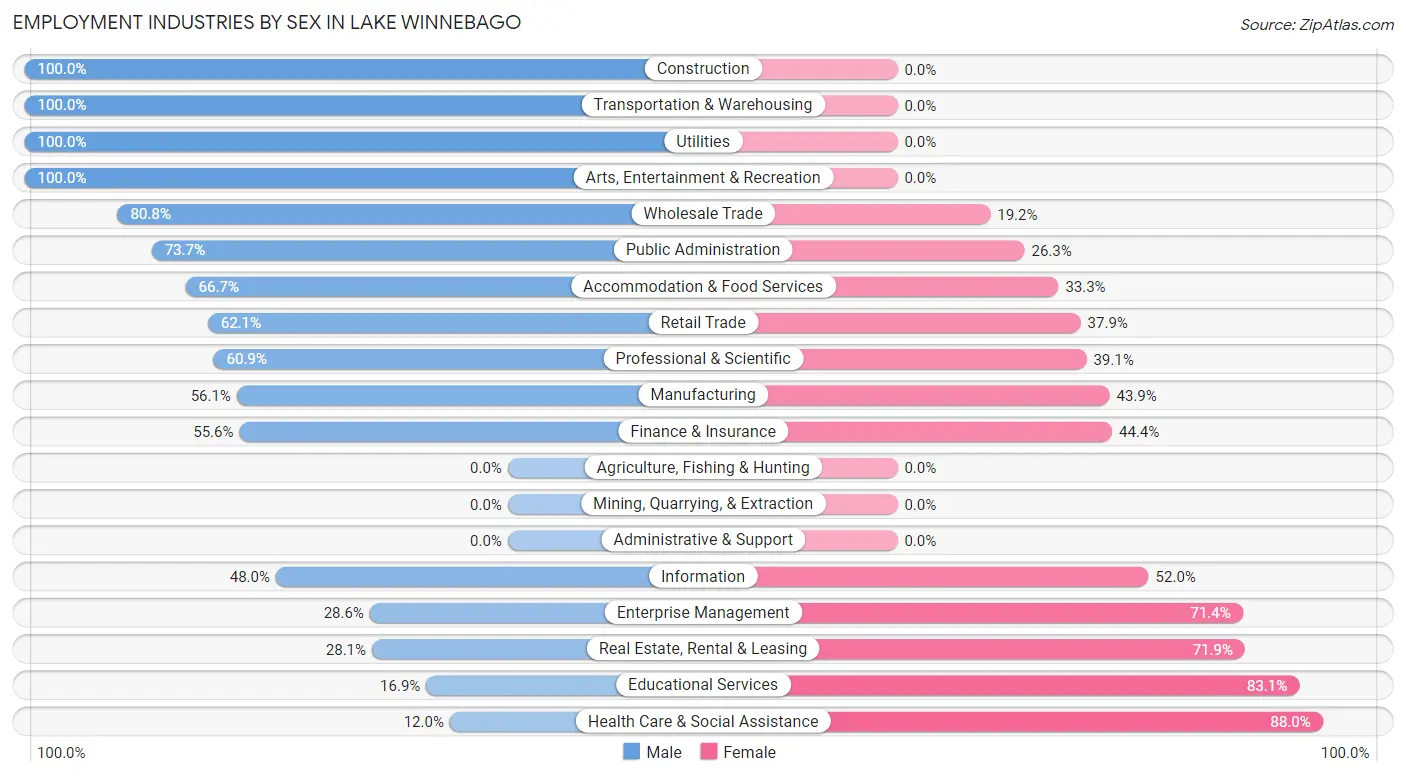
Employment Industries by Sex in Lake Winnebago
The Lake Winnebago industries that see more men than women are Construction (100.0%), Transportation & Warehousing (100.0%), and Utilities (100.0%), whereas the industries that tend to have a higher number of women are Health Care & Social Assistance (88.0%), Educational Services (83.1%), and Real Estate, Rental & Leasing (71.9%).
| Industry | Male | Female |
| Agriculture, Fishing & Hunting | 0 (0.0%) | 0 (0.0%) |
| Mining, Quarrying, & Extraction | 0 (0.0%) | 0 (0.0%) |
| Construction | 23 (100.0%) | 0 (0.0%) |
| Manufacturing | 23 (56.1%) | 18 (43.9%) |
| Wholesale Trade | 42 (80.8%) | 10 (19.2%) |
| Retail Trade | 36 (62.1%) | 22 (37.9%) |
| Transportation & Warehousing | 28 (100.0%) | 0 (0.0%) |
| Utilities | 2 (100.0%) | 0 (0.0%) |
| Information | 12 (48.0%) | 13 (52.0%) |
| Finance & Insurance | 30 (55.6%) | 24 (44.4%) |
| Real Estate, Rental & Leasing | 9 (28.1%) | 23 (71.9%) |
| Professional & Scientific | 42 (60.9%) | 27 (39.1%) |
| Enterprise Management | 2 (28.6%) | 5 (71.4%) |
| Administrative & Support | 0 (0.0%) | 0 (0.0%) |
| Educational Services | 13 (16.9%) | 64 (83.1%) |
| Health Care & Social Assistance | 6 (12.0%) | 44 (88.0%) |
| Arts, Entertainment & Recreation | 57 (100.0%) | 0 (0.0%) |
| Accommodation & Food Services | 4 (66.7%) | 2 (33.3%) |
| Public Administration | 14 (73.7%) | 5 (26.3%) |
| Total | 349 (57.5%) | 258 (42.5%) |
Education in Lake Winnebago
School Enrollment in Lake Winnebago
The most common levels of schooling among the 299 students in Lake Winnebago are elementary school (67 | 22.4%), middle school (63 | 21.1%), and high school (59 | 19.7%).
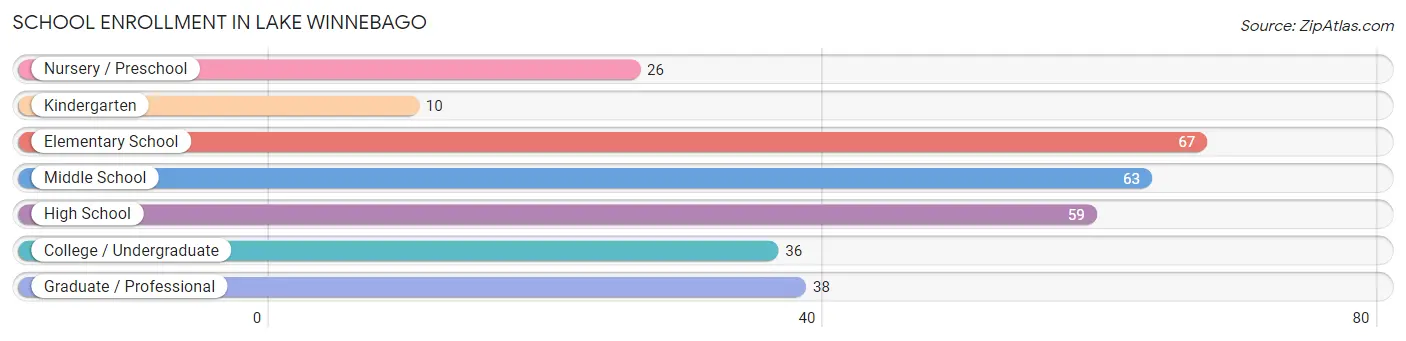
| School Level | # Students | % Students |
| Nursery / Preschool | 26 | 8.7% |
| Kindergarten | 10 | 3.3% |
| Elementary School | 67 | 22.4% |
| Middle School | 63 | 21.1% |
| High School | 59 | 19.7% |
| College / Undergraduate | 36 | 12.0% |
| Graduate / Professional | 38 | 12.7% |
| Total | 299 | 100.0% |
School Enrollment by Age by Funding Source in Lake Winnebago
Out of a total of 299 students who are enrolled in schools in Lake Winnebago, 64 (21.4%) attend a private institution, while the remaining 235 (78.6%) are enrolled in public schools. The age group of 3 to 4 year olds has the highest likelihood of being enrolled in private schools, with 6 (75.0% in the age bracket) enrolled. Conversely, the age group of 20 to 24 year olds has the lowest likelihood of being enrolled in a private school, with 12 (100.0% in the age bracket) attending a public institution.
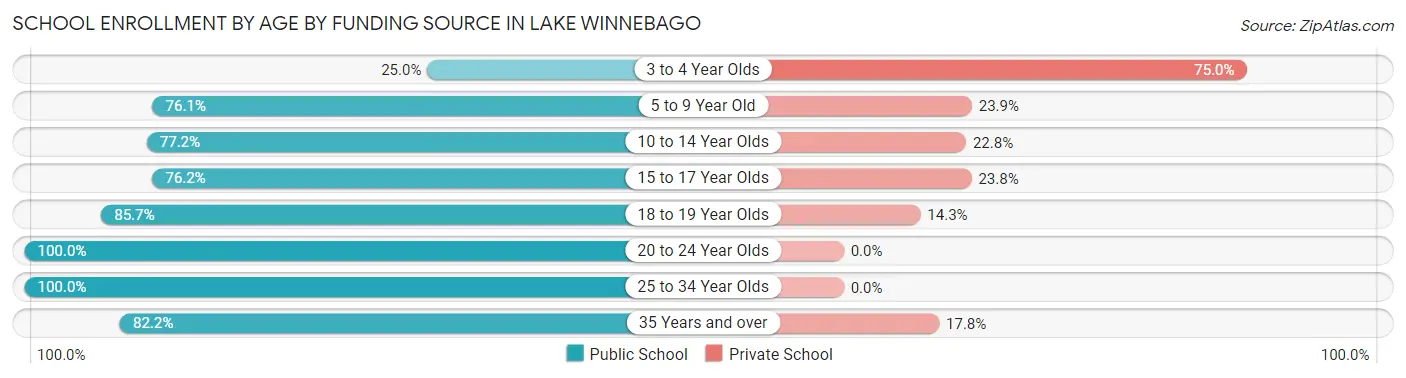
| Age Bracket | Public School | Private School |
| 3 to 4 Year Olds | 2 (25.0%) | 6 (75.0%) |
| 5 to 9 Year Old | 67 (76.1%) | 21 (23.9%) |
| 10 to 14 Year Olds | 61 (77.2%) | 18 (22.8%) |
| 15 to 17 Year Olds | 32 (76.2%) | 10 (23.8%) |
| 18 to 19 Year Olds | 6 (85.7%) | 1 (14.3%) |
| 20 to 24 Year Olds | 12 (100.0%) | 0 (0.0%) |
| 25 to 34 Year Olds | 18 (100.0%) | 0 (0.0%) |
| 35 Years and over | 37 (82.2%) | 8 (17.8%) |
| Total | 235 (78.6%) | 64 (21.4%) |
Educational Attainment by Field of Study in Lake Winnebago
Business (184 | 30.5%), education (98 | 16.2%), arts & humanities (50 | 8.3%), bio, nature & agricultural (48 | 8.0%), and engineering (42 | 7.0%) are the most common fields of study among 604 individuals in Lake Winnebago who have obtained a bachelor's degree or higher.
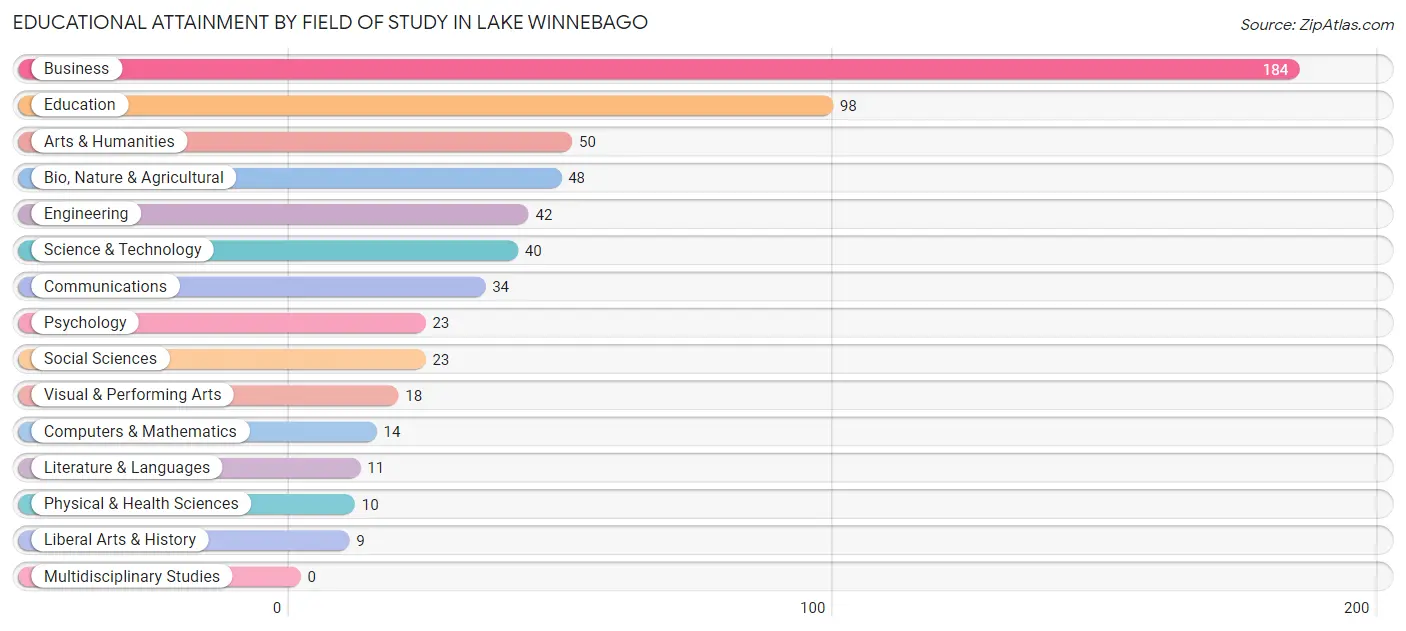
| Field of Study | # Graduates | % Graduates |
| Computers & Mathematics | 14 | 2.3% |
| Bio, Nature & Agricultural | 48 | 8.0% |
| Physical & Health Sciences | 10 | 1.7% |
| Psychology | 23 | 3.8% |
| Social Sciences | 23 | 3.8% |
| Engineering | 42 | 7.0% |
| Multidisciplinary Studies | 0 | 0.0% |
| Science & Technology | 40 | 6.6% |
| Business | 184 | 30.5% |
| Education | 98 | 16.2% |
| Literature & Languages | 11 | 1.8% |
| Liberal Arts & History | 9 | 1.5% |
| Visual & Performing Arts | 18 | 3.0% |
| Communications | 34 | 5.6% |
| Arts & Humanities | 50 | 8.3% |
| Total | 604 | 100.0% |
Transportation & Commute in Lake Winnebago
Vehicle Availability by Sex in Lake Winnebago
The most prevalent vehicle ownership categories in Lake Winnebago are males with 2 vehicles (158, accounting for 45.3%) and females with 2 vehicles (107, making up 62.2%).
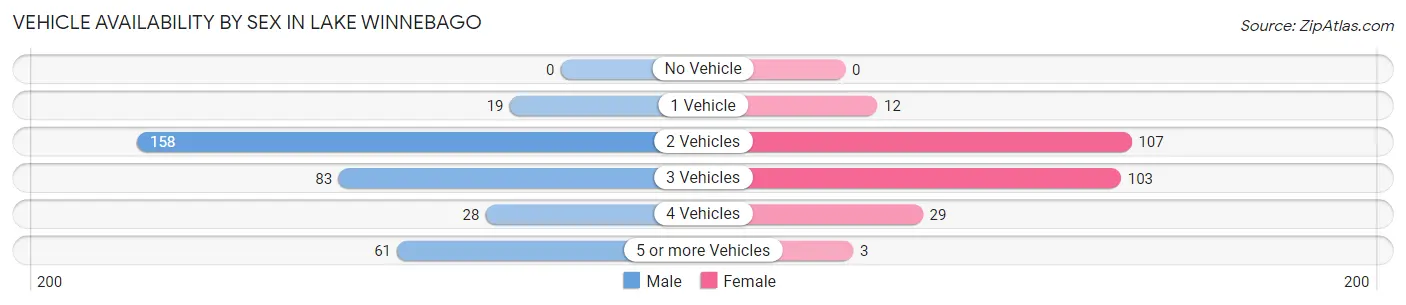
| Vehicles Available | Male | Female |
| No Vehicle | 0 (0.0%) | 0 (0.0%) |
| 1 Vehicle | 19 (5.4%) | 12 (4.7%) |
| 2 Vehicles | 158 (45.3%) | 107 (42.1%) |
| 3 Vehicles | 83 (23.8%) | 103 (40.6%) |
| 4 Vehicles | 28 (8.0%) | 29 (11.4%) |
| 5 or more Vehicles | 61 (17.5%) | 3 (1.2%) |
| Total | 349 (100.0%) | 254 (100.0%) |
Commute Time in Lake Winnebago
The most frequently occuring commute durations in Lake Winnebago are 20 to 24 minutes (103 commuters, 19.4%), 30 to 34 minutes (101 commuters, 19.0%), and 5 to 9 minutes (70 commuters, 13.2%).
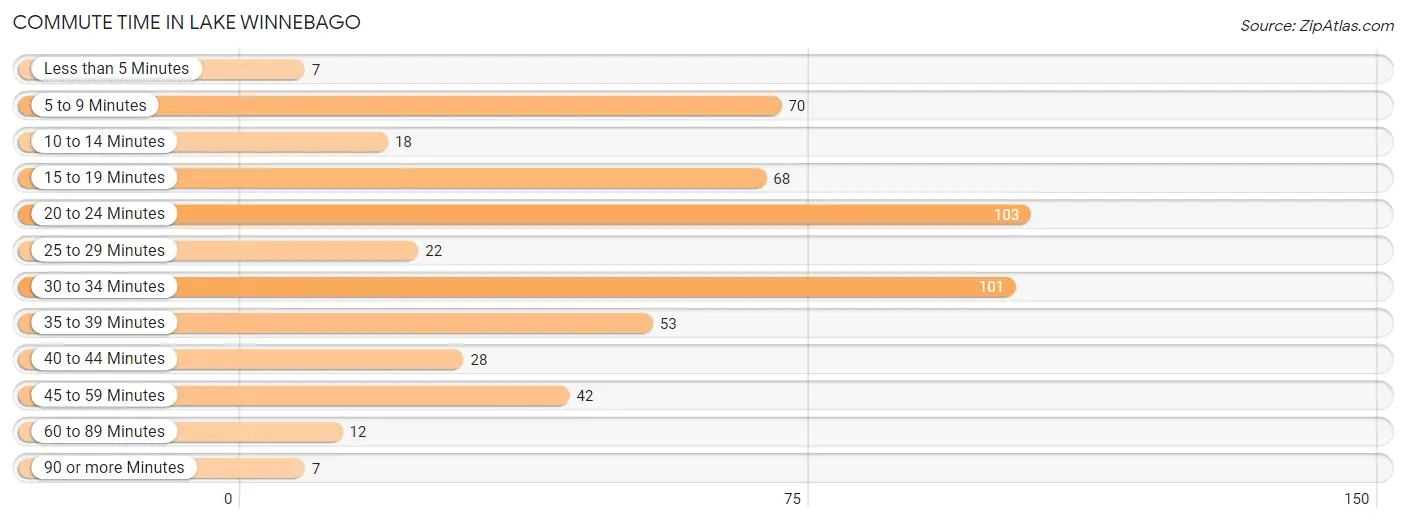
| Commute Time | # Commuters | % Commuters |
| Less than 5 Minutes | 7 | 1.3% |
| 5 to 9 Minutes | 70 | 13.2% |
| 10 to 14 Minutes | 18 | 3.4% |
| 15 to 19 Minutes | 68 | 12.8% |
| 20 to 24 Minutes | 103 | 19.4% |
| 25 to 29 Minutes | 22 | 4.1% |
| 30 to 34 Minutes | 101 | 19.0% |
| 35 to 39 Minutes | 53 | 10.0% |
| 40 to 44 Minutes | 28 | 5.3% |
| 45 to 59 Minutes | 42 | 7.9% |
| 60 to 89 Minutes | 12 | 2.3% |
| 90 or more Minutes | 7 | 1.3% |
Commute Time by Sex in Lake Winnebago
The most common commute times in Lake Winnebago are 5 to 9 minutes (68 commuters, 21.3%) for males and 20 to 24 minutes (57 commuters, 26.9%) for females.
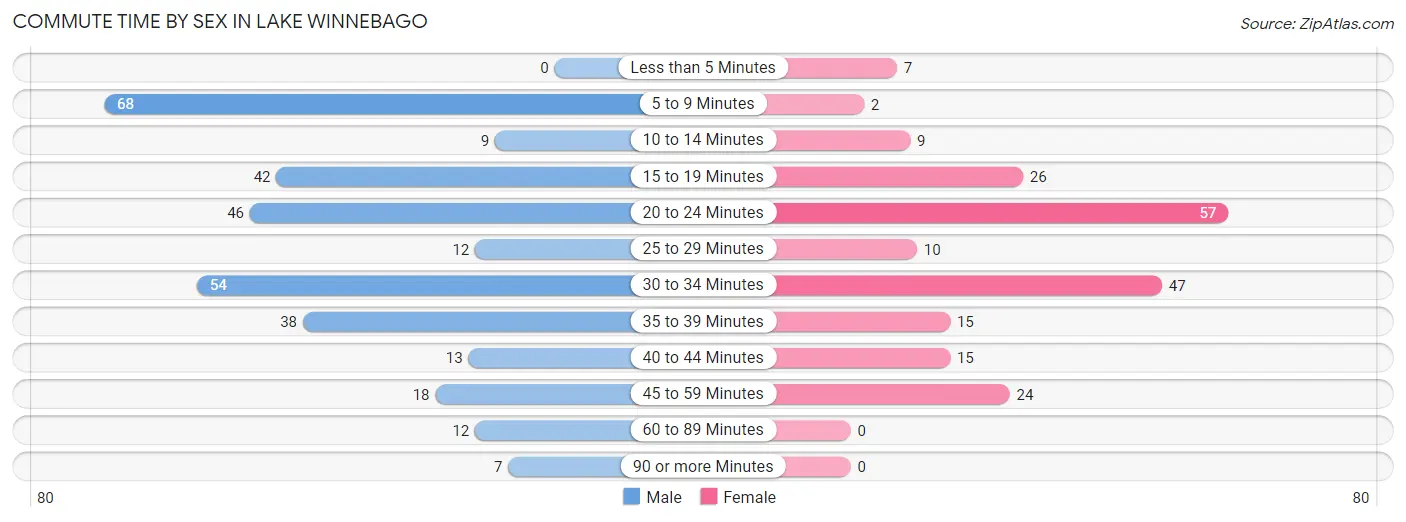
| Commute Time | Male | Female |
| Less than 5 Minutes | 0 (0.0%) | 7 (3.3%) |
| 5 to 9 Minutes | 68 (21.3%) | 2 (0.9%) |
| 10 to 14 Minutes | 9 (2.8%) | 9 (4.3%) |
| 15 to 19 Minutes | 42 (13.2%) | 26 (12.3%) |
| 20 to 24 Minutes | 46 (14.4%) | 57 (26.9%) |
| 25 to 29 Minutes | 12 (3.8%) | 10 (4.7%) |
| 30 to 34 Minutes | 54 (16.9%) | 47 (22.2%) |
| 35 to 39 Minutes | 38 (11.9%) | 15 (7.1%) |
| 40 to 44 Minutes | 13 (4.1%) | 15 (7.1%) |
| 45 to 59 Minutes | 18 (5.6%) | 24 (11.3%) |
| 60 to 89 Minutes | 12 (3.8%) | 0 (0.0%) |
| 90 or more Minutes | 7 (2.2%) | 0 (0.0%) |
Time of Departure to Work by Sex in Lake Winnebago
The most frequent times of departure to work in Lake Winnebago are 8:00 AM to 8:29 AM (95, 29.8%) for males and 7:00 AM to 7:29 AM (61, 28.8%) for females.
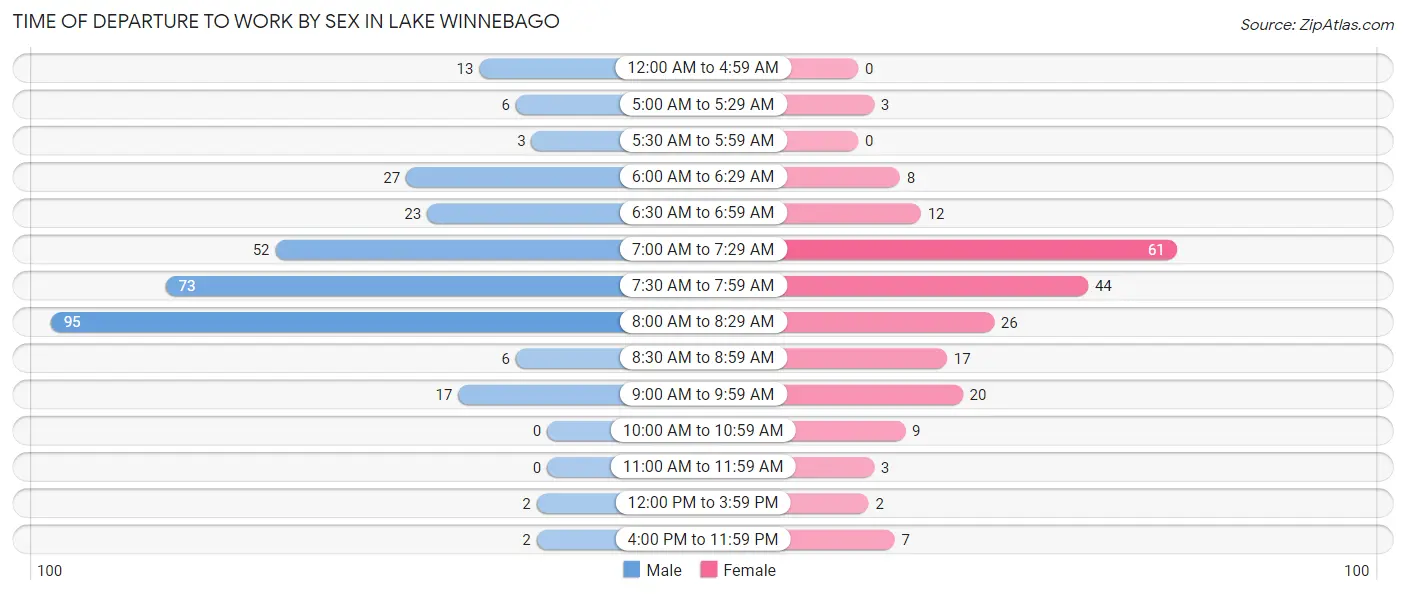
| Time of Departure | Male | Female |
| 12:00 AM to 4:59 AM | 13 (4.1%) | 0 (0.0%) |
| 5:00 AM to 5:29 AM | 6 (1.9%) | 3 (1.4%) |
| 5:30 AM to 5:59 AM | 3 (0.9%) | 0 (0.0%) |
| 6:00 AM to 6:29 AM | 27 (8.5%) | 8 (3.8%) |
| 6:30 AM to 6:59 AM | 23 (7.2%) | 12 (5.7%) |
| 7:00 AM to 7:29 AM | 52 (16.3%) | 61 (28.8%) |
| 7:30 AM to 7:59 AM | 73 (22.9%) | 44 (20.7%) |
| 8:00 AM to 8:29 AM | 95 (29.8%) | 26 (12.3%) |
| 8:30 AM to 8:59 AM | 6 (1.9%) | 17 (8.0%) |
| 9:00 AM to 9:59 AM | 17 (5.3%) | 20 (9.4%) |
| 10:00 AM to 10:59 AM | 0 (0.0%) | 9 (4.3%) |
| 11:00 AM to 11:59 AM | 0 (0.0%) | 3 (1.4%) |
| 12:00 PM to 3:59 PM | 2 (0.6%) | 2 (0.9%) |
| 4:00 PM to 11:59 PM | 2 (0.6%) | 7 (3.3%) |
| Total | 319 (100.0%) | 212 (100.0%) |
Housing Occupancy in Lake Winnebago
Occupancy by Ownership in Lake Winnebago
Of the total 491 dwellings in Lake Winnebago, owner-occupied units account for 476 (97.0%), while renter-occupied units make up 15 (3.0%).
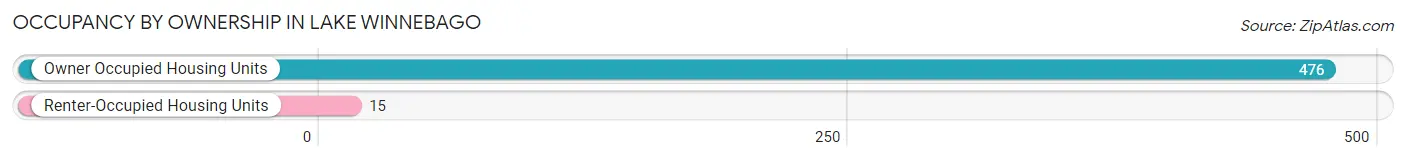
| Occupancy | # Housing Units | % Housing Units |
| Owner Occupied Housing Units | 476 | 97.0% |
| Renter-Occupied Housing Units | 15 | 3.0% |
| Total Occupied Housing Units | 491 | 100.0% |
Occupancy by Household Size in Lake Winnebago
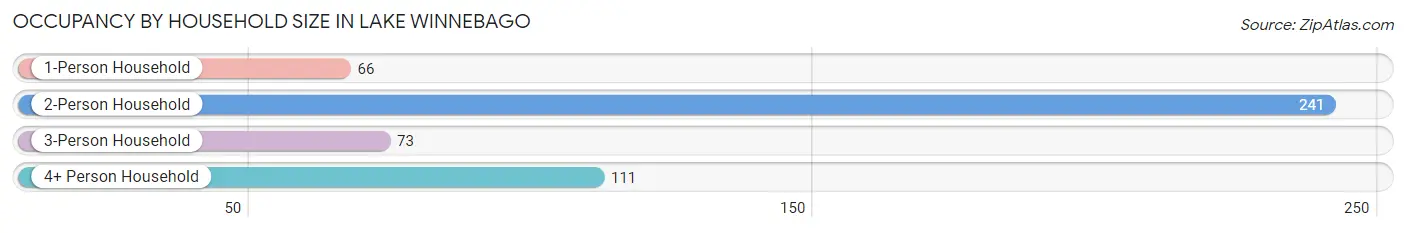
| Household Size | # Housing Units | % Housing Units |
| 1-Person Household | 66 | 13.4% |
| 2-Person Household | 241 | 49.1% |
| 3-Person Household | 73 | 14.9% |
| 4+ Person Household | 111 | 22.6% |
| Total Housing Units | 491 | 100.0% |
Occupancy by Ownership by Household Size in Lake Winnebago
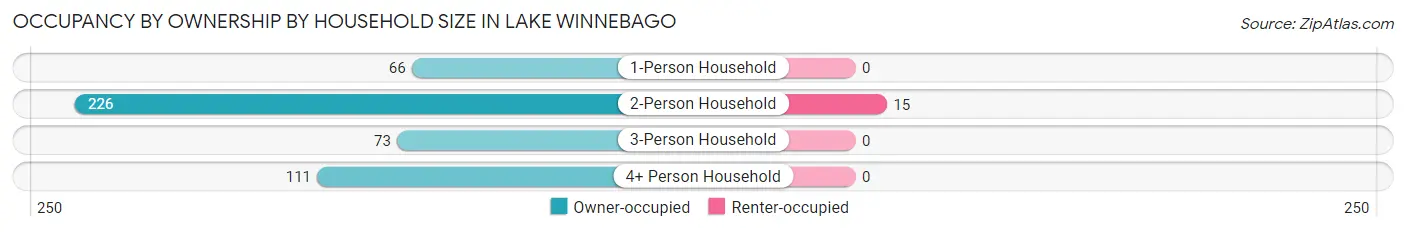
| Household Size | Owner-occupied | Renter-occupied |
| 1-Person Household | 66 (100.0%) | 0 (0.0%) |
| 2-Person Household | 226 (93.8%) | 15 (6.2%) |
| 3-Person Household | 73 (100.0%) | 0 (0.0%) |
| 4+ Person Household | 111 (100.0%) | 0 (0.0%) |
| Total Housing Units | 476 (97.0%) | 15 (3.0%) |
Occupancy by Educational Attainment in Lake Winnebago
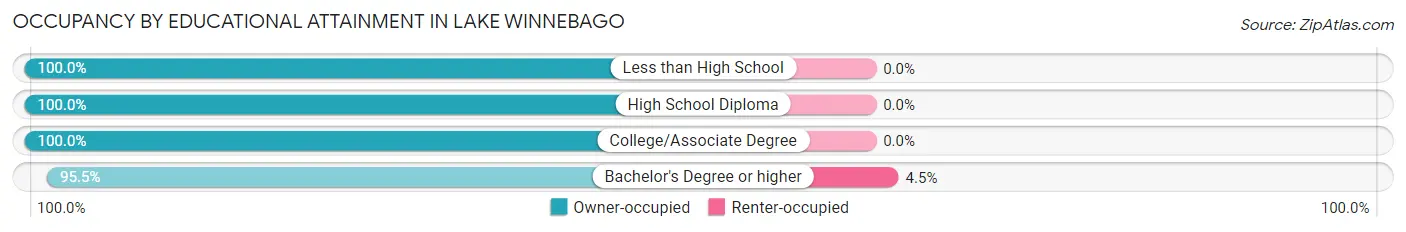
| Household Size | Owner-occupied | Renter-occupied |
| Less than High School | 11 (100.0%) | 0 (0.0%) |
| High School Diploma | 60 (100.0%) | 0 (0.0%) |
| College/Associate Degree | 84 (100.0%) | 0 (0.0%) |
| Bachelor's Degree or higher | 321 (95.5%) | 15 (4.5%) |
Occupancy by Age of Householder in Lake Winnebago
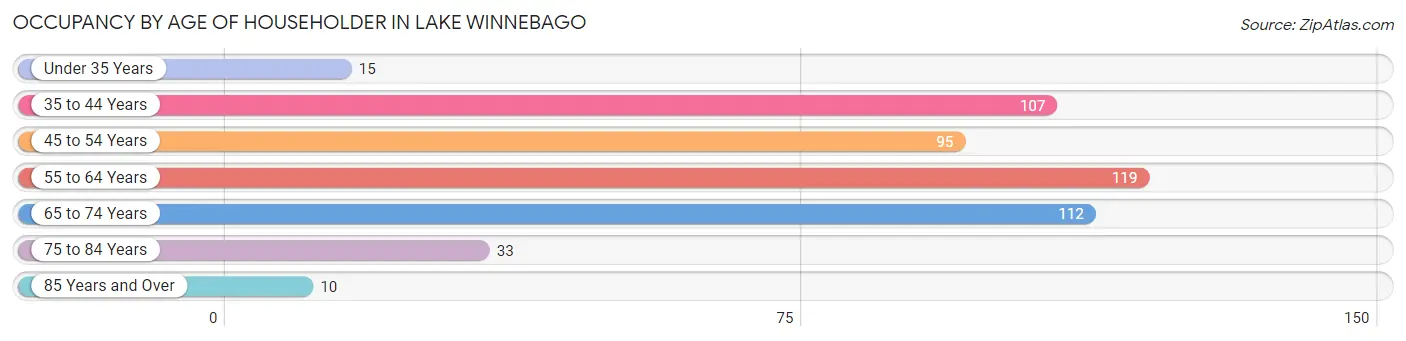
| Age Bracket | # Households | % Households |
| Under 35 Years | 15 | 3.0% |
| 35 to 44 Years | 107 | 21.8% |
| 45 to 54 Years | 95 | 19.4% |
| 55 to 64 Years | 119 | 24.2% |
| 65 to 74 Years | 112 | 22.8% |
| 75 to 84 Years | 33 | 6.7% |
| 85 Years and Over | 10 | 2.0% |
| Total | 491 | 100.0% |
Housing Finances in Lake Winnebago
Median Income by Occupancy in Lake Winnebago
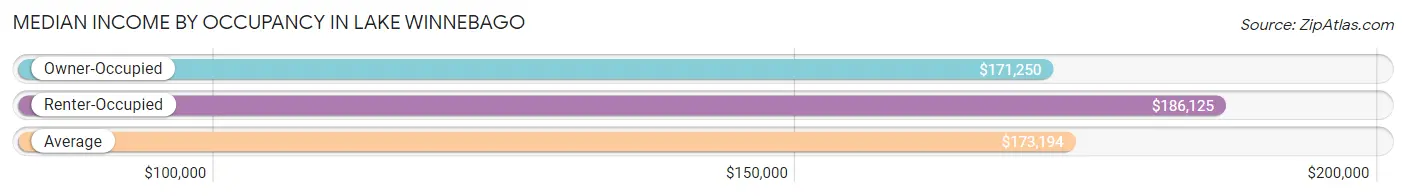
| Occupancy Type | # Households | Median Income |
| Owner-Occupied | 476 (97.0%) | $171,250 |
| Renter-Occupied | 15 (3.0%) | $186,125 |
| Average | 491 (100.0%) | $173,194 |
Occupancy by Householder Income Bracket in Lake Winnebago
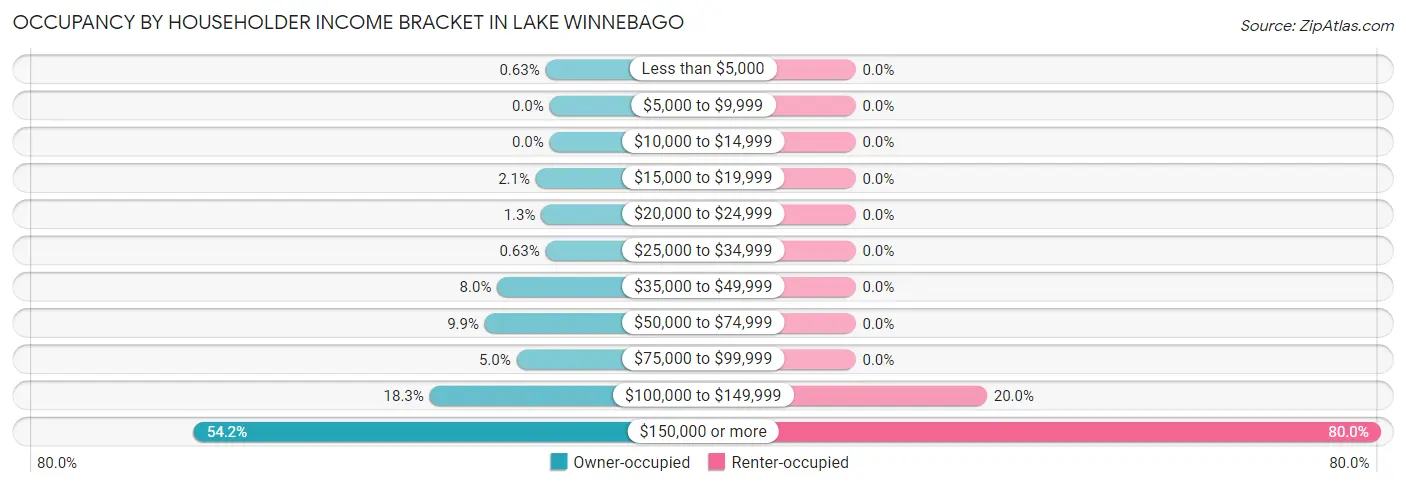
| Income Bracket | Owner-occupied | Renter-occupied |
| Less than $5,000 | 3 (0.6%) | 0 (0.0%) |
| $5,000 to $9,999 | 0 (0.0%) | 0 (0.0%) |
| $10,000 to $14,999 | 0 (0.0%) | 0 (0.0%) |
| $15,000 to $19,999 | 10 (2.1%) | 0 (0.0%) |
| $20,000 to $24,999 | 6 (1.3%) | 0 (0.0%) |
| $25,000 to $34,999 | 3 (0.6%) | 0 (0.0%) |
| $35,000 to $49,999 | 38 (8.0%) | 0 (0.0%) |
| $50,000 to $74,999 | 47 (9.9%) | 0 (0.0%) |
| $75,000 to $99,999 | 24 (5.0%) | 0 (0.0%) |
| $100,000 to $149,999 | 87 (18.3%) | 3 (20.0%) |
| $150,000 or more | 258 (54.2%) | 12 (80.0%) |
| Total | 476 (100.0%) | 15 (100.0%) |
Monthly Housing Cost Tiers in Lake Winnebago
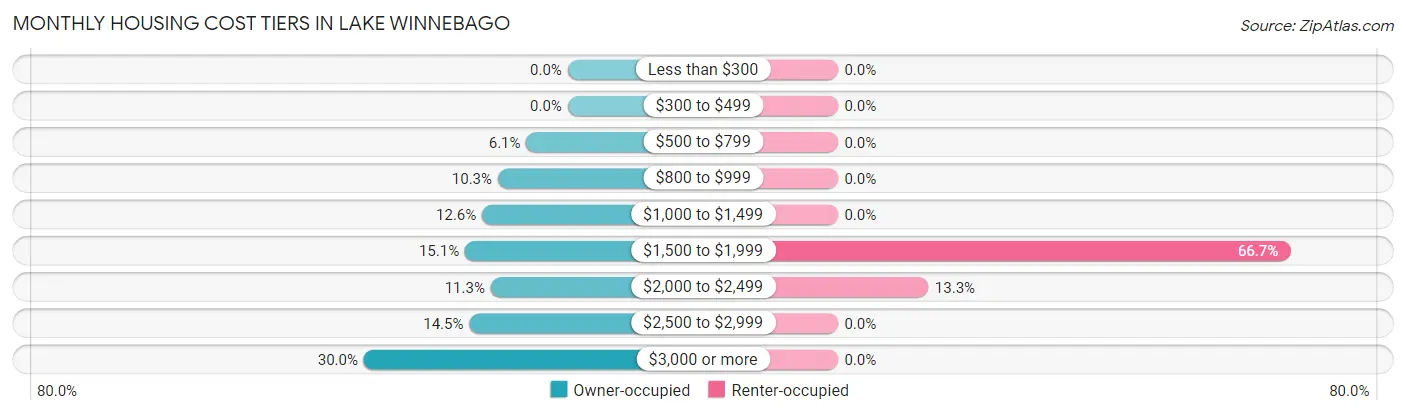
| Monthly Cost | Owner-occupied | Renter-occupied |
| Less than $300 | 0 (0.0%) | 0 (0.0%) |
| $300 to $499 | 0 (0.0%) | 0 (0.0%) |
| $500 to $799 | 29 (6.1%) | 0 (0.0%) |
| $800 to $999 | 49 (10.3%) | 0 (0.0%) |
| $1,000 to $1,499 | 60 (12.6%) | 0 (0.0%) |
| $1,500 to $1,999 | 72 (15.1%) | 10 (66.7%) |
| $2,000 to $2,499 | 54 (11.3%) | 2 (13.3%) |
| $2,500 to $2,999 | 69 (14.5%) | 0 (0.0%) |
| $3,000 or more | 143 (30.0%) | 0 (0.0%) |
| Total | 476 (100.0%) | 15 (100.0%) |
Physical Housing Characteristics in Lake Winnebago
Housing Structures in Lake Winnebago
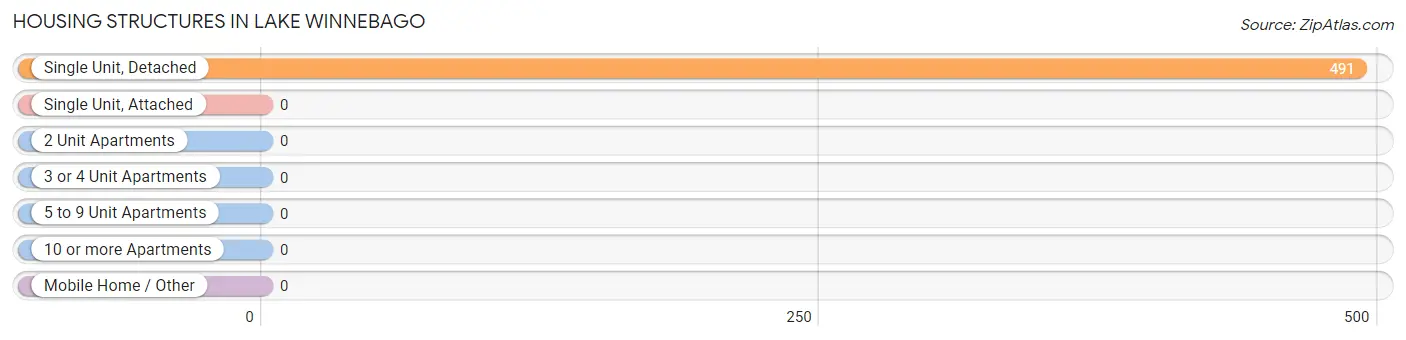
| Structure Type | # Housing Units | % Housing Units |
| Single Unit, Detached | 491 | 100.0% |
| Single Unit, Attached | 0 | 0.0% |
| 2 Unit Apartments | 0 | 0.0% |
| 3 or 4 Unit Apartments | 0 | 0.0% |
| 5 to 9 Unit Apartments | 0 | 0.0% |
| 10 or more Apartments | 0 | 0.0% |
| Mobile Home / Other | 0 | 0.0% |
| Total | 491 | 100.0% |
Housing Structures by Occupancy in Lake Winnebago
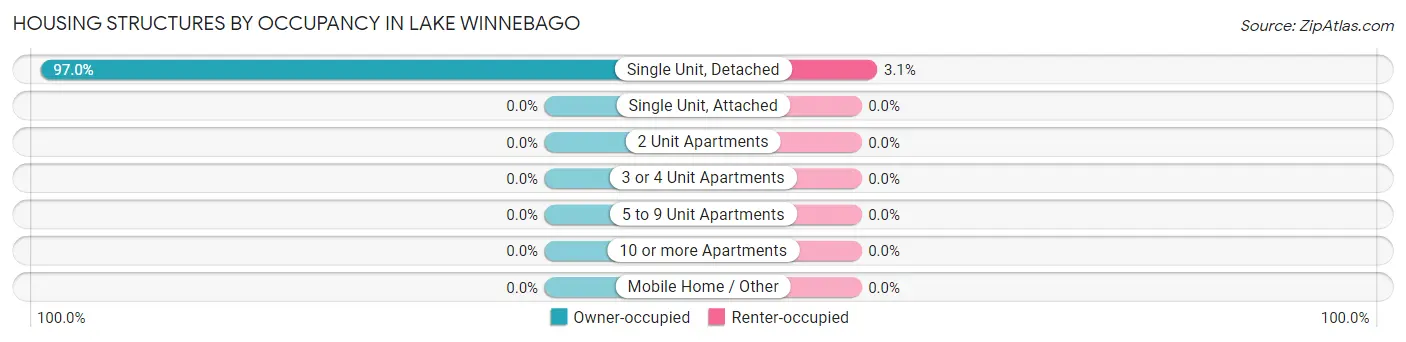
| Structure Type | Owner-occupied | Renter-occupied |
| Single Unit, Detached | 476 (97.0%) | 15 (3.0%) |
| Single Unit, Attached | 0 (0.0%) | 0 (0.0%) |
| 2 Unit Apartments | 0 (0.0%) | 0 (0.0%) |
| 3 or 4 Unit Apartments | 0 (0.0%) | 0 (0.0%) |
| 5 to 9 Unit Apartments | 0 (0.0%) | 0 (0.0%) |
| 10 or more Apartments | 0 (0.0%) | 0 (0.0%) |
| Mobile Home / Other | 0 (0.0%) | 0 (0.0%) |
| Total | 476 (97.0%) | 15 (3.0%) |
Housing Structures by Number of Rooms in Lake Winnebago
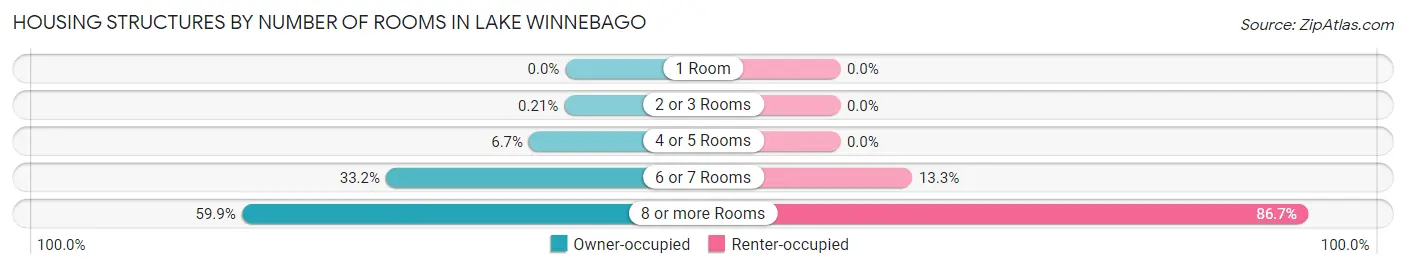
| Number of Rooms | Owner-occupied | Renter-occupied |
| 1 Room | 0 (0.0%) | 0 (0.0%) |
| 2 or 3 Rooms | 1 (0.2%) | 0 (0.0%) |
| 4 or 5 Rooms | 32 (6.7%) | 0 (0.0%) |
| 6 or 7 Rooms | 158 (33.2%) | 2 (13.3%) |
| 8 or more Rooms | 285 (59.9%) | 13 (86.7%) |
| Total | 476 (100.0%) | 15 (100.0%) |
Housing Structure by Heating Type in Lake Winnebago
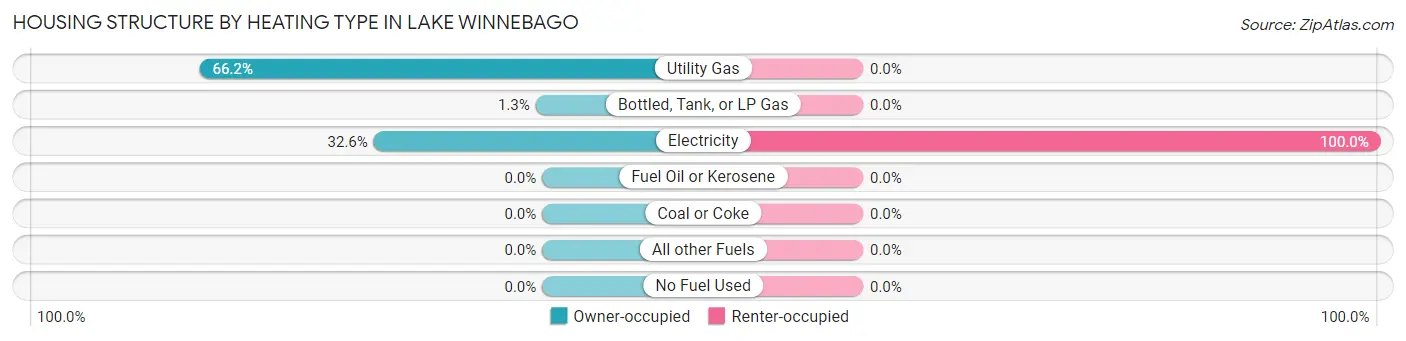
| Heating Type | Owner-occupied | Renter-occupied |
| Utility Gas | 315 (66.2%) | 0 (0.0%) |
| Bottled, Tank, or LP Gas | 6 (1.3%) | 0 (0.0%) |
| Electricity | 155 (32.6%) | 15 (100.0%) |
| Fuel Oil or Kerosene | 0 (0.0%) | 0 (0.0%) |
| Coal or Coke | 0 (0.0%) | 0 (0.0%) |
| All other Fuels | 0 (0.0%) | 0 (0.0%) |
| No Fuel Used | 0 (0.0%) | 0 (0.0%) |
| Total | 476 (100.0%) | 15 (100.0%) |
Household Vehicle Usage in Lake Winnebago
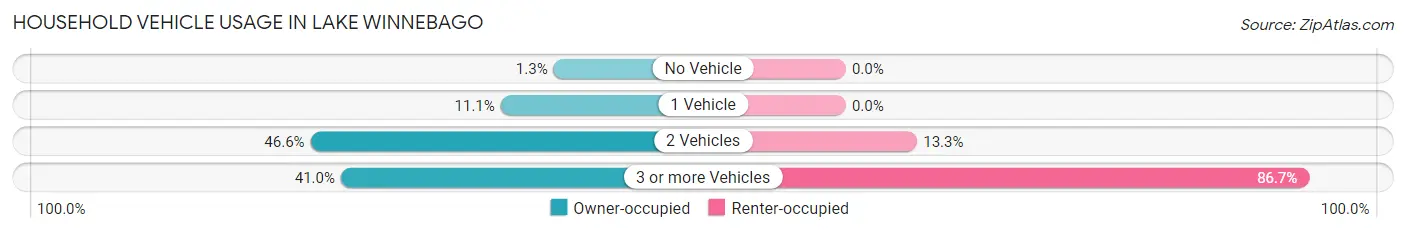
| Vehicles per Household | Owner-occupied | Renter-occupied |
| No Vehicle | 6 (1.3%) | 0 (0.0%) |
| 1 Vehicle | 53 (11.1%) | 0 (0.0%) |
| 2 Vehicles | 222 (46.6%) | 2 (13.3%) |
| 3 or more Vehicles | 195 (41.0%) | 13 (86.7%) |
| Total | 476 (100.0%) | 15 (100.0%) |
Real Estate & Mortgages in Lake Winnebago
Real Estate and Mortgage Overview in Lake Winnebago
| Characteristic | Without Mortgage | With Mortgage |
| Housing Units | 140 | 336 |
| Median Property Value | $609,600 | $589,700 |
| Median Household Income | $113,750 | $213 |
| Monthly Housing Costs | $977 | $138 |
| Real Estate Taxes | $6,373 | $5 |
Property Value by Mortgage Status in Lake Winnebago
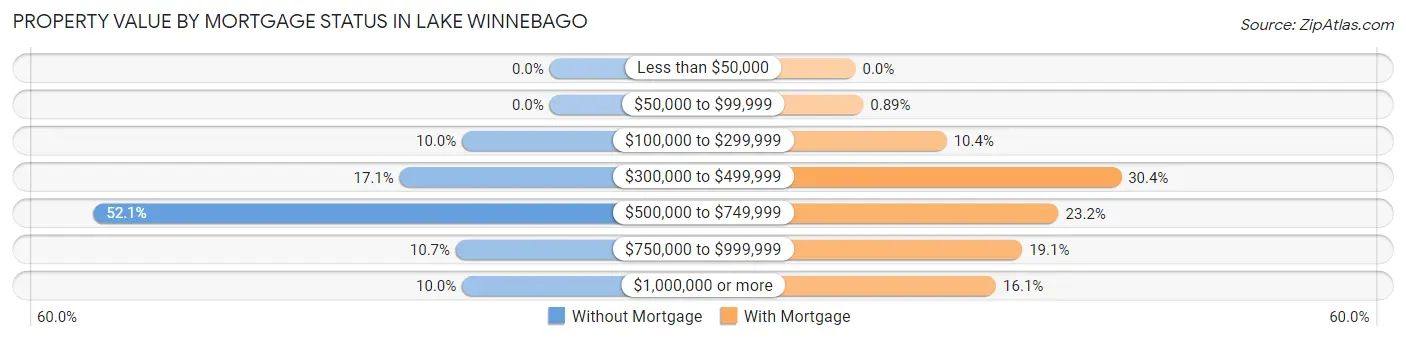
| Property Value | Without Mortgage | With Mortgage |
| Less than $50,000 | 0 (0.0%) | 0 (0.0%) |
| $50,000 to $99,999 | 0 (0.0%) | 3 (0.9%) |
| $100,000 to $299,999 | 14 (10.0%) | 35 (10.4%) |
| $300,000 to $499,999 | 24 (17.1%) | 102 (30.4%) |
| $500,000 to $749,999 | 73 (52.1%) | 78 (23.2%) |
| $750,000 to $999,999 | 15 (10.7%) | 64 (19.1%) |
| $1,000,000 or more | 14 (10.0%) | 54 (16.1%) |
| Total | 140 (100.0%) | 336 (100.0%) |
Household Income by Mortgage Status in Lake Winnebago
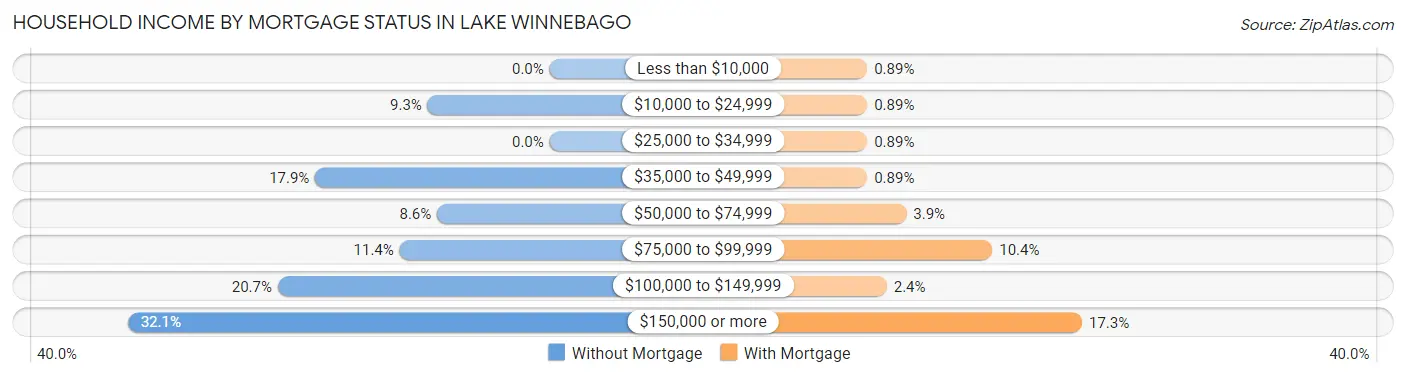
| Household Income | Without Mortgage | With Mortgage |
| Less than $10,000 | 0 (0.0%) | 3 (0.9%) |
| $10,000 to $24,999 | 13 (9.3%) | 3 (0.9%) |
| $25,000 to $34,999 | 0 (0.0%) | 3 (0.9%) |
| $35,000 to $49,999 | 25 (17.9%) | 3 (0.9%) |
| $50,000 to $74,999 | 12 (8.6%) | 13 (3.9%) |
| $75,000 to $99,999 | 16 (11.4%) | 35 (10.4%) |
| $100,000 to $149,999 | 29 (20.7%) | 8 (2.4%) |
| $150,000 or more | 45 (32.1%) | 58 (17.3%) |
| Total | 140 (100.0%) | 336 (100.0%) |
Property Value to Household Income Ratio in Lake Winnebago
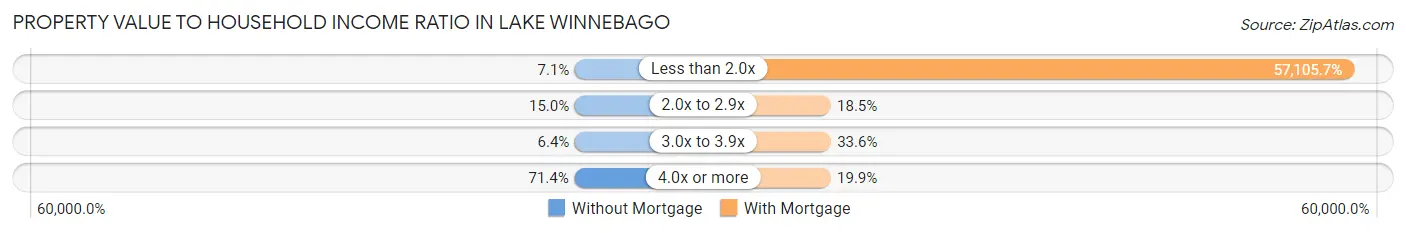
| Value-to-Income Ratio | Without Mortgage | With Mortgage |
| Less than 2.0x | 10 (7.1%) | 191,875 (57,105.7%) |
| 2.0x to 2.9x | 21 (15.0%) | 62 (18.4%) |
| 3.0x to 3.9x | 9 (6.4%) | 113 (33.6%) |
| 4.0x or more | 100 (71.4%) | 67 (19.9%) |
| Total | 140 (100.0%) | 336 (100.0%) |
Real Estate Taxes by Mortgage Status in Lake Winnebago
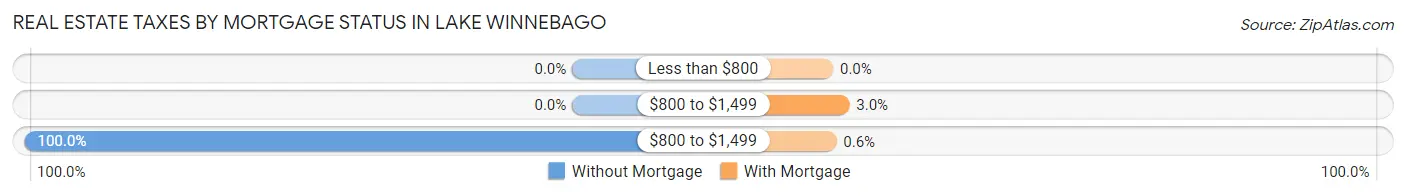
| Property Taxes | Without Mortgage | With Mortgage |
| Less than $800 | 0 (0.0%) | 0 (0.0%) |
| $800 to $1,499 | 0 (0.0%) | 10 (3.0%) |
| $800 to $1,499 | 140 (100.0%) | 2 (0.6%) |
| Total | 140 (100.0%) | 336 (100.0%) |
Health & Disability in Lake Winnebago
Health Insurance Coverage by Age in Lake Winnebago
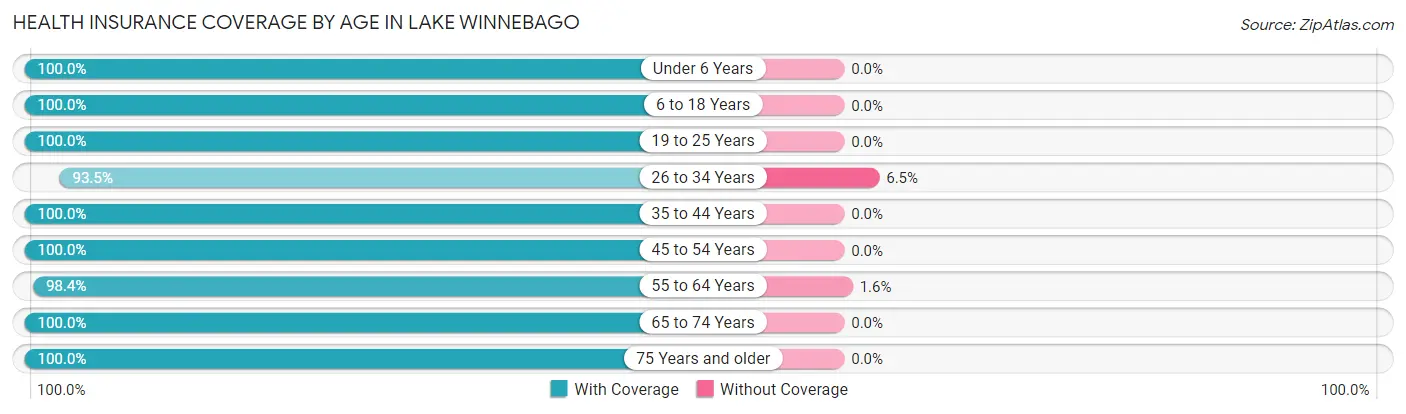
| Age Bracket | With Coverage | Without Coverage |
| Under 6 Years | 39 (100.0%) | 0 (0.0%) |
| 6 to 18 Years | 195 (100.0%) | 0 (0.0%) |
| 19 to 25 Years | 26 (100.0%) | 0 (0.0%) |
| 26 to 34 Years | 43 (93.5%) | 3 (6.5%) |
| 35 to 44 Years | 174 (100.0%) | 0 (0.0%) |
| 45 to 54 Years | 254 (100.0%) | 0 (0.0%) |
| 55 to 64 Years | 188 (98.4%) | 3 (1.6%) |
| 65 to 74 Years | 234 (100.0%) | 0 (0.0%) |
| 75 Years and older | 104 (100.0%) | 0 (0.0%) |
| Total | 1,257 (99.5%) | 6 (0.5%) |
Health Insurance Coverage by Citizenship Status in Lake Winnebago
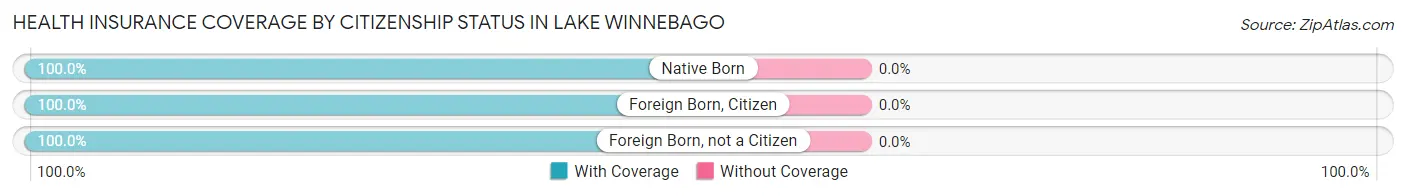
| Citizenship Status | With Coverage | Without Coverage |
| Native Born | 39 (100.0%) | 0 (0.0%) |
| Foreign Born, Citizen | 195 (100.0%) | 0 (0.0%) |
| Foreign Born, not a Citizen | 26 (100.0%) | 0 (0.0%) |
Health Insurance Coverage by Household Income in Lake Winnebago
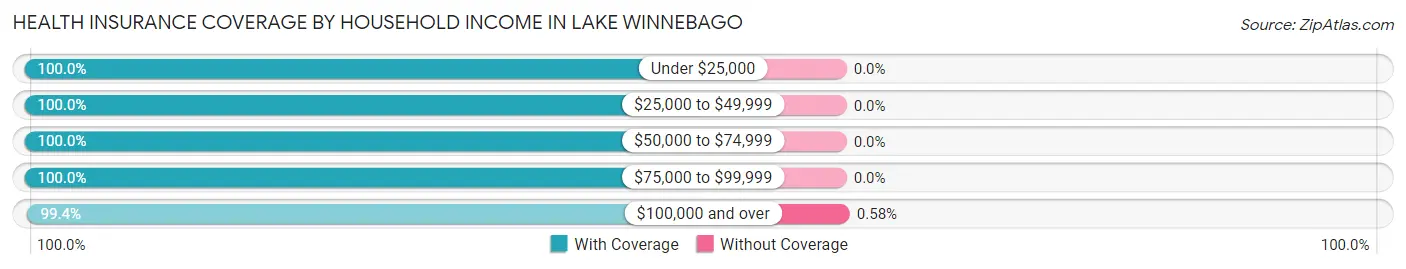
| Household Income | With Coverage | Without Coverage |
| Under $25,000 | 28 (100.0%) | 0 (0.0%) |
| $25,000 to $49,999 | 80 (100.0%) | 0 (0.0%) |
| $50,000 to $74,999 | 76 (100.0%) | 0 (0.0%) |
| $75,000 to $99,999 | 42 (100.0%) | 0 (0.0%) |
| $100,000 and over | 1,031 (99.4%) | 6 (0.6%) |
Public vs Private Health Insurance Coverage by Age in Lake Winnebago
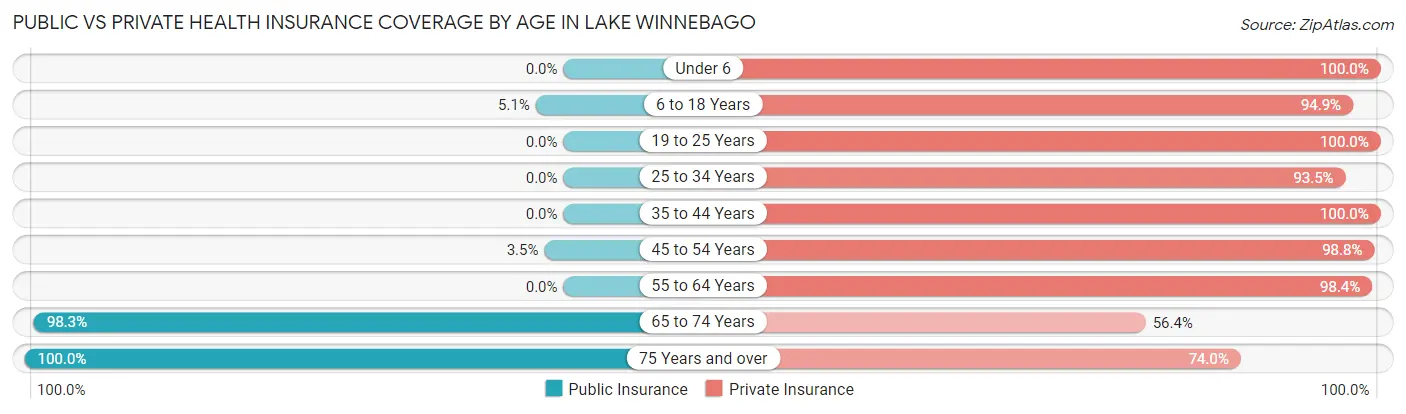
| Age Bracket | Public Insurance | Private Insurance |
| Under 6 | 0 (0.0%) | 39 (100.0%) |
| 6 to 18 Years | 10 (5.1%) | 185 (94.9%) |
| 19 to 25 Years | 0 (0.0%) | 26 (100.0%) |
| 25 to 34 Years | 0 (0.0%) | 43 (93.5%) |
| 35 to 44 Years | 0 (0.0%) | 174 (100.0%) |
| 45 to 54 Years | 9 (3.5%) | 251 (98.8%) |
| 55 to 64 Years | 0 (0.0%) | 188 (98.4%) |
| 65 to 74 Years | 230 (98.3%) | 132 (56.4%) |
| 75 Years and over | 104 (100.0%) | 77 (74.0%) |
| Total | 353 (28.0%) | 1,115 (88.3%) |
Disability Status by Sex by Age in Lake Winnebago
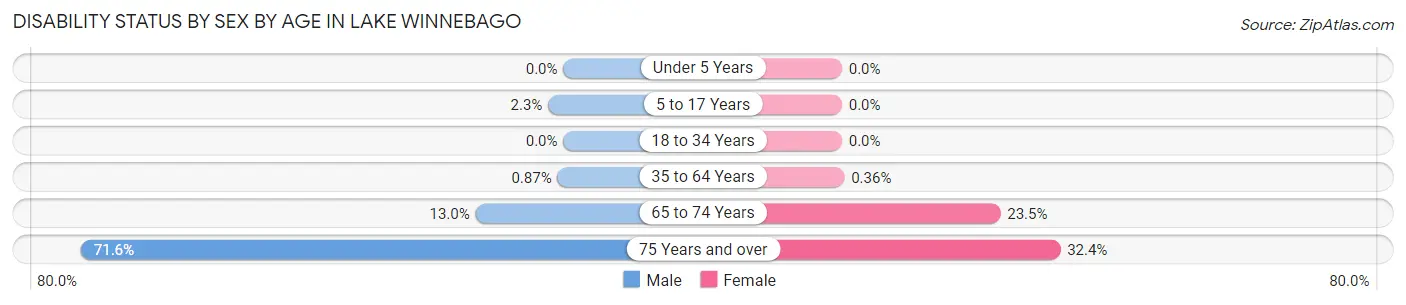
| Age Bracket | Male | Female |
| Under 5 Years | 0 (0.0%) | 0 (0.0%) |
| 5 to 17 Years | 2 (2.2%) | 0 (0.0%) |
| 18 to 34 Years | 0 (0.0%) | 0 (0.0%) |
| 35 to 64 Years | 3 (0.9%) | 1 (0.4%) |
| 65 to 74 Years | 15 (13.0%) | 28 (23.5%) |
| 75 Years and over | 48 (71.6%) | 12 (32.4%) |
Disability Class by Sex by Age in Lake Winnebago
Disability Class: Hearing Difficulty
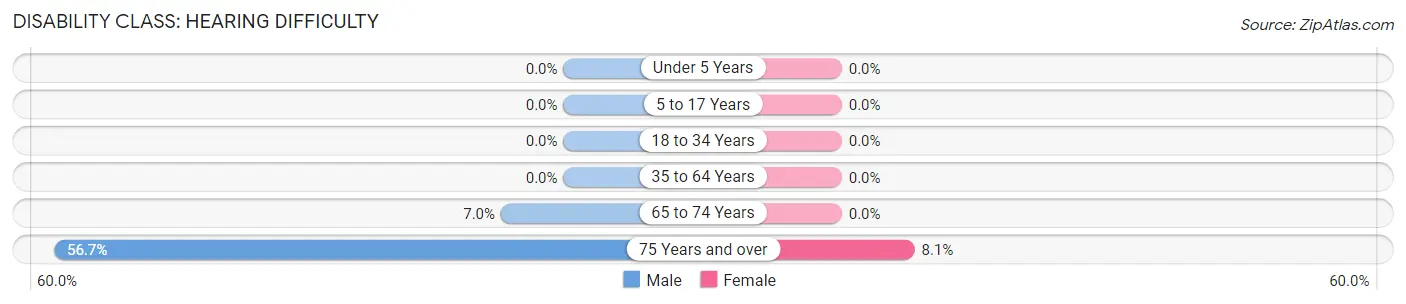
| Age Bracket | Male | Female |
| Under 5 Years | 0 (0.0%) | 0 (0.0%) |
| 5 to 17 Years | 0 (0.0%) | 0 (0.0%) |
| 18 to 34 Years | 0 (0.0%) | 0 (0.0%) |
| 35 to 64 Years | 0 (0.0%) | 0 (0.0%) |
| 65 to 74 Years | 8 (7.0%) | 0 (0.0%) |
| 75 Years and over | 38 (56.7%) | 3 (8.1%) |
Disability Class: Vision Difficulty
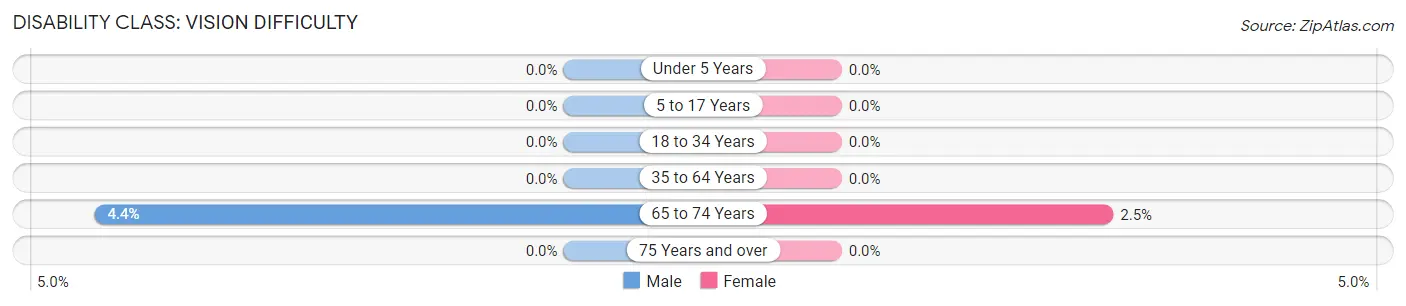
| Age Bracket | Male | Female |
| Under 5 Years | 0 (0.0%) | 0 (0.0%) |
| 5 to 17 Years | 0 (0.0%) | 0 (0.0%) |
| 18 to 34 Years | 0 (0.0%) | 0 (0.0%) |
| 35 to 64 Years | 0 (0.0%) | 0 (0.0%) |
| 65 to 74 Years | 5 (4.3%) | 3 (2.5%) |
| 75 Years and over | 0 (0.0%) | 0 (0.0%) |
Disability Class: Cognitive Difficulty
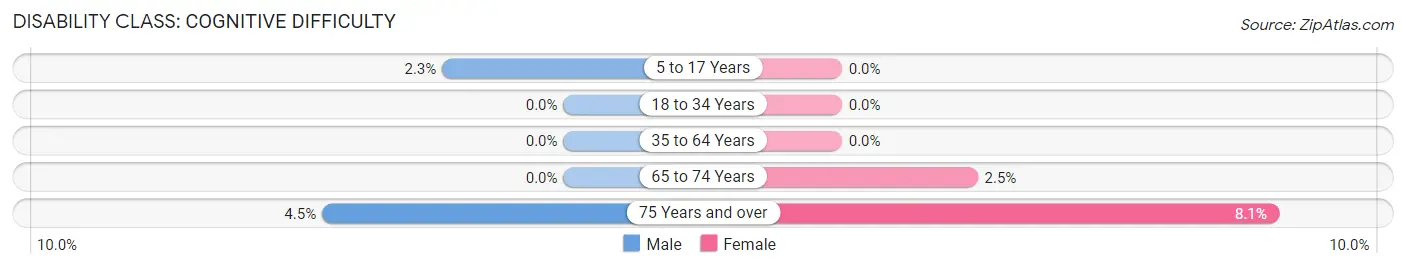
| Age Bracket | Male | Female |
| 5 to 17 Years | 2 (2.2%) | 0 (0.0%) |
| 18 to 34 Years | 0 (0.0%) | 0 (0.0%) |
| 35 to 64 Years | 0 (0.0%) | 0 (0.0%) |
| 65 to 74 Years | 0 (0.0%) | 3 (2.5%) |
| 75 Years and over | 3 (4.5%) | 3 (8.1%) |
Disability Class: Ambulatory Difficulty
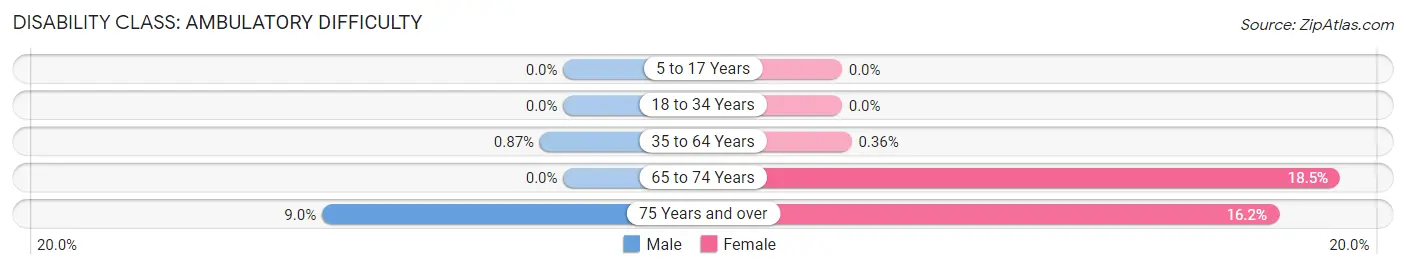
| Age Bracket | Male | Female |
| 5 to 17 Years | 0 (0.0%) | 0 (0.0%) |
| 18 to 34 Years | 0 (0.0%) | 0 (0.0%) |
| 35 to 64 Years | 3 (0.9%) | 1 (0.4%) |
| 65 to 74 Years | 0 (0.0%) | 22 (18.5%) |
| 75 Years and over | 6 (9.0%) | 6 (16.2%) |
Disability Class: Self-Care Difficulty
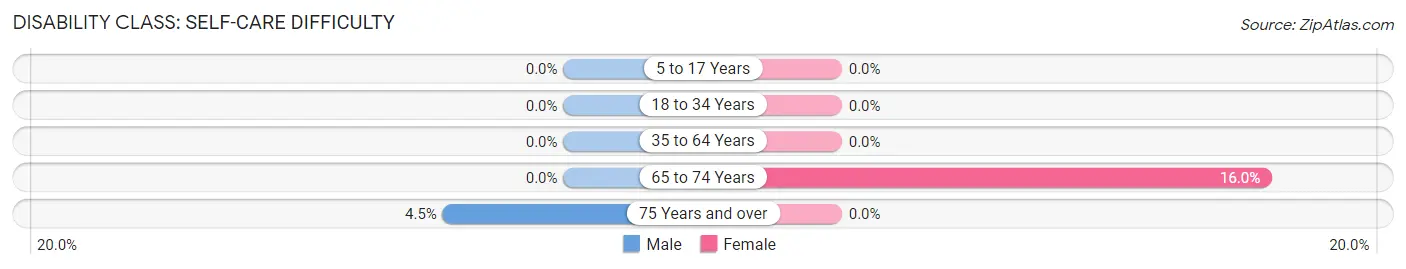
| Age Bracket | Male | Female |
| 5 to 17 Years | 0 (0.0%) | 0 (0.0%) |
| 18 to 34 Years | 0 (0.0%) | 0 (0.0%) |
| 35 to 64 Years | 0 (0.0%) | 0 (0.0%) |
| 65 to 74 Years | 0 (0.0%) | 19 (16.0%) |
| 75 Years and over | 3 (4.5%) | 0 (0.0%) |
Technology Access in Lake Winnebago
Computing Device Access in Lake Winnebago
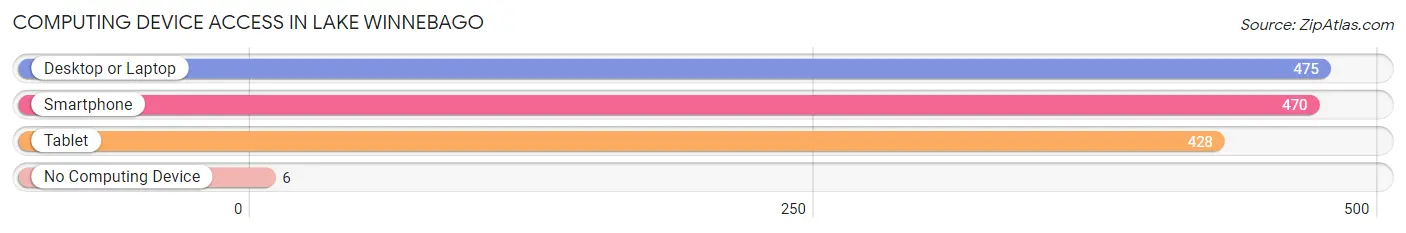
| Device Type | # Households | % Households |
| Desktop or Laptop | 475 | 96.7% |
| Smartphone | 470 | 95.7% |
| Tablet | 428 | 87.2% |
| No Computing Device | 6 | 1.2% |
| Total | 491 | 100.0% |
Internet Access in Lake Winnebago
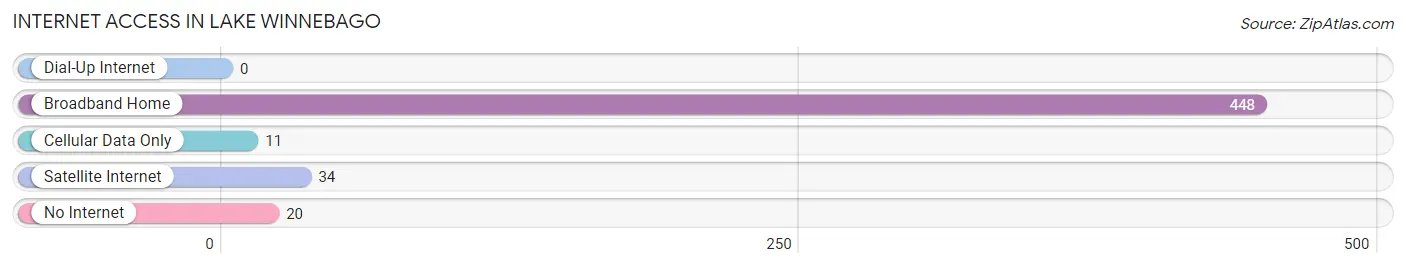
| Internet Type | # Households | % Households |
| Dial-Up Internet | 0 | 0.0% |
| Broadband Home | 448 | 91.2% |
| Cellular Data Only | 11 | 2.2% |
| Satellite Internet | 34 | 6.9% |
| No Internet | 20 | 4.1% |
| Total | 491 | 100.0% |
Lake Winnebago Summary
History
Lake Winnebago is a large lake located in the state of Missouri. It is the largest lake in the state and is located in the northwest corner of the state. The lake was formed by the Wisconsin glaciation during the last ice age and is the largest lake in the state. The lake is named after the Winnebago tribe of Native Americans who lived in the area prior to European settlement.
The first Europeans to settle in the area were French fur traders in the late 1700s. The lake was used as a trading post and a source of food for the traders. The lake was also used for transportation, as it was a major route for steamboats.
In the early 1800s, the lake became a popular destination for settlers. The lake was used for fishing, hunting, and recreation. The lake was also used for transportation, as it was a major route for steamboats.
In the late 1800s, the lake became a popular destination for tourists. The lake was used for fishing, hunting, and recreation. The lake was also used for transportation, as it was a major route for steamboats.
In the early 1900s, the lake became a popular destination for vacationers. The lake was used for fishing, hunting, and recreation. The lake was also used for transportation, as it was a major route for steamboats.
In the late 1900s, the lake became a popular destination for recreational boaters. The lake was used for fishing, hunting, and recreation. The lake was also used for transportation, as it was a major route for steamboats.
Geography
Lake Winnebago is located in the northwest corner of Missouri. It is the largest lake in the state and is approximately 8,000 acres in size. The lake is fed by the Missouri River and is surrounded by the cities of St. Joseph, St. Charles, and Hannibal. The lake is also bordered by the states of Iowa and Illinois.
The lake is divided into two sections, the northern and southern sections. The northern section is the larger of the two and is approximately 5,000 acres in size. The southern section is approximately 3,000 acres in size. The lake is approximately 30 feet deep at its deepest point.
The lake is home to a variety of fish species, including largemouth bass, smallmouth bass, walleye, northern pike, and catfish. The lake is also home to a variety of wildlife, including deer, turkey, and waterfowl.
Economy
The economy of Lake Winnebago is largely based on tourism and recreation. The lake is a popular destination for fishing, hunting, and recreational boating. The lake is also home to a variety of resorts and marinas.
The lake is also home to a variety of businesses, including boat dealerships, marinas, and restaurants. The lake is also home to a variety of manufacturing companies, including boat manufacturers and boat parts suppliers.
Demographics
The population of Lake Winnebago is approximately 5,000 people. The majority of the population is white, with a small percentage of African Americans and Hispanics. The median household income is approximately $50,000. The median age is approximately 40 years old.
Conclusion
Lake Winnebago is a large lake located in the northwest corner of Missouri. It is the largest lake in the state and is approximately 8,000 acres in size. The lake is fed by the Missouri River and is surrounded by the cities of St. Joseph, St. Charles, and Hannibal. The lake is also bordered by the states of Iowa and Illinois. The lake is a popular destination for fishing, hunting, and recreational boating. The lake is also home to a variety of businesses, including boat dealerships, marinas, and restaurants. The population of Lake Winnebago is approximately 5,000 people. The majority of the population is white, with a small percentage of African Americans and Hispanics. The median household income is approximately $50,000. The median age is approximately 40 years old.
Common Questions
What is Per Capita Income in Lake Winnebago?
Per Capita income in Lake Winnebago is $76,821.
What is the Median Family Income in Lake Winnebago?
Median Family Income in Lake Winnebago is $173,194.
What is the Median Household income in Lake Winnebago?
Median Household Income in Lake Winnebago is $173,194.
What is Income or Wage Gap in Lake Winnebago?
Income or Wage Gap in Lake Winnebago is 40.0%.
Women in Lake Winnebago earn 60.0 cents for every dollar earned by a man.
What is Inequality or Gini Index in Lake Winnebago?
Inequality or Gini Index in Lake Winnebago is 0.37.
What is the Total Population of Lake Winnebago?
Total Population of Lake Winnebago is 1,263.
What is the Total Male Population of Lake Winnebago?
Total Male Population of Lake Winnebago is 662.
What is the Total Female Population of Lake Winnebago?
Total Female Population of Lake Winnebago is 601.
What is the Ratio of Males per 100 Females in Lake Winnebago?
There are 110.15 Males per 100 Females in Lake Winnebago.
What is the Ratio of Females per 100 Males in Lake Winnebago?
There are 90.79 Females per 100 Males in Lake Winnebago.
What is the Median Population Age in Lake Winnebago?
Median Population Age in Lake Winnebago is 50.6 Years.
What is the Average Family Size in Lake Winnebago
Average Family Size in Lake Winnebago is 2.8 People.
What is the Average Household Size in Lake Winnebago
Average Household Size in Lake Winnebago is 2.6 People.
How Large is the Labor Force in Lake Winnebago?
There are 615 People in the Labor Forcein in Lake Winnebago.
What is the Percentage of People in the Labor Force in Lake Winnebago?
57.4% of People are in the Labor Force in Lake Winnebago.
What is the Unemployment Rate in Lake Winnebago?
Unemployment Rate in Lake Winnebago is 1.3%.