Cherokee Pass, MO Map & Demographics
Cherokee Pass Map
Cherokee Pass Overview
$38,977
PER CAPITA INCOME
$78,750
AVG FAMILY INCOME
$70,982
AVG HOUSEHOLD INCOME
0.36
INEQUALITY / GINI INDEX
196
TOTAL POPULATION
92
MALE POPULATION
104
FEMALE POPULATION
88.46
MALES / 100 FEMALES
113.04
FEMALES / 100 MALES
51.7
MEDIAN AGE
3.1
AVG FAMILY SIZE
2.4
AVG HOUSEHOLD SIZE
124
LABOR FORCE [ PEOPLE ]
75.6%
PERCENT IN LABOR FORCE
5.6%
UNEMPLOYMENT RATE
Income in Cherokee Pass
Income Overview in Cherokee Pass
Per Capita Income in Cherokee Pass is $38,977, while median incomes of families and households are $78,750 and $70,982 respectively.
| Characteristic | Number | Measure |
| Per Capita Income | 196 | $38,977 |
| Median Family Income | 53 | $78,750 |
| Mean Family Income | 53 | $99,223 |
| Median Household Income | 83 | $70,982 |
| Mean Household Income | 83 | $80,119 |
| Income Deficit | 53 | $0 |
| Wage / Income Gap (%) | 196 | 0.00% |
| Wage / Income Gap ($) | 196 | 100.00¢ per $1 |
| Gini / Inequality Index | 196 | 0.36 |
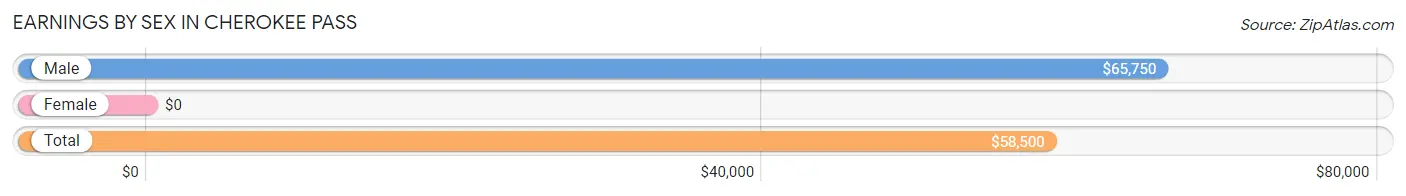
Earnings by Sex in Cherokee Pass
| Sex | Number | Average Earnings |
| Male | 83 (61.9%) | $65,750 |
| Female | 51 (38.1%) | $0 |
| Total | 134 (100.0%) | $58,500 |
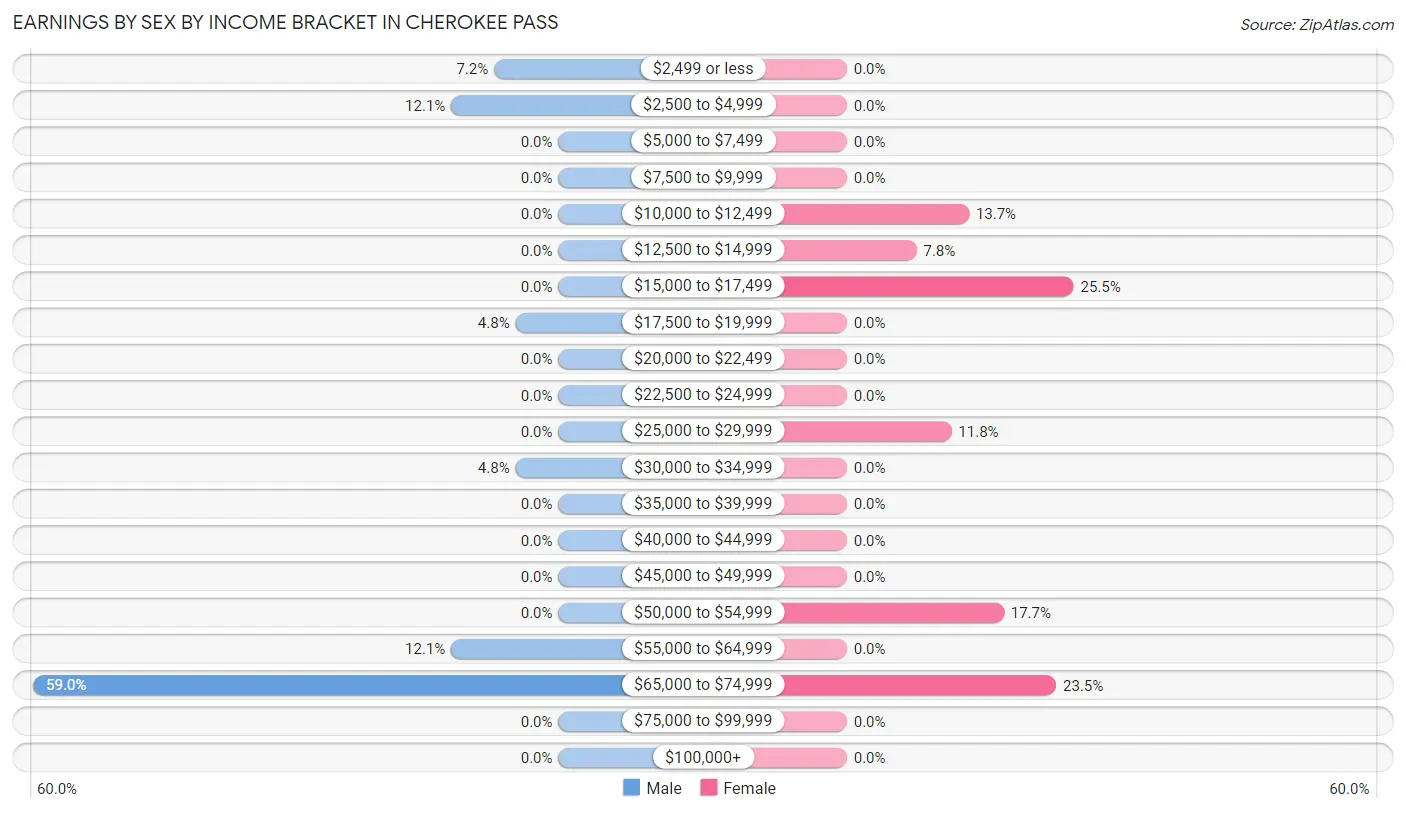
Earnings by Sex by Income Bracket in Cherokee Pass
The most common earnings brackets in Cherokee Pass are $65,000 to $74,999 for men (49 | 59.0%) and $15,000 to $17,499 for women (13 | 25.5%).
| Income | Male | Female |
| $2,499 or less | 6 (7.2%) | 0 (0.0%) |
| $2,500 to $4,999 | 10 (12.0%) | 0 (0.0%) |
| $5,000 to $7,499 | 0 (0.0%) | 0 (0.0%) |
| $7,500 to $9,999 | 0 (0.0%) | 0 (0.0%) |
| $10,000 to $12,499 | 0 (0.0%) | 7 (13.7%) |
| $12,500 to $14,999 | 0 (0.0%) | 4 (7.8%) |
| $15,000 to $17,499 | 0 (0.0%) | 13 (25.5%) |
| $17,500 to $19,999 | 4 (4.8%) | 0 (0.0%) |
| $20,000 to $22,499 | 0 (0.0%) | 0 (0.0%) |
| $22,500 to $24,999 | 0 (0.0%) | 0 (0.0%) |
| $25,000 to $29,999 | 0 (0.0%) | 6 (11.8%) |
| $30,000 to $34,999 | 4 (4.8%) | 0 (0.0%) |
| $35,000 to $39,999 | 0 (0.0%) | 0 (0.0%) |
| $40,000 to $44,999 | 0 (0.0%) | 0 (0.0%) |
| $45,000 to $49,999 | 0 (0.0%) | 0 (0.0%) |
| $50,000 to $54,999 | 0 (0.0%) | 9 (17.6%) |
| $55,000 to $64,999 | 10 (12.0%) | 0 (0.0%) |
| $65,000 to $74,999 | 49 (59.0%) | 12 (23.5%) |
| $75,000 to $99,999 | 0 (0.0%) | 0 (0.0%) |
| $100,000+ | 0 (0.0%) | 0 (0.0%) |
| Total | 83 (100.0%) | 51 (100.0%) |
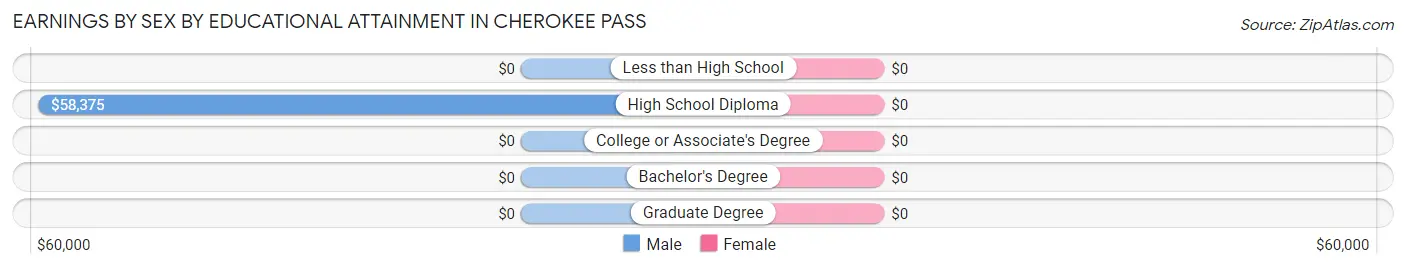
Earnings by Sex by Educational Attainment in Cherokee Pass
| Educational Attainment | Male Income | Female Income |
| Less than High School | - | - |
| High School Diploma | $58,375 | $0 |
| College or Associate's Degree | - | - |
| Bachelor's Degree | - | - |
| Graduate Degree | - | - |
| Total | $66,050 | $0 |
Family Income in Cherokee Pass
Family Income Brackets in Cherokee Pass
According to the Cherokee Pass family income data, there are 13 families falling into the $75,000 to $99,999 income range, which is the most common income bracket and makes up 24.5% of all families.
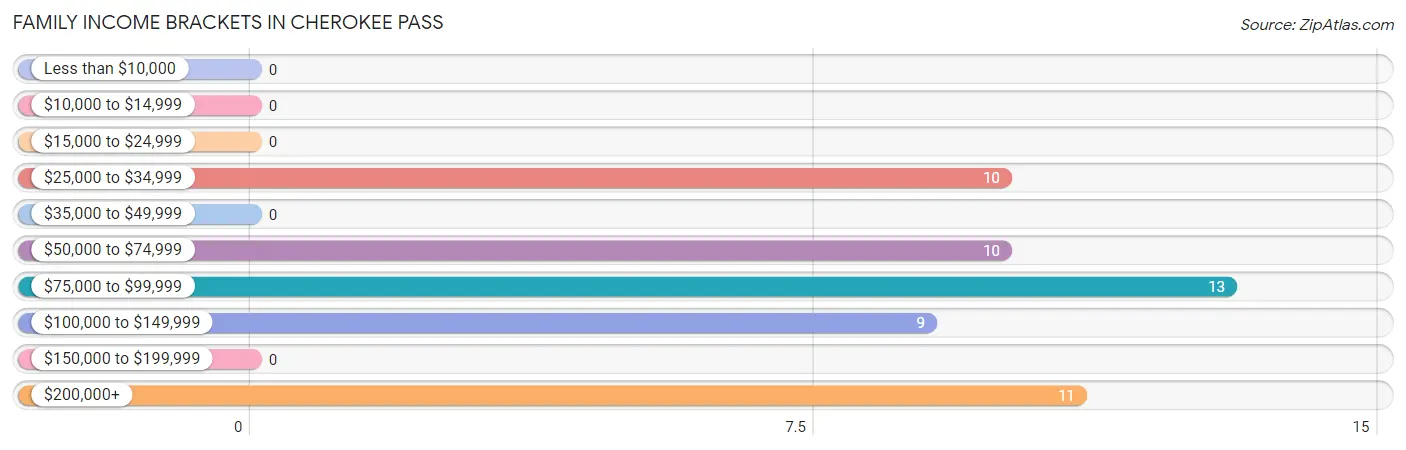
| Income Bracket | # Families | % Families |
| Less than $10,000 | 0 | 0.0% |
| $10,000 to $14,999 | 0 | 0.0% |
| $15,000 to $24,999 | 0 | 0.0% |
| $25,000 to $34,999 | 10 | 18.9% |
| $35,000 to $49,999 | 0 | 0.0% |
| $50,000 to $74,999 | 10 | 18.9% |
| $75,000 to $99,999 | 13 | 24.5% |
| $100,000 to $149,999 | 9 | 17.0% |
| $150,000 to $199,999 | 0 | 0.0% |
| $200,000+ | 11 | 20.8% |
Family Income by Famaliy Size in Cherokee Pass
2-person families (20 | 37.7%) account for the highest median family income in Cherokee Pass with $45,000 per family, while 2-person families (20 | 37.7%) have the highest median income of $22,500 per family member.
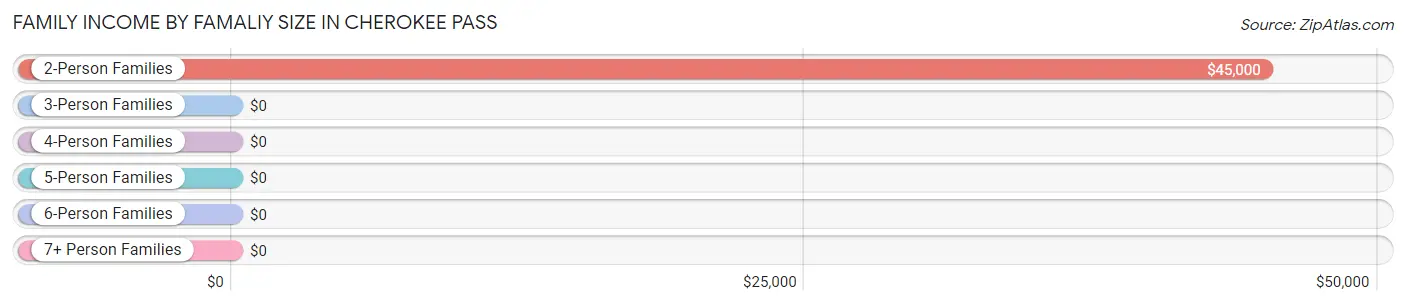
| Income Bracket | # Families | Median Income |
| 2-Person Families | 20 (37.7%) | $45,000 |
| 3-Person Families | 11 (20.7%) | $0 |
| 4-Person Families | 22 (41.5%) | $0 |
| 5-Person Families | 0 (0.0%) | $0 |
| 6-Person Families | 0 (0.0%) | $0 |
| 7+ Person Families | 0 (0.0%) | $0 |
| Total | 53 (100.0%) | $78,750 |
Family Income by Number of Earners in Cherokee Pass
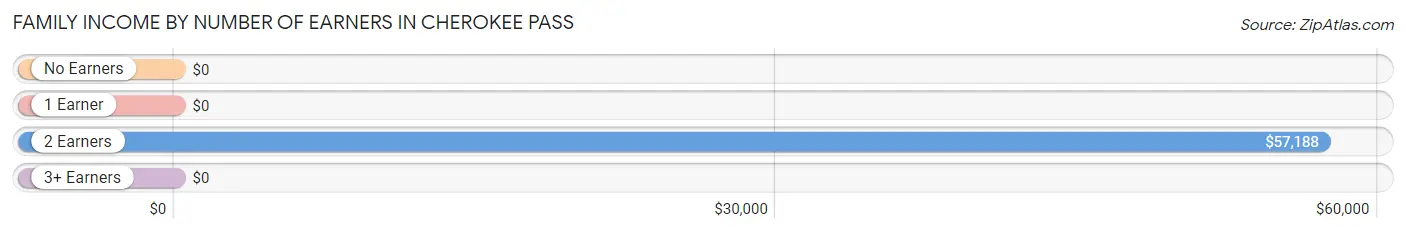
| Number of Earners | # Families | Median Income |
| No Earners | 0 (0.0%) | $0 |
| 1 Earner | 6 (11.3%) | $0 |
| 2 Earners | 27 (50.9%) | $57,188 |
| 3+ Earners | 20 (37.7%) | $0 |
| Total | 53 (100.0%) | $78,750 |
Household Income in Cherokee Pass
Household Income Brackets in Cherokee Pass
With 24 households falling in the category, the $50,000 to $74,999 income range is the most frequent in Cherokee Pass, accounting for 28.9% of all households.
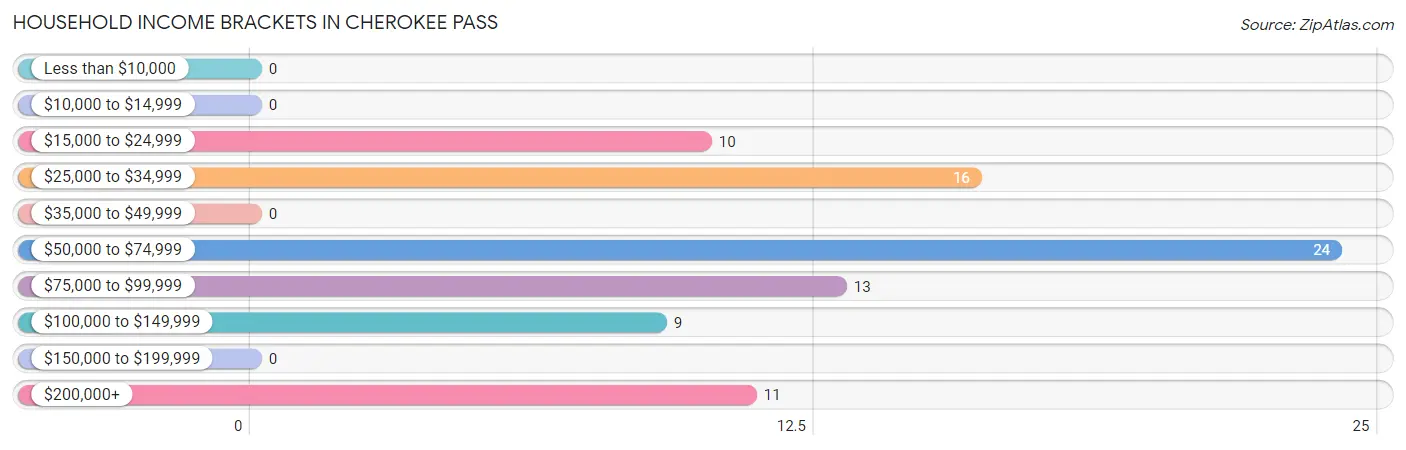
| Income Bracket | # Households | % Households |
| Less than $10,000 | 0 | 0.0% |
| $10,000 to $14,999 | 0 | 0.0% |
| $15,000 to $24,999 | 10 | 12.0% |
| $25,000 to $34,999 | 16 | 19.3% |
| $35,000 to $49,999 | 0 | 0.0% |
| $50,000 to $74,999 | 24 | 28.9% |
| $75,000 to $99,999 | 13 | 15.7% |
| $100,000 to $149,999 | 9 | 10.8% |
| $150,000 to $199,999 | 0 | 0.0% |
| $200,000+ | 11 | 13.3% |
Household Income by Householder Age in Cherokee Pass
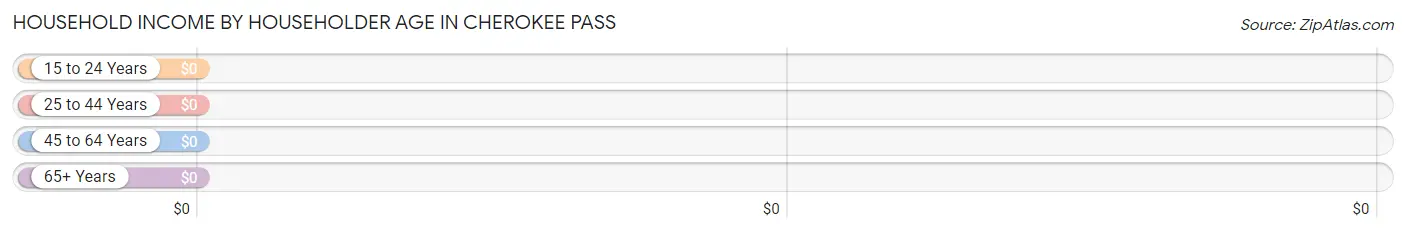
| Income Bracket | # Households | Median Income |
| 15 to 24 Years | 0 (0.0%) | $0 |
| 25 to 44 Years | 9 (10.8%) | $0 |
| 45 to 64 Years | 28 (33.7%) | $0 |
| 65+ Years | 46 (55.4%) | $0 |
| Total | 83 (100.0%) | $70,982 |
Poverty in Cherokee Pass
Income Below Poverty by Sex and Age in Cherokee Pass
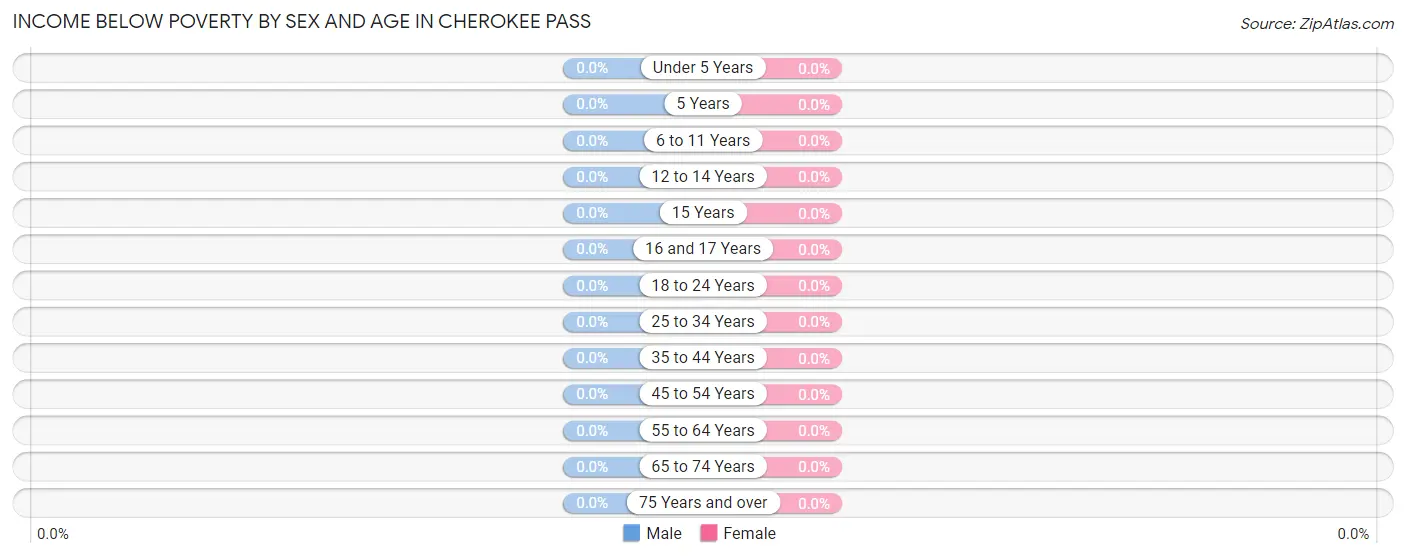
| Age Bracket | Male | Female |
| Under 5 Years | 0 (0.0%) | 0 (0.0%) |
| 5 Years | 0 (0.0%) | 0 (0.0%) |
| 6 to 11 Years | 0 (0.0%) | 0 (0.0%) |
| 12 to 14 Years | 0 (0.0%) | 0 (0.0%) |
| 15 Years | 0 (0.0%) | 0 (0.0%) |
| 16 and 17 Years | 0 (0.0%) | 0 (0.0%) |
| 18 to 24 Years | 0 (0.0%) | 0 (0.0%) |
| 25 to 34 Years | 0 (0.0%) | 0 (0.0%) |
| 35 to 44 Years | 0 (0.0%) | 0 (0.0%) |
| 45 to 54 Years | 0 (0.0%) | 0 (0.0%) |
| 55 to 64 Years | 0 (0.0%) | 0 (0.0%) |
| 65 to 74 Years | 0 (0.0%) | 0 (0.0%) |
| 75 Years and over | 0 (0.0%) | 0 (0.0%) |
| Total | 0 (0.0%) | 0 (0.0%) |
Income Above Poverty by Sex and Age in Cherokee Pass
According to the poverty statistics in Cherokee Pass, males aged 6 to 11 years and females aged 6 to 11 years are the age groups that are most secure financially, with 100.0% of males and 100.0% of females in these age groups living above the poverty line.
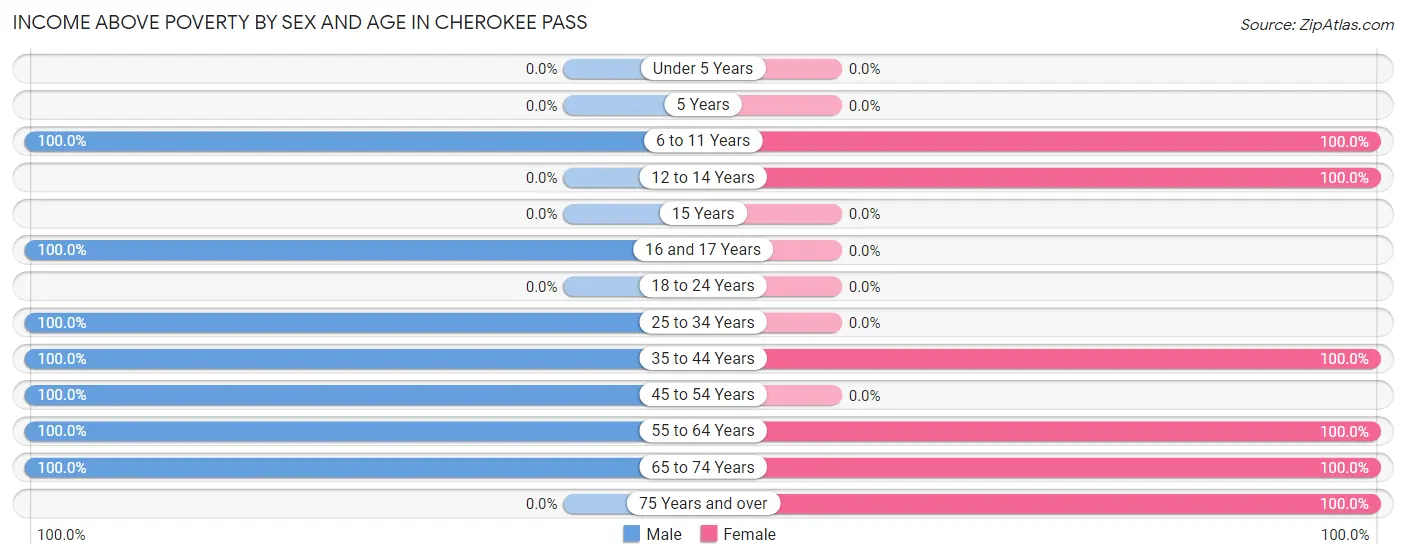
| Age Bracket | Male | Female |
| Under 5 Years | 0 (0.0%) | 0 (0.0%) |
| 5 Years | 0 (0.0%) | 0 (0.0%) |
| 6 to 11 Years | 9 (100.0%) | 12 (100.0%) |
| 12 to 14 Years | 0 (0.0%) | 11 (100.0%) |
| 15 Years | 0 (0.0%) | 0 (0.0%) |
| 16 and 17 Years | 6 (100.0%) | 0 (0.0%) |
| 18 to 24 Years | 0 (0.0%) | 0 (0.0%) |
| 25 to 34 Years | 25 (100.0%) | 0 (0.0%) |
| 35 to 44 Years | 10 (100.0%) | 16 (100.0%) |
| 45 to 54 Years | 13 (100.0%) | 0 (0.0%) |
| 55 to 64 Years | 15 (100.0%) | 16 (100.0%) |
| 65 to 74 Years | 14 (100.0%) | 39 (100.0%) |
| 75 Years and over | 0 (0.0%) | 10 (100.0%) |
| Total | 92 (100.0%) | 104 (100.0%) |
Income Below Poverty Among Married-Couple Families in Cherokee Pass
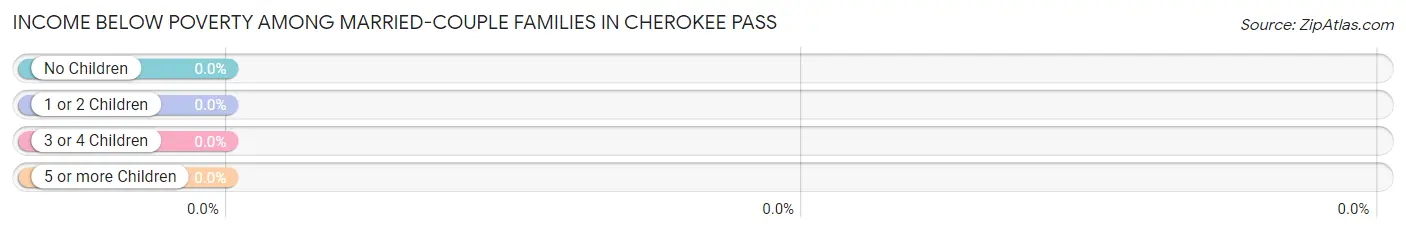
| Children | Above Poverty | Below Poverty |
| No Children | 31 (100.0%) | 0 (0.0%) |
| 1 or 2 Children | 22 (100.0%) | 0 (0.0%) |
| 3 or 4 Children | 0 (0.0%) | 0 (0.0%) |
| 5 or more Children | 0 (0.0%) | 0 (0.0%) |
| Total | 53 (100.0%) | 0 (0.0%) |
Income Below Poverty Among Single-Parent Households in Cherokee Pass
| Children | Single Father | Single Mother |
| No Children | 0 (0.0%) | 0 (0.0%) |
| 1 or 2 Children | 0 (0.0%) | 0 (0.0%) |
| 3 or 4 Children | 0 (0.0%) | 0 (0.0%) |
| 5 or more Children | 0 (0.0%) | 0 (0.0%) |
| Total | 0 (0.0%) | 0 (0.0%) |
Income Below Poverty Among Married-Couple vs Single-Parent Households in Cherokee Pass
| Children | Married-Couple Families | Single-Parent Households |
| No Children | 0 (0.0%) | 0 (0.0%) |
| 1 or 2 Children | 0 (0.0%) | 0 (0.0%) |
| 3 or 4 Children | 0 (0.0%) | 0 (0.0%) |
| 5 or more Children | 0 (0.0%) | 0 (0.0%) |
| Total | 0 (0.0%) | 0 (0.0%) |
Race in Cherokee Pass
The most populous races in Cherokee Pass are , and White / Caucasian (196 | 100.0%).
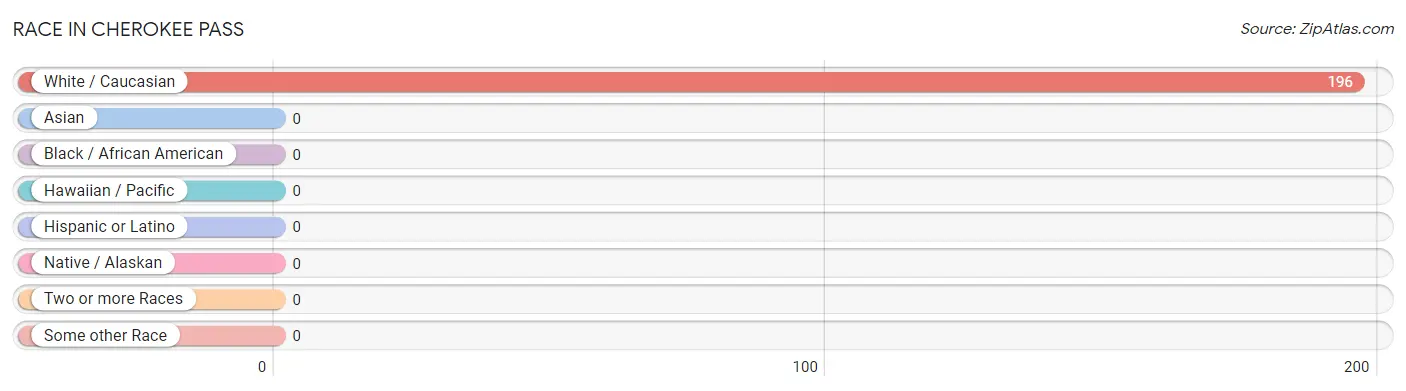
| Race | # Population | % Population |
| Asian | 0 | 0.0% |
| Black / African American | 0 | 0.0% |
| Hawaiian / Pacific | 0 | 0.0% |
| Hispanic or Latino | 0 | 0.0% |
| Native / Alaskan | 0 | 0.0% |
| White / Caucasian | 196 | 100.0% |
| Two or more Races | 0 | 0.0% |
| Some other Race | 0 | 0.0% |
| Total | 196 | 100.0% |
Ancestry in Cherokee Pass
The most populous ancestries reported in Cherokee Pass are American (45 | 23.0%), English (40 | 20.4%), Scotch-Irish (14 | 7.1%), Dutch (10 | 5.1%), and European (9 | 4.6%), together accounting for 60.2% of all Cherokee Pass residents.
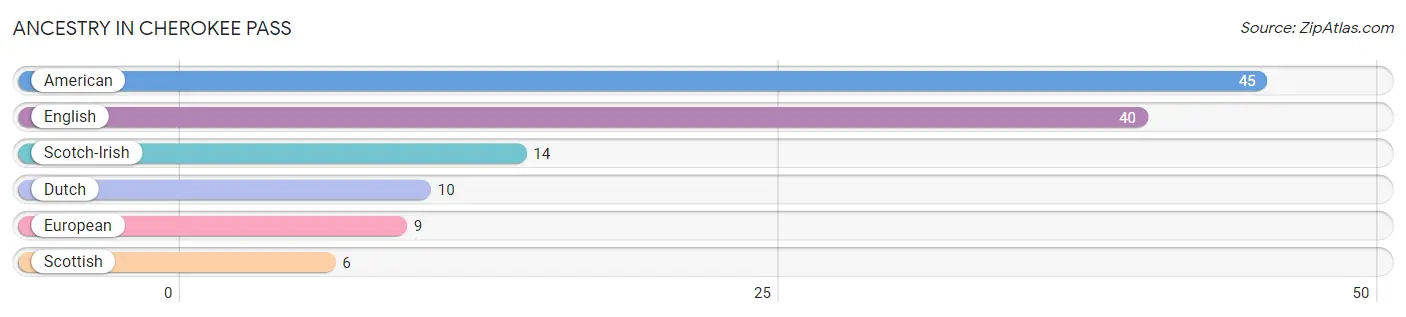
| Ancestry | # Population | % Population |
| American | 45 | 23.0% |
| Dutch | 10 | 5.1% |
| English | 40 | 20.4% |
| European | 9 | 4.6% |
| Scotch-Irish | 14 | 7.1% |
| Scottish | 6 | 3.1% | View All 6 Rows |
Immigrants in Cherokee Pass

| Immigration Origin | # Population | % Population | View All 0 Rows |
Sex and Age in Cherokee Pass
Sex and Age in Cherokee Pass
The most populous age groups in Cherokee Pass are 30 to 34 Years (25 | 27.2%) for men and 70 to 74 Years (27 | 26.0%) for women.
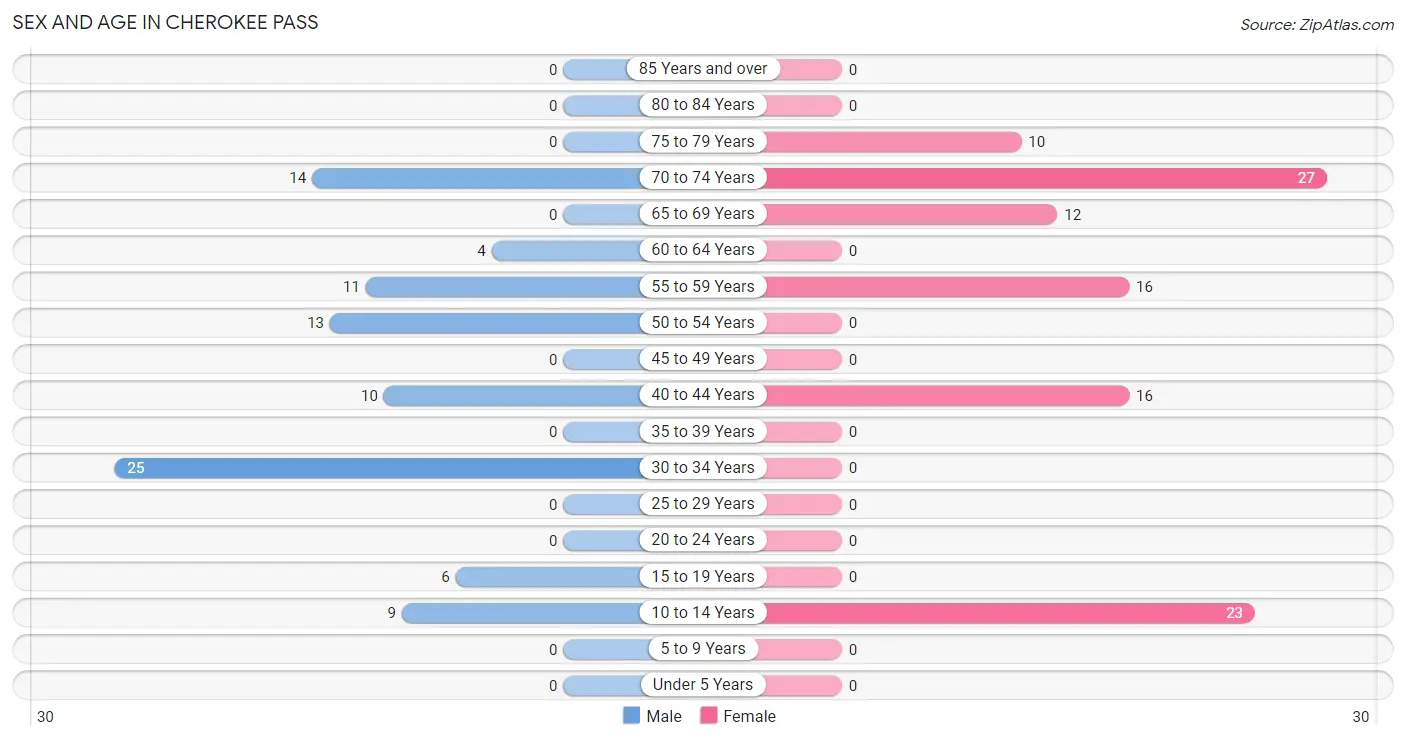
| Age Bracket | Male | Female |
| Under 5 Years | 0 (0.0%) | 0 (0.0%) |
| 5 to 9 Years | 0 (0.0%) | 0 (0.0%) |
| 10 to 14 Years | 9 (9.8%) | 23 (22.1%) |
| 15 to 19 Years | 6 (6.5%) | 0 (0.0%) |
| 20 to 24 Years | 0 (0.0%) | 0 (0.0%) |
| 25 to 29 Years | 0 (0.0%) | 0 (0.0%) |
| 30 to 34 Years | 25 (27.2%) | 0 (0.0%) |
| 35 to 39 Years | 0 (0.0%) | 0 (0.0%) |
| 40 to 44 Years | 10 (10.9%) | 16 (15.4%) |
| 45 to 49 Years | 0 (0.0%) | 0 (0.0%) |
| 50 to 54 Years | 13 (14.1%) | 0 (0.0%) |
| 55 to 59 Years | 11 (12.0%) | 16 (15.4%) |
| 60 to 64 Years | 4 (4.3%) | 0 (0.0%) |
| 65 to 69 Years | 0 (0.0%) | 12 (11.5%) |
| 70 to 74 Years | 14 (15.2%) | 27 (26.0%) |
| 75 to 79 Years | 0 (0.0%) | 10 (9.6%) |
| 80 to 84 Years | 0 (0.0%) | 0 (0.0%) |
| 85 Years and over | 0 (0.0%) | 0 (0.0%) |
| Total | 92 (100.0%) | 104 (100.0%) |
Families and Households in Cherokee Pass
Median Family Size in Cherokee Pass
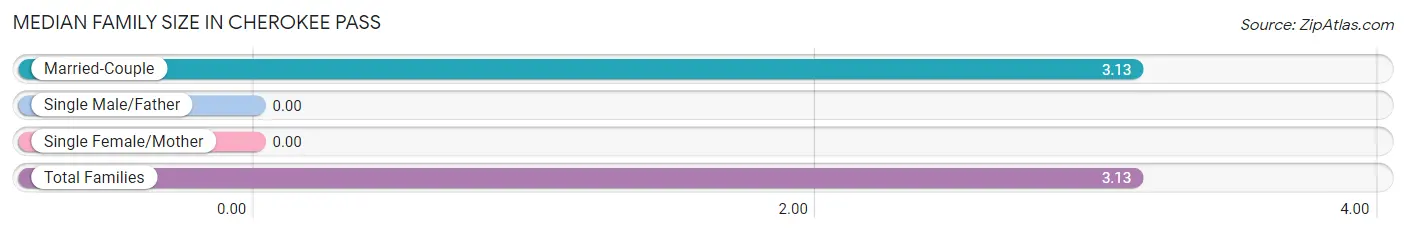
| Family Type | # Families | Family Size |
| Married-Couple | 53 (100.0%) | 3.13 |
| Single Male/Father | 0 (0.0%) | - |
| Single Female/Mother | 0 (0.0%) | - |
| Total Families | 53 (100.0%) | 3.13 |
Median Household Size in Cherokee Pass
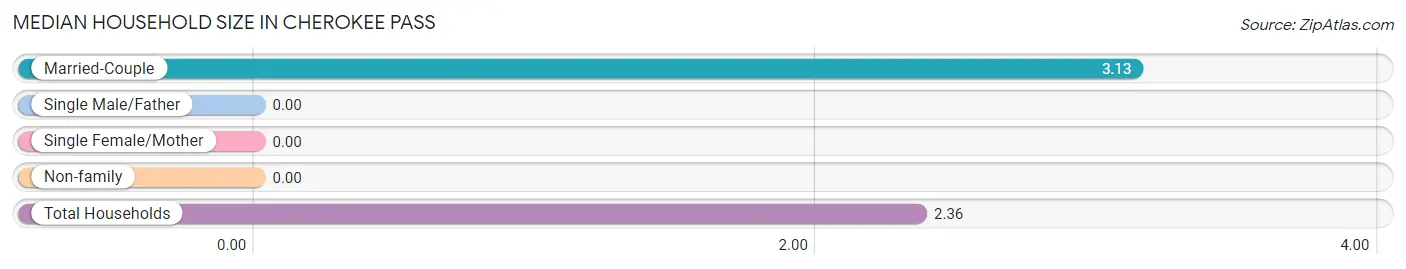
| Household Type | # Households | Household Size |
| Married-Couple | 53 (63.9%) | 3.13 |
| Single Male/Father | 0 (0.0%) | - |
| Single Female/Mother | 0 (0.0%) | - |
| Non-family | 30 (36.1%) | - |
| Total Households | 83 (100.0%) | 2.36 |
Household Size by Marriage Status in Cherokee Pass
Out of a total of 83 households in Cherokee Pass, 53 (63.9%) are family households, while 30 (36.1%) are nonfamily households. The most numerous type of family households are 4-person households, comprising 22, and the most common type of nonfamily households are 1-person households, comprising 30.
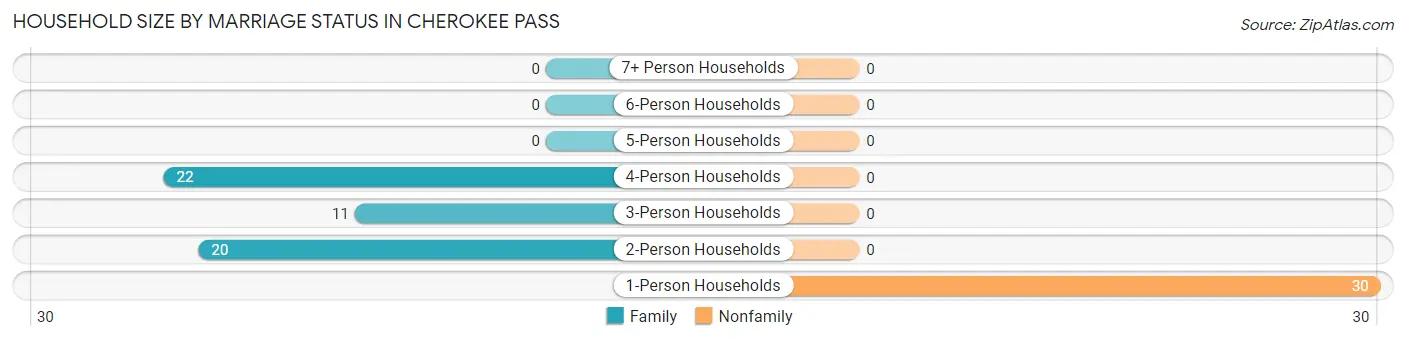
| Household Size | Family Households | Nonfamily Households |
| 1-Person Households | - | 30 (36.1%) |
| 2-Person Households | 20 (24.1%) | 0 (0.0%) |
| 3-Person Households | 11 (13.3%) | 0 (0.0%) |
| 4-Person Households | 22 (26.5%) | 0 (0.0%) |
| 5-Person Households | 0 (0.0%) | 0 (0.0%) |
| 6-Person Households | 0 (0.0%) | 0 (0.0%) |
| 7+ Person Households | 0 (0.0%) | 0 (0.0%) |
| Total | 53 (63.9%) | 30 (36.1%) |
Female Fertility in Cherokee Pass
Fertility by Age in Cherokee Pass
| Age Bracket | Women with Births | Births / 1,000 Women |
| 15 to 19 years | 0 (0.0%) | 0.0 |
| 20 to 34 years | 0 (0.0%) | 0.0 |
| 35 to 50 years | 0 (0.0%) | 0.0 |
| Total | 0 (0.0%) | 0.0 |
Fertility by Age by Marriage Status in Cherokee Pass
| Age Bracket | Married | Unmarried |
| 15 to 19 years | 0 (0.0%) | 0 (0.0%) |
| 20 to 34 years | 0 (0.0%) | 0 (0.0%) |
| 35 to 50 years | 0 (0.0%) | 0 (0.0%) |
| Total | 0 (0.0%) | 0 (0.0%) |
Fertility by Education in Cherokee Pass
| Educational Attainment | Women with Births | Births / 1,000 Women |
| Less than High School | 0 (0.0%) | 0.0 |
| High School Diploma | 0 (0.0%) | 0.0 |
| College or Associate's Degree | 0 (0.0%) | 0.0 |
| Bachelor's Degree | 0 (0.0%) | 0.0 |
| Graduate Degree | 0 (0.0%) | 0.0 |
| Total | 0 (0.0%) | 0.0 |
Fertility by Education by Marriage Status in Cherokee Pass
| Educational Attainment | Married | Unmarried |
| Less than High School | 0 (0.0%) | 0 (0.0%) |
| High School Diploma | 0 (0.0%) | 0 (0.0%) |
| College or Associate's Degree | 0 (0.0%) | 0 (0.0%) |
| Bachelor's Degree | 0 (0.0%) | 0 (0.0%) |
| Graduate Degree | 0 (0.0%) | 0 (0.0%) |
| Total | 0 (0.0%) | 0 (0.0%) |
Employment Characteristics in Cherokee Pass
Employment by Class of Employer in Cherokee Pass
Among the 117 employed individuals in Cherokee Pass, private company employees (83 | 70.9%), not-for-profit organizations (19 | 16.2%), and self-employed (incorporated) (11 | 9.4%) make up the most common classes of employment.
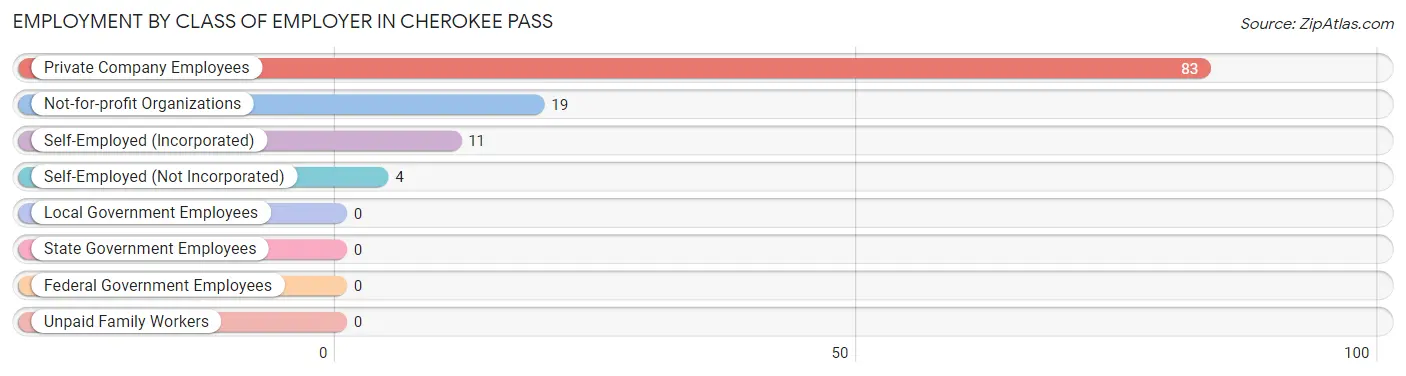
| Employer Class | # Employees | % Employees |
| Private Company Employees | 83 | 70.9% |
| Self-Employed (Incorporated) | 11 | 9.4% |
| Self-Employed (Not Incorporated) | 4 | 3.4% |
| Not-for-profit Organizations | 19 | 16.2% |
| Local Government Employees | 0 | 0.0% |
| State Government Employees | 0 | 0.0% |
| Federal Government Employees | 0 | 0.0% |
| Unpaid Family Workers | 0 | 0.0% |
| Total | 117 | 100.0% |
Employment Status by Age in Cherokee Pass
According to the labor force statistics for Cherokee Pass, out of the total population over 16 years of age (164), 75.6% or 124 individuals are in the labor force, with 5.6% or 7 of them unemployed. The age group with the highest labor force participation rate is 16 to 19 years, with 100.0% or 6 individuals in the labor force. Within the labor force, the 35 to 44 years age range has the highest percentage of unemployed individuals, with 26.9% or 7 of them being unemployed.
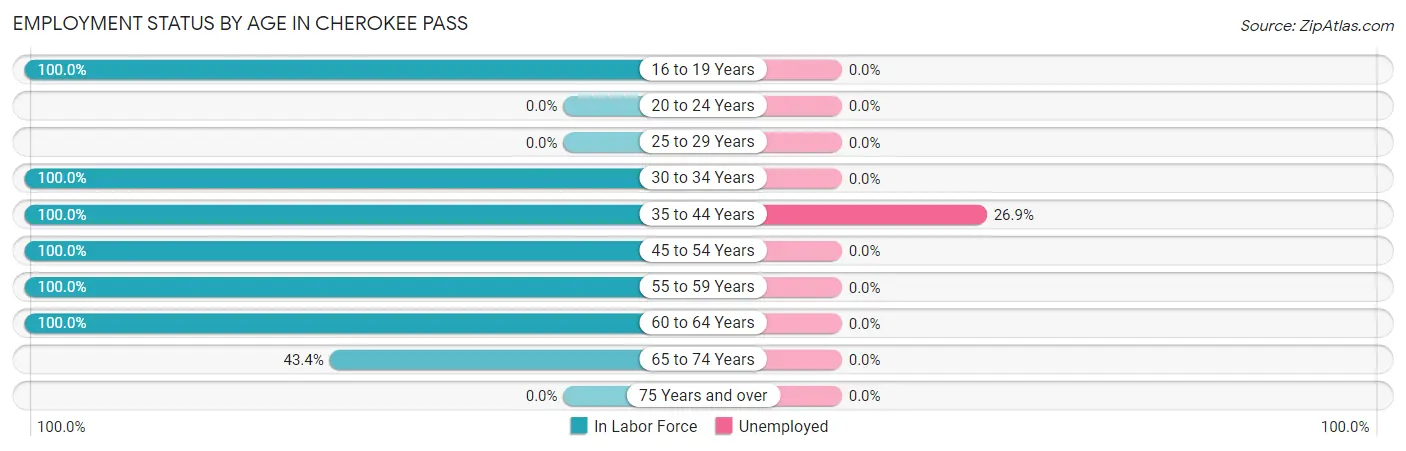
| Age Bracket | In Labor Force | Unemployed |
| 16 to 19 Years | 6 (100.0%) | 0 (0.0%) |
| 20 to 24 Years | 0 (0.0%) | 0 (0.0%) |
| 25 to 29 Years | 0 (0.0%) | 0 (0.0%) |
| 30 to 34 Years | 25 (100.0%) | 0 (0.0%) |
| 35 to 44 Years | 26 (100.0%) | 7 (26.9%) |
| 45 to 54 Years | 13 (100.0%) | 0 (0.0%) |
| 55 to 59 Years | 27 (100.0%) | 0 (0.0%) |
| 60 to 64 Years | 4 (100.0%) | 0 (0.0%) |
| 65 to 74 Years | 23 (43.4%) | 0 (0.0%) |
| 75 Years and over | 0 (0.0%) | 0 (0.0%) |
| Total | 124 (75.6%) | 7 (5.6%) |
Employment Status by Educational Attainment in Cherokee Pass
According to labor force statistics for Cherokee Pass, 100.0% of individuals (95) out of the total population between 25 and 64 years of age (95) are in the labor force, with 7.4% or 7 of them being unemployed. The group with the highest labor force participation rate are those with the educational attainment of less than high school, with 100.0% or 24 individuals in the labor force. Within the labor force, individuals with less than high school education have the highest percentage of unemployment, with 29.2% or 7 of them being unemployed.
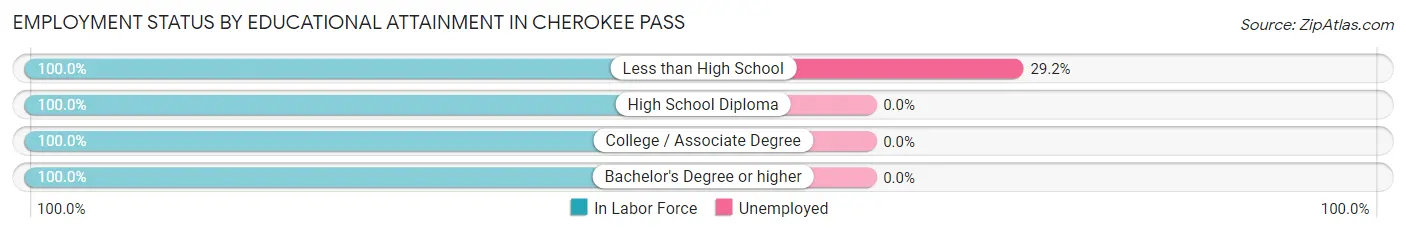
| Educational Attainment | In Labor Force | Unemployed |
| Less than High School | 24 (100.0%) | 7 (29.2%) |
| High School Diploma | 25 (100.0%) | 0 (0.0%) |
| College / Associate Degree | 37 (100.0%) | 0 (0.0%) |
| Bachelor's Degree or higher | 9 (100.0%) | 0 (0.0%) |
| Total | 95 (100.0%) | 7 (7.4%) |
Employment Occupations by Sex in Cherokee Pass
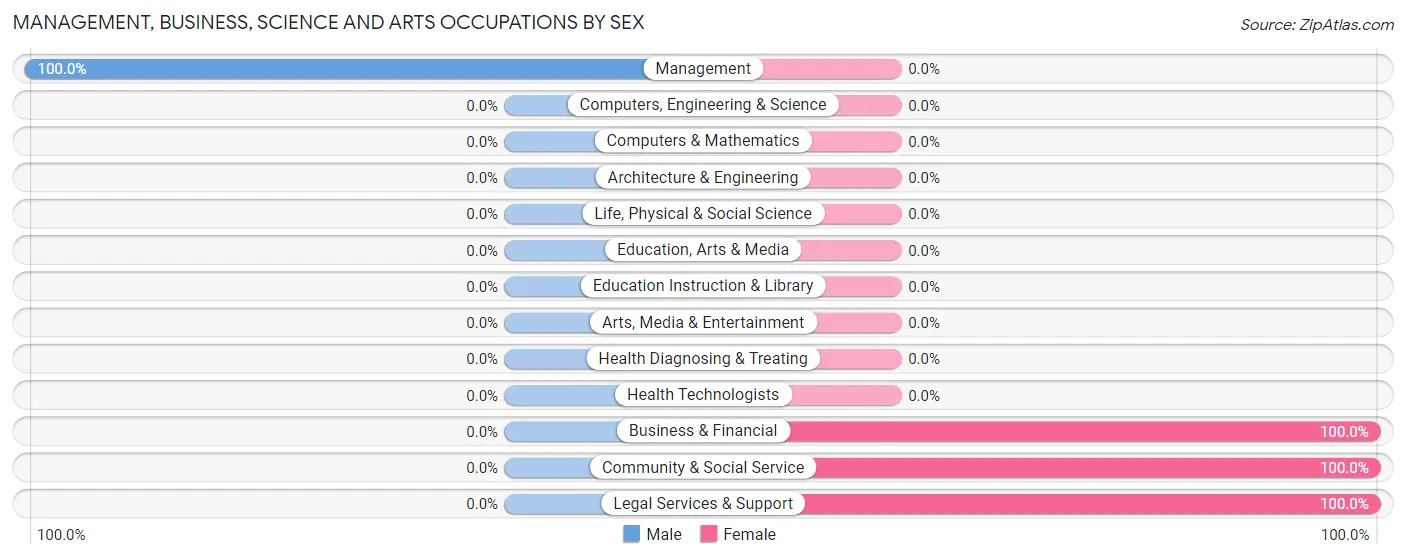
Management, Business, Science and Arts Occupations
The most common Management, Business, Science and Arts occupations in Cherokee Pass are Community & Social Service (12 | 10.3%), Legal Services & Support (12 | 10.3%), Business & Financial (9 | 7.7%), and Management (4 | 3.4%).
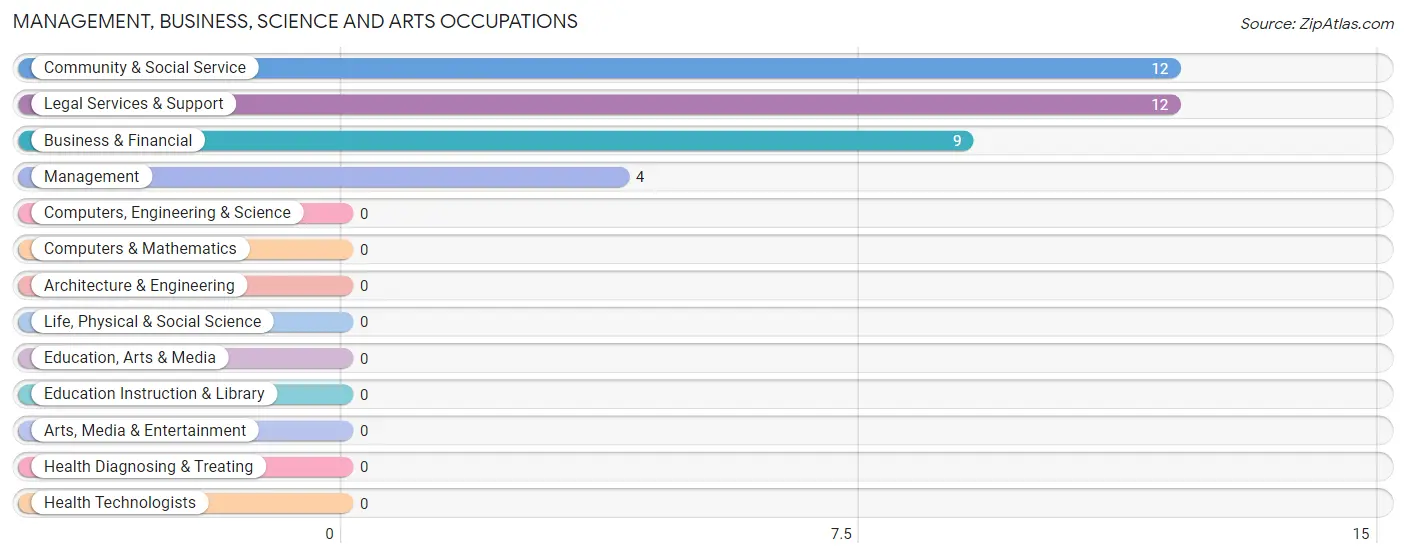
Management, Business, Science and Arts Occupations by Sex
| Occupation | Male | Female |
| Management | 4 (100.0%) | 0 (0.0%) |
| Business & Financial | 0 (0.0%) | 9 (100.0%) |
| Computers, Engineering & Science | 0 (0.0%) | 0 (0.0%) |
| Computers & Mathematics | 0 (0.0%) | 0 (0.0%) |
| Architecture & Engineering | 0 (0.0%) | 0 (0.0%) |
| Life, Physical & Social Science | 0 (0.0%) | 0 (0.0%) |
| Community & Social Service | 0 (0.0%) | 12 (100.0%) |
| Education, Arts & Media | 0 (0.0%) | 0 (0.0%) |
| Legal Services & Support | 0 (0.0%) | 12 (100.0%) |
| Education Instruction & Library | 0 (0.0%) | 0 (0.0%) |
| Arts, Media & Entertainment | 0 (0.0%) | 0 (0.0%) |
| Health Diagnosing & Treating | 0 (0.0%) | 0 (0.0%) |
| Health Technologists | 0 (0.0%) | 0 (0.0%) |
| Total (Category) | 4 (16.0%) | 21 (84.0%) |
| Total (Overall) | 73 (62.4%) | 44 (37.6%) |
Services Occupations
The most common Services occupations in Cherokee Pass are , and Food Preparation & Serving (10 | 8.6%).
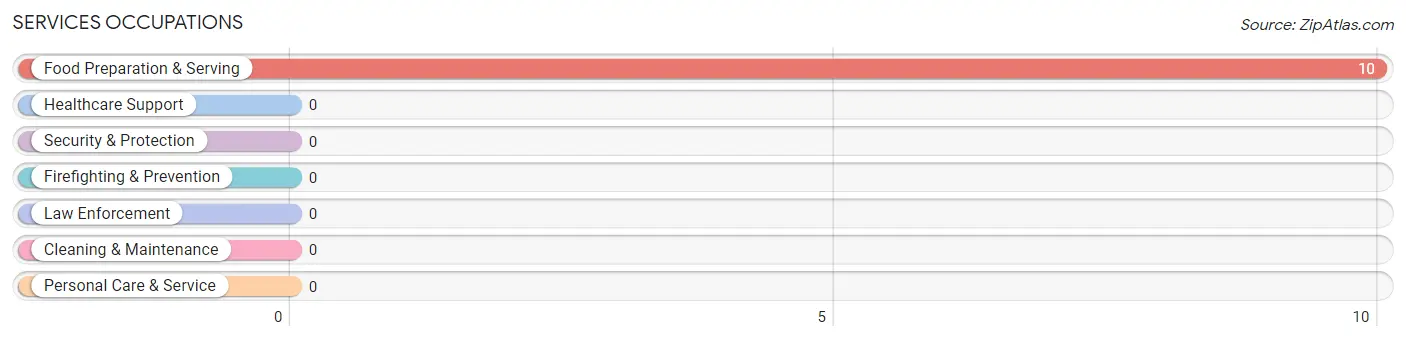
Services Occupations by Sex
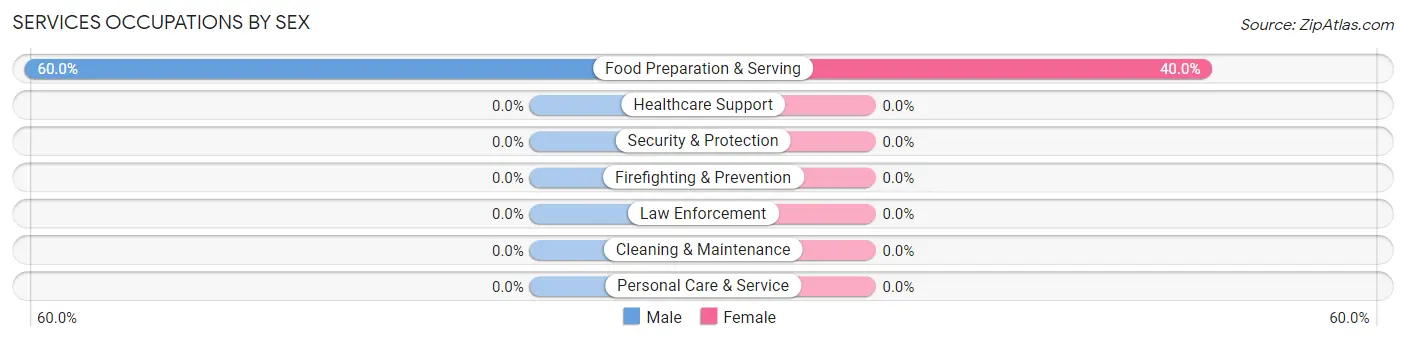
| Occupation | Male | Female |
| Healthcare Support | 0 (0.0%) | 0 (0.0%) |
| Security & Protection | 0 (0.0%) | 0 (0.0%) |
| Firefighting & Prevention | 0 (0.0%) | 0 (0.0%) |
| Law Enforcement | 0 (0.0%) | 0 (0.0%) |
| Food Preparation & Serving | 6 (60.0%) | 4 (40.0%) |
| Cleaning & Maintenance | 0 (0.0%) | 0 (0.0%) |
| Personal Care & Service | 0 (0.0%) | 0 (0.0%) |
| Total (Category) | 6 (60.0%) | 4 (40.0%) |
| Total (Overall) | 73 (62.4%) | 44 (37.6%) |
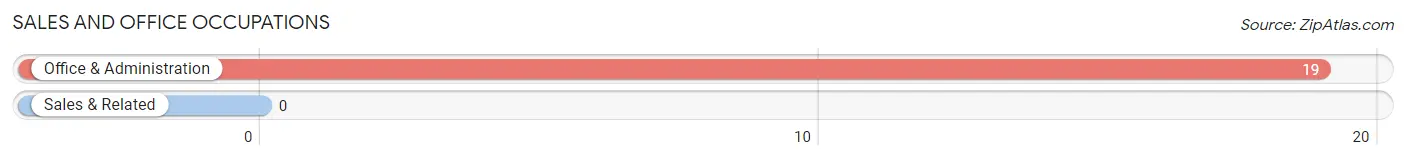
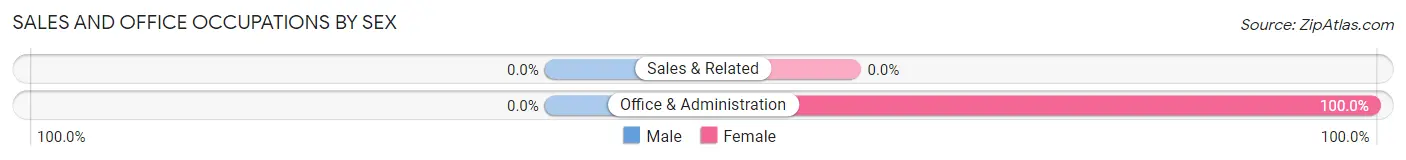
Sales and Office Occupations
The most common Sales and Office occupations in Cherokee Pass are , and Office & Administration (19 | 16.2%).
Sales and Office Occupations by Sex
| Occupation | Male | Female |
| Sales & Related | 0 (0.0%) | 0 (0.0%) |
| Office & Administration | 0 (0.0%) | 19 (100.0%) |
| Total (Category) | 0 (0.0%) | 19 (100.0%) |
| Total (Overall) | 73 (62.4%) | 44 (37.6%) |
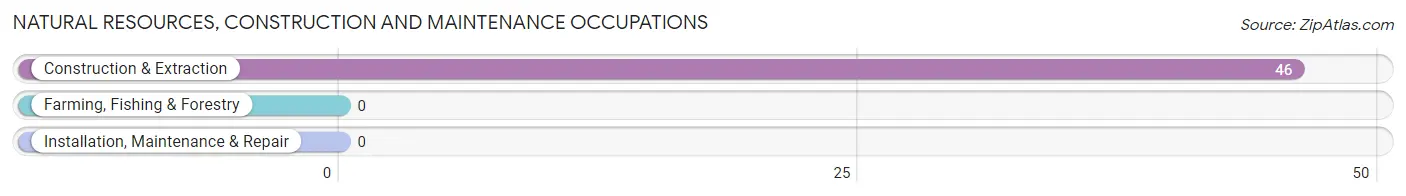
Natural Resources, Construction and Maintenance Occupations
The most common Natural Resources, Construction and Maintenance occupations in Cherokee Pass are , and Construction & Extraction (46 | 39.3%).
Natural Resources, Construction and Maintenance Occupations by Sex
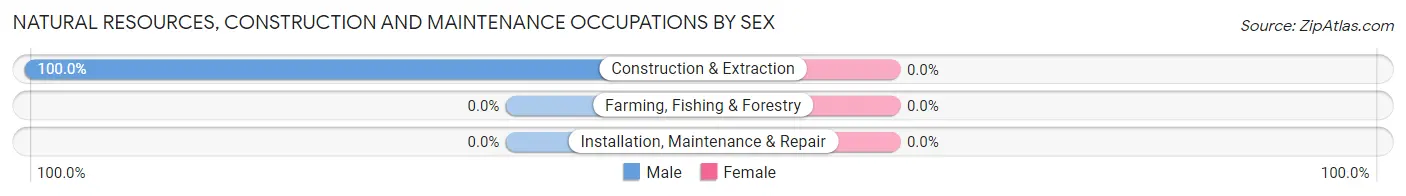
| Occupation | Male | Female |
| Farming, Fishing & Forestry | 0 (0.0%) | 0 (0.0%) |
| Construction & Extraction | 46 (100.0%) | 0 (0.0%) |
| Installation, Maintenance & Repair | 0 (0.0%) | 0 (0.0%) |
| Total (Category) | 46 (100.0%) | 0 (0.0%) |
| Total (Overall) | 73 (62.4%) | 44 (37.6%) |
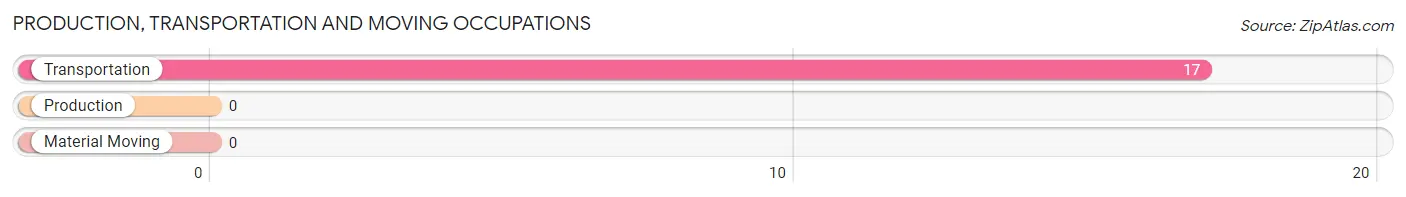
Production, Transportation and Moving Occupations
The most common Production, Transportation and Moving occupations in Cherokee Pass are , and Transportation (17 | 14.5%).
Production, Transportation and Moving Occupations by Sex
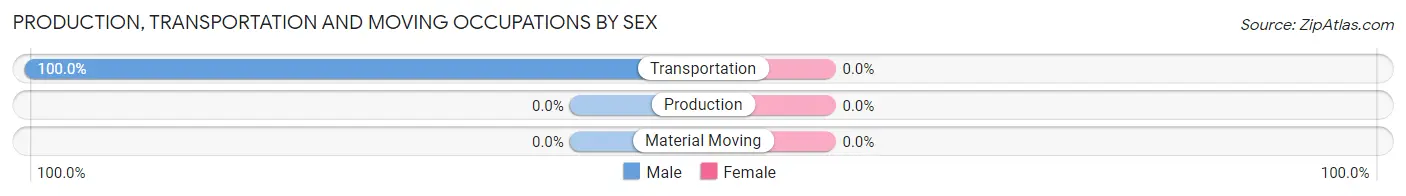
| Occupation | Male | Female |
| Production | 0 (0.0%) | 0 (0.0%) |
| Transportation | 17 (100.0%) | 0 (0.0%) |
| Material Moving | 0 (0.0%) | 0 (0.0%) |
| Total (Category) | 17 (100.0%) | 0 (0.0%) |
| Total (Overall) | 73 (62.4%) | 44 (37.6%) |
Employment Industries by Sex in Cherokee Pass
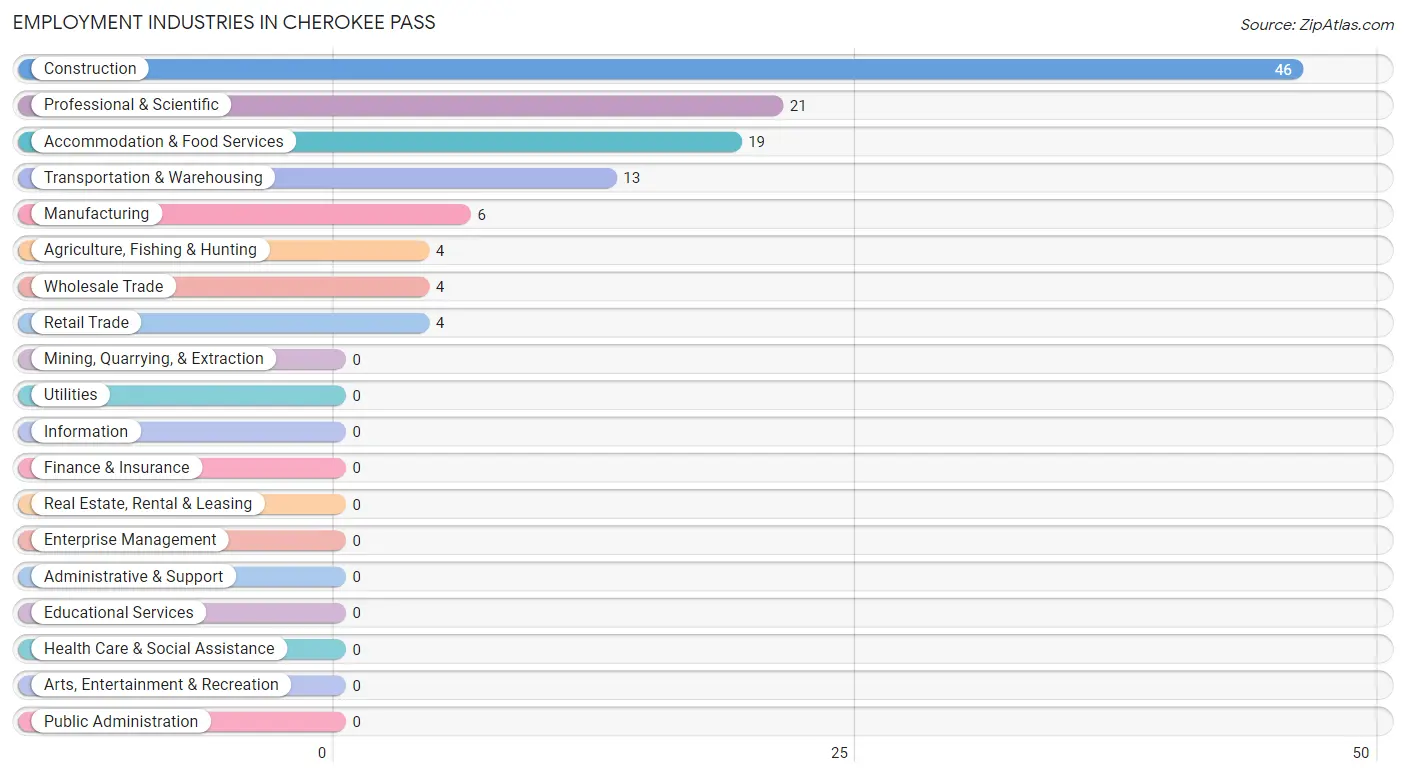
Employment Industries in Cherokee Pass
The major employment industries in Cherokee Pass include Construction (46 | 39.3%), Professional & Scientific (21 | 17.9%), Accommodation & Food Services (19 | 16.2%), Transportation & Warehousing (13 | 11.1%), and Manufacturing (6 | 5.1%).
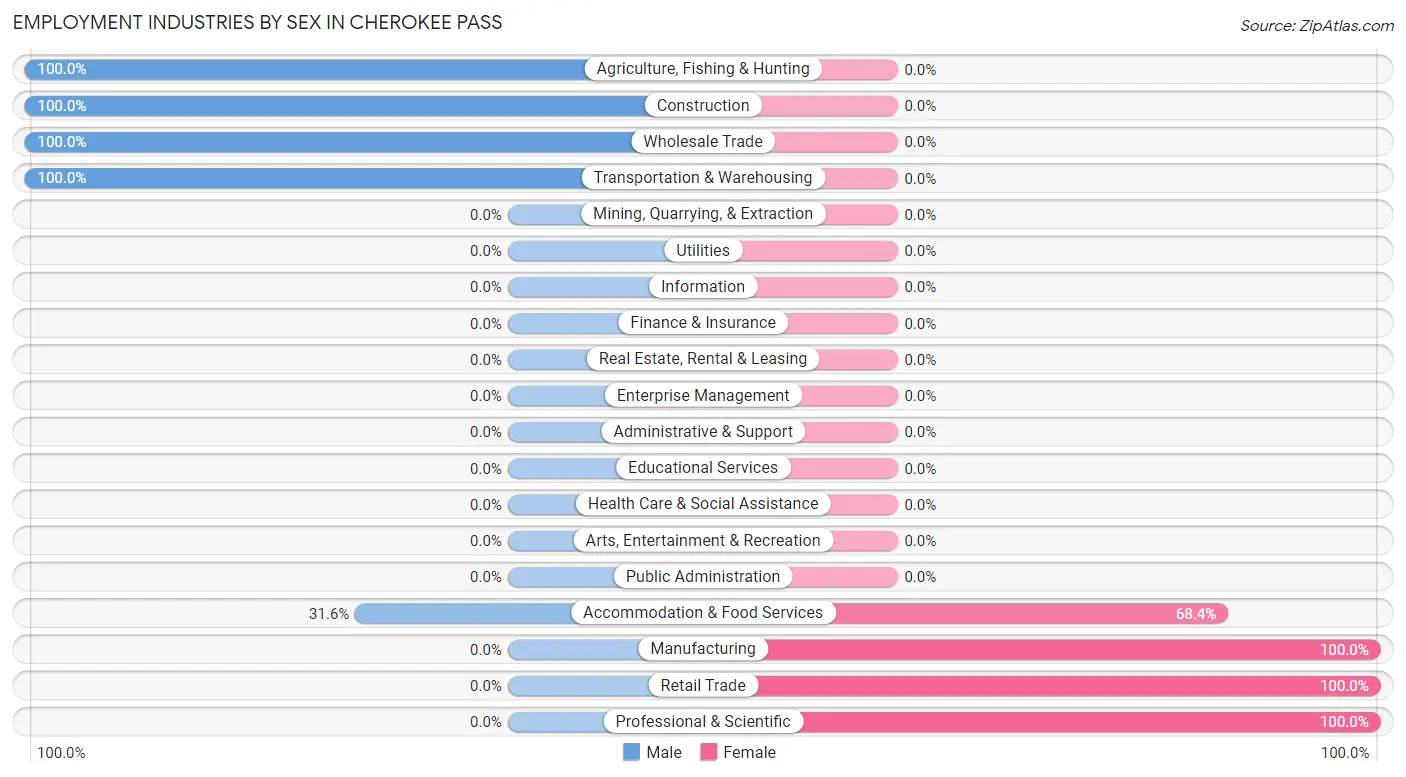
Employment Industries by Sex in Cherokee Pass
The Cherokee Pass industries that see more men than women are Agriculture, Fishing & Hunting (100.0%), Construction (100.0%), and Wholesale Trade (100.0%), whereas the industries that tend to have a higher number of women are Manufacturing (100.0%), Retail Trade (100.0%), and Professional & Scientific (100.0%).
| Industry | Male | Female |
| Agriculture, Fishing & Hunting | 4 (100.0%) | 0 (0.0%) |
| Mining, Quarrying, & Extraction | 0 (0.0%) | 0 (0.0%) |
| Construction | 46 (100.0%) | 0 (0.0%) |
| Manufacturing | 0 (0.0%) | 6 (100.0%) |
| Wholesale Trade | 4 (100.0%) | 0 (0.0%) |
| Retail Trade | 0 (0.0%) | 4 (100.0%) |
| Transportation & Warehousing | 13 (100.0%) | 0 (0.0%) |
| Utilities | 0 (0.0%) | 0 (0.0%) |
| Information | 0 (0.0%) | 0 (0.0%) |
| Finance & Insurance | 0 (0.0%) | 0 (0.0%) |
| Real Estate, Rental & Leasing | 0 (0.0%) | 0 (0.0%) |
| Professional & Scientific | 0 (0.0%) | 21 (100.0%) |
| Enterprise Management | 0 (0.0%) | 0 (0.0%) |
| Administrative & Support | 0 (0.0%) | 0 (0.0%) |
| Educational Services | 0 (0.0%) | 0 (0.0%) |
| Health Care & Social Assistance | 0 (0.0%) | 0 (0.0%) |
| Arts, Entertainment & Recreation | 0 (0.0%) | 0 (0.0%) |
| Accommodation & Food Services | 6 (31.6%) | 13 (68.4%) |
| Public Administration | 0 (0.0%) | 0 (0.0%) |
| Total | 73 (62.4%) | 44 (37.6%) |
Education in Cherokee Pass
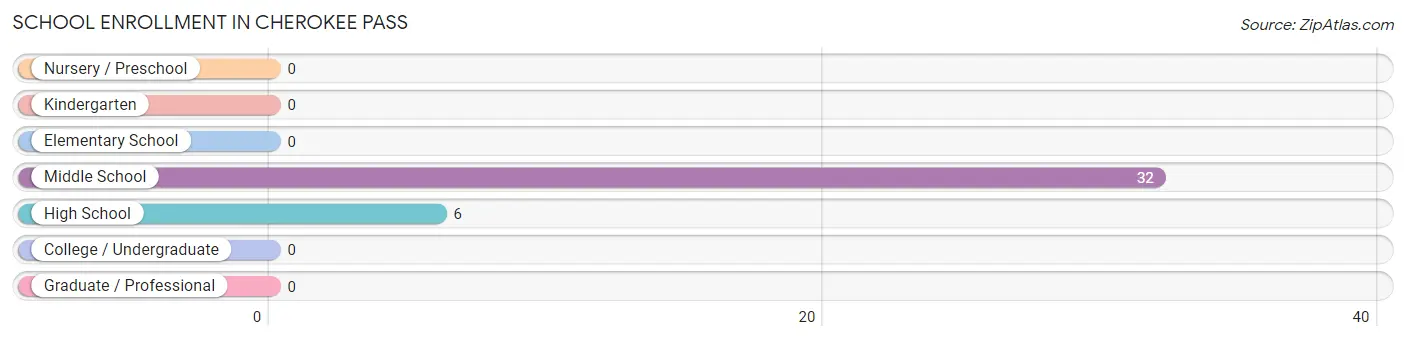
School Enrollment in Cherokee Pass
The most common levels of schooling among the 38 students in Cherokee Pass are middle school (32 | 84.2%), and high school (6 | 15.8%).
| School Level | # Students | % Students |
| Nursery / Preschool | 0 | 0.0% |
| Kindergarten | 0 | 0.0% |
| Elementary School | 0 | 0.0% |
| Middle School | 32 | 84.2% |
| High School | 6 | 15.8% |
| College / Undergraduate | 0 | 0.0% |
| Graduate / Professional | 0 | 0.0% |
| Total | 38 | 100.0% |
School Enrollment by Age by Funding Source in Cherokee Pass
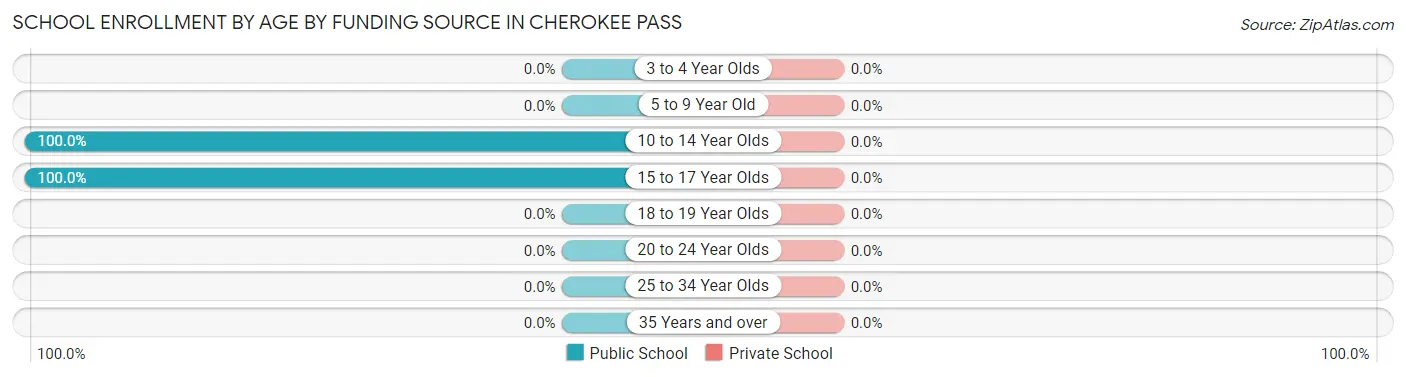
| Age Bracket | Public School | Private School |
| 3 to 4 Year Olds | 0 (0.0%) | 0 (0.0%) |
| 5 to 9 Year Old | 0 (0.0%) | 0 (0.0%) |
| 10 to 14 Year Olds | 32 (100.0%) | 0 (0.0%) |
| 15 to 17 Year Olds | 6 (100.0%) | 0 (0.0%) |
| 18 to 19 Year Olds | 0 (0.0%) | 0 (0.0%) |
| 20 to 24 Year Olds | 0 (0.0%) | 0 (0.0%) |
| 25 to 34 Year Olds | 0 (0.0%) | 0 (0.0%) |
| 35 Years and over | 0 (0.0%) | 0 (0.0%) |
| Total | 38 (100.0%) | 0 (0.0%) |
Educational Attainment by Field of Study in Cherokee Pass
Education (14 | 60.9%), and business (9 | 39.1%) are the most common fields of study among 23 individuals in Cherokee Pass who have obtained a bachelor's degree or higher.
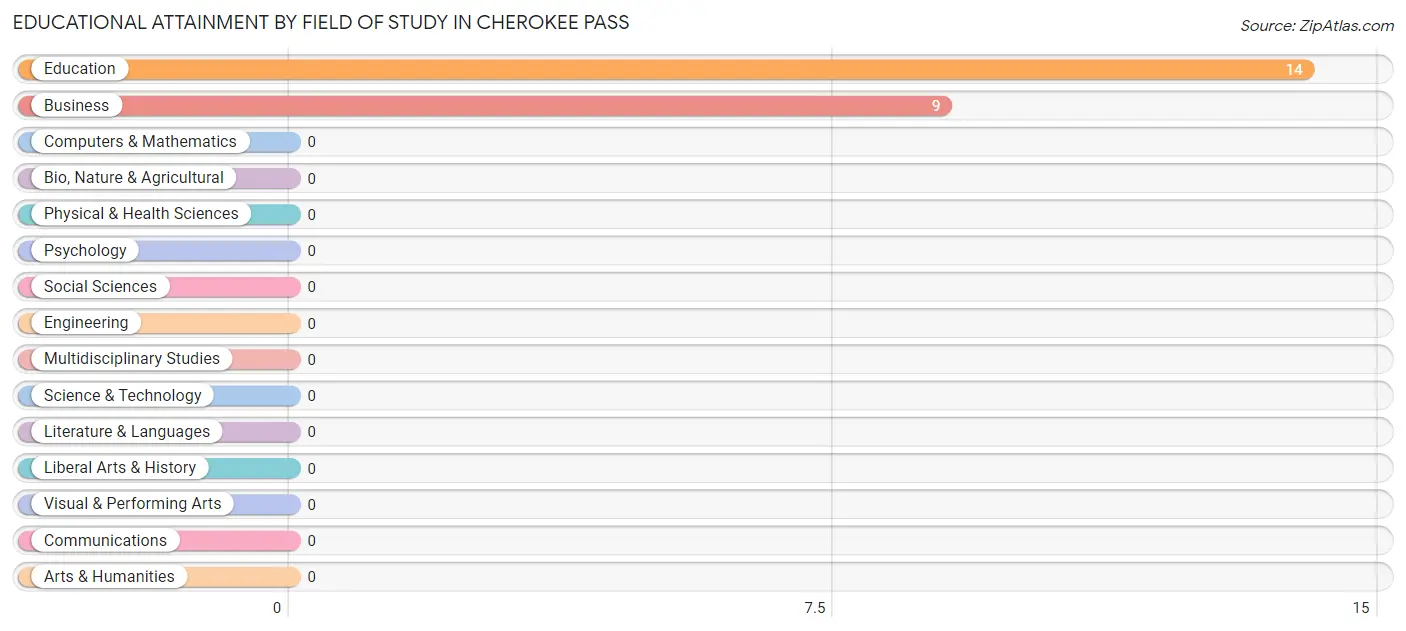
| Field of Study | # Graduates | % Graduates |
| Computers & Mathematics | 0 | 0.0% |
| Bio, Nature & Agricultural | 0 | 0.0% |
| Physical & Health Sciences | 0 | 0.0% |
| Psychology | 0 | 0.0% |
| Social Sciences | 0 | 0.0% |
| Engineering | 0 | 0.0% |
| Multidisciplinary Studies | 0 | 0.0% |
| Science & Technology | 0 | 0.0% |
| Business | 9 | 39.1% |
| Education | 14 | 60.9% |
| Literature & Languages | 0 | 0.0% |
| Liberal Arts & History | 0 | 0.0% |
| Visual & Performing Arts | 0 | 0.0% |
| Communications | 0 | 0.0% |
| Arts & Humanities | 0 | 0.0% |
| Total | 23 | 100.0% |
Transportation & Commute in Cherokee Pass
Vehicle Availability by Sex in Cherokee Pass
The most prevalent vehicle ownership categories in Cherokee Pass are males with 4 vehicles (40, accounting for 54.8%) and females with 4 vehicles (12, making up 90.9%).
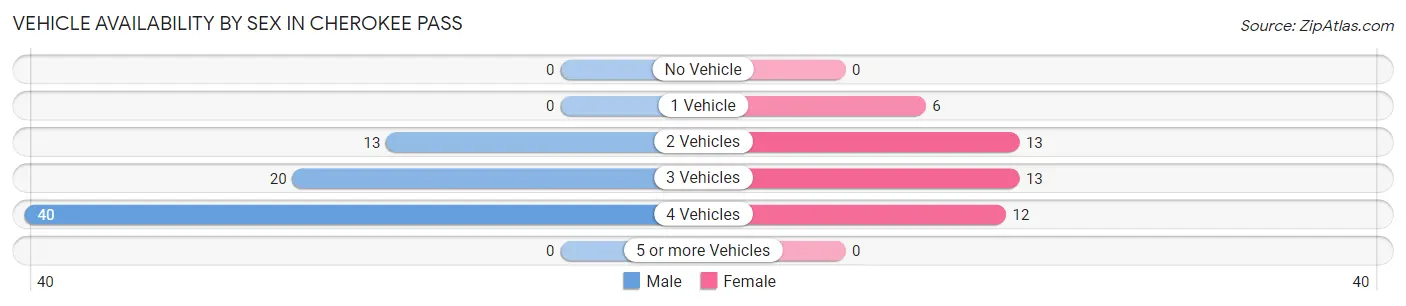
| Vehicles Available | Male | Female |
| No Vehicle | 0 (0.0%) | 0 (0.0%) |
| 1 Vehicle | 0 (0.0%) | 6 (13.6%) |
| 2 Vehicles | 13 (17.8%) | 13 (29.5%) |
| 3 Vehicles | 20 (27.4%) | 13 (29.5%) |
| 4 Vehicles | 40 (54.8%) | 12 (27.3%) |
| 5 or more Vehicles | 0 (0.0%) | 0 (0.0%) |
| Total | 73 (100.0%) | 44 (100.0%) |
Commute Time in Cherokee Pass
The most frequently occuring commute durations in Cherokee Pass are 20 to 24 minutes (36 commuters, 31.9%), 5 to 9 minutes (23 commuters, 20.3%), and 90 or more minutes (19 commuters, 16.8%).
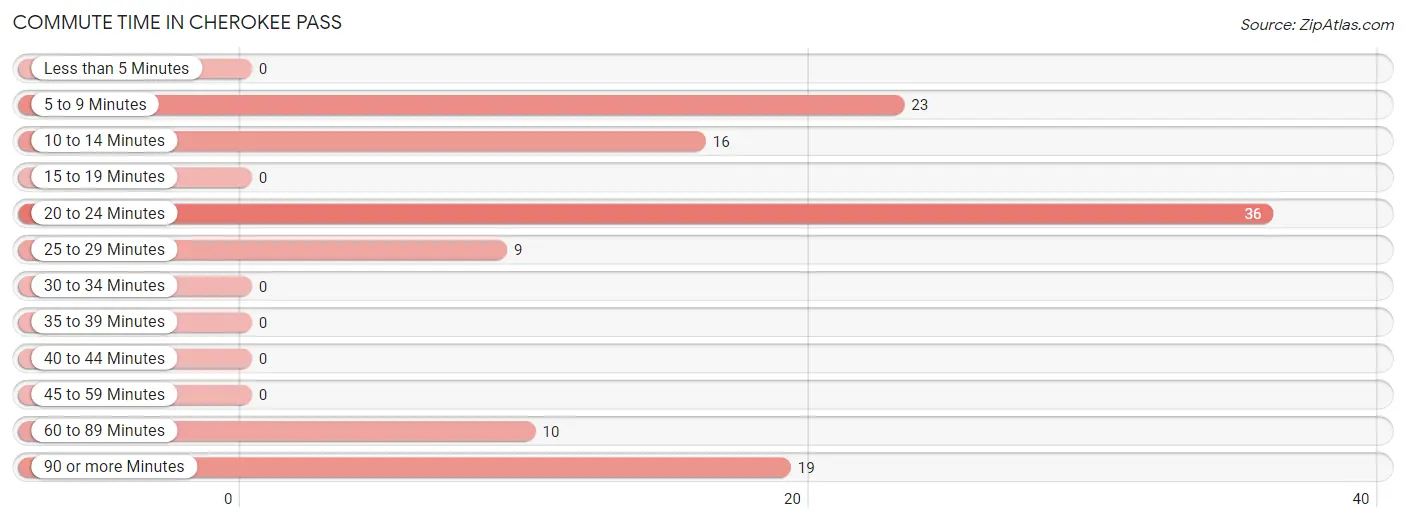
| Commute Time | # Commuters | % Commuters |
| Less than 5 Minutes | 0 | 0.0% |
| 5 to 9 Minutes | 23 | 20.3% |
| 10 to 14 Minutes | 16 | 14.2% |
| 15 to 19 Minutes | 0 | 0.0% |
| 20 to 24 Minutes | 36 | 31.9% |
| 25 to 29 Minutes | 9 | 8.0% |
| 30 to 34 Minutes | 0 | 0.0% |
| 35 to 39 Minutes | 0 | 0.0% |
| 40 to 44 Minutes | 0 | 0.0% |
| 45 to 59 Minutes | 0 | 0.0% |
| 60 to 89 Minutes | 10 | 8.8% |
| 90 or more Minutes | 19 | 16.8% |
Commute Time by Sex in Cherokee Pass
The most common commute times in Cherokee Pass are 20 to 24 minutes (36 commuters, 52.2%) for males and 10 to 14 minutes (16 commuters, 36.4%) for females.
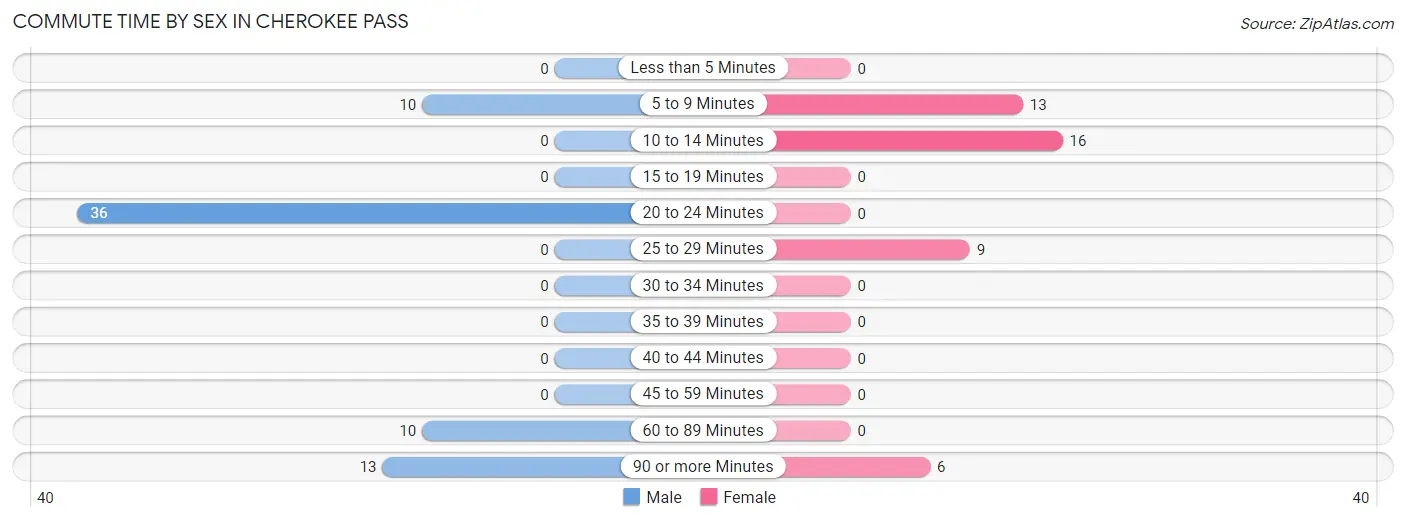
| Commute Time | Male | Female |
| Less than 5 Minutes | 0 (0.0%) | 0 (0.0%) |
| 5 to 9 Minutes | 10 (14.5%) | 13 (29.5%) |
| 10 to 14 Minutes | 0 (0.0%) | 16 (36.4%) |
| 15 to 19 Minutes | 0 (0.0%) | 0 (0.0%) |
| 20 to 24 Minutes | 36 (52.2%) | 0 (0.0%) |
| 25 to 29 Minutes | 0 (0.0%) | 9 (20.4%) |
| 30 to 34 Minutes | 0 (0.0%) | 0 (0.0%) |
| 35 to 39 Minutes | 0 (0.0%) | 0 (0.0%) |
| 40 to 44 Minutes | 0 (0.0%) | 0 (0.0%) |
| 45 to 59 Minutes | 0 (0.0%) | 0 (0.0%) |
| 60 to 89 Minutes | 10 (14.5%) | 0 (0.0%) |
| 90 or more Minutes | 13 (18.8%) | 6 (13.6%) |
Time of Departure to Work by Sex in Cherokee Pass
The most frequent times of departure to work in Cherokee Pass are 8:00 AM to 8:29 AM (36, 52.2%) for males and 8:30 AM to 8:59 AM (25, 56.8%) for females.
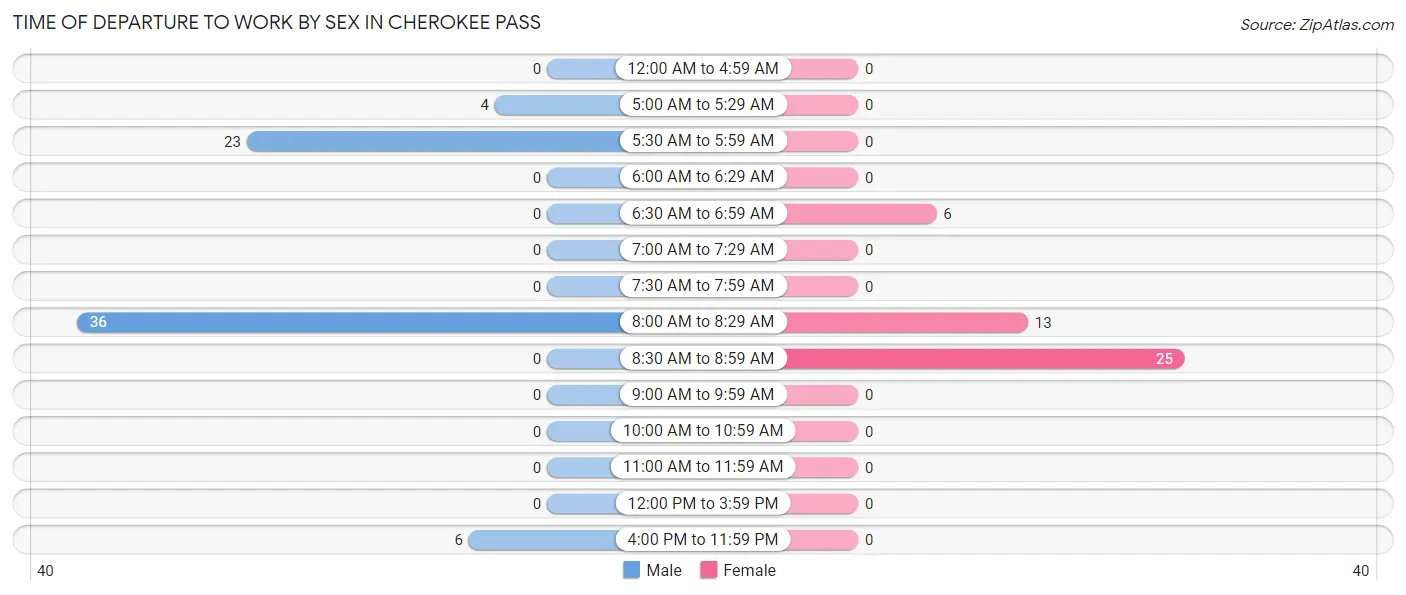
| Time of Departure | Male | Female |
| 12:00 AM to 4:59 AM | 0 (0.0%) | 0 (0.0%) |
| 5:00 AM to 5:29 AM | 4 (5.8%) | 0 (0.0%) |
| 5:30 AM to 5:59 AM | 23 (33.3%) | 0 (0.0%) |
| 6:00 AM to 6:29 AM | 0 (0.0%) | 0 (0.0%) |
| 6:30 AM to 6:59 AM | 0 (0.0%) | 6 (13.6%) |
| 7:00 AM to 7:29 AM | 0 (0.0%) | 0 (0.0%) |
| 7:30 AM to 7:59 AM | 0 (0.0%) | 0 (0.0%) |
| 8:00 AM to 8:29 AM | 36 (52.2%) | 13 (29.5%) |
| 8:30 AM to 8:59 AM | 0 (0.0%) | 25 (56.8%) |
| 9:00 AM to 9:59 AM | 0 (0.0%) | 0 (0.0%) |
| 10:00 AM to 10:59 AM | 0 (0.0%) | 0 (0.0%) |
| 11:00 AM to 11:59 AM | 0 (0.0%) | 0 (0.0%) |
| 12:00 PM to 3:59 PM | 0 (0.0%) | 0 (0.0%) |
| 4:00 PM to 11:59 PM | 6 (8.7%) | 0 (0.0%) |
| Total | 69 (100.0%) | 44 (100.0%) |
Housing Occupancy in Cherokee Pass
Occupancy by Ownership in Cherokee Pass
Of the total 83 dwellings in Cherokee Pass, owner-occupied units account for 73 (87.9%), while renter-occupied units make up 10 (12.0%).
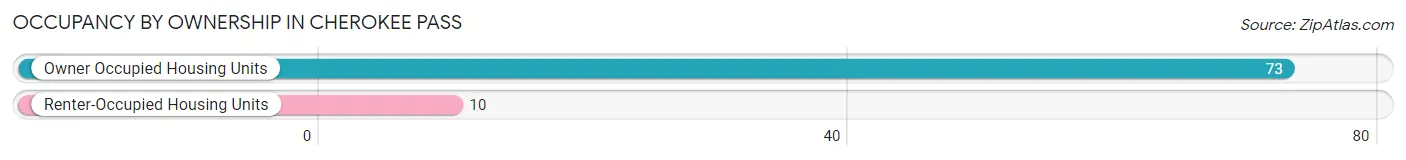
| Occupancy | # Housing Units | % Housing Units |
| Owner Occupied Housing Units | 73 | 87.9% |
| Renter-Occupied Housing Units | 10 | 12.0% |
| Total Occupied Housing Units | 83 | 100.0% |
Occupancy by Household Size in Cherokee Pass
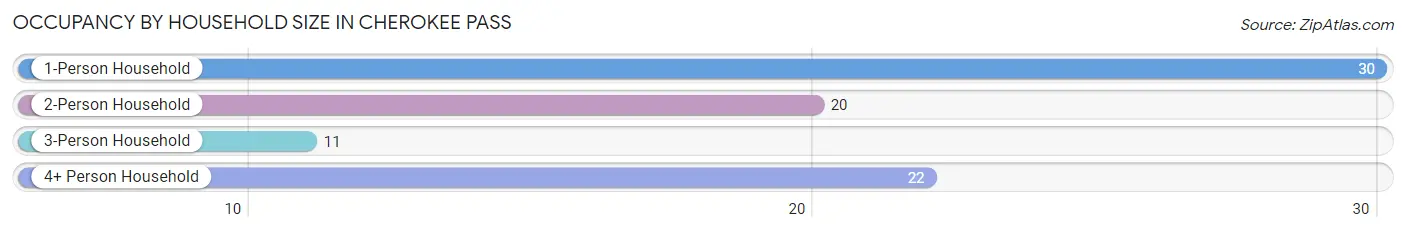
| Household Size | # Housing Units | % Housing Units |
| 1-Person Household | 30 | 36.1% |
| 2-Person Household | 20 | 24.1% |
| 3-Person Household | 11 | 13.3% |
| 4+ Person Household | 22 | 26.5% |
| Total Housing Units | 83 | 100.0% |
Occupancy by Ownership by Household Size in Cherokee Pass
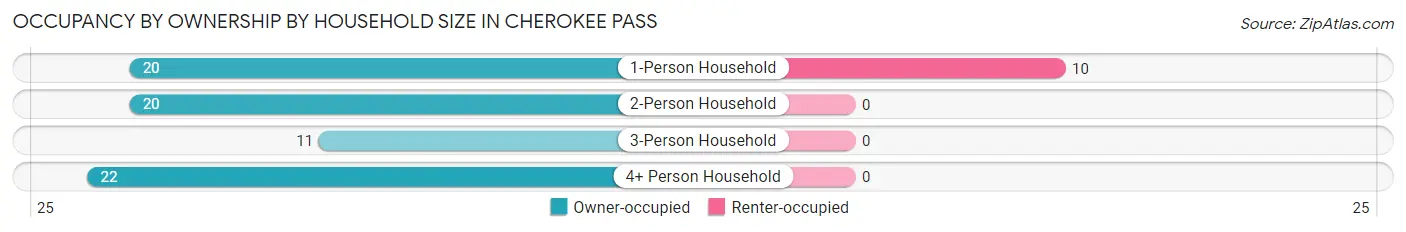
| Household Size | Owner-occupied | Renter-occupied |
| 1-Person Household | 20 (66.7%) | 10 (33.3%) |
| 2-Person Household | 20 (100.0%) | 0 (0.0%) |
| 3-Person Household | 11 (100.0%) | 0 (0.0%) |
| 4+ Person Household | 22 (100.0%) | 0 (0.0%) |
| Total Housing Units | 73 (87.9%) | 10 (12.0%) |
Occupancy by Educational Attainment in Cherokee Pass
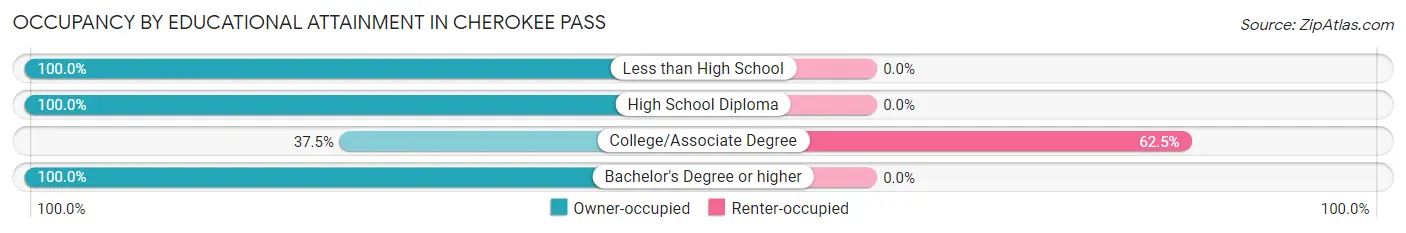
| Household Size | Owner-occupied | Renter-occupied |
| Less than High School | 17 (100.0%) | 0 (0.0%) |
| High School Diploma | 27 (100.0%) | 0 (0.0%) |
| College/Associate Degree | 6 (37.5%) | 10 (62.5%) |
| Bachelor's Degree or higher | 23 (100.0%) | 0 (0.0%) |
Occupancy by Age of Householder in Cherokee Pass
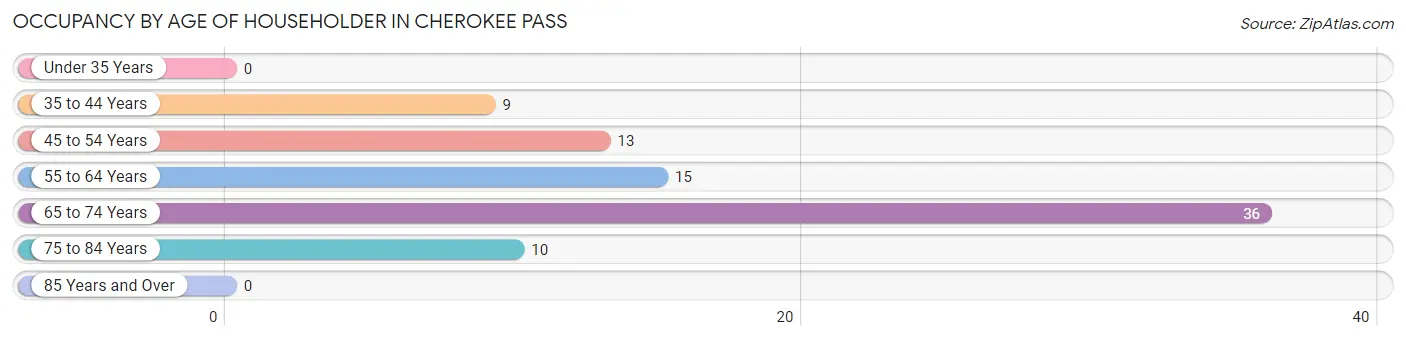
| Age Bracket | # Households | % Households |
| Under 35 Years | 0 | 0.0% |
| 35 to 44 Years | 9 | 10.8% |
| 45 to 54 Years | 13 | 15.7% |
| 55 to 64 Years | 15 | 18.1% |
| 65 to 74 Years | 36 | 43.4% |
| 75 to 84 Years | 10 | 12.0% |
| 85 Years and Over | 0 | 0.0% |
| Total | 83 | 100.0% |
Housing Finances in Cherokee Pass
Median Income by Occupancy in Cherokee Pass
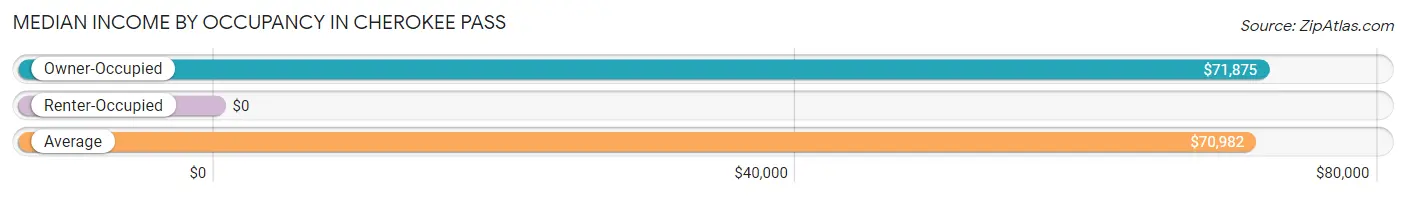
| Occupancy Type | # Households | Median Income |
| Owner-Occupied | 73 (87.9%) | $71,875 |
| Renter-Occupied | 10 (12.0%) | $0 |
| Average | 83 (100.0%) | $70,982 |
Occupancy by Householder Income Bracket in Cherokee Pass
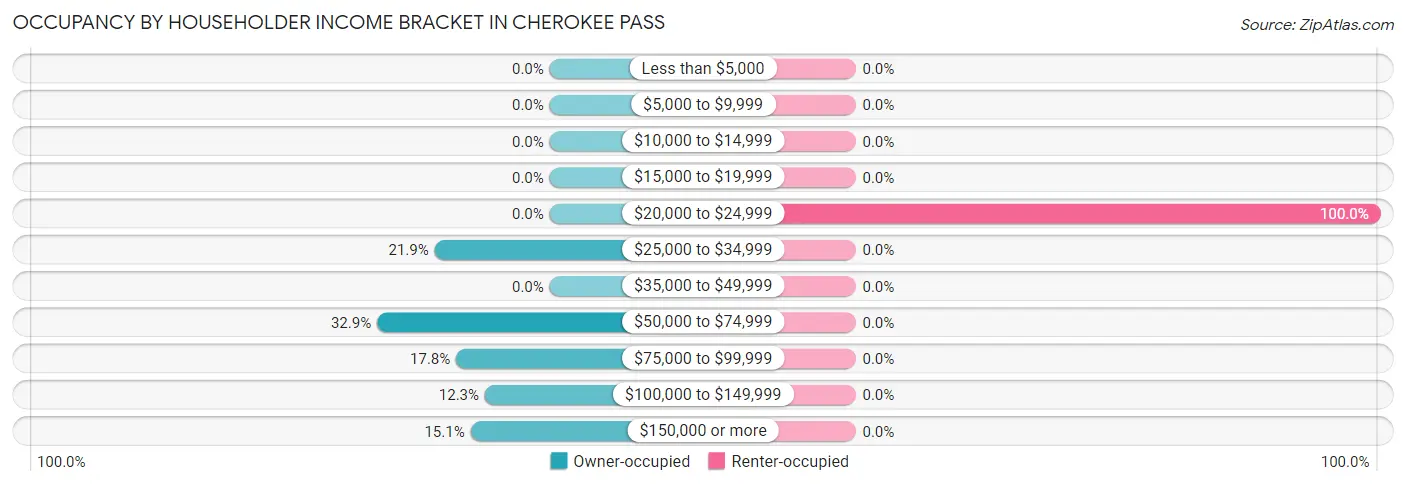
| Income Bracket | Owner-occupied | Renter-occupied |
| Less than $5,000 | 0 (0.0%) | 0 (0.0%) |
| $5,000 to $9,999 | 0 (0.0%) | 0 (0.0%) |
| $10,000 to $14,999 | 0 (0.0%) | 0 (0.0%) |
| $15,000 to $19,999 | 0 (0.0%) | 0 (0.0%) |
| $20,000 to $24,999 | 0 (0.0%) | 10 (100.0%) |
| $25,000 to $34,999 | 16 (21.9%) | 0 (0.0%) |
| $35,000 to $49,999 | 0 (0.0%) | 0 (0.0%) |
| $50,000 to $74,999 | 24 (32.9%) | 0 (0.0%) |
| $75,000 to $99,999 | 13 (17.8%) | 0 (0.0%) |
| $100,000 to $149,999 | 9 (12.3%) | 0 (0.0%) |
| $150,000 or more | 11 (15.1%) | 0 (0.0%) |
| Total | 73 (100.0%) | 10 (100.0%) |
Monthly Housing Cost Tiers in Cherokee Pass
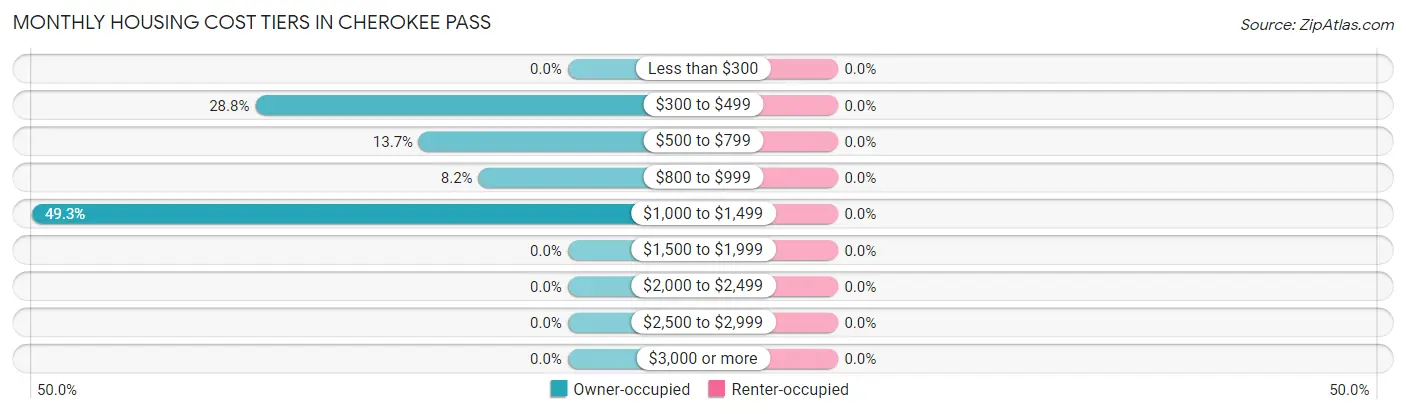
| Monthly Cost | Owner-occupied | Renter-occupied |
| Less than $300 | 0 (0.0%) | 0 (0.0%) |
| $300 to $499 | 21 (28.8%) | 0 (0.0%) |
| $500 to $799 | 10 (13.7%) | 0 (0.0%) |
| $800 to $999 | 6 (8.2%) | 0 (0.0%) |
| $1,000 to $1,499 | 36 (49.3%) | 0 (0.0%) |
| $1,500 to $1,999 | 0 (0.0%) | 0 (0.0%) |
| $2,000 to $2,499 | 0 (0.0%) | 0 (0.0%) |
| $2,500 to $2,999 | 0 (0.0%) | 0 (0.0%) |
| $3,000 or more | 0 (0.0%) | 0 (0.0%) |
| Total | 73 (100.0%) | 10 (100.0%) |
Physical Housing Characteristics in Cherokee Pass
Housing Structures in Cherokee Pass
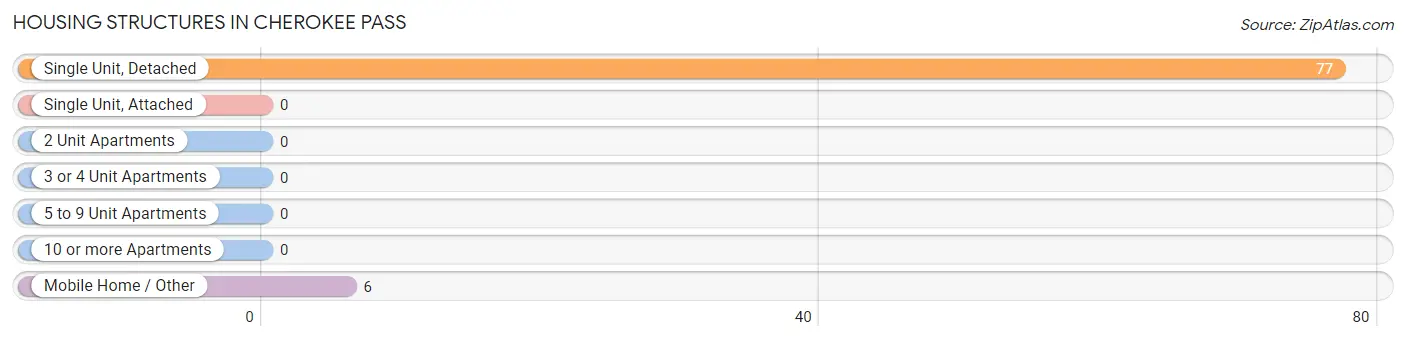
| Structure Type | # Housing Units | % Housing Units |
| Single Unit, Detached | 77 | 92.8% |
| Single Unit, Attached | 0 | 0.0% |
| 2 Unit Apartments | 0 | 0.0% |
| 3 or 4 Unit Apartments | 0 | 0.0% |
| 5 to 9 Unit Apartments | 0 | 0.0% |
| 10 or more Apartments | 0 | 0.0% |
| Mobile Home / Other | 6 | 7.2% |
| Total | 83 | 100.0% |
Housing Structures by Occupancy in Cherokee Pass
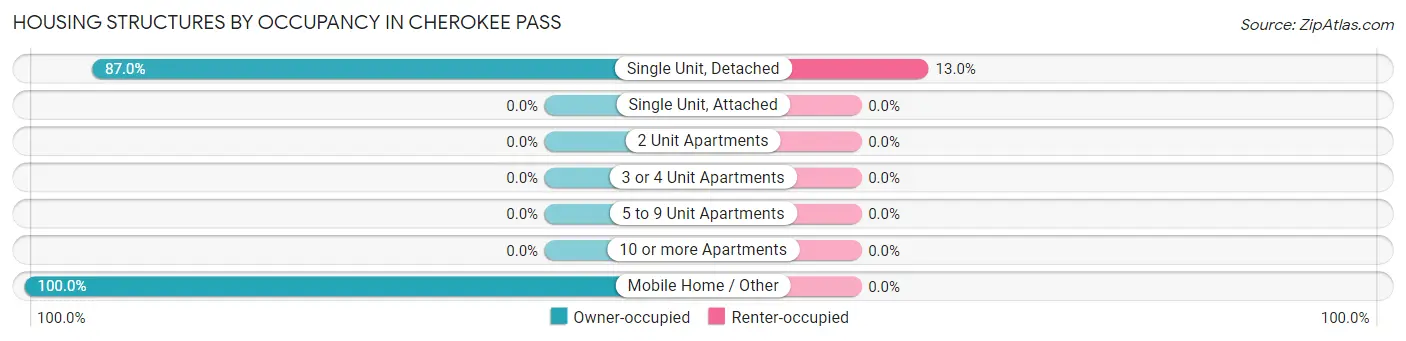
| Structure Type | Owner-occupied | Renter-occupied |
| Single Unit, Detached | 67 (87.0%) | 10 (13.0%) |
| Single Unit, Attached | 0 (0.0%) | 0 (0.0%) |
| 2 Unit Apartments | 0 (0.0%) | 0 (0.0%) |
| 3 or 4 Unit Apartments | 0 (0.0%) | 0 (0.0%) |
| 5 to 9 Unit Apartments | 0 (0.0%) | 0 (0.0%) |
| 10 or more Apartments | 0 (0.0%) | 0 (0.0%) |
| Mobile Home / Other | 6 (100.0%) | 0 (0.0%) |
| Total | 73 (87.9%) | 10 (12.0%) |
Housing Structures by Number of Rooms in Cherokee Pass
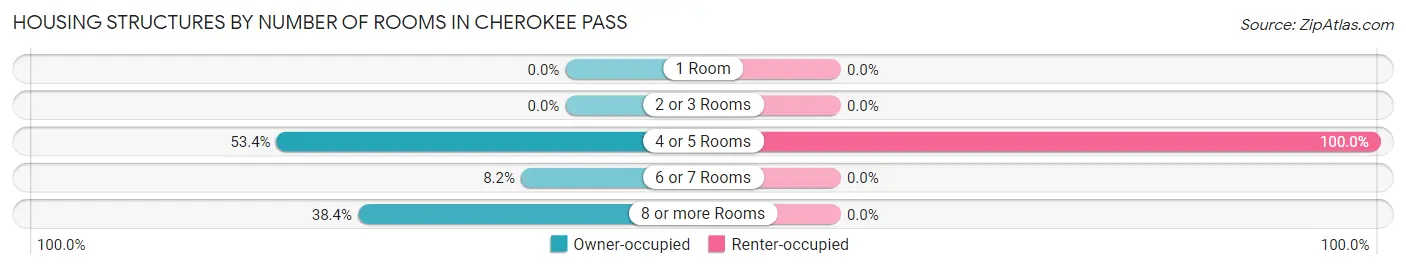
| Number of Rooms | Owner-occupied | Renter-occupied |
| 1 Room | 0 (0.0%) | 0 (0.0%) |
| 2 or 3 Rooms | 0 (0.0%) | 0 (0.0%) |
| 4 or 5 Rooms | 39 (53.4%) | 10 (100.0%) |
| 6 or 7 Rooms | 6 (8.2%) | 0 (0.0%) |
| 8 or more Rooms | 28 (38.4%) | 0 (0.0%) |
| Total | 73 (100.0%) | 10 (100.0%) |
Housing Structure by Heating Type in Cherokee Pass
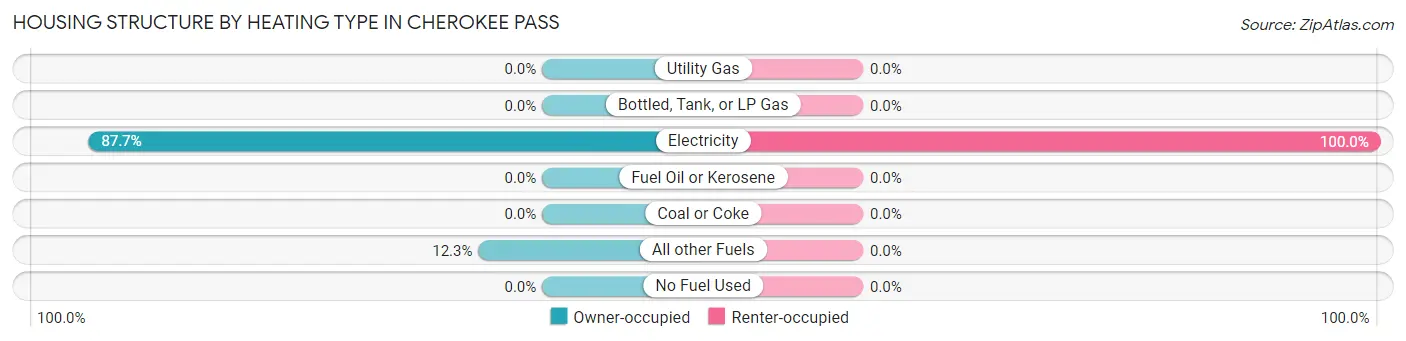
| Heating Type | Owner-occupied | Renter-occupied |
| Utility Gas | 0 (0.0%) | 0 (0.0%) |
| Bottled, Tank, or LP Gas | 0 (0.0%) | 0 (0.0%) |
| Electricity | 64 (87.7%) | 10 (100.0%) |
| Fuel Oil or Kerosene | 0 (0.0%) | 0 (0.0%) |
| Coal or Coke | 0 (0.0%) | 0 (0.0%) |
| All other Fuels | 9 (12.3%) | 0 (0.0%) |
| No Fuel Used | 0 (0.0%) | 0 (0.0%) |
| Total | 73 (100.0%) | 10 (100.0%) |
Household Vehicle Usage in Cherokee Pass
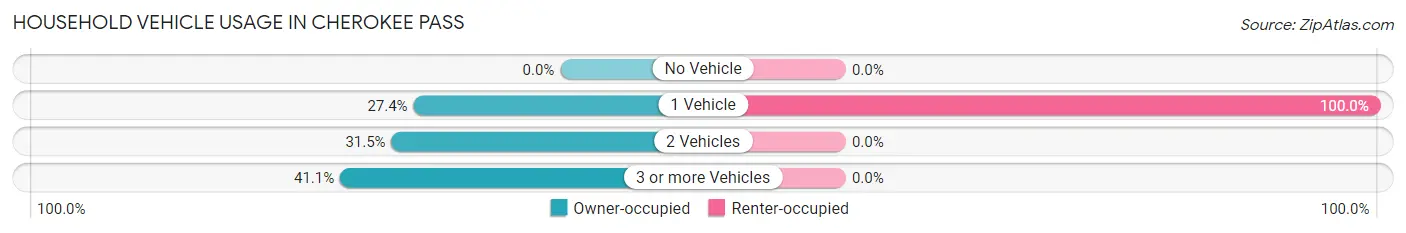
| Vehicles per Household | Owner-occupied | Renter-occupied |
| No Vehicle | 0 (0.0%) | 0 (0.0%) |
| 1 Vehicle | 20 (27.4%) | 10 (100.0%) |
| 2 Vehicles | 23 (31.5%) | 0 (0.0%) |
| 3 or more Vehicles | 30 (41.1%) | 0 (0.0%) |
| Total | 73 (100.0%) | 10 (100.0%) |
Real Estate & Mortgages in Cherokee Pass
Real Estate and Mortgage Overview in Cherokee Pass
| Characteristic | Without Mortgage | With Mortgage |
| Housing Units | 31 | 42 |
| Median Property Value | $322,500 | $167,000 |
| Median Household Income | - | - |
| Monthly Housing Costs | $474 | $0 |
| Real Estate Taxes | $2,281 | $0 |
Property Value by Mortgage Status in Cherokee Pass
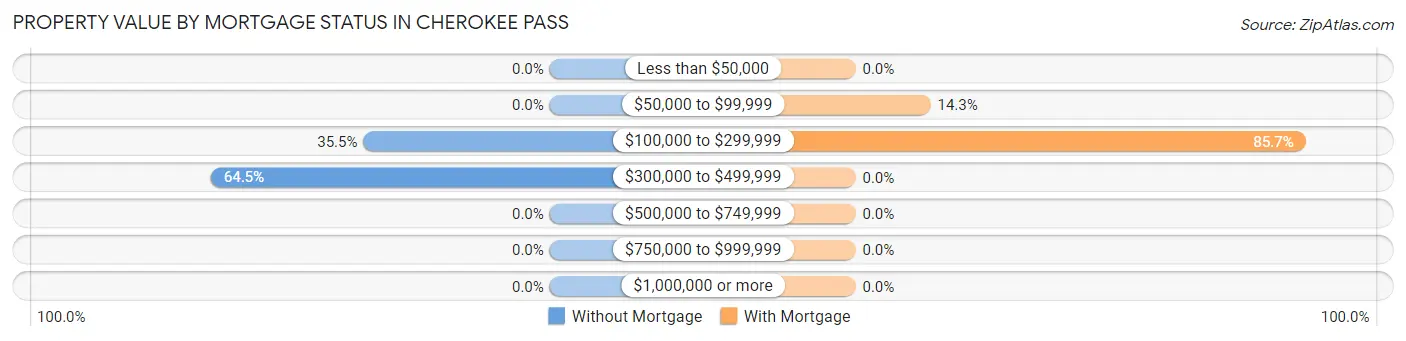
| Property Value | Without Mortgage | With Mortgage |
| Less than $50,000 | 0 (0.0%) | 0 (0.0%) |
| $50,000 to $99,999 | 0 (0.0%) | 6 (14.3%) |
| $100,000 to $299,999 | 11 (35.5%) | 36 (85.7%) |
| $300,000 to $499,999 | 20 (64.5%) | 0 (0.0%) |
| $500,000 to $749,999 | 0 (0.0%) | 0 (0.0%) |
| $750,000 to $999,999 | 0 (0.0%) | 0 (0.0%) |
| $1,000,000 or more | 0 (0.0%) | 0 (0.0%) |
| Total | 31 (100.0%) | 42 (100.0%) |
Household Income by Mortgage Status in Cherokee Pass
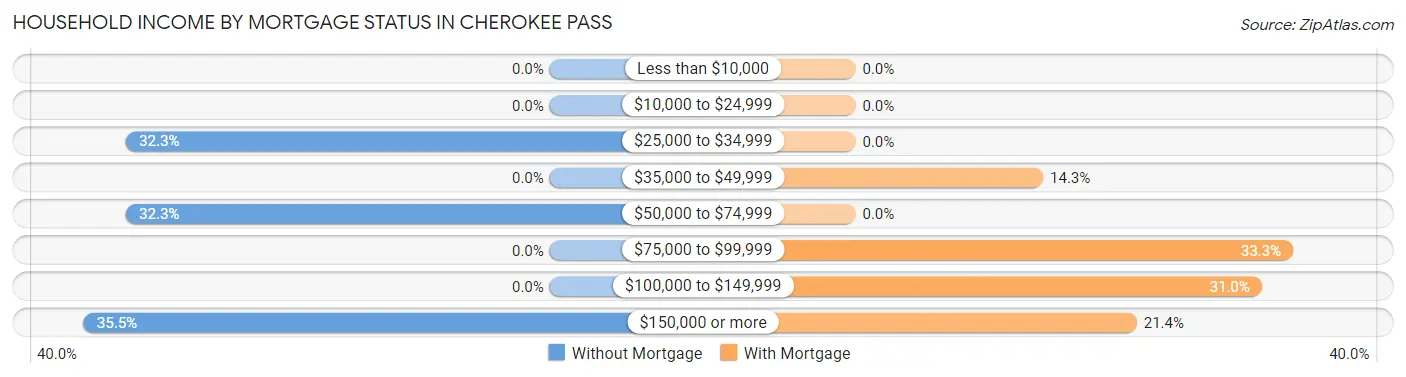
| Household Income | Without Mortgage | With Mortgage |
| Less than $10,000 | 0 (0.0%) | 0 (0.0%) |
| $10,000 to $24,999 | 0 (0.0%) | 0 (0.0%) |
| $25,000 to $34,999 | 10 (32.3%) | 0 (0.0%) |
| $35,000 to $49,999 | 0 (0.0%) | 6 (14.3%) |
| $50,000 to $74,999 | 10 (32.3%) | 0 (0.0%) |
| $75,000 to $99,999 | 0 (0.0%) | 14 (33.3%) |
| $100,000 to $149,999 | 0 (0.0%) | 13 (30.9%) |
| $150,000 or more | 11 (35.5%) | 9 (21.4%) |
| Total | 31 (100.0%) | 42 (100.0%) |
Property Value to Household Income Ratio in Cherokee Pass
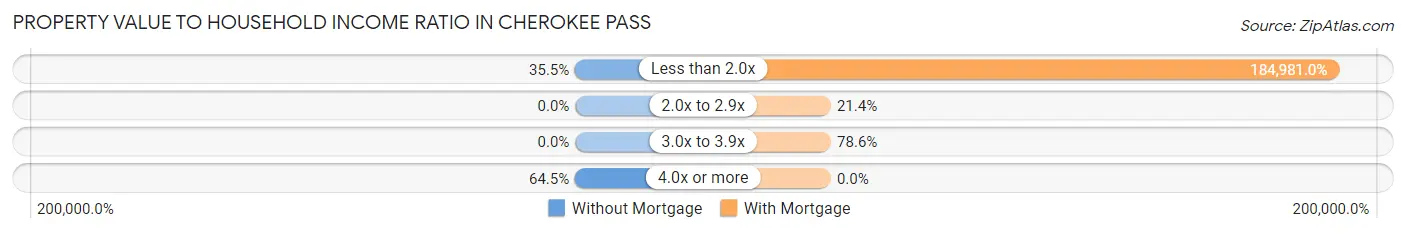
| Value-to-Income Ratio | Without Mortgage | With Mortgage |
| Less than 2.0x | 11 (35.5%) | 77,692 (184,981.0%) |
| 2.0x to 2.9x | 0 (0.0%) | 9 (21.4%) |
| 3.0x to 3.9x | 0 (0.0%) | 33 (78.6%) |
| 4.0x or more | 20 (64.5%) | 0 (0.0%) |
| Total | 31 (100.0%) | 42 (100.0%) |
Real Estate Taxes by Mortgage Status in Cherokee Pass
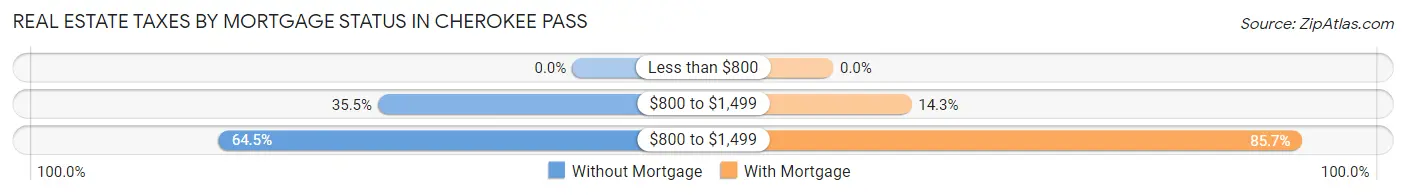
| Property Taxes | Without Mortgage | With Mortgage |
| Less than $800 | 0 (0.0%) | 0 (0.0%) |
| $800 to $1,499 | 11 (35.5%) | 6 (14.3%) |
| $800 to $1,499 | 20 (64.5%) | 36 (85.7%) |
| Total | 31 (100.0%) | 42 (100.0%) |
Health & Disability in Cherokee Pass
Health Insurance Coverage by Age in Cherokee Pass
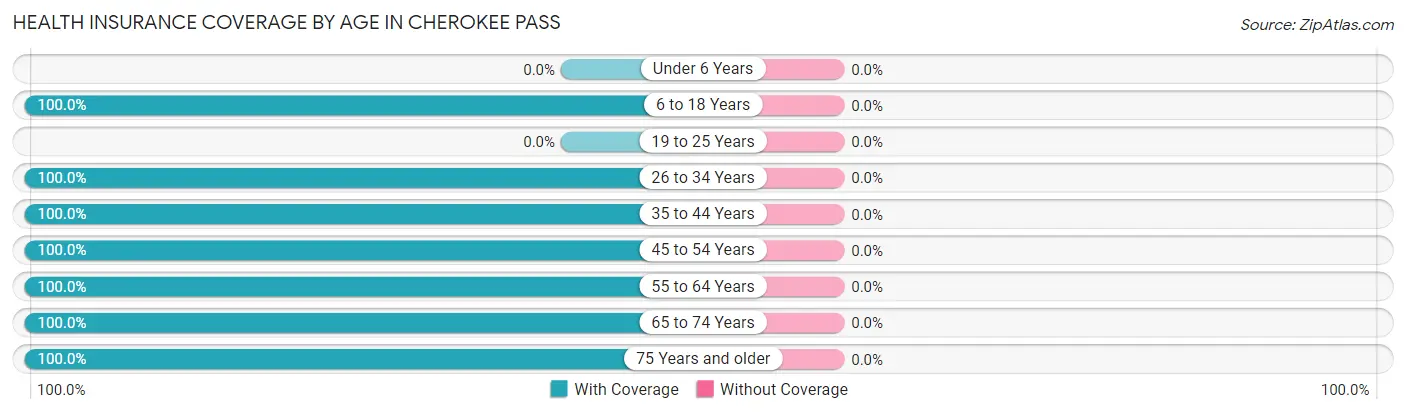
| Age Bracket | With Coverage | Without Coverage |
| Under 6 Years | 0 (0.0%) | 0 (0.0%) |
| 6 to 18 Years | 38 (100.0%) | 0 (0.0%) |
| 19 to 25 Years | 0 (0.0%) | 0 (0.0%) |
| 26 to 34 Years | 25 (100.0%) | 0 (0.0%) |
| 35 to 44 Years | 26 (100.0%) | 0 (0.0%) |
| 45 to 54 Years | 13 (100.0%) | 0 (0.0%) |
| 55 to 64 Years | 31 (100.0%) | 0 (0.0%) |
| 65 to 74 Years | 53 (100.0%) | 0 (0.0%) |
| 75 Years and older | 10 (100.0%) | 0 (0.0%) |
| Total | 196 (100.0%) | 0 (0.0%) |
Health Insurance Coverage by Citizenship Status in Cherokee Pass
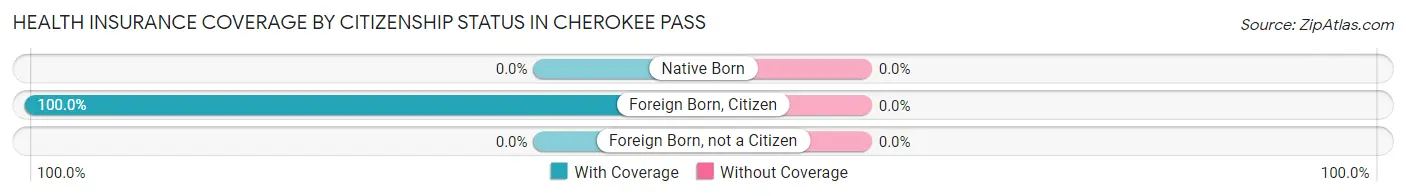
| Citizenship Status | With Coverage | Without Coverage |
| Native Born | 0 (0.0%) | 0 (0.0%) |
| Foreign Born, Citizen | 38 (100.0%) | 0 (0.0%) |
| Foreign Born, not a Citizen | 0 (0.0%) | 0 (0.0%) |
Health Insurance Coverage by Household Income in Cherokee Pass
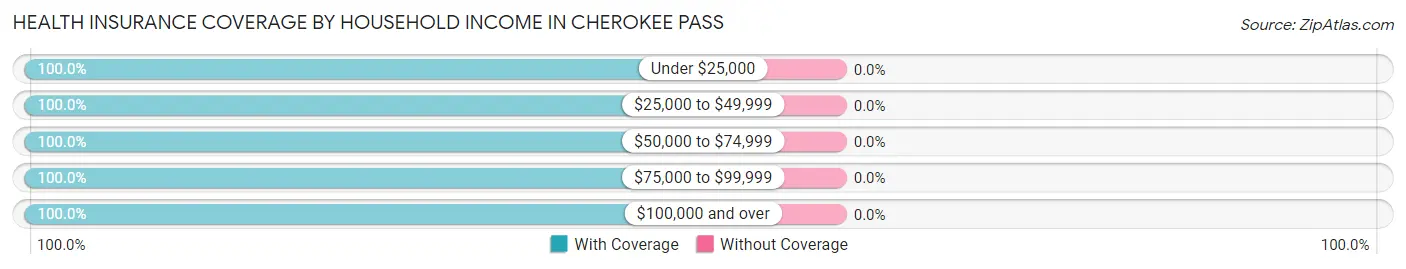
| Household Income | With Coverage | Without Coverage |
| Under $25,000 | 10 (100.0%) | 0 (0.0%) |
| $25,000 to $49,999 | 29 (100.0%) | 0 (0.0%) |
| $50,000 to $74,999 | 32 (100.0%) | 0 (0.0%) |
| $75,000 to $99,999 | 40 (100.0%) | 0 (0.0%) |
| $100,000 and over | 85 (100.0%) | 0 (0.0%) |
Public vs Private Health Insurance Coverage by Age in Cherokee Pass
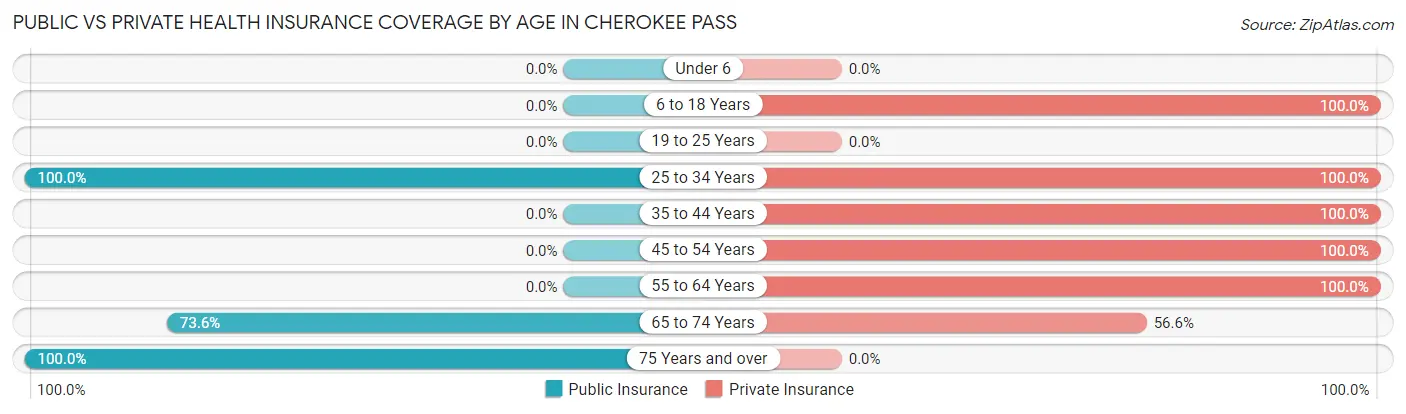
| Age Bracket | Public Insurance | Private Insurance |
| Under 6 | 0 (0.0%) | 0 (0.0%) |
| 6 to 18 Years | 0 (0.0%) | 38 (100.0%) |
| 19 to 25 Years | 0 (0.0%) | 0 (0.0%) |
| 25 to 34 Years | 25 (100.0%) | 25 (100.0%) |
| 35 to 44 Years | 0 (0.0%) | 26 (100.0%) |
| 45 to 54 Years | 0 (0.0%) | 13 (100.0%) |
| 55 to 64 Years | 0 (0.0%) | 31 (100.0%) |
| 65 to 74 Years | 39 (73.6%) | 30 (56.6%) |
| 75 Years and over | 10 (100.0%) | 0 (0.0%) |
| Total | 74 (37.8%) | 163 (83.2%) |
Disability Status by Sex by Age in Cherokee Pass
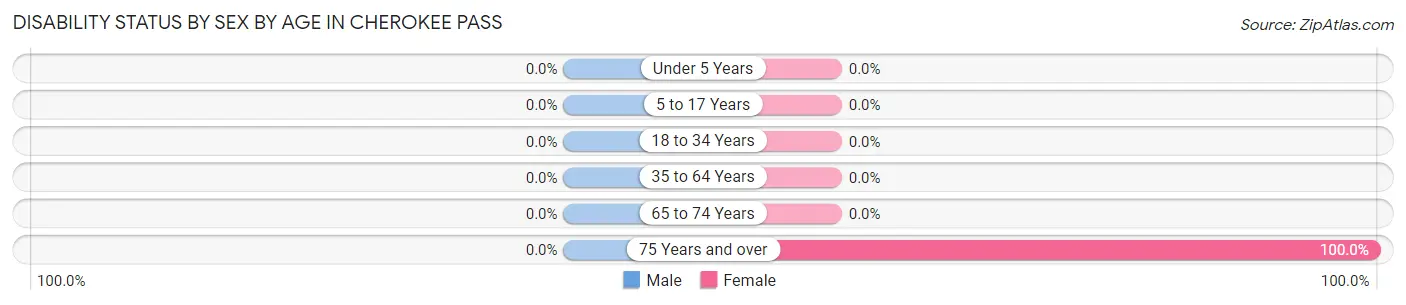
| Age Bracket | Male | Female |
| Under 5 Years | 0 (0.0%) | 0 (0.0%) |
| 5 to 17 Years | 0 (0.0%) | 0 (0.0%) |
| 18 to 34 Years | 0 (0.0%) | 0 (0.0%) |
| 35 to 64 Years | 0 (0.0%) | 0 (0.0%) |
| 65 to 74 Years | 0 (0.0%) | 0 (0.0%) |
| 75 Years and over | 0 (0.0%) | 10 (100.0%) |
Disability Class by Sex by Age in Cherokee Pass
Disability Class: Hearing Difficulty
| Age Bracket | Male | Female |
| Under 5 Years | 0 (0.0%) | 0 (0.0%) |
| 5 to 17 Years | 0 (0.0%) | 0 (0.0%) |
| 18 to 34 Years | 0 (0.0%) | 0 (0.0%) |
| 35 to 64 Years | 0 (0.0%) | 0 (0.0%) |
| 65 to 74 Years | 0 (0.0%) | 0 (0.0%) |
| 75 Years and over | 0 (0.0%) | 0 (0.0%) |
Disability Class: Vision Difficulty
| Age Bracket | Male | Female |
| Under 5 Years | 0 (0.0%) | 0 (0.0%) |
| 5 to 17 Years | 0 (0.0%) | 0 (0.0%) |
| 18 to 34 Years | 0 (0.0%) | 0 (0.0%) |
| 35 to 64 Years | 0 (0.0%) | 0 (0.0%) |
| 65 to 74 Years | 0 (0.0%) | 0 (0.0%) |
| 75 Years and over | 0 (0.0%) | 0 (0.0%) |
Disability Class: Cognitive Difficulty

| Age Bracket | Male | Female |
| 5 to 17 Years | 0 (0.0%) | 0 (0.0%) |
| 18 to 34 Years | 0 (0.0%) | 0 (0.0%) |
| 35 to 64 Years | 0 (0.0%) | 0 (0.0%) |
| 65 to 74 Years | 0 (0.0%) | 0 (0.0%) |
| 75 Years and over | 0 (0.0%) | 0 (0.0%) |
Disability Class: Ambulatory Difficulty
| Age Bracket | Male | Female |
| 5 to 17 Years | 0 (0.0%) | 0 (0.0%) |
| 18 to 34 Years | 0 (0.0%) | 0 (0.0%) |
| 35 to 64 Years | 0 (0.0%) | 0 (0.0%) |
| 65 to 74 Years | 0 (0.0%) | 0 (0.0%) |
| 75 Years and over | 0 (0.0%) | 10 (100.0%) |
Disability Class: Self-Care Difficulty
| Age Bracket | Male | Female |
| 5 to 17 Years | 0 (0.0%) | 0 (0.0%) |
| 18 to 34 Years | 0 (0.0%) | 0 (0.0%) |
| 35 to 64 Years | 0 (0.0%) | 0 (0.0%) |
| 65 to 74 Years | 0 (0.0%) | 0 (0.0%) |
| 75 Years and over | 0 (0.0%) | 0 (0.0%) |
Technology Access in Cherokee Pass
Computing Device Access in Cherokee Pass
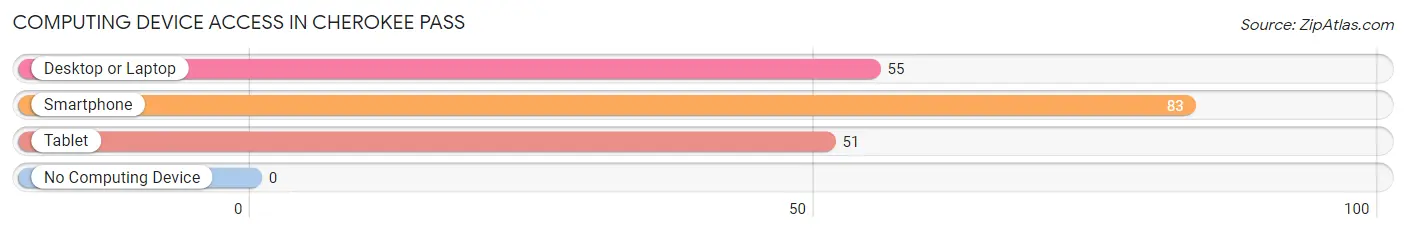
| Device Type | # Households | % Households |
| Desktop or Laptop | 55 | 66.3% |
| Smartphone | 83 | 100.0% |
| Tablet | 51 | 61.5% |
| No Computing Device | 0 | 0.0% |
| Total | 83 | 100.0% |
Internet Access in Cherokee Pass
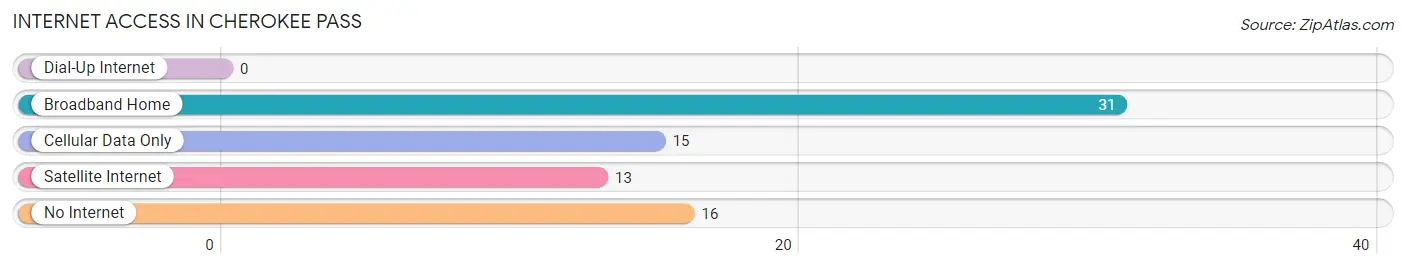
| Internet Type | # Households | % Households |
| Dial-Up Internet | 0 | 0.0% |
| Broadband Home | 31 | 37.3% |
| Cellular Data Only | 15 | 18.1% |
| Satellite Internet | 13 | 15.7% |
| No Internet | 16 | 19.3% |
| Total | 83 | 100.0% |
Cherokee Pass Summary
Cherokee Pass is a small unincorporated community located in the Ozark Mountains of Missouri. It is situated in the southeastern corner of Taney County, approximately 10 miles south of Branson and 25 miles north of Forsyth. The community is located along the banks of the White River, which is a tributary of the James River.
History
Cherokee Pass was first settled in the early 1800s by a group of Cherokee Indians who were forced to relocate from their ancestral lands in the southeastern United States. The Cherokee were led by Chief John Ross, who was a signer of the Treaty of New Echota in 1835. The treaty ceded all Cherokee lands east of the Mississippi River to the United States government. The Cherokee were then relocated to Indian Territory, which is now present-day Oklahoma.
The Cherokee who settled in Cherokee Pass were among the few who chose to remain in the Ozarks. They established a small village and named it after Chief Ross. The village was located near a natural pass in the mountains, which is how the community got its name.
The Cherokee lived in the area for several decades before the Civil War. During the war, the Cherokee sided with the Union and were able to remain in the area. After the war, the Cherokee continued to live in the area and the community of Cherokee Pass slowly grew.
In the late 1800s, the community was home to a small sawmill and a gristmill. The sawmill was used to cut lumber for the construction of homes and other buildings in the area. The gristmill was used to grind grain into flour.
In the early 1900s, the community was home to a post office, a general store, a blacksmith shop, and a school. The school was attended by both Cherokee and non-Cherokee children.
Geography
Cherokee Pass is located in the Ozark Mountains of Missouri. The community is situated in the southeastern corner of Taney County, approximately 10 miles south of Branson and 25 miles north of Forsyth. The community is located along the banks of the White River, which is a tributary of the James River.
The area is characterized by rolling hills and valleys, with elevations ranging from 600 to 1,000 feet above sea level. The climate is mild, with average temperatures ranging from the mid-30s in the winter to the mid-80s in the summer.
Economy
The economy of Cherokee Pass is largely based on tourism. The community is located near several popular tourist attractions, including Table Rock Lake, Silver Dollar City, and the Shepherd of the Hills Homestead. These attractions draw thousands of visitors to the area each year.
In addition to tourism, the community is home to several small businesses, including a general store, a gas station, and a restaurant. The community also has a post office and a small library.
Demographics
As of the 2010 census, the population of Cherokee Pass was 545. The racial makeup of the community was 97.3% White, 0.7% African American, 0.2% Native American, 0.2% Asian, and 1.6% from other races.
The median household income in Cherokee Pass was $37,500, and the median family income was $41,250. The per capita income was $17,500. Approximately 11.3% of the population was below the poverty line.
Common Questions
What is Per Capita Income in Cherokee Pass?
Per Capita income in Cherokee Pass is $38,977.
What is the Median Family Income in Cherokee Pass?
Median Family Income in Cherokee Pass is $78,750.
What is the Median Household income in Cherokee Pass?
Median Household Income in Cherokee Pass is $70,982.
What is Inequality or Gini Index in Cherokee Pass?
Inequality or Gini Index in Cherokee Pass is 0.36.
What is the Total Population of Cherokee Pass?
Total Population of Cherokee Pass is 196.
What is the Total Male Population of Cherokee Pass?
Total Male Population of Cherokee Pass is 92.
What is the Total Female Population of Cherokee Pass?
Total Female Population of Cherokee Pass is 104.
What is the Ratio of Males per 100 Females in Cherokee Pass?
There are 88.46 Males per 100 Females in Cherokee Pass.
What is the Ratio of Females per 100 Males in Cherokee Pass?
There are 113.04 Females per 100 Males in Cherokee Pass.
What is the Median Population Age in Cherokee Pass?
Median Population Age in Cherokee Pass is 51.7 Years.
What is the Average Family Size in Cherokee Pass
Average Family Size in Cherokee Pass is 3.1 People.
What is the Average Household Size in Cherokee Pass
Average Household Size in Cherokee Pass is 2.4 People.
How Large is the Labor Force in Cherokee Pass?
There are 124 People in the Labor Forcein in Cherokee Pass.
What is the Percentage of People in the Labor Force in Cherokee Pass?
75.6% of People are in the Labor Force in Cherokee Pass.
What is the Unemployment Rate in Cherokee Pass?
Unemployment Rate in Cherokee Pass is 5.6%.