Josephville, MO Map & Demographics
Josephville Map
Josephville Overview
$57,012
PER CAPITA INCOME
$106,250
AVG FAMILY INCOME
$105,893
AVG HOUSEHOLD INCOME
14.1%
WAGE / INCOME GAP [ % ]
85.9¢/ $1
WAGE / INCOME GAP [ $ ]
0.54
INEQUALITY / GINI INDEX
728
TOTAL POPULATION
388
MALE POPULATION
340
FEMALE POPULATION
114.12
MALES / 100 FEMALES
87.63
FEMALES / 100 MALES
49.1
MEDIAN AGE
3.0
AVG FAMILY SIZE
2.8
AVG HOUSEHOLD SIZE
312
LABOR FORCE [ PEOPLE ]
55.9%
PERCENT IN LABOR FORCE
Income in Josephville
Income Overview in Josephville
Per Capita Income in Josephville is $57,012, while median incomes of families and households are $106,250 and $105,893 respectively.
| Characteristic | Number | Measure |
| Per Capita Income | 728 | $57,012 |
| Median Family Income | 221 | $106,250 |
| Mean Family Income | 221 | $168,396 |
| Median Household Income | 261 | $105,893 |
| Mean Household Income | 261 | $159,891 |
| Income Deficit | 221 | $0 |
| Wage / Income Gap (%) | 728 | 14.13% |
| Wage / Income Gap ($) | 728 | 85.87¢ per $1 |
| Gini / Inequality Index | 728 | 0.54 |
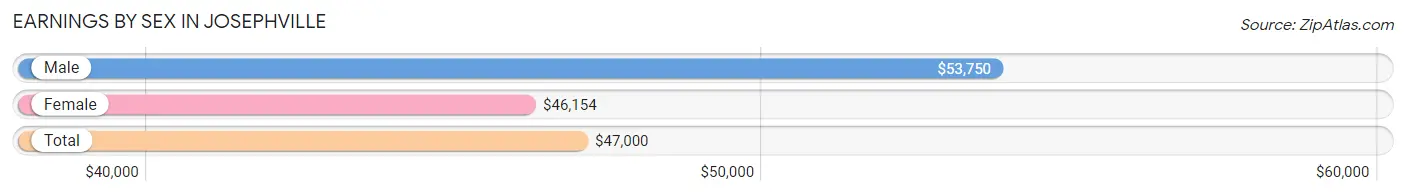
Earnings by Sex in Josephville
Average Earnings in Josephville are $47,000, $53,750 for men and $46,154 for women, a difference of 14.1%.
| Sex | Number | Average Earnings |
| Male | 182 (52.9%) | $53,750 |
| Female | 162 (47.1%) | $46,154 |
| Total | 344 (100.0%) | $47,000 |
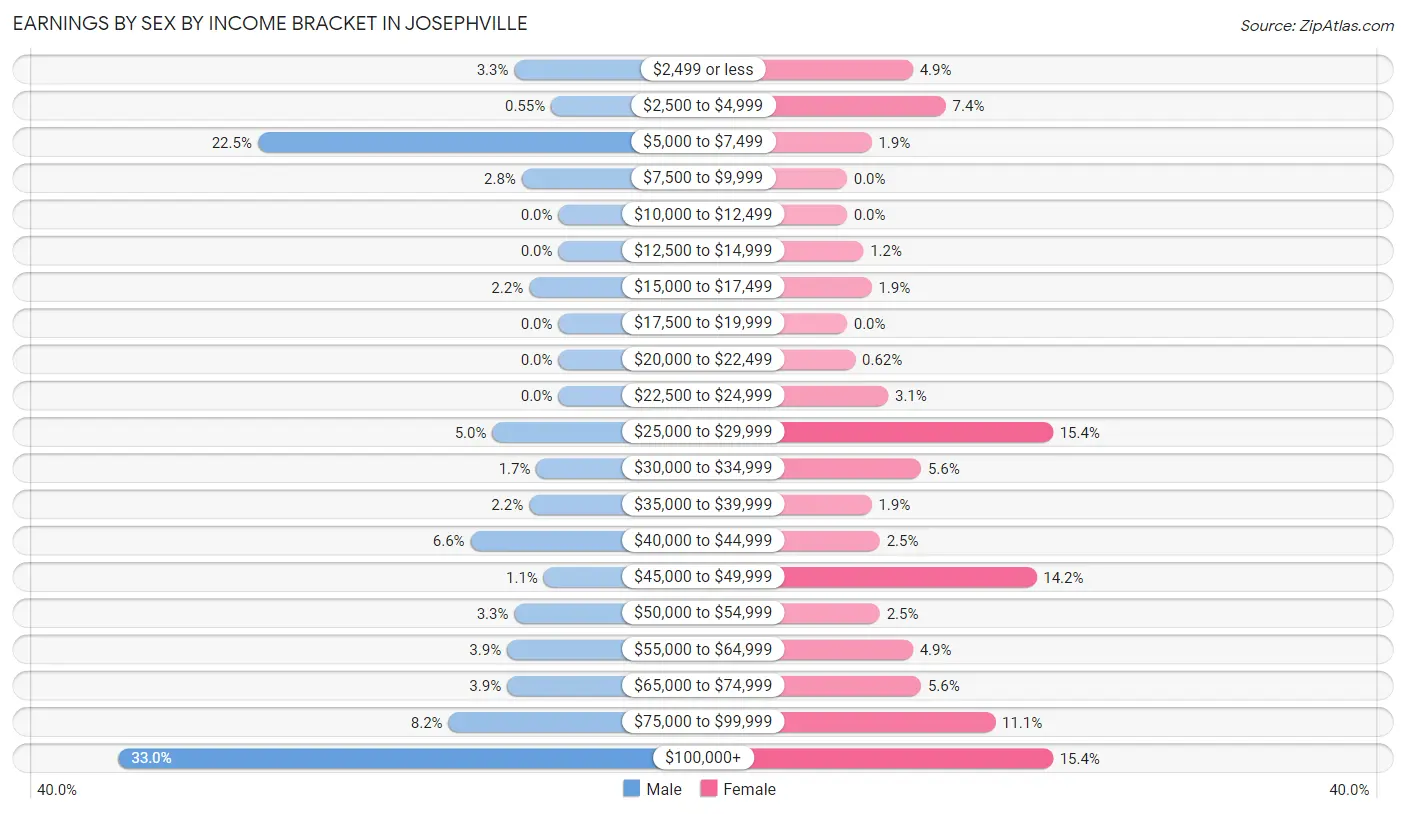
Earnings by Sex by Income Bracket in Josephville
The most common earnings brackets in Josephville are $100,000+ for men (60 | 33.0%) and $25,000 to $29,999 for women (25 | 15.4%).
| Income | Male | Female |
| $2,499 or less | 6 (3.3%) | 8 (4.9%) |
| $2,500 to $4,999 | 1 (0.5%) | 12 (7.4%) |
| $5,000 to $7,499 | 41 (22.5%) | 3 (1.8%) |
| $7,500 to $9,999 | 5 (2.8%) | 0 (0.0%) |
| $10,000 to $12,499 | 0 (0.0%) | 0 (0.0%) |
| $12,500 to $14,999 | 0 (0.0%) | 2 (1.2%) |
| $15,000 to $17,499 | 4 (2.2%) | 3 (1.8%) |
| $17,500 to $19,999 | 0 (0.0%) | 0 (0.0%) |
| $20,000 to $22,499 | 0 (0.0%) | 1 (0.6%) |
| $22,500 to $24,999 | 0 (0.0%) | 5 (3.1%) |
| $25,000 to $29,999 | 9 (5.0%) | 25 (15.4%) |
| $30,000 to $34,999 | 3 (1.7%) | 9 (5.6%) |
| $35,000 to $39,999 | 4 (2.2%) | 3 (1.8%) |
| $40,000 to $44,999 | 12 (6.6%) | 4 (2.5%) |
| $45,000 to $49,999 | 2 (1.1%) | 23 (14.2%) |
| $50,000 to $54,999 | 6 (3.3%) | 4 (2.5%) |
| $55,000 to $64,999 | 7 (3.8%) | 8 (4.9%) |
| $65,000 to $74,999 | 7 (3.8%) | 9 (5.6%) |
| $75,000 to $99,999 | 15 (8.2%) | 18 (11.1%) |
| $100,000+ | 60 (33.0%) | 25 (15.4%) |
| Total | 182 (100.0%) | 162 (100.0%) |
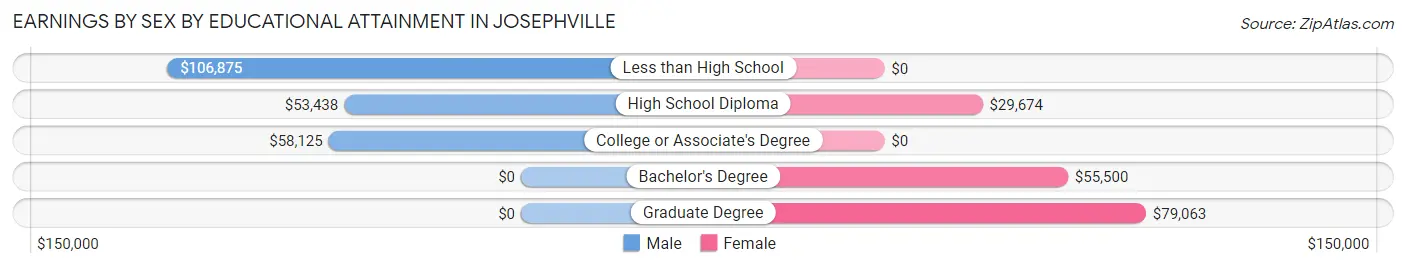
Earnings by Sex by Educational Attainment in Josephville
Average earnings in Josephville are $63,750 for men and $47,500 for women, a difference of 25.5%. Men with an educational attainment of less than high school enjoy the highest average annual earnings of $106,875, while those with high school diploma education earn the least with $53,438. Women with an educational attainment of graduate degree earn the most with the average annual earnings of $79,063, while those with high school diploma education have the smallest earnings of $29,674.
| Educational Attainment | Male Income | Female Income |
| Less than High School | $106,875 | $0 |
| High School Diploma | $53,438 | $29,674 |
| College or Associate's Degree | $58,125 | $0 |
| Bachelor's Degree | - | - |
| Graduate Degree | - | - |
| Total | $63,750 | $47,500 |
Family Income in Josephville
Family Income Brackets in Josephville
According to the Josephville family income data, there are 58 families falling into the $200,000+ income range, which is the most common income bracket and makes up 26.2% of all families.
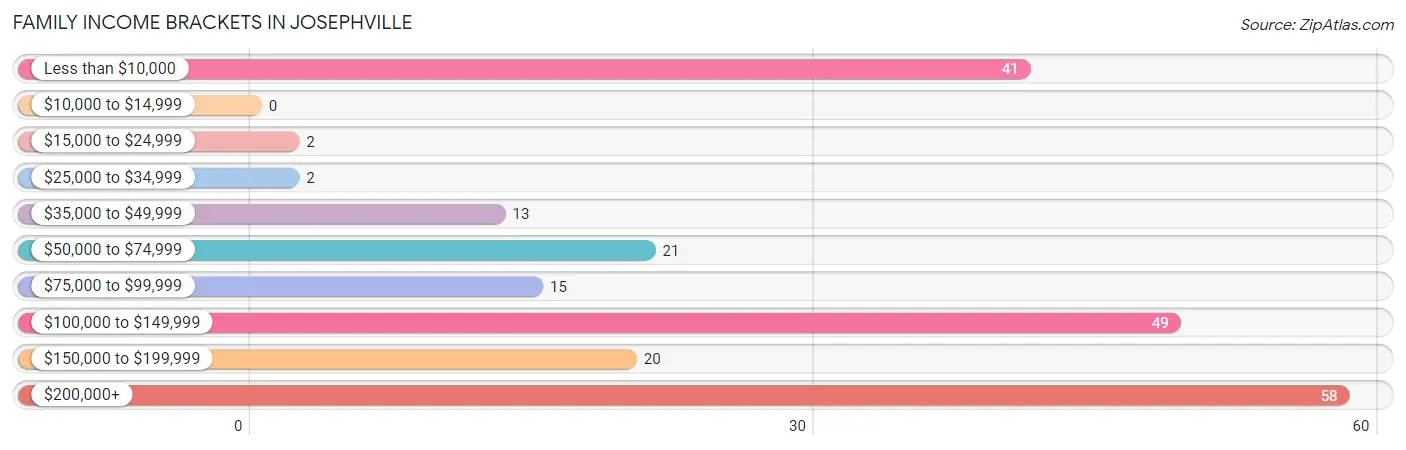
| Income Bracket | # Families | % Families |
| Less than $10,000 | 41 | 18.6% |
| $10,000 to $14,999 | 0 | 0.0% |
| $15,000 to $24,999 | 2 | 0.9% |
| $25,000 to $34,999 | 2 | 0.9% |
| $35,000 to $49,999 | 13 | 5.9% |
| $50,000 to $74,999 | 21 | 9.5% |
| $75,000 to $99,999 | 15 | 6.8% |
| $100,000 to $149,999 | 49 | 22.2% |
| $150,000 to $199,999 | 20 | 9.0% |
| $200,000+ | 58 | 26.2% |
Family Income by Famaliy Size in Josephville
7+ person families (18 | 8.1%) account for the highest median family income in Josephville with $250,001 per family, while 3-person families (26 | 11.8%) have the highest median income of $74,167 per family member.
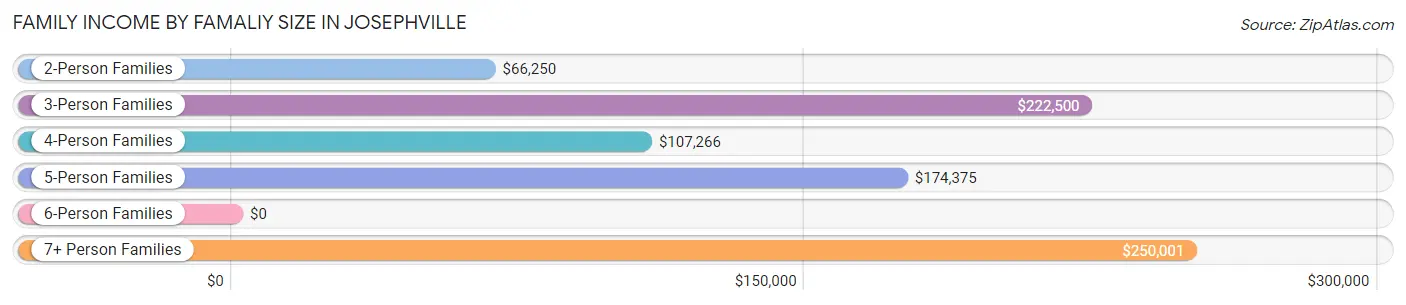
| Income Bracket | # Families | Median Income |
| 2-Person Families | 132 (59.7%) | $66,250 |
| 3-Person Families | 26 (11.8%) | $222,500 |
| 4-Person Families | 33 (14.9%) | $107,266 |
| 5-Person Families | 10 (4.5%) | $174,375 |
| 6-Person Families | 2 (0.9%) | $0 |
| 7+ Person Families | 18 (8.1%) | $250,001 |
| Total | 221 (100.0%) | $106,250 |
Family Income by Number of Earners in Josephville
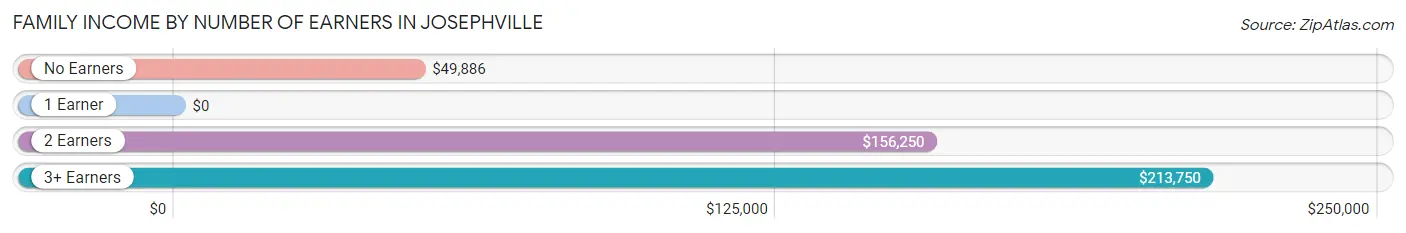
| Number of Earners | # Families | Median Income |
| No Earners | 39 (17.6%) | $49,886 |
| 1 Earner | 99 (44.8%) | $0 |
| 2 Earners | 59 (26.7%) | $156,250 |
| 3+ Earners | 24 (10.9%) | $213,750 |
| Total | 221 (100.0%) | $106,250 |
Household Income in Josephville
Household Income Brackets in Josephville
With 64 households falling in the category, the $200,000+ income range is the most frequent in Josephville, accounting for 24.5% of all households.
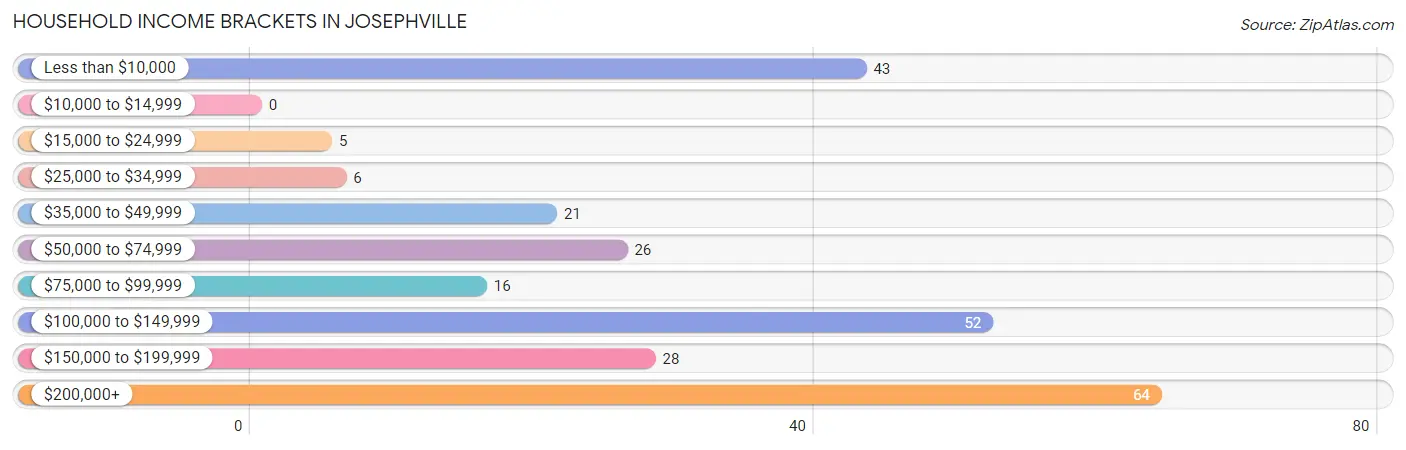
| Income Bracket | # Households | % Households |
| Less than $10,000 | 43 | 16.5% |
| $10,000 to $14,999 | 0 | 0.0% |
| $15,000 to $24,999 | 5 | 1.9% |
| $25,000 to $34,999 | 6 | 2.3% |
| $35,000 to $49,999 | 21 | 8.0% |
| $50,000 to $74,999 | 26 | 10.0% |
| $75,000 to $99,999 | 16 | 6.1% |
| $100,000 to $149,999 | 52 | 19.9% |
| $150,000 to $199,999 | 28 | 10.7% |
| $200,000+ | 64 | 24.5% |
Household Income by Householder Age in Josephville
The median household income in Josephville is $105,893, with the highest median household income of $250,001 found in the 25 to 44 years age bracket for the primary householder. A total of 61 households (23.4%) fall into this category.
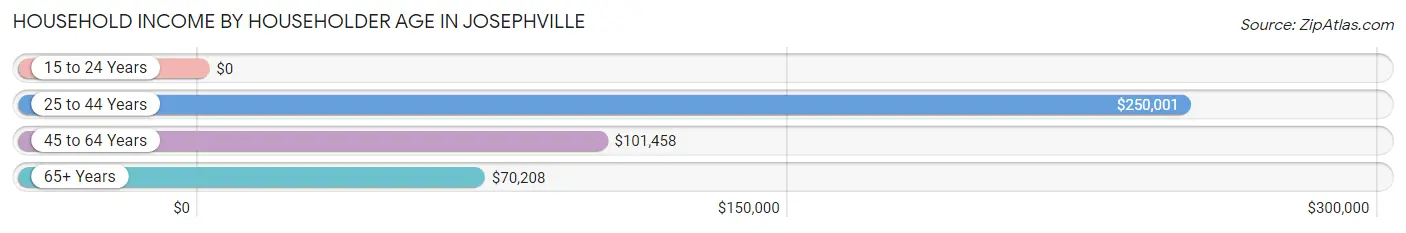
| Income Bracket | # Households | Median Income |
| 15 to 24 Years | 0 (0.0%) | $0 |
| 25 to 44 Years | 61 (23.4%) | $250,001 |
| 45 to 64 Years | 131 (50.2%) | $101,458 |
| 65+ Years | 69 (26.4%) | $70,208 |
| Total | 261 (100.0%) | $105,893 |
Poverty in Josephville
Income Below Poverty by Sex and Age in Josephville
With 23.6% poverty level for males and 1.8% for females among the residents of Josephville, 6 to 11 year old males and 55 to 64 year old females are the most vulnerable to poverty, with 43 males (53.1%) and 6 females (7.0%) in their respective age groups living below the poverty level.
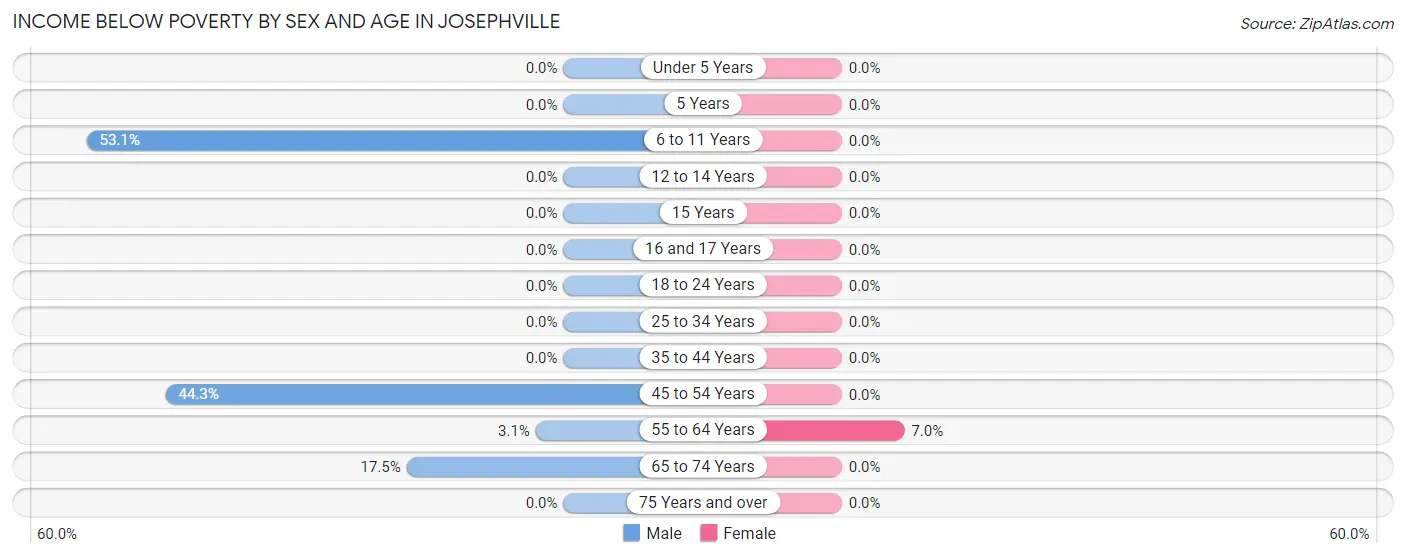
| Age Bracket | Male | Female |
| Under 5 Years | 0 (0.0%) | 0 (0.0%) |
| 5 Years | 0 (0.0%) | 0 (0.0%) |
| 6 to 11 Years | 43 (53.1%) | 0 (0.0%) |
| 12 to 14 Years | 0 (0.0%) | 0 (0.0%) |
| 15 Years | 0 (0.0%) | 0 (0.0%) |
| 16 and 17 Years | 0 (0.0%) | 0 (0.0%) |
| 18 to 24 Years | 0 (0.0%) | 0 (0.0%) |
| 25 to 34 Years | 0 (0.0%) | 0 (0.0%) |
| 35 to 44 Years | 0 (0.0%) | 0 (0.0%) |
| 45 to 54 Years | 35 (44.3%) | 0 (0.0%) |
| 55 to 64 Years | 2 (3.1%) | 6 (7.0%) |
| 65 to 74 Years | 11 (17.5%) | 0 (0.0%) |
| 75 Years and over | 0 (0.0%) | 0 (0.0%) |
| Total | 91 (23.6%) | 6 (1.8%) |
Income Above Poverty by Sex and Age in Josephville
According to the poverty statistics in Josephville, males aged under 5 years and females aged under 5 years are the age groups that are most secure financially, with 100.0% of males and 100.0% of females in these age groups living above the poverty line.
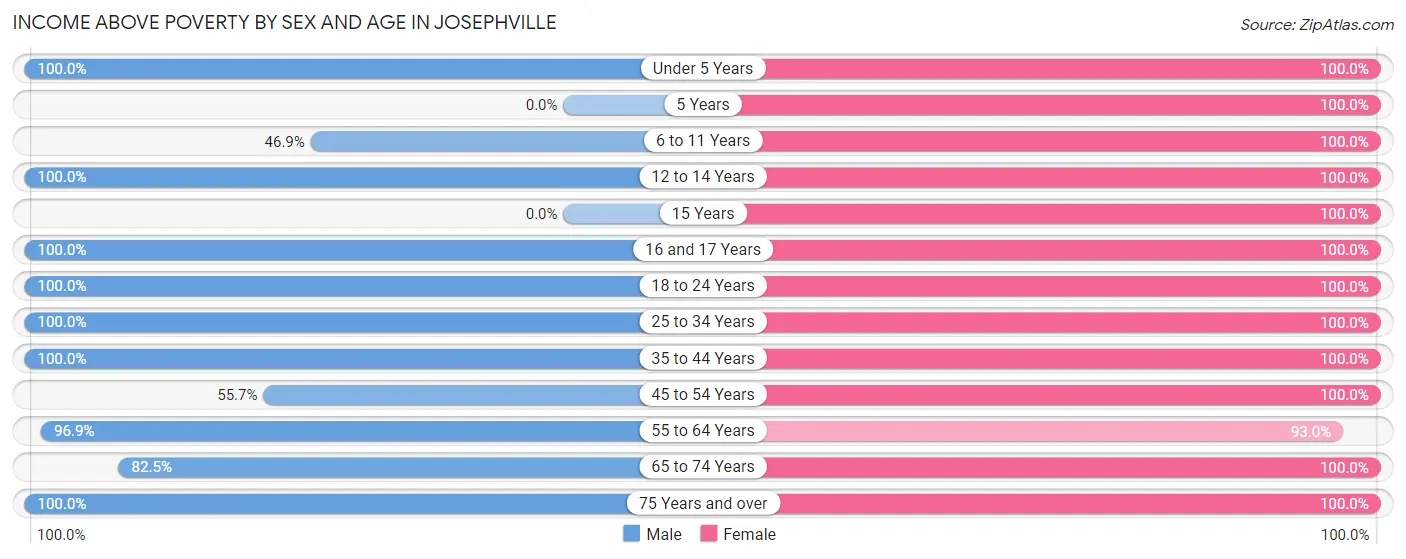
| Age Bracket | Male | Female |
| Under 5 Years | 4 (100.0%) | 3 (100.0%) |
| 5 Years | 0 (0.0%) | 2 (100.0%) |
| 6 to 11 Years | 38 (46.9%) | 56 (100.0%) |
| 12 to 14 Years | 6 (100.0%) | 12 (100.0%) |
| 15 Years | 0 (0.0%) | 3 (100.0%) |
| 16 and 17 Years | 9 (100.0%) | 1 (100.0%) |
| 18 to 24 Years | 16 (100.0%) | 13 (100.0%) |
| 25 to 34 Years | 15 (100.0%) | 36 (100.0%) |
| 35 to 44 Years | 39 (100.0%) | 38 (100.0%) |
| 45 to 54 Years | 44 (55.7%) | 27 (100.0%) |
| 55 to 64 Years | 63 (96.9%) | 80 (93.0%) |
| 65 to 74 Years | 52 (82.5%) | 45 (100.0%) |
| 75 Years and over | 8 (100.0%) | 18 (100.0%) |
| Total | 294 (76.4%) | 334 (98.2%) |
Income Below Poverty Among Married-Couple Families in Josephville
The poverty statistics for married-couple families in Josephville show that 3.4% or 6 of the total 179 families live below the poverty line. Families with no children have the highest poverty rate of 4.8%, comprising of 6 families. On the other hand, families with 1 or 2 children have the lowest poverty rate of 0.0%, which includes 0 families.
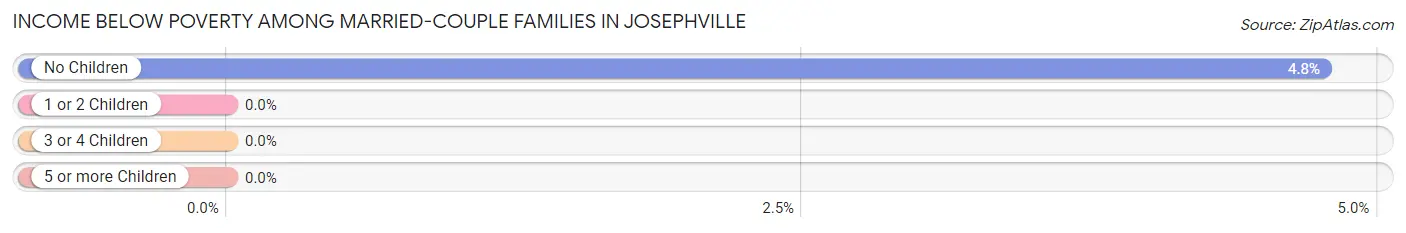
| Children | Above Poverty | Below Poverty |
| No Children | 120 (95.2%) | 6 (4.8%) |
| 1 or 2 Children | 30 (100.0%) | 0 (0.0%) |
| 3 or 4 Children | 7 (100.0%) | 0 (0.0%) |
| 5 or more Children | 16 (100.0%) | 0 (0.0%) |
| Total | 173 (96.7%) | 6 (3.4%) |
Income Below Poverty Among Single-Parent Households in Josephville
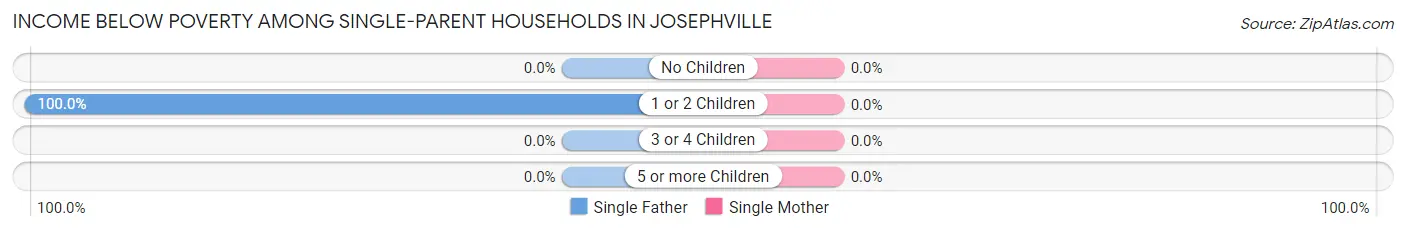
| Children | Single Father | Single Mother |
| No Children | 0 (0.0%) | 0 (0.0%) |
| 1 or 2 Children | 35 (100.0%) | 0 (0.0%) |
| 3 or 4 Children | 0 (0.0%) | 0 (0.0%) |
| 5 or more Children | 0 (0.0%) | 0 (0.0%) |
| Total | 35 (94.6%) | 0 (0.0%) |
Income Below Poverty Among Married-Couple vs Single-Parent Households in Josephville
The poverty data for Josephville shows that 6 of the married-couple family households (3.4%) and 35 of the single-parent households (83.3%) are living below the poverty level. Within the married-couple family households, those with no children have the highest poverty rate, with 6 households (4.8%) falling below the poverty line. Among the single-parent households, those with 1 or 2 children have the highest poverty rate, with 35 household (100.0%) living below poverty.
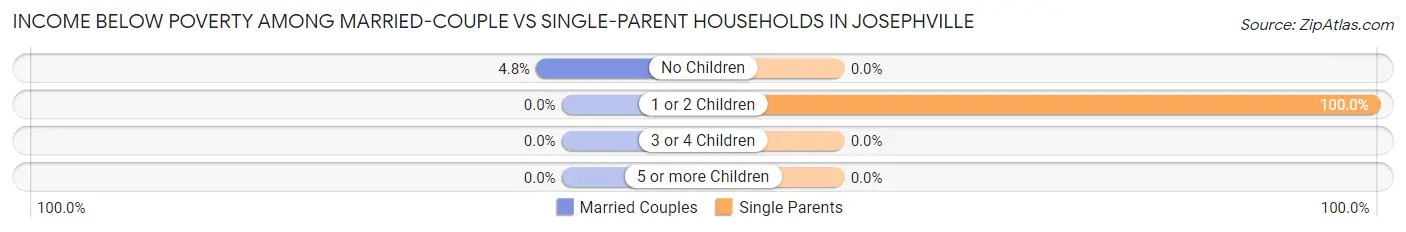
| Children | Married-Couple Families | Single-Parent Households |
| No Children | 6 (4.8%) | 0 (0.0%) |
| 1 or 2 Children | 0 (0.0%) | 35 (100.0%) |
| 3 or 4 Children | 0 (0.0%) | 0 (0.0%) |
| 5 or more Children | 0 (0.0%) | 0 (0.0%) |
| Total | 6 (3.4%) | 35 (83.3%) |
Race in Josephville
The most populous races in Josephville are White / Caucasian (623 | 85.6%), Black / African American (81 | 11.1%), and Some other Race (12 | 1.7%).
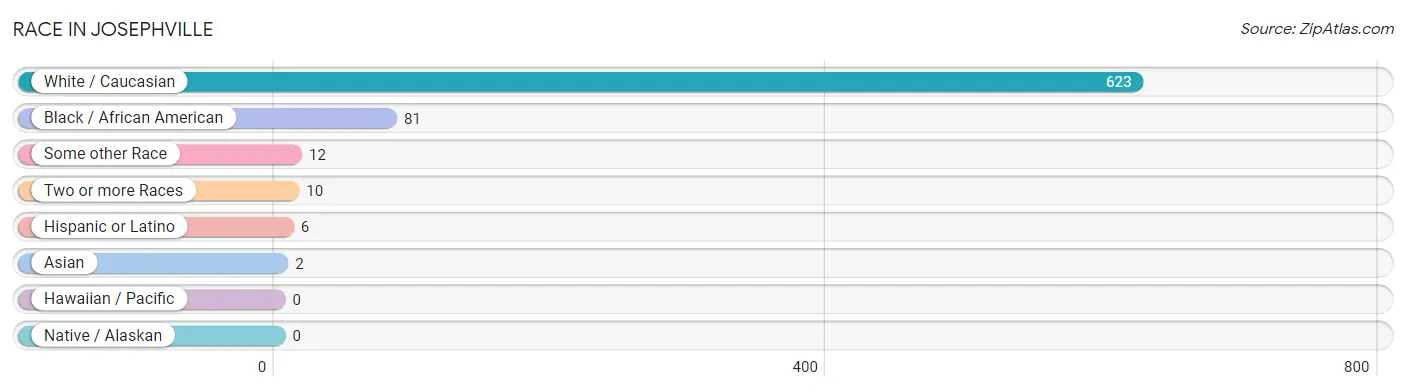
| Race | # Population | % Population |
| Asian | 2 | 0.3% |
| Black / African American | 81 | 11.1% |
| Hawaiian / Pacific | 0 | 0.0% |
| Hispanic or Latino | 6 | 0.8% |
| Native / Alaskan | 0 | 0.0% |
| White / Caucasian | 623 | 85.6% |
| Two or more Races | 10 | 1.4% |
| Some other Race | 12 | 1.7% |
| Total | 728 | 100.0% |
Ancestry in Josephville
The most populous ancestries reported in Josephville are German (348 | 47.8%), English (63 | 8.6%), Danish (51 | 7.0%), American (50 | 6.9%), and Irish (49 | 6.7%), together accounting for 77.1% of all Josephville residents.
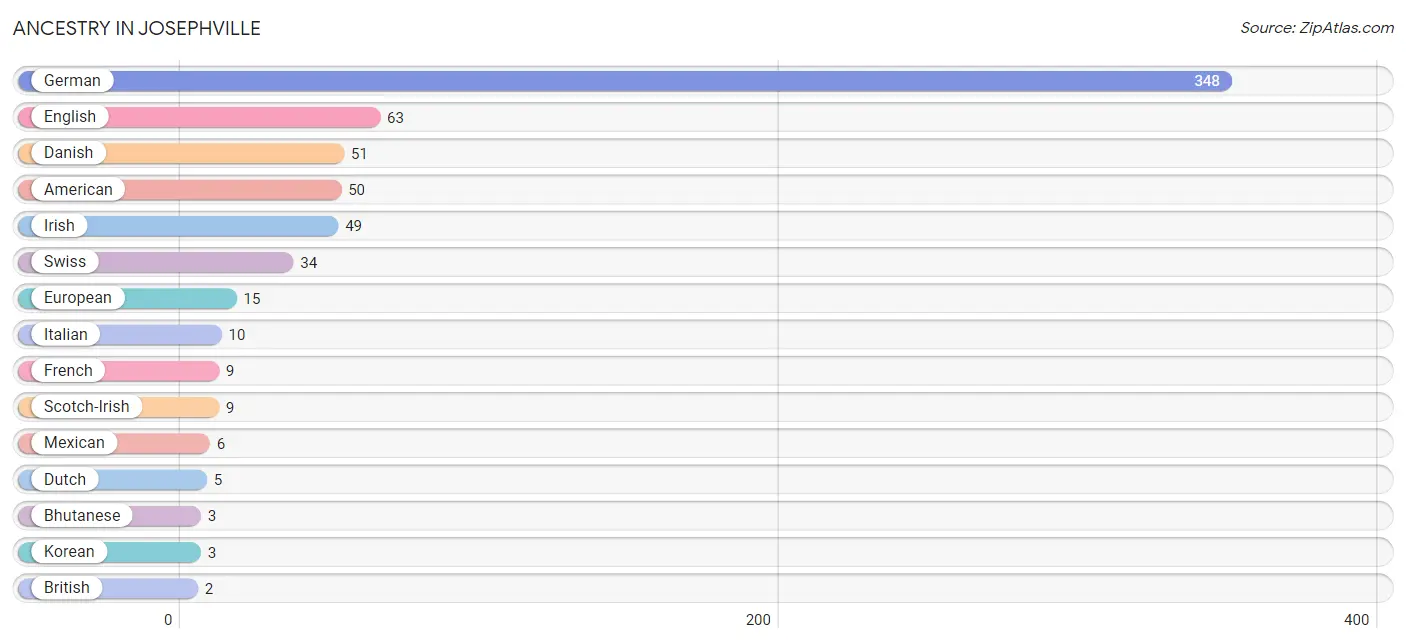
| Ancestry | # Population | % Population |
| American | 50 | 6.9% |
| Bhutanese | 3 | 0.4% |
| British | 2 | 0.3% |
| Choctaw | 2 | 0.3% |
| Danish | 51 | 7.0% |
| Dutch | 5 | 0.7% |
| English | 63 | 8.6% |
| European | 15 | 2.1% |
| French | 9 | 1.2% |
| German | 348 | 47.8% |
| Greek | 2 | 0.3% |
| Irish | 49 | 6.7% |
| Italian | 10 | 1.4% |
| Korean | 3 | 0.4% |
| Mexican | 6 | 0.8% |
| Scotch-Irish | 9 | 1.2% |
| Scottish | 1 | 0.1% |
| Sri Lankan | 2 | 0.3% |
| Swiss | 34 | 4.7% | View All 19 Rows |
Immigrants in Josephville
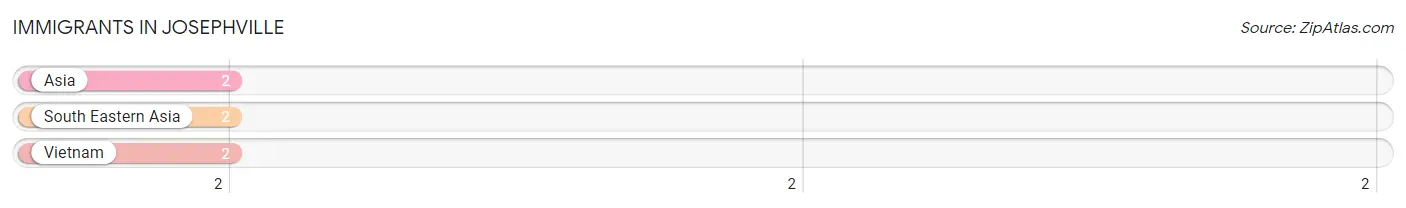
The most numerous immigrant groups reported in Josephville came from Asia (2 | 0.3%), South Eastern Asia (2 | 0.3%), and Vietnam (2 | 0.3%), together accounting for 0.8% of all Josephville residents.
| Immigration Origin | # Population | % Population |
| Asia | 2 | 0.3% |
| South Eastern Asia | 2 | 0.3% |
| Vietnam | 2 | 0.3% | View All 3 Rows |
Sex and Age in Josephville
Sex and Age in Josephville
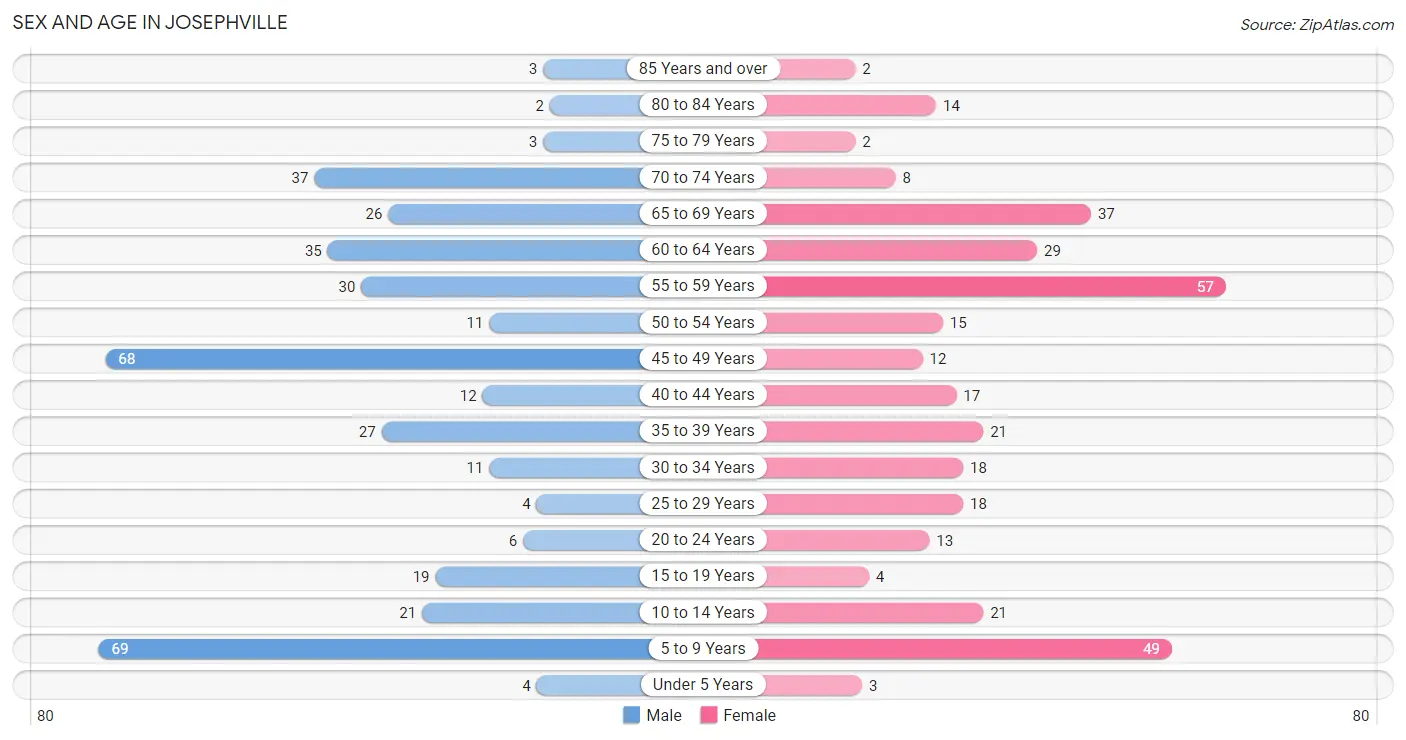
The most populous age groups in Josephville are 5 to 9 Years (69 | 17.8%) for men and 55 to 59 Years (57 | 16.8%) for women.
| Age Bracket | Male | Female |
| Under 5 Years | 4 (1.0%) | 3 (0.9%) |
| 5 to 9 Years | 69 (17.8%) | 49 (14.4%) |
| 10 to 14 Years | 21 (5.4%) | 21 (6.2%) |
| 15 to 19 Years | 19 (4.9%) | 4 (1.2%) |
| 20 to 24 Years | 6 (1.5%) | 13 (3.8%) |
| 25 to 29 Years | 4 (1.0%) | 18 (5.3%) |
| 30 to 34 Years | 11 (2.8%) | 18 (5.3%) |
| 35 to 39 Years | 27 (7.0%) | 21 (6.2%) |
| 40 to 44 Years | 12 (3.1%) | 17 (5.0%) |
| 45 to 49 Years | 68 (17.5%) | 12 (3.5%) |
| 50 to 54 Years | 11 (2.8%) | 15 (4.4%) |
| 55 to 59 Years | 30 (7.7%) | 57 (16.8%) |
| 60 to 64 Years | 35 (9.0%) | 29 (8.5%) |
| 65 to 69 Years | 26 (6.7%) | 37 (10.9%) |
| 70 to 74 Years | 37 (9.5%) | 8 (2.4%) |
| 75 to 79 Years | 3 (0.8%) | 2 (0.6%) |
| 80 to 84 Years | 2 (0.5%) | 14 (4.1%) |
| 85 Years and over | 3 (0.8%) | 2 (0.6%) |
| Total | 388 (100.0%) | 340 (100.0%) |
Families and Households in Josephville
Median Family Size in Josephville
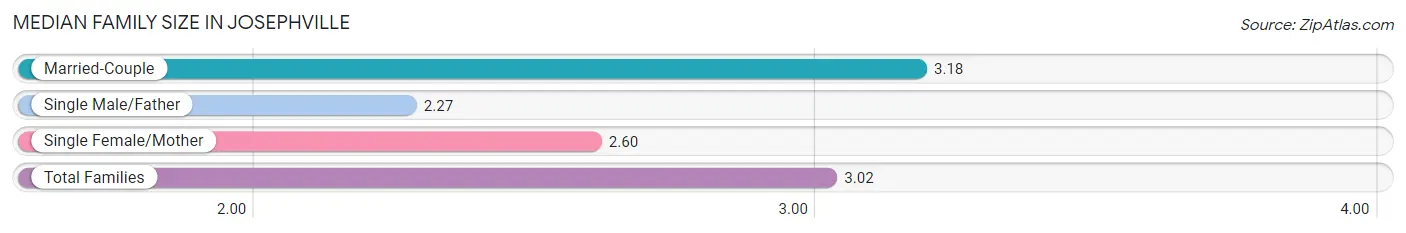
The median family size in Josephville is 3.02 persons per family, with married-couple families (179 | 81.0%) accounting for the largest median family size of 3.18 persons per family. On the other hand, single male/father families (37 | 16.7%) represent the smallest median family size with 2.27 persons per family.
| Family Type | # Families | Family Size |
| Married-Couple | 179 (81.0%) | 3.18 |
| Single Male/Father | 37 (16.7%) | 2.27 |
| Single Female/Mother | 5 (2.3%) | 2.60 |
| Total Families | 221 (100.0%) | 3.02 |
Median Household Size in Josephville
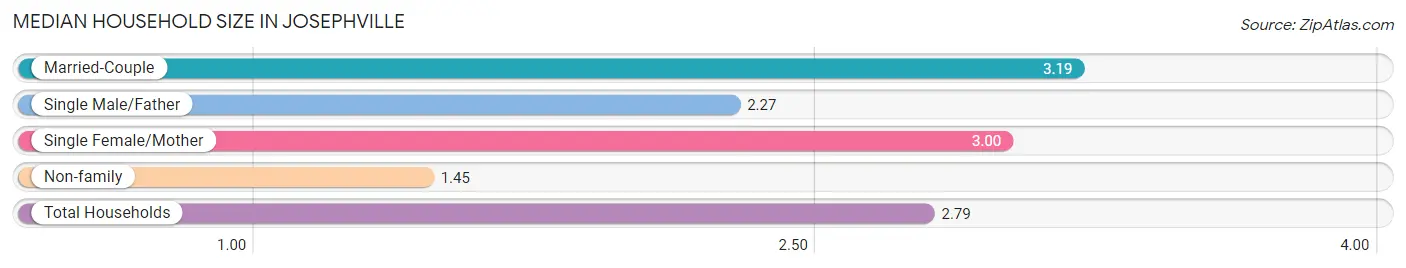
The median household size in Josephville is 2.79 persons per household, with married-couple households (179 | 68.6%) accounting for the largest median household size of 3.19 persons per household. non-family households (40 | 15.3%) represent the smallest median household size with 1.45 persons per household.
| Household Type | # Households | Household Size |
| Married-Couple | 179 (68.6%) | 3.19 |
| Single Male/Father | 37 (14.2%) | 2.27 |
| Single Female/Mother | 5 (1.9%) | 3.00 |
| Non-family | 40 (15.3%) | 1.45 |
| Total Households | 261 (100.0%) | 2.79 |
Household Size by Marriage Status in Josephville
Out of a total of 261 households in Josephville, 221 (84.7%) are family households, while 40 (15.3%) are nonfamily households. The most numerous type of family households are 2-person households, comprising 130, and the most common type of nonfamily households are 1-person households, comprising 27.
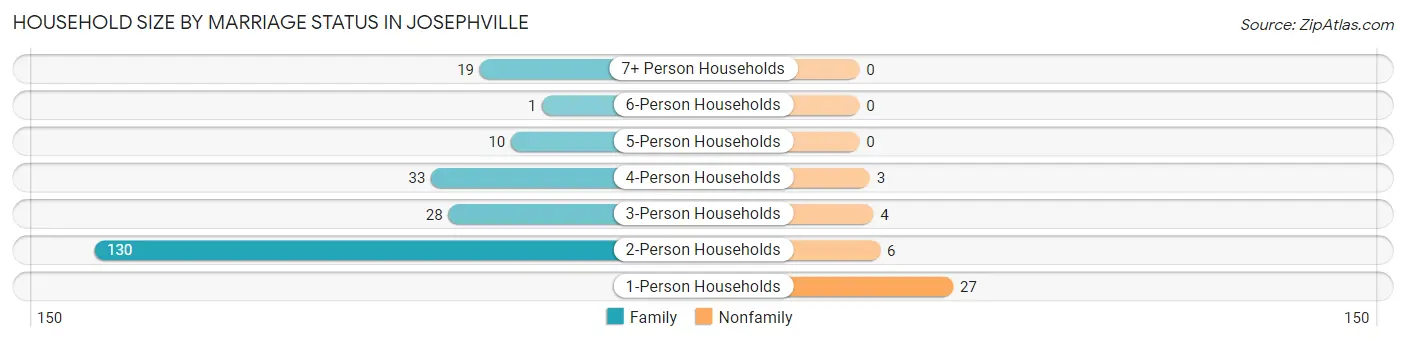
| Household Size | Family Households | Nonfamily Households |
| 1-Person Households | - | 27 (10.3%) |
| 2-Person Households | 130 (49.8%) | 6 (2.3%) |
| 3-Person Households | 28 (10.7%) | 4 (1.5%) |
| 4-Person Households | 33 (12.6%) | 3 (1.1%) |
| 5-Person Households | 10 (3.8%) | 0 (0.0%) |
| 6-Person Households | 1 (0.4%) | 0 (0.0%) |
| 7+ Person Households | 19 (7.3%) | 0 (0.0%) |
| Total | 221 (84.7%) | 40 (15.3%) |
Female Fertility in Josephville
Fertility by Age in Josephville
| Age Bracket | Women with Births | Births / 1,000 Women |
| 15 to 19 years | 0 (0.0%) | 0.0 |
| 20 to 34 years | 0 (0.0%) | 0.0 |
| 35 to 50 years | 0 (0.0%) | 0.0 |
| Total | 0 (0.0%) | 0.0 |
Fertility by Age by Marriage Status in Josephville
| Age Bracket | Married | Unmarried |
| 15 to 19 years | 0 (0.0%) | 0 (0.0%) |
| 20 to 34 years | 0 (0.0%) | 0 (0.0%) |
| 35 to 50 years | 0 (0.0%) | 0 (0.0%) |
| Total | 0 (0.0%) | 0 (0.0%) |
Fertility by Education in Josephville
| Educational Attainment | Women with Births | Births / 1,000 Women |
| Less than High School | 0 (0.0%) | 0.0 |
| High School Diploma | 0 (0.0%) | 0.0 |
| College or Associate's Degree | 0 (0.0%) | 0.0 |
| Bachelor's Degree | 0 (0.0%) | 0.0 |
| Graduate Degree | 0 (0.0%) | 0.0 |
| Total | 0 (0.0%) | 0.0 |
Fertility by Education by Marriage Status in Josephville

| Educational Attainment | Married | Unmarried |
| Less than High School | 0 (0.0%) | 0 (0.0%) |
| High School Diploma | 0 (0.0%) | 0 (0.0%) |
| College or Associate's Degree | 0 (0.0%) | 0 (0.0%) |
| Bachelor's Degree | 0 (0.0%) | 0 (0.0%) |
| Graduate Degree | 0 (0.0%) | 0 (0.0%) |
| Total | 0 (0.0%) | 0 (0.0%) |
Employment Characteristics in Josephville
Employment by Class of Employer in Josephville
Among the 312 employed individuals in Josephville, private company employees (228 | 73.1%), self-employed (incorporated) (26 | 8.3%), and not-for-profit organizations (24 | 7.7%) make up the most common classes of employment.
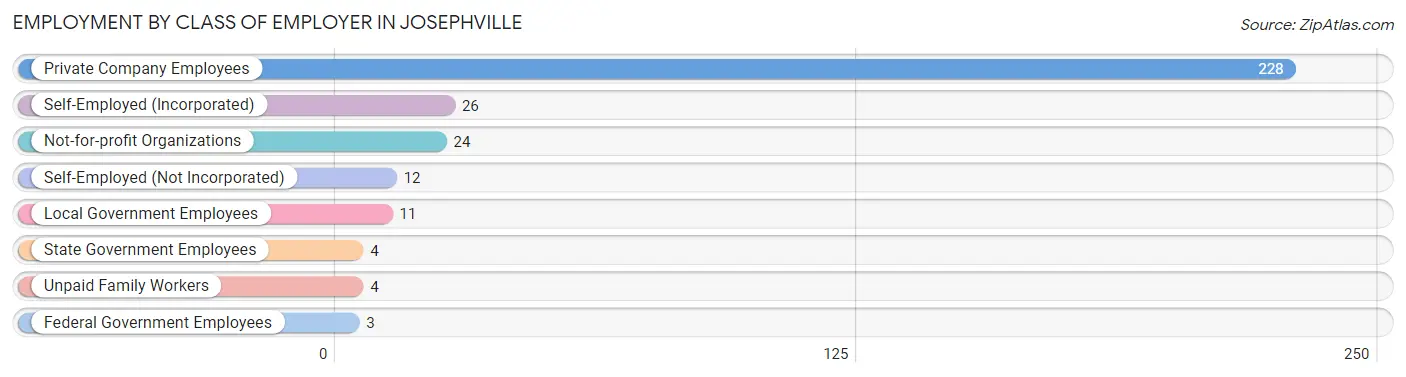
| Employer Class | # Employees | % Employees |
| Private Company Employees | 228 | 73.1% |
| Self-Employed (Incorporated) | 26 | 8.3% |
| Self-Employed (Not Incorporated) | 12 | 3.8% |
| Not-for-profit Organizations | 24 | 7.7% |
| Local Government Employees | 11 | 3.5% |
| State Government Employees | 4 | 1.3% |
| Federal Government Employees | 3 | 1.0% |
| Unpaid Family Workers | 4 | 1.3% |
| Total | 312 | 100.0% |
Employment Status by Age in Josephville
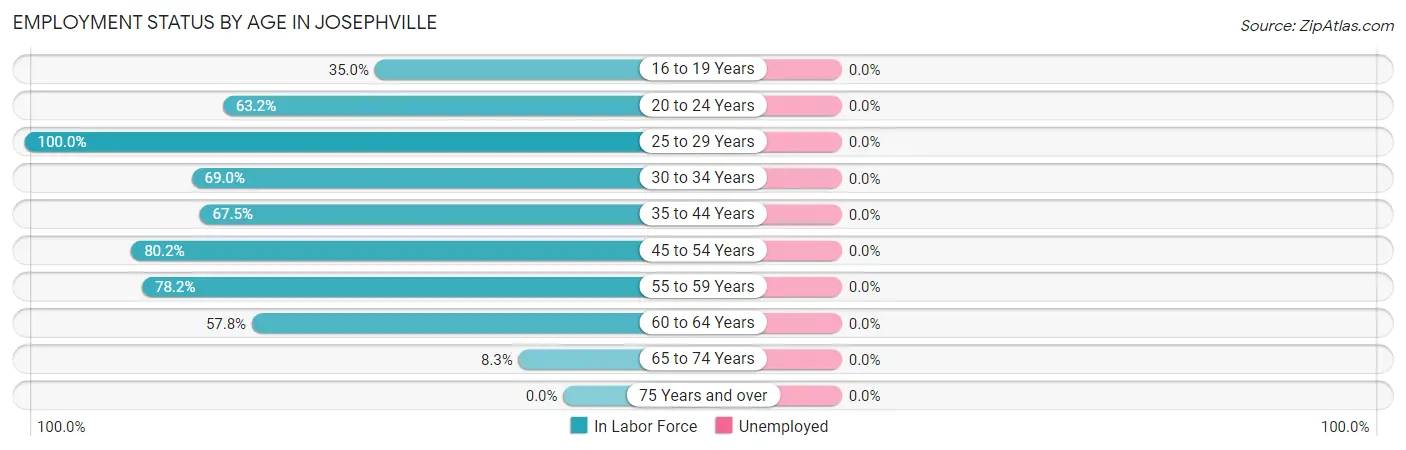
| Age Bracket | In Labor Force | Unemployed |
| 16 to 19 Years | 7 (35.0%) | 0 (0.0%) |
| 20 to 24 Years | 12 (63.2%) | 0 (0.0%) |
| 25 to 29 Years | 22 (100.0%) | 0 (0.0%) |
| 30 to 34 Years | 20 (69.0%) | 0 (0.0%) |
| 35 to 44 Years | 52 (67.5%) | 0 (0.0%) |
| 45 to 54 Years | 85 (80.2%) | 0 (0.0%) |
| 55 to 59 Years | 68 (78.2%) | 0 (0.0%) |
| 60 to 64 Years | 37 (57.8%) | 0 (0.0%) |
| 65 to 74 Years | 9 (8.3%) | 0 (0.0%) |
| 75 Years and over | 0 (0.0%) | 0 (0.0%) |
| Total | 312 (55.9%) | 0 (0.0%) |
Employment Status by Educational Attainment in Josephville
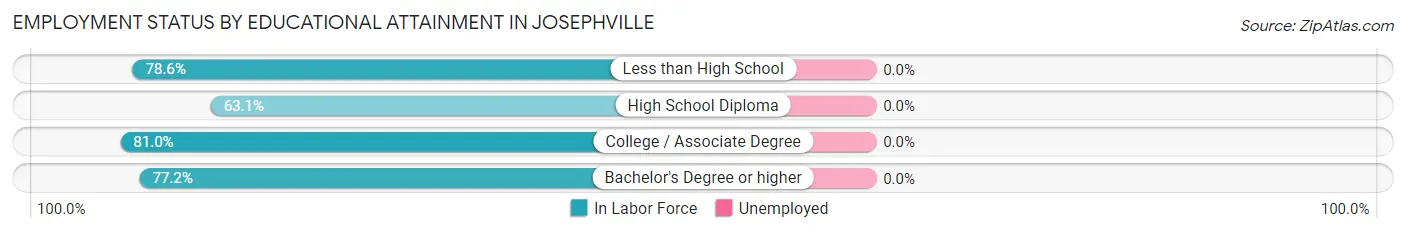
| Educational Attainment | In Labor Force | Unemployed |
| Less than High School | 11 (78.6%) | 0 (0.0%) |
| High School Diploma | 70 (63.1%) | 0 (0.0%) |
| College / Associate Degree | 51 (81.0%) | 0 (0.0%) |
| Bachelor's Degree or higher | 152 (77.2%) | 0 (0.0%) |
| Total | 284 (73.8%) | 0 (0.0%) |
Employment Occupations by Sex in Josephville
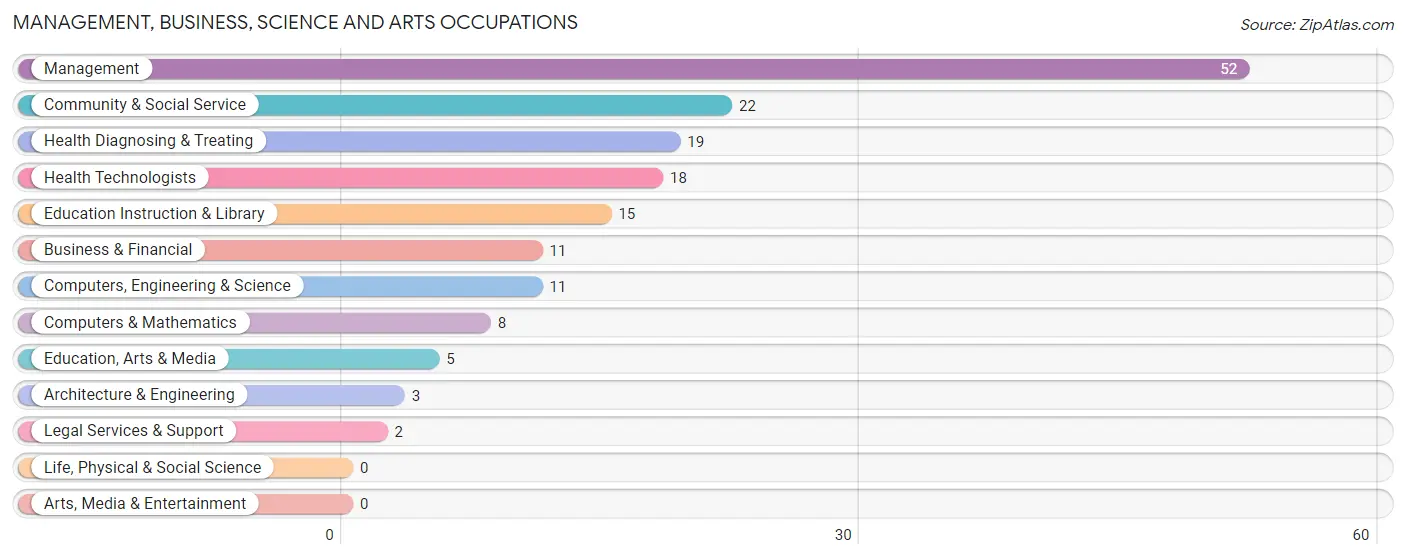
Management, Business, Science and Arts Occupations
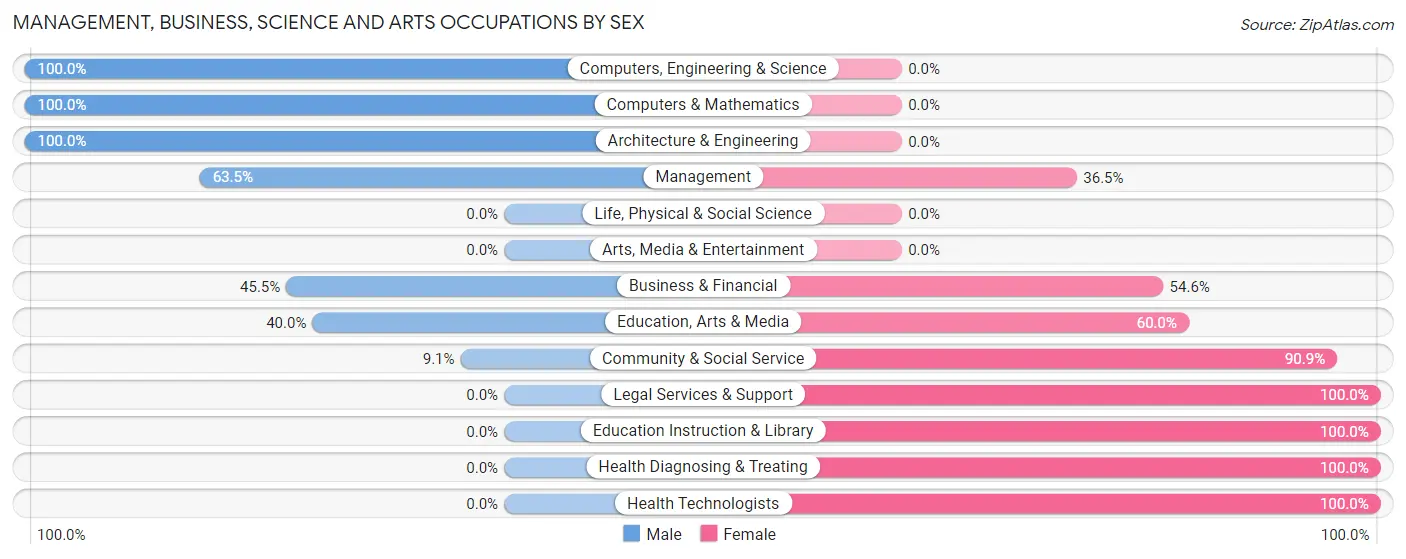
The most common Management, Business, Science and Arts occupations in Josephville are Management (52 | 16.7%), Community & Social Service (22 | 7.0%), Health Diagnosing & Treating (19 | 6.1%), Health Technologists (18 | 5.8%), and Education Instruction & Library (15 | 4.8%).
Management, Business, Science and Arts Occupations by Sex
Within the Management, Business, Science and Arts occupations in Josephville, the most male-oriented occupations are Computers, Engineering & Science (100.0%), Computers & Mathematics (100.0%), and Architecture & Engineering (100.0%), while the most female-oriented occupations are Legal Services & Support (100.0%), Education Instruction & Library (100.0%), and Health Diagnosing & Treating (100.0%).
| Occupation | Male | Female |
| Management | 33 (63.5%) | 19 (36.5%) |
| Business & Financial | 5 (45.5%) | 6 (54.5%) |
| Computers, Engineering & Science | 11 (100.0%) | 0 (0.0%) |
| Computers & Mathematics | 8 (100.0%) | 0 (0.0%) |
| Architecture & Engineering | 3 (100.0%) | 0 (0.0%) |
| Life, Physical & Social Science | 0 (0.0%) | 0 (0.0%) |
| Community & Social Service | 2 (9.1%) | 20 (90.9%) |
| Education, Arts & Media | 2 (40.0%) | 3 (60.0%) |
| Legal Services & Support | 0 (0.0%) | 2 (100.0%) |
| Education Instruction & Library | 0 (0.0%) | 15 (100.0%) |
| Arts, Media & Entertainment | 0 (0.0%) | 0 (0.0%) |
| Health Diagnosing & Treating | 0 (0.0%) | 19 (100.0%) |
| Health Technologists | 0 (0.0%) | 18 (100.0%) |
| Total (Category) | 51 (44.4%) | 64 (55.6%) |
| Total (Overall) | 164 (52.6%) | 148 (47.4%) |
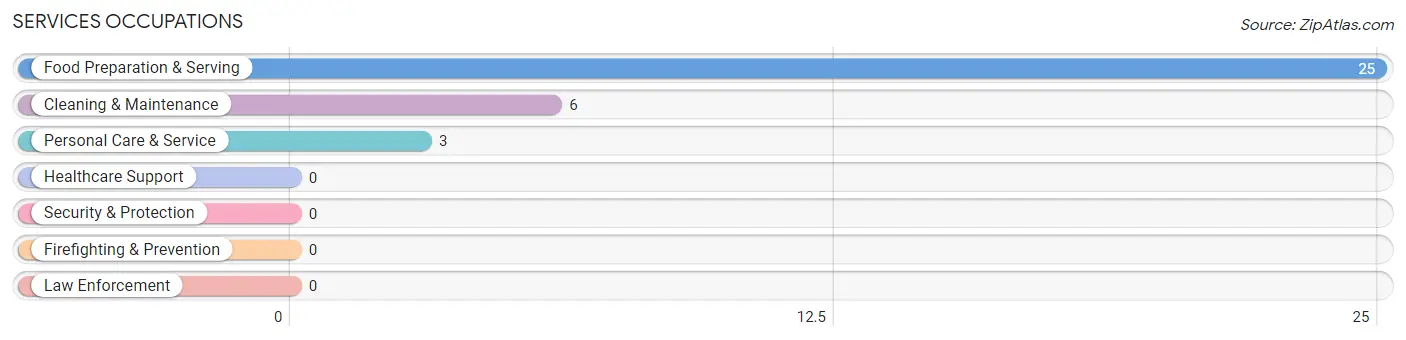
Services Occupations
The most common Services occupations in Josephville are Food Preparation & Serving (25 | 8.0%), Cleaning & Maintenance (6 | 1.9%), and Personal Care & Service (3 | 1.0%).
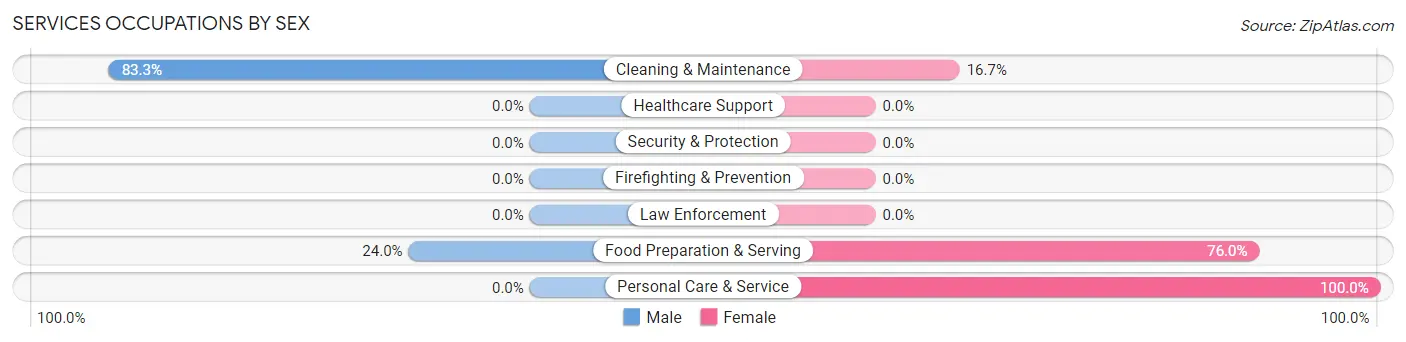
Services Occupations by Sex
Within the Services occupations in Josephville, the most male-oriented occupations are Cleaning & Maintenance (83.3%), and Food Preparation & Serving (24.0%), while the most female-oriented occupations are Personal Care & Service (100.0%), Food Preparation & Serving (76.0%), and Cleaning & Maintenance (16.7%).
| Occupation | Male | Female |
| Healthcare Support | 0 (0.0%) | 0 (0.0%) |
| Security & Protection | 0 (0.0%) | 0 (0.0%) |
| Firefighting & Prevention | 0 (0.0%) | 0 (0.0%) |
| Law Enforcement | 0 (0.0%) | 0 (0.0%) |
| Food Preparation & Serving | 6 (24.0%) | 19 (76.0%) |
| Cleaning & Maintenance | 5 (83.3%) | 1 (16.7%) |
| Personal Care & Service | 0 (0.0%) | 3 (100.0%) |
| Total (Category) | 11 (32.4%) | 23 (67.6%) |
| Total (Overall) | 164 (52.6%) | 148 (47.4%) |
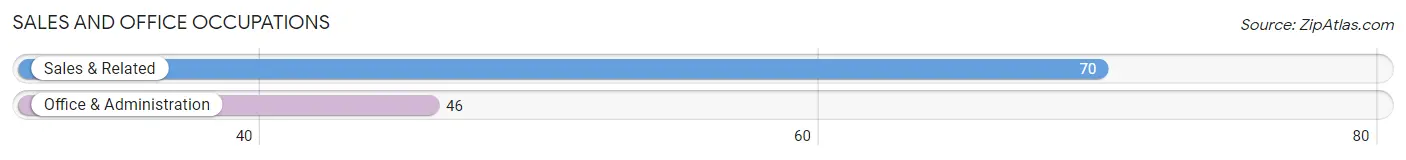
Sales and Office Occupations
The most common Sales and Office occupations in Josephville are Sales & Related (70 | 22.4%), and Office & Administration (46 | 14.7%).
Sales and Office Occupations by Sex
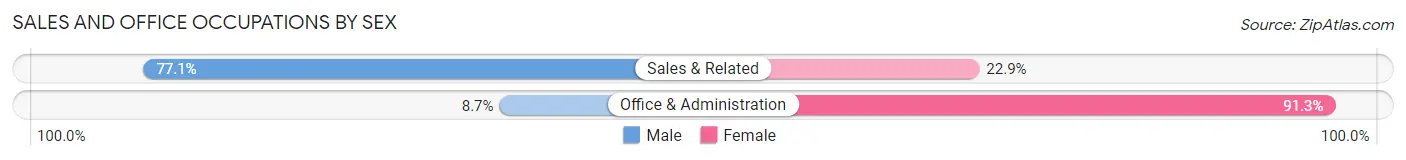
| Occupation | Male | Female |
| Sales & Related | 54 (77.1%) | 16 (22.9%) |
| Office & Administration | 4 (8.7%) | 42 (91.3%) |
| Total (Category) | 58 (50.0%) | 58 (50.0%) |
| Total (Overall) | 164 (52.6%) | 148 (47.4%) |
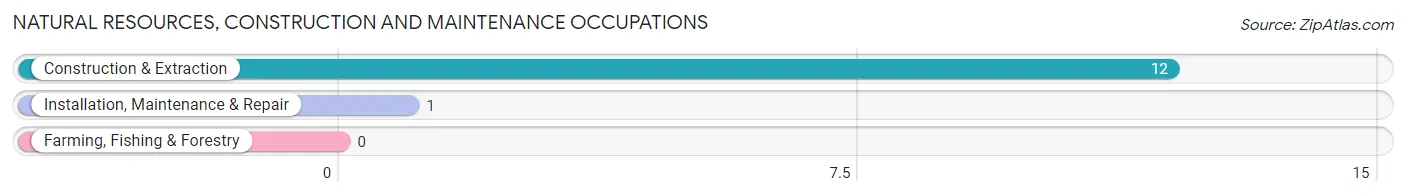
Natural Resources, Construction and Maintenance Occupations
The most common Natural Resources, Construction and Maintenance occupations in Josephville are Construction & Extraction (12 | 3.8%), and Installation, Maintenance & Repair (1 | 0.3%).
Natural Resources, Construction and Maintenance Occupations by Sex
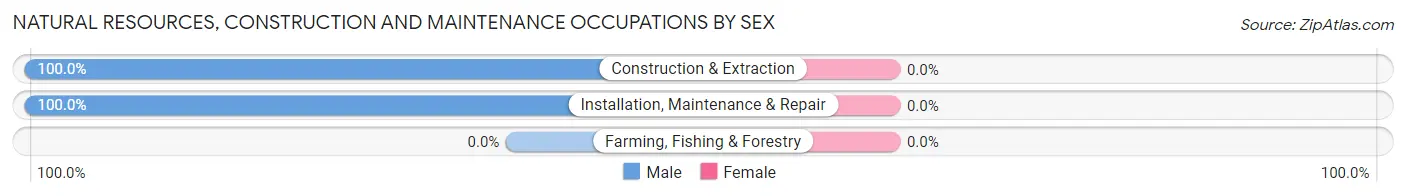
| Occupation | Male | Female |
| Farming, Fishing & Forestry | 0 (0.0%) | 0 (0.0%) |
| Construction & Extraction | 12 (100.0%) | 0 (0.0%) |
| Installation, Maintenance & Repair | 1 (100.0%) | 0 (0.0%) |
| Total (Category) | 13 (100.0%) | 0 (0.0%) |
| Total (Overall) | 164 (52.6%) | 148 (47.4%) |
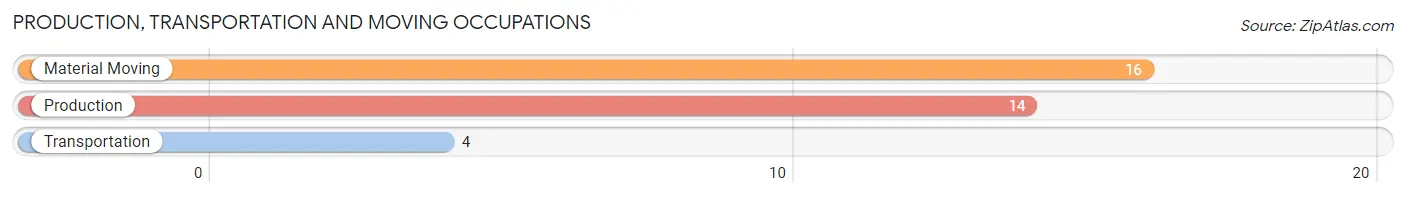
Production, Transportation and Moving Occupations
The most common Production, Transportation and Moving occupations in Josephville are Material Moving (16 | 5.1%), Production (14 | 4.5%), and Transportation (4 | 1.3%).
Production, Transportation and Moving Occupations by Sex
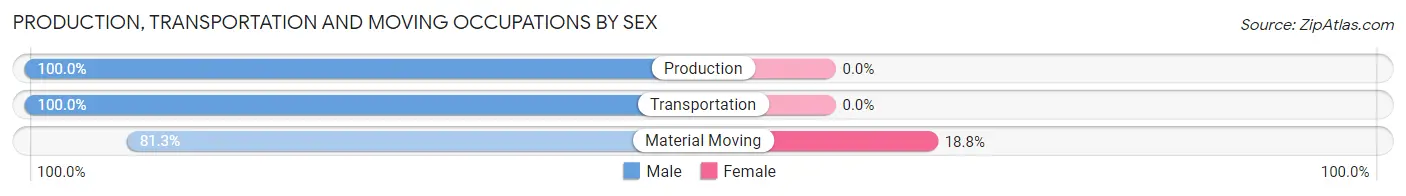
| Occupation | Male | Female |
| Production | 14 (100.0%) | 0 (0.0%) |
| Transportation | 4 (100.0%) | 0 (0.0%) |
| Material Moving | 13 (81.2%) | 3 (18.8%) |
| Total (Category) | 31 (91.2%) | 3 (8.8%) |
| Total (Overall) | 164 (52.6%) | 148 (47.4%) |
Employment Industries by Sex in Josephville
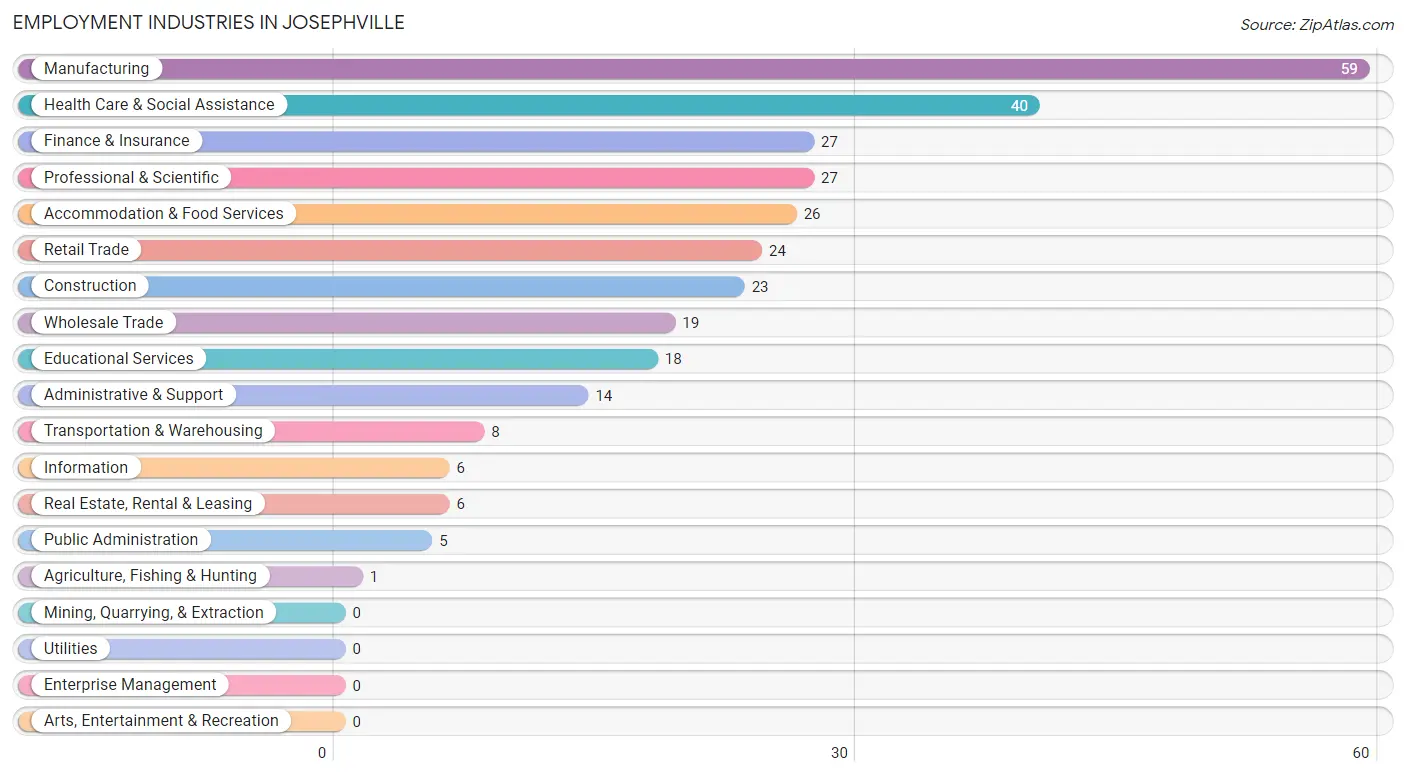
Employment Industries in Josephville
The major employment industries in Josephville include Manufacturing (59 | 18.9%), Health Care & Social Assistance (40 | 12.8%), Finance & Insurance (27 | 8.6%), Professional & Scientific (27 | 8.6%), and Accommodation & Food Services (26 | 8.3%).
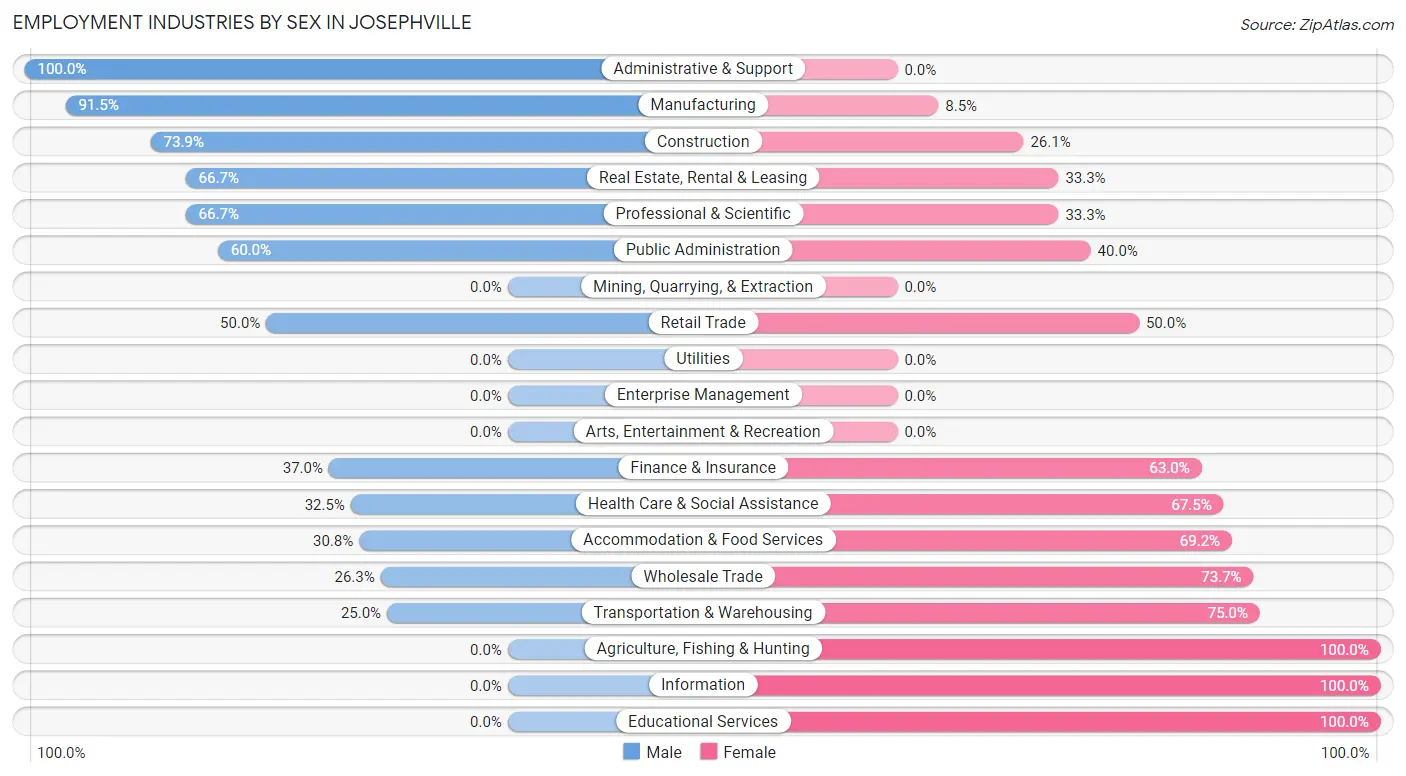
Employment Industries by Sex in Josephville
The Josephville industries that see more men than women are Administrative & Support (100.0%), Manufacturing (91.5%), and Construction (73.9%), whereas the industries that tend to have a higher number of women are Agriculture, Fishing & Hunting (100.0%), Information (100.0%), and Educational Services (100.0%).
| Industry | Male | Female |
| Agriculture, Fishing & Hunting | 0 (0.0%) | 1 (100.0%) |
| Mining, Quarrying, & Extraction | 0 (0.0%) | 0 (0.0%) |
| Construction | 17 (73.9%) | 6 (26.1%) |
| Manufacturing | 54 (91.5%) | 5 (8.5%) |
| Wholesale Trade | 5 (26.3%) | 14 (73.7%) |
| Retail Trade | 12 (50.0%) | 12 (50.0%) |
| Transportation & Warehousing | 2 (25.0%) | 6 (75.0%) |
| Utilities | 0 (0.0%) | 0 (0.0%) |
| Information | 0 (0.0%) | 6 (100.0%) |
| Finance & Insurance | 10 (37.0%) | 17 (63.0%) |
| Real Estate, Rental & Leasing | 4 (66.7%) | 2 (33.3%) |
| Professional & Scientific | 18 (66.7%) | 9 (33.3%) |
| Enterprise Management | 0 (0.0%) | 0 (0.0%) |
| Administrative & Support | 14 (100.0%) | 0 (0.0%) |
| Educational Services | 0 (0.0%) | 18 (100.0%) |
| Health Care & Social Assistance | 13 (32.5%) | 27 (67.5%) |
| Arts, Entertainment & Recreation | 0 (0.0%) | 0 (0.0%) |
| Accommodation & Food Services | 8 (30.8%) | 18 (69.2%) |
| Public Administration | 3 (60.0%) | 2 (40.0%) |
| Total | 164 (52.6%) | 148 (47.4%) |
Education in Josephville
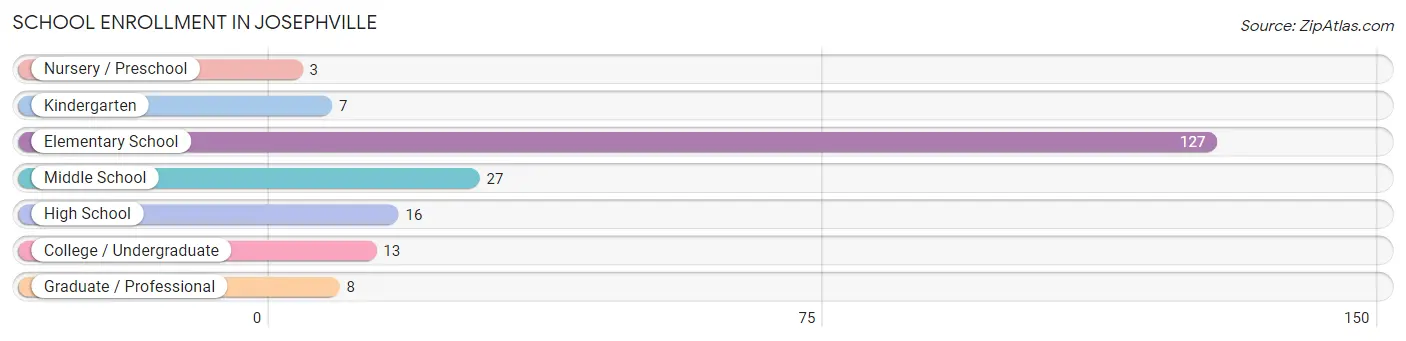
School Enrollment in Josephville
The most common levels of schooling among the 201 students in Josephville are elementary school (127 | 63.2%), middle school (27 | 13.4%), and high school (16 | 8.0%).
| School Level | # Students | % Students |
| Nursery / Preschool | 3 | 1.5% |
| Kindergarten | 7 | 3.5% |
| Elementary School | 127 | 63.2% |
| Middle School | 27 | 13.4% |
| High School | 16 | 8.0% |
| College / Undergraduate | 13 | 6.5% |
| Graduate / Professional | 8 | 4.0% |
| Total | 201 | 100.0% |
School Enrollment by Age by Funding Source in Josephville
Out of a total of 201 students who are enrolled in schools in Josephville, 52 (25.9%) attend a private institution, while the remaining 149 (74.1%) are enrolled in public schools. The age group of 3 to 4 year olds has the highest likelihood of being enrolled in private schools, with 5 (100.0% in the age bracket) enrolled. Conversely, the age group of 35 years and over has the lowest likelihood of being enrolled in a private school, with 1 (100.0% in the age bracket) attending a public institution.
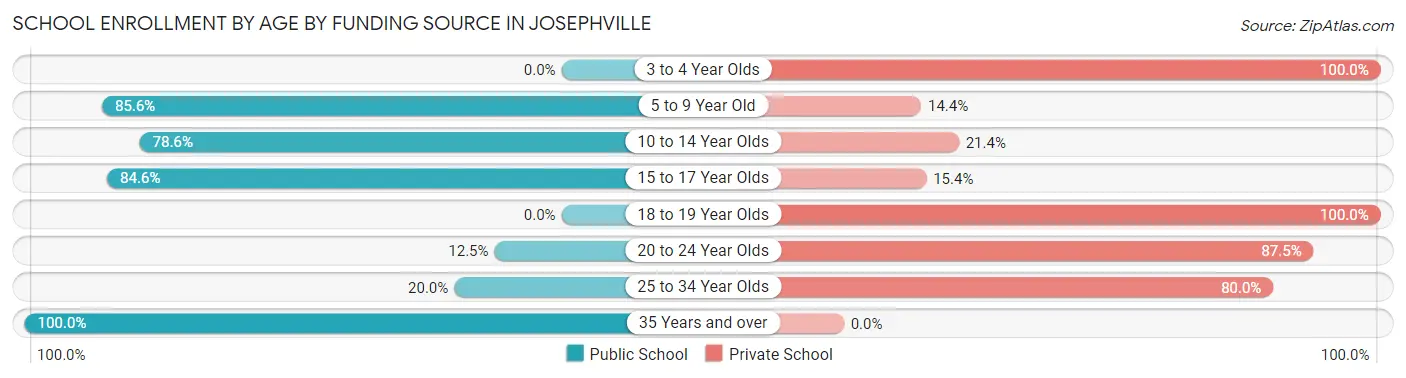
| Age Bracket | Public School | Private School |
| 3 to 4 Year Olds | 0 (0.0%) | 5 (100.0%) |
| 5 to 9 Year Old | 101 (85.6%) | 17 (14.4%) |
| 10 to 14 Year Olds | 33 (78.6%) | 9 (21.4%) |
| 15 to 17 Year Olds | 11 (84.6%) | 2 (15.4%) |
| 18 to 19 Year Olds | 0 (0.0%) | 4 (100.0%) |
| 20 to 24 Year Olds | 1 (12.5%) | 7 (87.5%) |
| 25 to 34 Year Olds | 2 (20.0%) | 8 (80.0%) |
| 35 Years and over | 1 (100.0%) | 0 (0.0%) |
| Total | 149 (74.1%) | 52 (25.9%) |
Educational Attainment by Field of Study in Josephville
Business (89 | 39.7%), education (29 | 13.0%), science & technology (21 | 9.4%), physical & health sciences (18 | 8.0%), and bio, nature & agricultural (15 | 6.7%) are the most common fields of study among 224 individuals in Josephville who have obtained a bachelor's degree or higher.
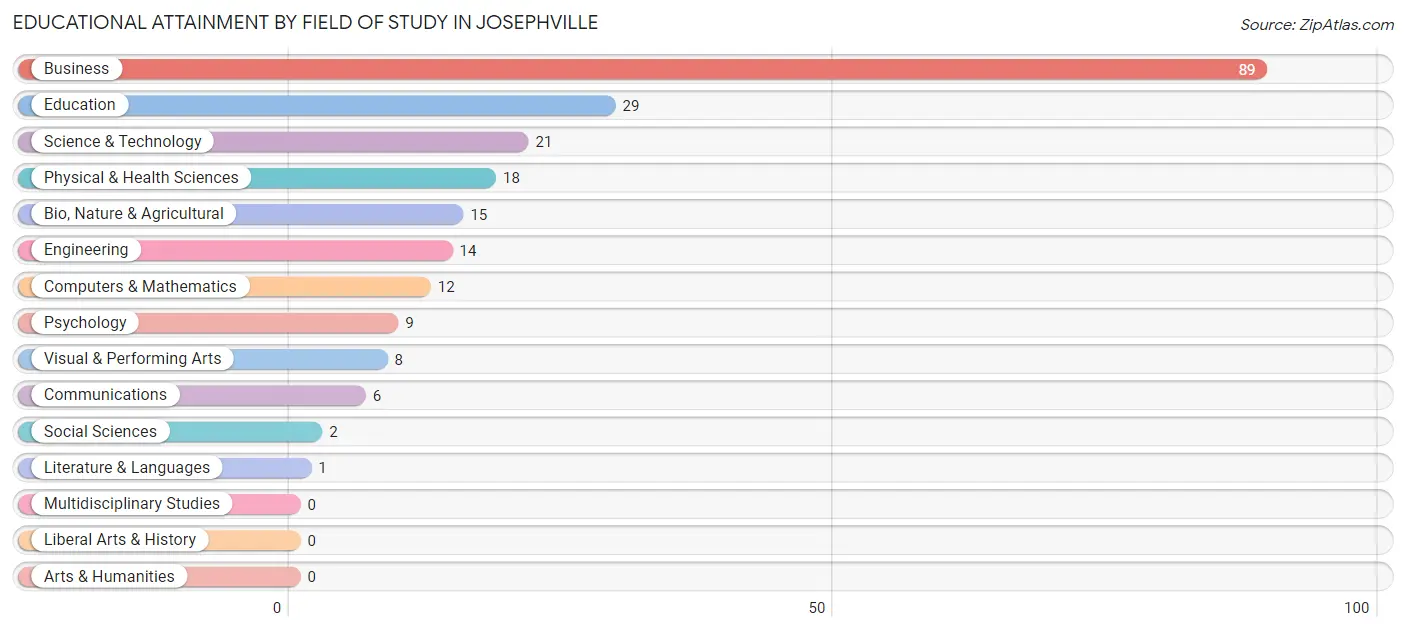
| Field of Study | # Graduates | % Graduates |
| Computers & Mathematics | 12 | 5.4% |
| Bio, Nature & Agricultural | 15 | 6.7% |
| Physical & Health Sciences | 18 | 8.0% |
| Psychology | 9 | 4.0% |
| Social Sciences | 2 | 0.9% |
| Engineering | 14 | 6.2% |
| Multidisciplinary Studies | 0 | 0.0% |
| Science & Technology | 21 | 9.4% |
| Business | 89 | 39.7% |
| Education | 29 | 13.0% |
| Literature & Languages | 1 | 0.4% |
| Liberal Arts & History | 0 | 0.0% |
| Visual & Performing Arts | 8 | 3.6% |
| Communications | 6 | 2.7% |
| Arts & Humanities | 0 | 0.0% |
| Total | 224 | 100.0% |
Transportation & Commute in Josephville
Vehicle Availability by Sex in Josephville
The most prevalent vehicle ownership categories in Josephville are males with 3 vehicles (53, accounting for 32.3%) and females with 3 vehicles (31, making up 35.8%).
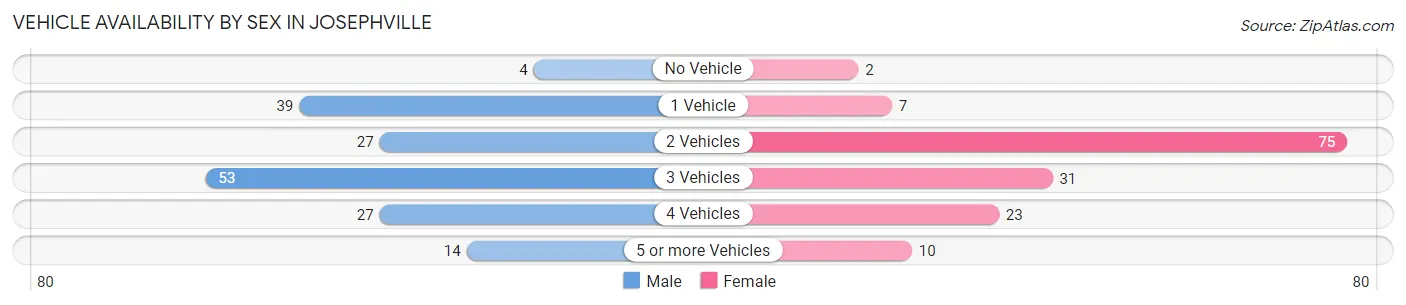
| Vehicles Available | Male | Female |
| No Vehicle | 4 (2.4%) | 2 (1.3%) |
| 1 Vehicle | 39 (23.8%) | 7 (4.7%) |
| 2 Vehicles | 27 (16.5%) | 75 (50.7%) |
| 3 Vehicles | 53 (32.3%) | 31 (20.9%) |
| 4 Vehicles | 27 (16.5%) | 23 (15.5%) |
| 5 or more Vehicles | 14 (8.5%) | 10 (6.8%) |
| Total | 164 (100.0%) | 148 (100.0%) |
Commute Time in Josephville
The most frequently occuring commute durations in Josephville are 10 to 14 minutes (54 commuters, 25.0%), 15 to 19 minutes (30 commuters, 13.9%), and 30 to 34 minutes (27 commuters, 12.5%).
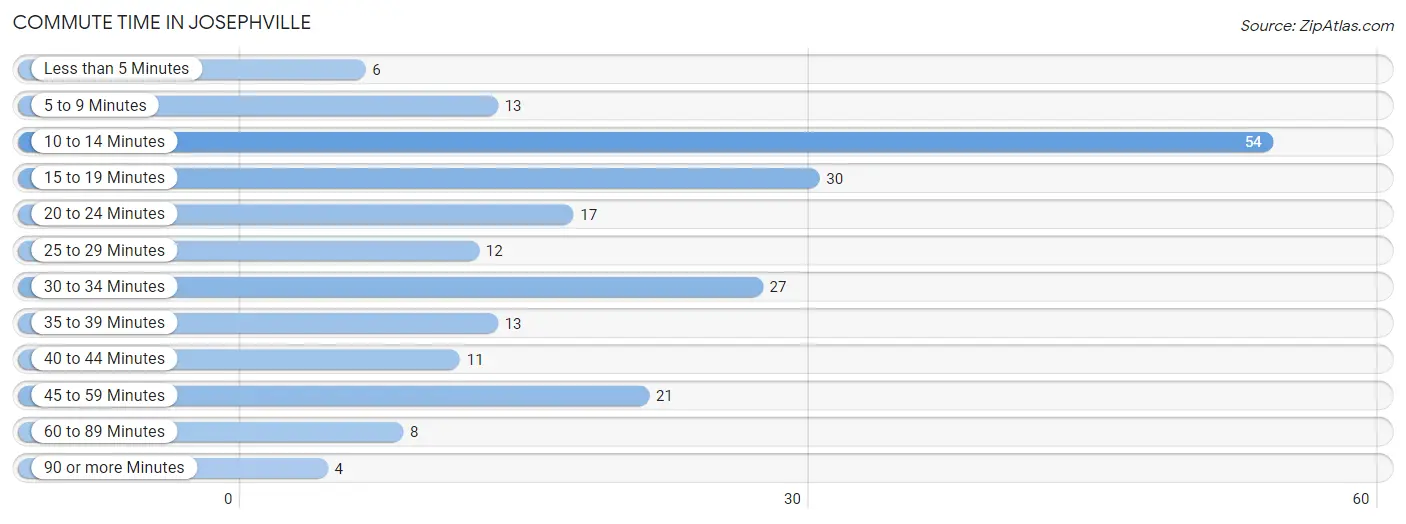
| Commute Time | # Commuters | % Commuters |
| Less than 5 Minutes | 6 | 2.8% |
| 5 to 9 Minutes | 13 | 6.0% |
| 10 to 14 Minutes | 54 | 25.0% |
| 15 to 19 Minutes | 30 | 13.9% |
| 20 to 24 Minutes | 17 | 7.9% |
| 25 to 29 Minutes | 12 | 5.6% |
| 30 to 34 Minutes | 27 | 12.5% |
| 35 to 39 Minutes | 13 | 6.0% |
| 40 to 44 Minutes | 11 | 5.1% |
| 45 to 59 Minutes | 21 | 9.7% |
| 60 to 89 Minutes | 8 | 3.7% |
| 90 or more Minutes | 4 | 1.8% |
Commute Time by Sex in Josephville
The most common commute times in Josephville are 30 to 34 minutes (19 commuters, 20.6%) for males and 10 to 14 minutes (43 commuters, 34.7%) for females.
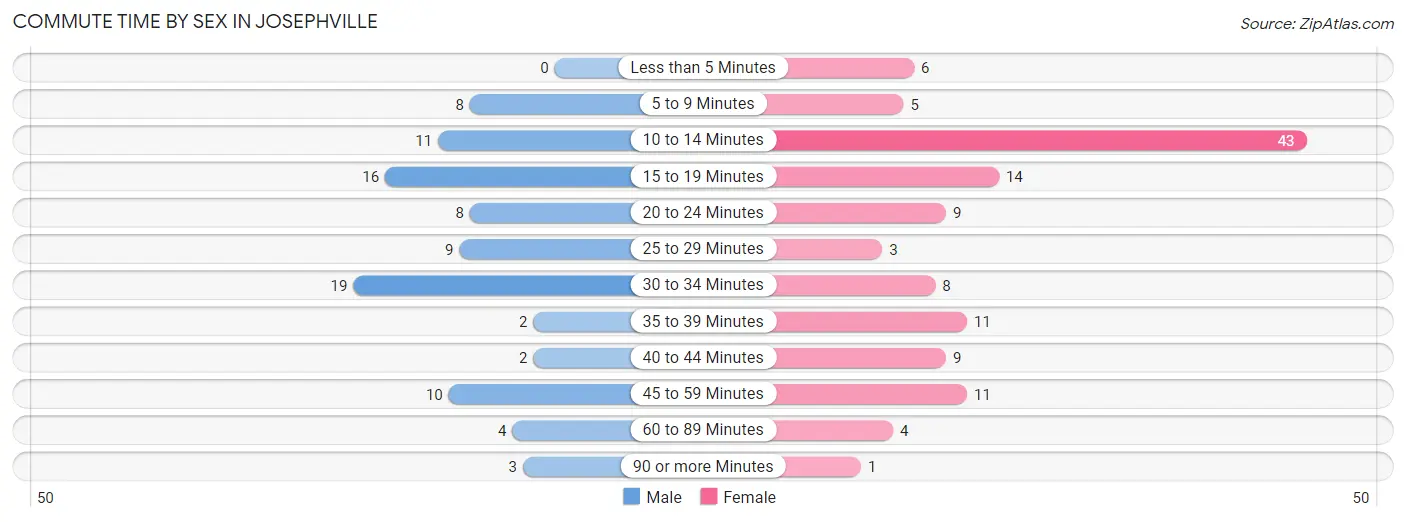
| Commute Time | Male | Female |
| Less than 5 Minutes | 0 (0.0%) | 6 (4.8%) |
| 5 to 9 Minutes | 8 (8.7%) | 5 (4.0%) |
| 10 to 14 Minutes | 11 (12.0%) | 43 (34.7%) |
| 15 to 19 Minutes | 16 (17.4%) | 14 (11.3%) |
| 20 to 24 Minutes | 8 (8.7%) | 9 (7.3%) |
| 25 to 29 Minutes | 9 (9.8%) | 3 (2.4%) |
| 30 to 34 Minutes | 19 (20.6%) | 8 (6.5%) |
| 35 to 39 Minutes | 2 (2.2%) | 11 (8.9%) |
| 40 to 44 Minutes | 2 (2.2%) | 9 (7.3%) |
| 45 to 59 Minutes | 10 (10.9%) | 11 (8.9%) |
| 60 to 89 Minutes | 4 (4.3%) | 4 (3.2%) |
| 90 or more Minutes | 3 (3.3%) | 1 (0.8%) |
Time of Departure to Work by Sex in Josephville
The most frequent times of departure to work in Josephville are 6:30 AM to 6:59 AM (23, 25.0%) for males and 7:00 AM to 7:29 AM (21, 16.9%) for females.
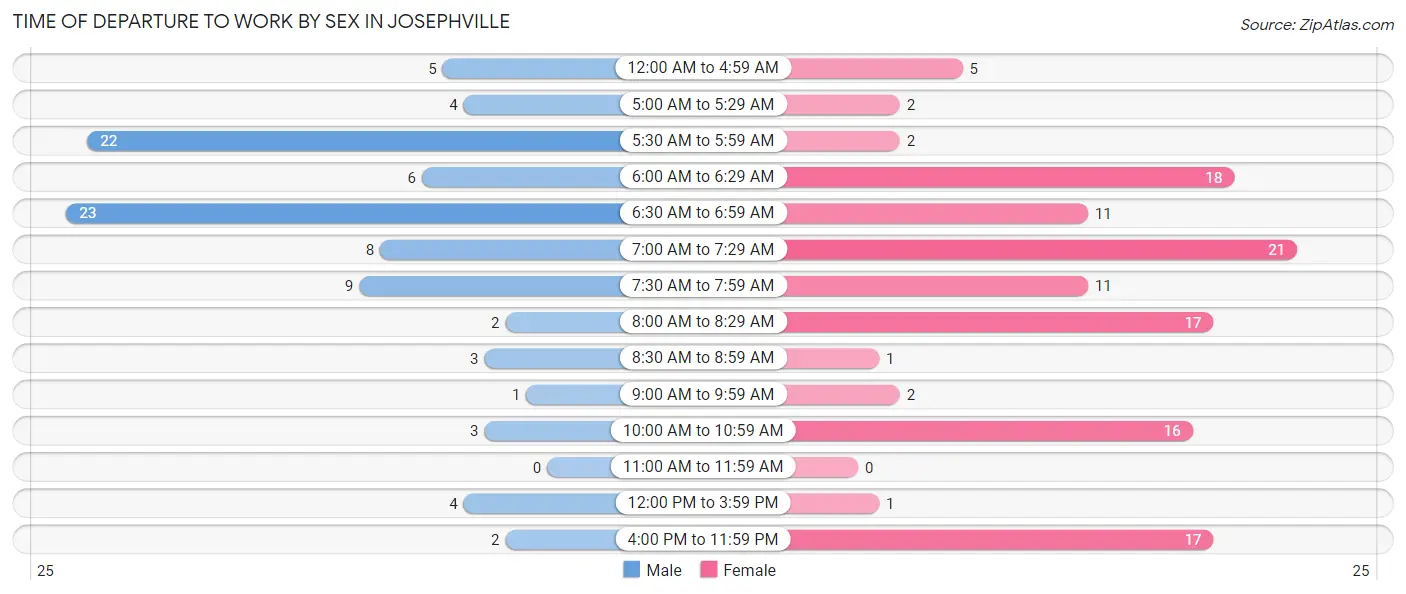
| Time of Departure | Male | Female |
| 12:00 AM to 4:59 AM | 5 (5.4%) | 5 (4.0%) |
| 5:00 AM to 5:29 AM | 4 (4.3%) | 2 (1.6%) |
| 5:30 AM to 5:59 AM | 22 (23.9%) | 2 (1.6%) |
| 6:00 AM to 6:29 AM | 6 (6.5%) | 18 (14.5%) |
| 6:30 AM to 6:59 AM | 23 (25.0%) | 11 (8.9%) |
| 7:00 AM to 7:29 AM | 8 (8.7%) | 21 (16.9%) |
| 7:30 AM to 7:59 AM | 9 (9.8%) | 11 (8.9%) |
| 8:00 AM to 8:29 AM | 2 (2.2%) | 17 (13.7%) |
| 8:30 AM to 8:59 AM | 3 (3.3%) | 1 (0.8%) |
| 9:00 AM to 9:59 AM | 1 (1.1%) | 2 (1.6%) |
| 10:00 AM to 10:59 AM | 3 (3.3%) | 16 (12.9%) |
| 11:00 AM to 11:59 AM | 0 (0.0%) | 0 (0.0%) |
| 12:00 PM to 3:59 PM | 4 (4.3%) | 1 (0.8%) |
| 4:00 PM to 11:59 PM | 2 (2.2%) | 17 (13.7%) |
| Total | 92 (100.0%) | 124 (100.0%) |
Housing Occupancy in Josephville
Occupancy by Ownership in Josephville
Of the total 261 dwellings in Josephville, owner-occupied units account for 216 (82.8%), while renter-occupied units make up 45 (17.2%).
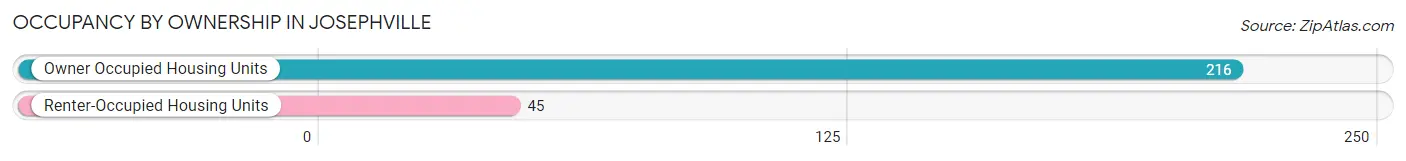
| Occupancy | # Housing Units | % Housing Units |
| Owner Occupied Housing Units | 216 | 82.8% |
| Renter-Occupied Housing Units | 45 | 17.2% |
| Total Occupied Housing Units | 261 | 100.0% |
Occupancy by Household Size in Josephville
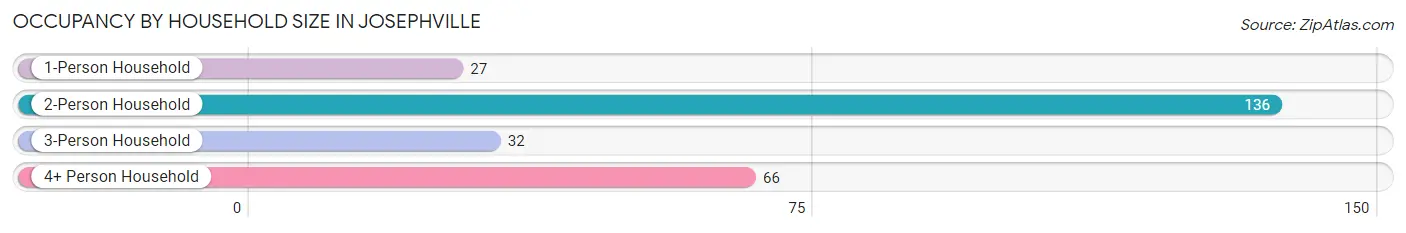
| Household Size | # Housing Units | % Housing Units |
| 1-Person Household | 27 | 10.3% |
| 2-Person Household | 136 | 52.1% |
| 3-Person Household | 32 | 12.3% |
| 4+ Person Household | 66 | 25.3% |
| Total Housing Units | 261 | 100.0% |
Occupancy by Ownership by Household Size in Josephville
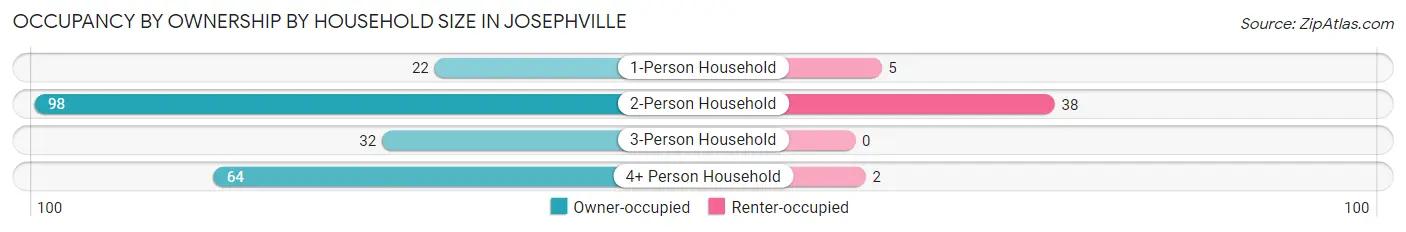
| Household Size | Owner-occupied | Renter-occupied |
| 1-Person Household | 22 (81.5%) | 5 (18.5%) |
| 2-Person Household | 98 (72.1%) | 38 (27.9%) |
| 3-Person Household | 32 (100.0%) | 0 (0.0%) |
| 4+ Person Household | 64 (97.0%) | 2 (3.0%) |
| Total Housing Units | 216 (82.8%) | 45 (17.2%) |
Occupancy by Educational Attainment in Josephville
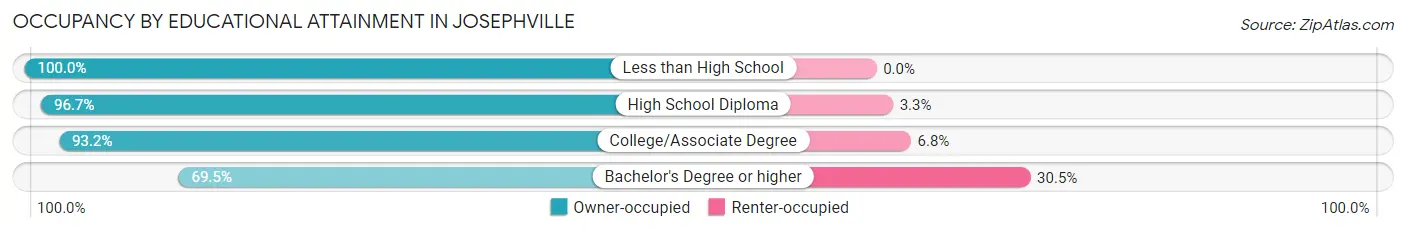
| Household Size | Owner-occupied | Renter-occupied |
| Less than High School | 25 (100.0%) | 0 (0.0%) |
| High School Diploma | 59 (96.7%) | 2 (3.3%) |
| College/Associate Degree | 41 (93.2%) | 3 (6.8%) |
| Bachelor's Degree or higher | 91 (69.5%) | 40 (30.5%) |
Occupancy by Age of Householder in Josephville
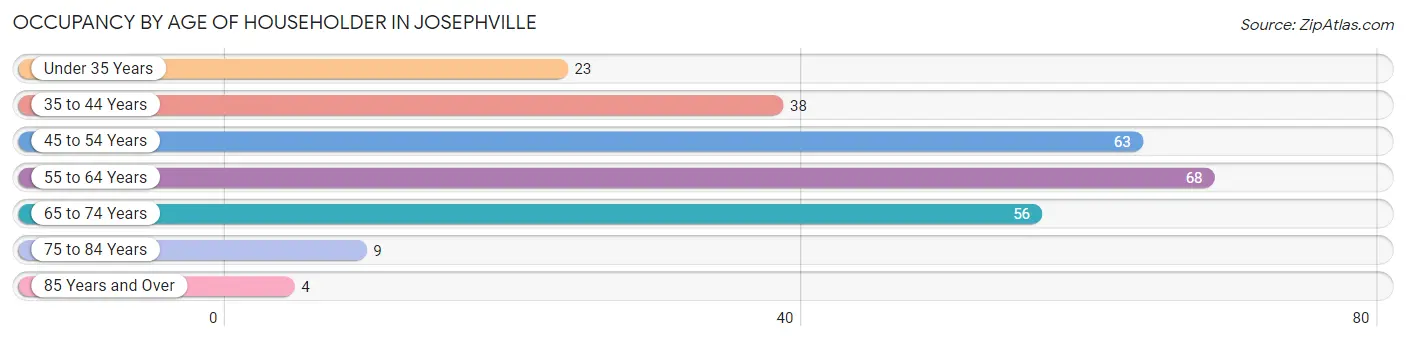
| Age Bracket | # Households | % Households |
| Under 35 Years | 23 | 8.8% |
| 35 to 44 Years | 38 | 14.6% |
| 45 to 54 Years | 63 | 24.1% |
| 55 to 64 Years | 68 | 26.1% |
| 65 to 74 Years | 56 | 21.5% |
| 75 to 84 Years | 9 | 3.5% |
| 85 Years and Over | 4 | 1.5% |
| Total | 261 | 100.0% |
Housing Finances in Josephville
Median Income by Occupancy in Josephville
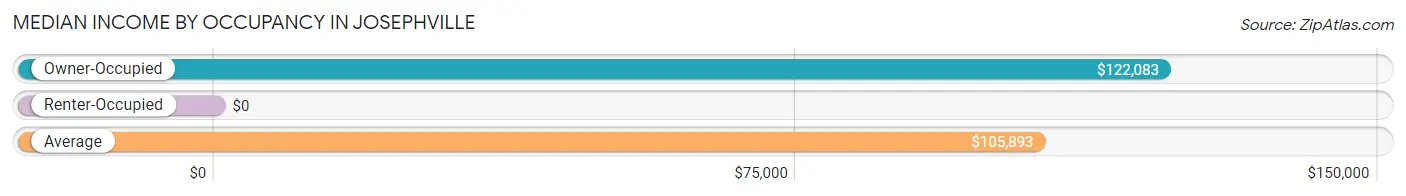
| Occupancy Type | # Households | Median Income |
| Owner-Occupied | 216 (82.8%) | $122,083 |
| Renter-Occupied | 45 (17.2%) | $0 |
| Average | 261 (100.0%) | $105,893 |
Occupancy by Householder Income Bracket in Josephville
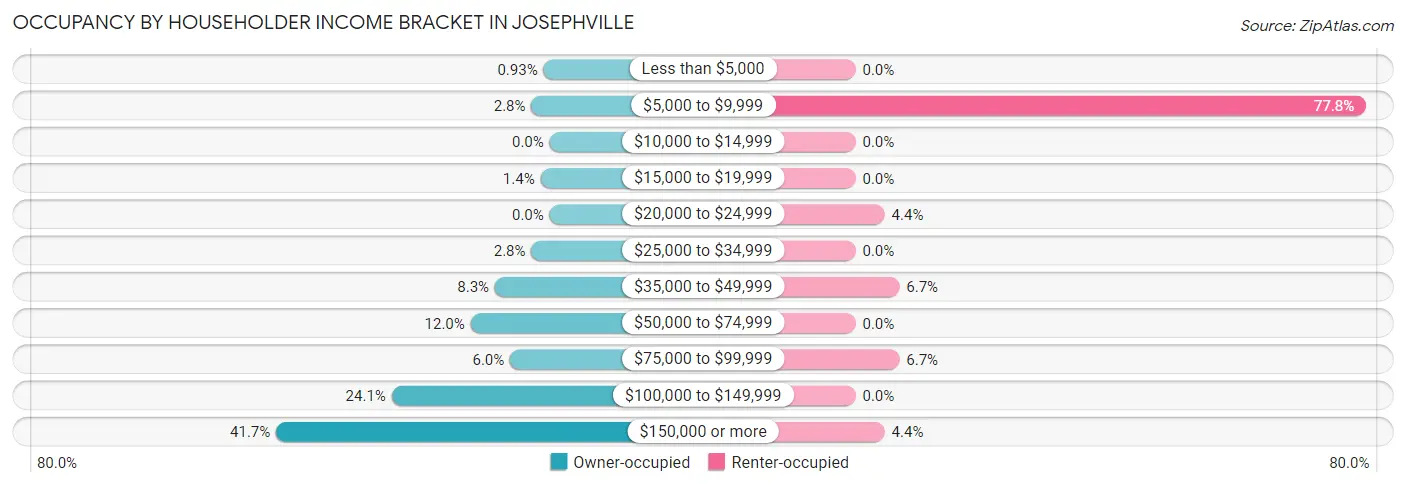
| Income Bracket | Owner-occupied | Renter-occupied |
| Less than $5,000 | 2 (0.9%) | 0 (0.0%) |
| $5,000 to $9,999 | 6 (2.8%) | 35 (77.8%) |
| $10,000 to $14,999 | 0 (0.0%) | 0 (0.0%) |
| $15,000 to $19,999 | 3 (1.4%) | 0 (0.0%) |
| $20,000 to $24,999 | 0 (0.0%) | 2 (4.4%) |
| $25,000 to $34,999 | 6 (2.8%) | 0 (0.0%) |
| $35,000 to $49,999 | 18 (8.3%) | 3 (6.7%) |
| $50,000 to $74,999 | 26 (12.0%) | 0 (0.0%) |
| $75,000 to $99,999 | 13 (6.0%) | 3 (6.7%) |
| $100,000 to $149,999 | 52 (24.1%) | 0 (0.0%) |
| $150,000 or more | 90 (41.7%) | 2 (4.4%) |
| Total | 216 (100.0%) | 45 (100.0%) |
Monthly Housing Cost Tiers in Josephville
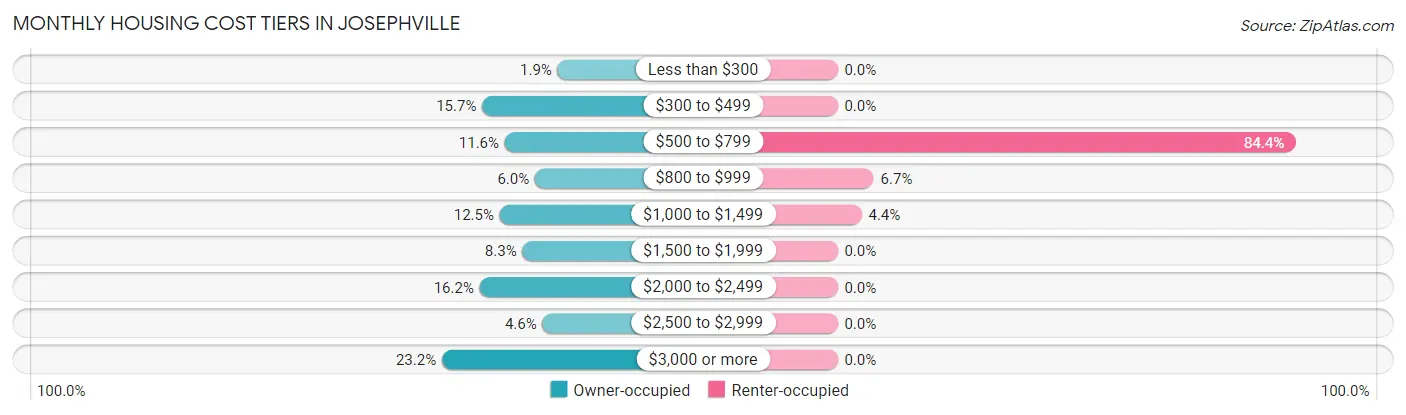
| Monthly Cost | Owner-occupied | Renter-occupied |
| Less than $300 | 4 (1.8%) | 0 (0.0%) |
| $300 to $499 | 34 (15.7%) | 0 (0.0%) |
| $500 to $799 | 25 (11.6%) | 38 (84.4%) |
| $800 to $999 | 13 (6.0%) | 3 (6.7%) |
| $1,000 to $1,499 | 27 (12.5%) | 2 (4.4%) |
| $1,500 to $1,999 | 18 (8.3%) | 0 (0.0%) |
| $2,000 to $2,499 | 35 (16.2%) | 0 (0.0%) |
| $2,500 to $2,999 | 10 (4.6%) | 0 (0.0%) |
| $3,000 or more | 50 (23.2%) | 0 (0.0%) |
| Total | 216 (100.0%) | 45 (100.0%) |
Physical Housing Characteristics in Josephville
Housing Structures in Josephville
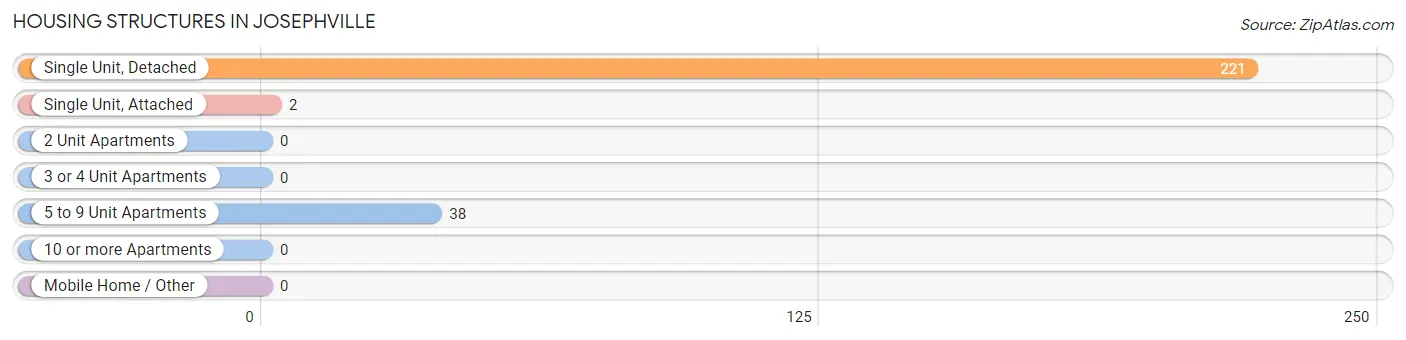
| Structure Type | # Housing Units | % Housing Units |
| Single Unit, Detached | 221 | 84.7% |
| Single Unit, Attached | 2 | 0.8% |
| 2 Unit Apartments | 0 | 0.0% |
| 3 or 4 Unit Apartments | 0 | 0.0% |
| 5 to 9 Unit Apartments | 38 | 14.6% |
| 10 or more Apartments | 0 | 0.0% |
| Mobile Home / Other | 0 | 0.0% |
| Total | 261 | 100.0% |
Housing Structures by Occupancy in Josephville
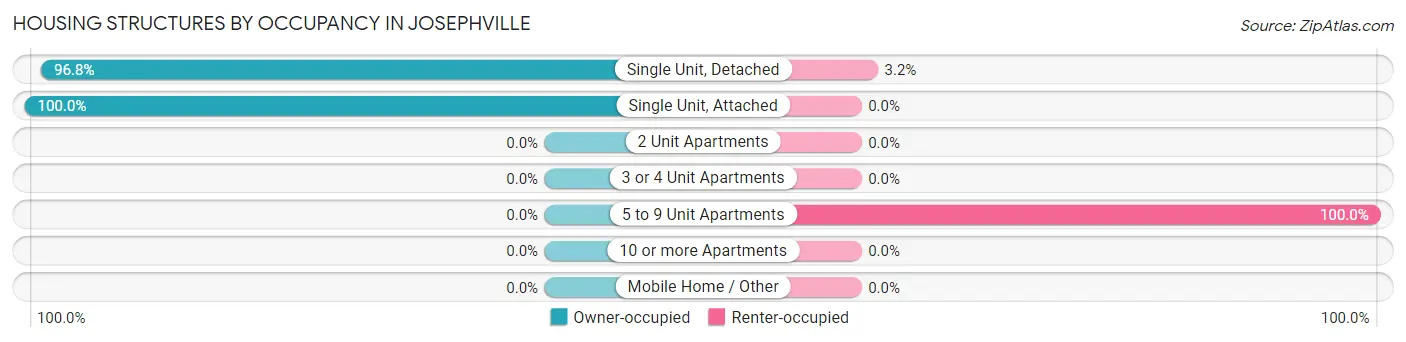
| Structure Type | Owner-occupied | Renter-occupied |
| Single Unit, Detached | 214 (96.8%) | 7 (3.2%) |
| Single Unit, Attached | 2 (100.0%) | 0 (0.0%) |
| 2 Unit Apartments | 0 (0.0%) | 0 (0.0%) |
| 3 or 4 Unit Apartments | 0 (0.0%) | 0 (0.0%) |
| 5 to 9 Unit Apartments | 0 (0.0%) | 38 (100.0%) |
| 10 or more Apartments | 0 (0.0%) | 0 (0.0%) |
| Mobile Home / Other | 0 (0.0%) | 0 (0.0%) |
| Total | 216 (82.8%) | 45 (17.2%) |
Housing Structures by Number of Rooms in Josephville
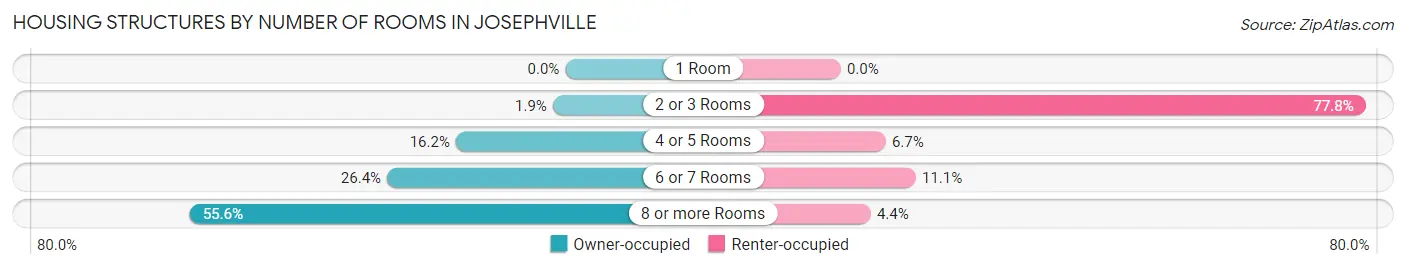
| Number of Rooms | Owner-occupied | Renter-occupied |
| 1 Room | 0 (0.0%) | 0 (0.0%) |
| 2 or 3 Rooms | 4 (1.8%) | 35 (77.8%) |
| 4 or 5 Rooms | 35 (16.2%) | 3 (6.7%) |
| 6 or 7 Rooms | 57 (26.4%) | 5 (11.1%) |
| 8 or more Rooms | 120 (55.6%) | 2 (4.4%) |
| Total | 216 (100.0%) | 45 (100.0%) |
Housing Structure by Heating Type in Josephville
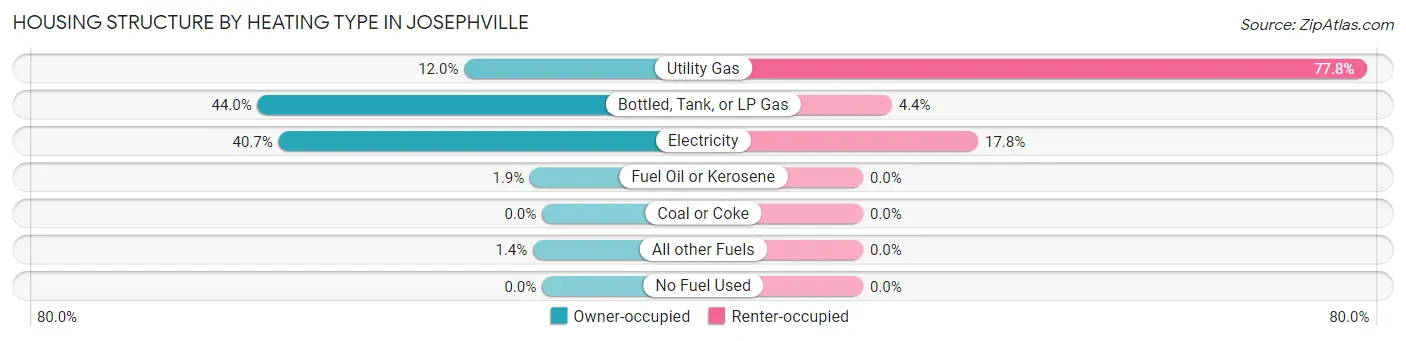
| Heating Type | Owner-occupied | Renter-occupied |
| Utility Gas | 26 (12.0%) | 35 (77.8%) |
| Bottled, Tank, or LP Gas | 95 (44.0%) | 2 (4.4%) |
| Electricity | 88 (40.7%) | 8 (17.8%) |
| Fuel Oil or Kerosene | 4 (1.8%) | 0 (0.0%) |
| Coal or Coke | 0 (0.0%) | 0 (0.0%) |
| All other Fuels | 3 (1.4%) | 0 (0.0%) |
| No Fuel Used | 0 (0.0%) | 0 (0.0%) |
| Total | 216 (100.0%) | 45 (100.0%) |
Household Vehicle Usage in Josephville
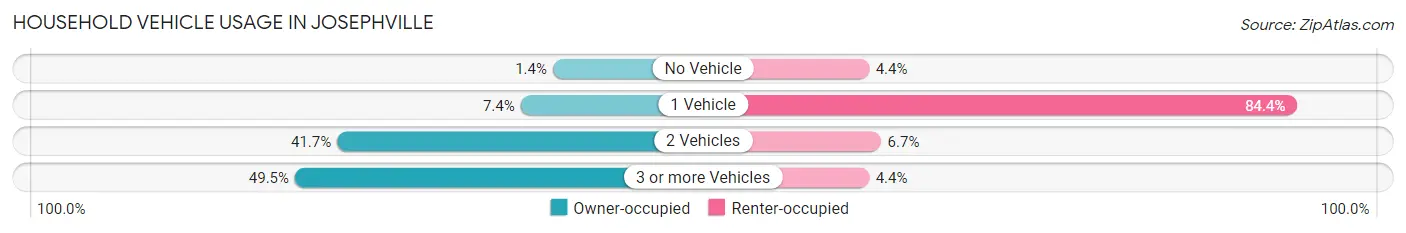
| Vehicles per Household | Owner-occupied | Renter-occupied |
| No Vehicle | 3 (1.4%) | 2 (4.4%) |
| 1 Vehicle | 16 (7.4%) | 38 (84.4%) |
| 2 Vehicles | 90 (41.7%) | 3 (6.7%) |
| 3 or more Vehicles | 107 (49.5%) | 2 (4.4%) |
| Total | 216 (100.0%) | 45 (100.0%) |
Real Estate & Mortgages in Josephville
Real Estate and Mortgage Overview in Josephville
| Characteristic | Without Mortgage | With Mortgage |
| Housing Units | 95 | 121 |
| Median Property Value | $343,200 | $517,000 |
| Median Household Income | $91,875 | $74 |
| Monthly Housing Costs | $586 | $50 |
| Real Estate Taxes | $2,519 | $0 |
Property Value by Mortgage Status in Josephville
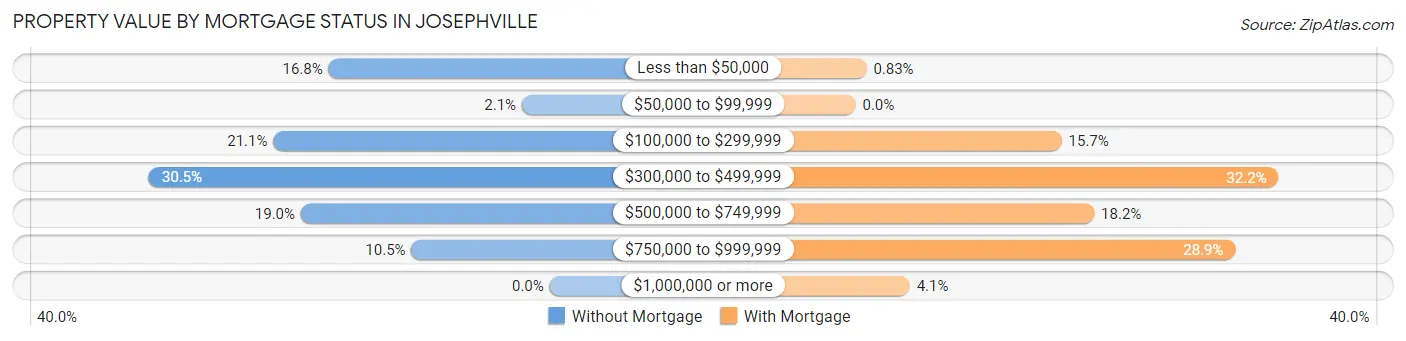
| Property Value | Without Mortgage | With Mortgage |
| Less than $50,000 | 16 (16.8%) | 1 (0.8%) |
| $50,000 to $99,999 | 2 (2.1%) | 0 (0.0%) |
| $100,000 to $299,999 | 20 (21.0%) | 19 (15.7%) |
| $300,000 to $499,999 | 29 (30.5%) | 39 (32.2%) |
| $500,000 to $749,999 | 18 (19.0%) | 22 (18.2%) |
| $750,000 to $999,999 | 10 (10.5%) | 35 (28.9%) |
| $1,000,000 or more | 0 (0.0%) | 5 (4.1%) |
| Total | 95 (100.0%) | 121 (100.0%) |
Household Income by Mortgage Status in Josephville
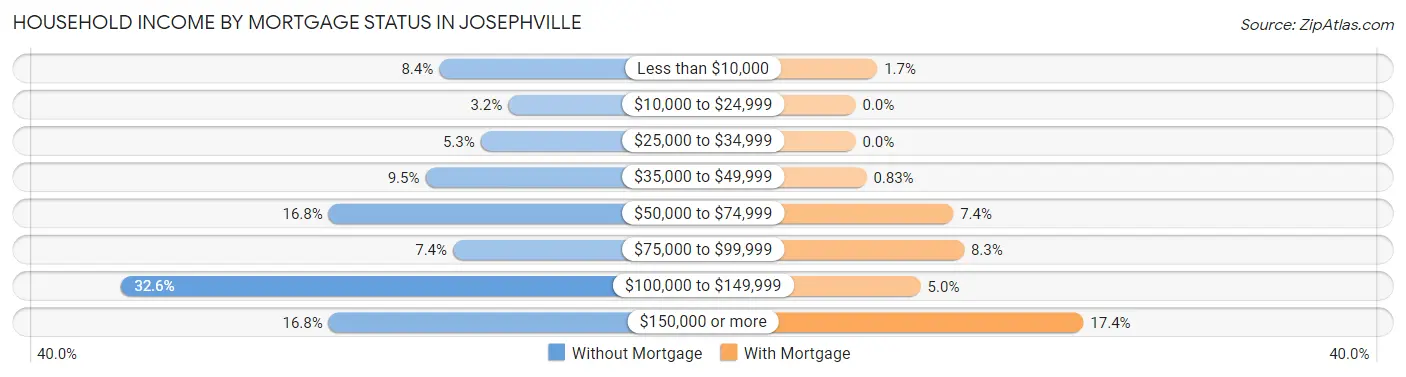
| Household Income | Without Mortgage | With Mortgage |
| Less than $10,000 | 8 (8.4%) | 2 (1.7%) |
| $10,000 to $24,999 | 3 (3.2%) | 0 (0.0%) |
| $25,000 to $34,999 | 5 (5.3%) | 0 (0.0%) |
| $35,000 to $49,999 | 9 (9.5%) | 1 (0.8%) |
| $50,000 to $74,999 | 16 (16.8%) | 9 (7.4%) |
| $75,000 to $99,999 | 7 (7.4%) | 10 (8.3%) |
| $100,000 to $149,999 | 31 (32.6%) | 6 (5.0%) |
| $150,000 or more | 16 (16.8%) | 21 (17.4%) |
| Total | 95 (100.0%) | 121 (100.0%) |
Property Value to Household Income Ratio in Josephville
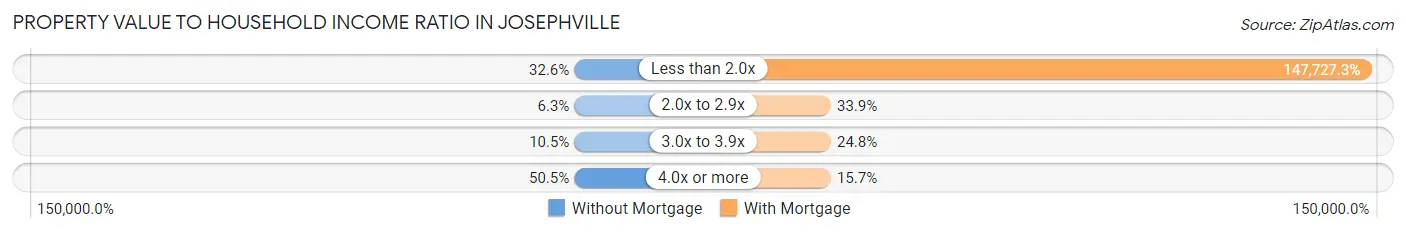
| Value-to-Income Ratio | Without Mortgage | With Mortgage |
| Less than 2.0x | 31 (32.6%) | 178,750 (147,727.3%) |
| 2.0x to 2.9x | 6 (6.3%) | 41 (33.9%) |
| 3.0x to 3.9x | 10 (10.5%) | 30 (24.8%) |
| 4.0x or more | 48 (50.5%) | 19 (15.7%) |
| Total | 95 (100.0%) | 121 (100.0%) |
Real Estate Taxes by Mortgage Status in Josephville
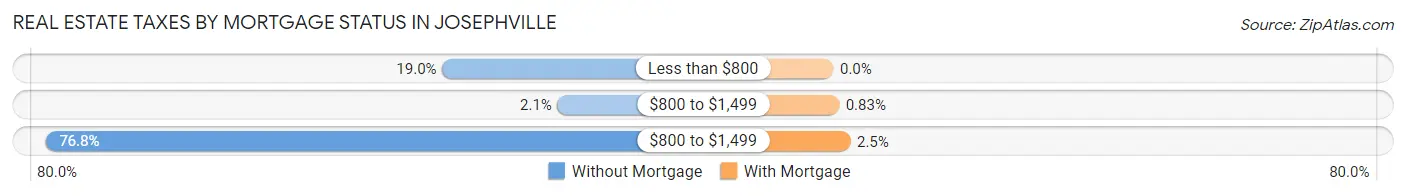
| Property Taxes | Without Mortgage | With Mortgage |
| Less than $800 | 18 (19.0%) | 0 (0.0%) |
| $800 to $1,499 | 2 (2.1%) | 1 (0.8%) |
| $800 to $1,499 | 73 (76.8%) | 3 (2.5%) |
| Total | 95 (100.0%) | 121 (100.0%) |
Health & Disability in Josephville
Health Insurance Coverage by Age in Josephville
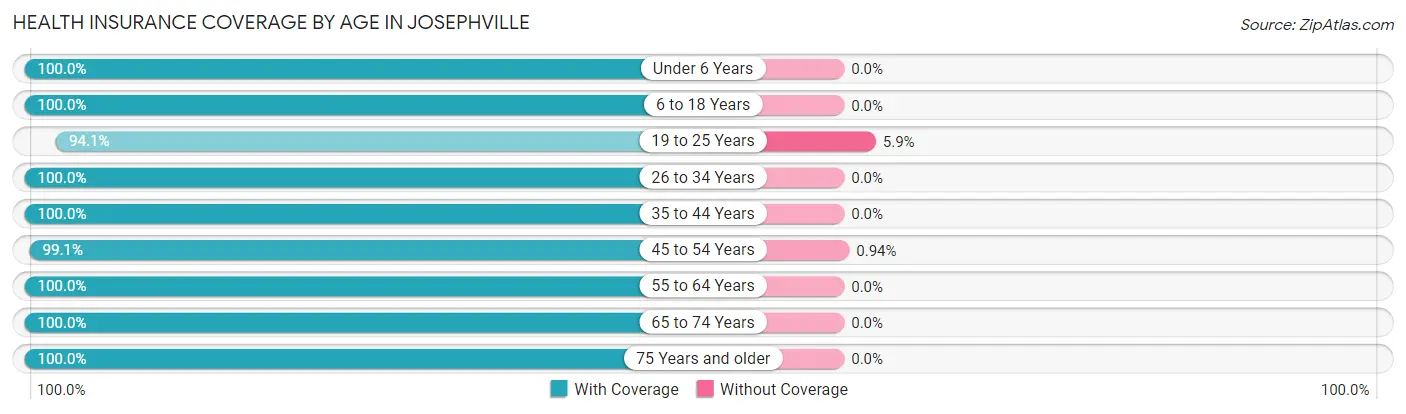
| Age Bracket | With Coverage | Without Coverage |
| Under 6 Years | 9 (100.0%) | 0 (0.0%) |
| 6 to 18 Years | 175 (100.0%) | 0 (0.0%) |
| 19 to 25 Years | 32 (94.1%) | 2 (5.9%) |
| 26 to 34 Years | 42 (100.0%) | 0 (0.0%) |
| 35 to 44 Years | 77 (100.0%) | 0 (0.0%) |
| 45 to 54 Years | 105 (99.1%) | 1 (0.9%) |
| 55 to 64 Years | 151 (100.0%) | 0 (0.0%) |
| 65 to 74 Years | 108 (100.0%) | 0 (0.0%) |
| 75 Years and older | 26 (100.0%) | 0 (0.0%) |
| Total | 725 (99.6%) | 3 (0.4%) |
Health Insurance Coverage by Citizenship Status in Josephville
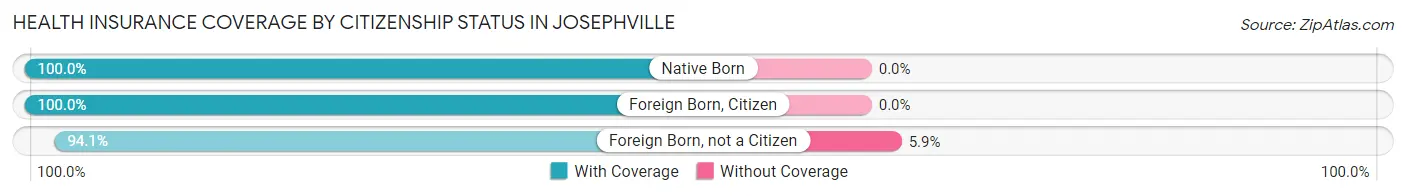
| Citizenship Status | With Coverage | Without Coverage |
| Native Born | 9 (100.0%) | 0 (0.0%) |
| Foreign Born, Citizen | 175 (100.0%) | 0 (0.0%) |
| Foreign Born, not a Citizen | 32 (94.1%) | 2 (5.9%) |
Health Insurance Coverage by Household Income in Josephville
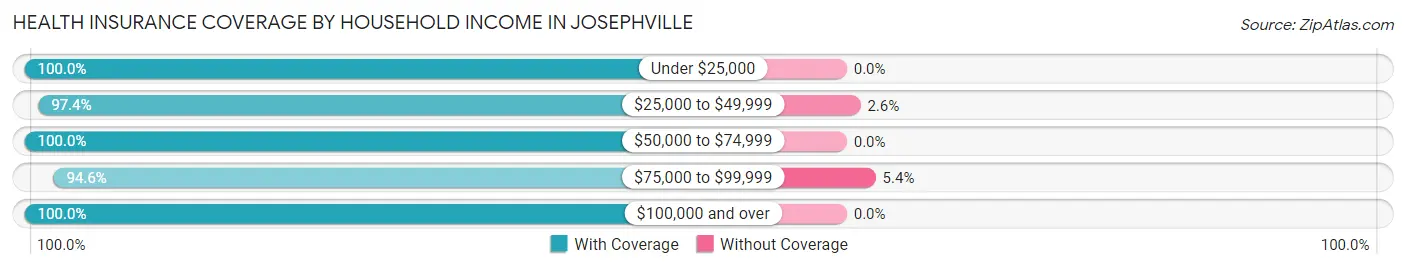
| Household Income | With Coverage | Without Coverage |
| Under $25,000 | 104 (100.0%) | 0 (0.0%) |
| $25,000 to $49,999 | 38 (97.4%) | 1 (2.6%) |
| $50,000 to $74,999 | 44 (100.0%) | 0 (0.0%) |
| $75,000 to $99,999 | 35 (94.6%) | 2 (5.4%) |
| $100,000 and over | 504 (100.0%) | 0 (0.0%) |
Public vs Private Health Insurance Coverage by Age in Josephville
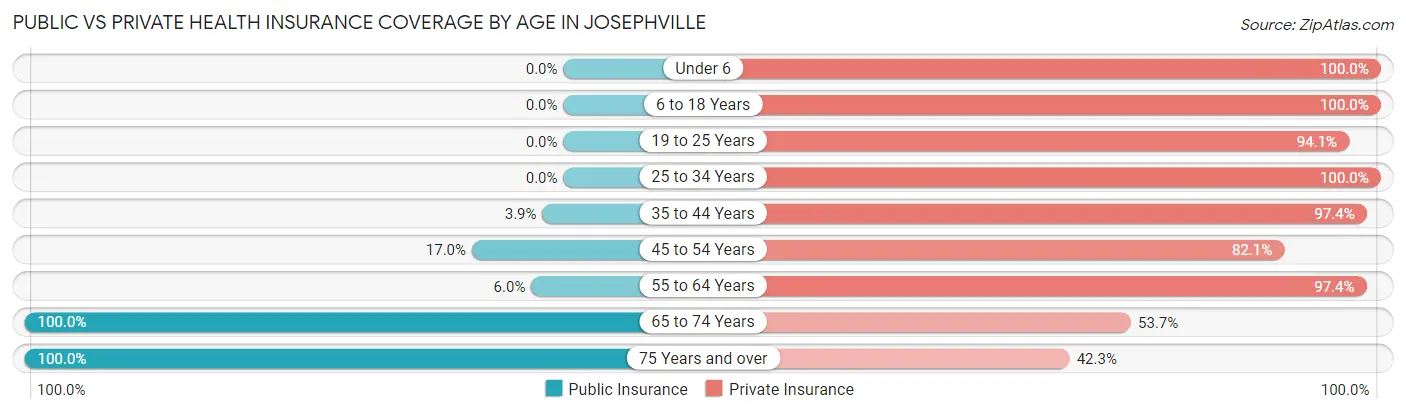
| Age Bracket | Public Insurance | Private Insurance |
| Under 6 | 0 (0.0%) | 9 (100.0%) |
| 6 to 18 Years | 0 (0.0%) | 175 (100.0%) |
| 19 to 25 Years | 0 (0.0%) | 32 (94.1%) |
| 25 to 34 Years | 0 (0.0%) | 42 (100.0%) |
| 35 to 44 Years | 3 (3.9%) | 75 (97.4%) |
| 45 to 54 Years | 18 (17.0%) | 87 (82.1%) |
| 55 to 64 Years | 9 (6.0%) | 147 (97.4%) |
| 65 to 74 Years | 108 (100.0%) | 58 (53.7%) |
| 75 Years and over | 26 (100.0%) | 11 (42.3%) |
| Total | 164 (22.5%) | 636 (87.4%) |
Disability Status by Sex by Age in Josephville
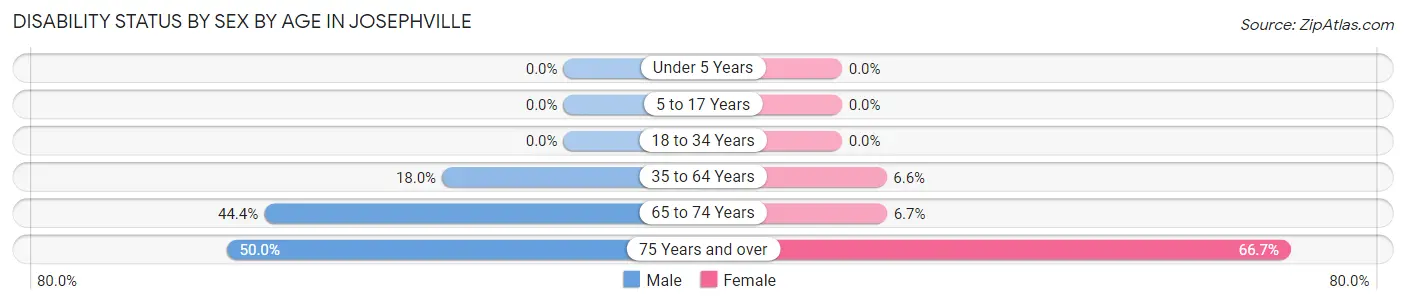
| Age Bracket | Male | Female |
| Under 5 Years | 0 (0.0%) | 0 (0.0%) |
| 5 to 17 Years | 0 (0.0%) | 0 (0.0%) |
| 18 to 34 Years | 0 (0.0%) | 0 (0.0%) |
| 35 to 64 Years | 33 (18.0%) | 10 (6.6%) |
| 65 to 74 Years | 28 (44.4%) | 3 (6.7%) |
| 75 Years and over | 4 (50.0%) | 12 (66.7%) |
Disability Class by Sex by Age in Josephville
Disability Class: Hearing Difficulty
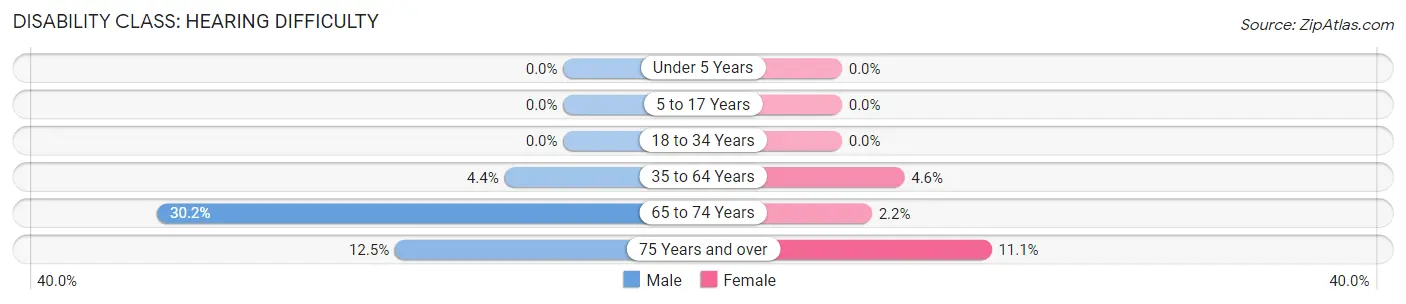
| Age Bracket | Male | Female |
| Under 5 Years | 0 (0.0%) | 0 (0.0%) |
| 5 to 17 Years | 0 (0.0%) | 0 (0.0%) |
| 18 to 34 Years | 0 (0.0%) | 0 (0.0%) |
| 35 to 64 Years | 8 (4.4%) | 7 (4.6%) |
| 65 to 74 Years | 19 (30.2%) | 1 (2.2%) |
| 75 Years and over | 1 (12.5%) | 2 (11.1%) |
Disability Class: Vision Difficulty
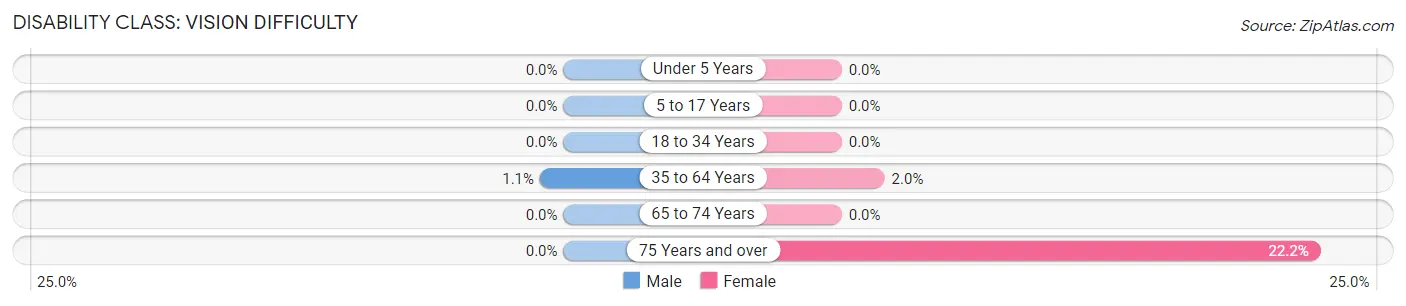
| Age Bracket | Male | Female |
| Under 5 Years | 0 (0.0%) | 0 (0.0%) |
| 5 to 17 Years | 0 (0.0%) | 0 (0.0%) |
| 18 to 34 Years | 0 (0.0%) | 0 (0.0%) |
| 35 to 64 Years | 2 (1.1%) | 3 (2.0%) |
| 65 to 74 Years | 0 (0.0%) | 0 (0.0%) |
| 75 Years and over | 0 (0.0%) | 4 (22.2%) |
Disability Class: Cognitive Difficulty
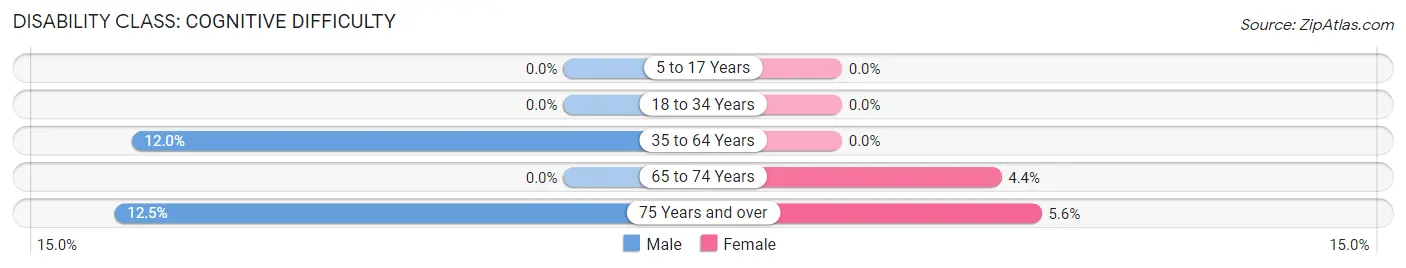
| Age Bracket | Male | Female |
| 5 to 17 Years | 0 (0.0%) | 0 (0.0%) |
| 18 to 34 Years | 0 (0.0%) | 0 (0.0%) |
| 35 to 64 Years | 22 (12.0%) | 0 (0.0%) |
| 65 to 74 Years | 0 (0.0%) | 2 (4.4%) |
| 75 Years and over | 1 (12.5%) | 1 (5.6%) |
Disability Class: Ambulatory Difficulty
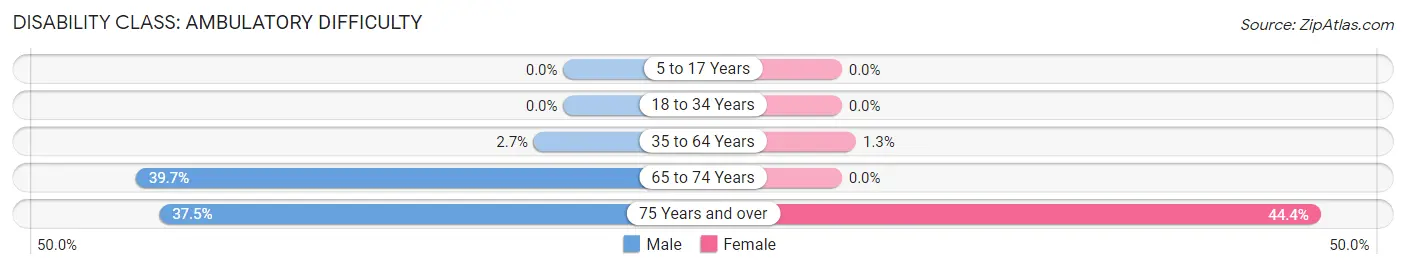
| Age Bracket | Male | Female |
| 5 to 17 Years | 0 (0.0%) | 0 (0.0%) |
| 18 to 34 Years | 0 (0.0%) | 0 (0.0%) |
| 35 to 64 Years | 5 (2.7%) | 2 (1.3%) |
| 65 to 74 Years | 25 (39.7%) | 0 (0.0%) |
| 75 Years and over | 3 (37.5%) | 8 (44.4%) |
Disability Class: Self-Care Difficulty
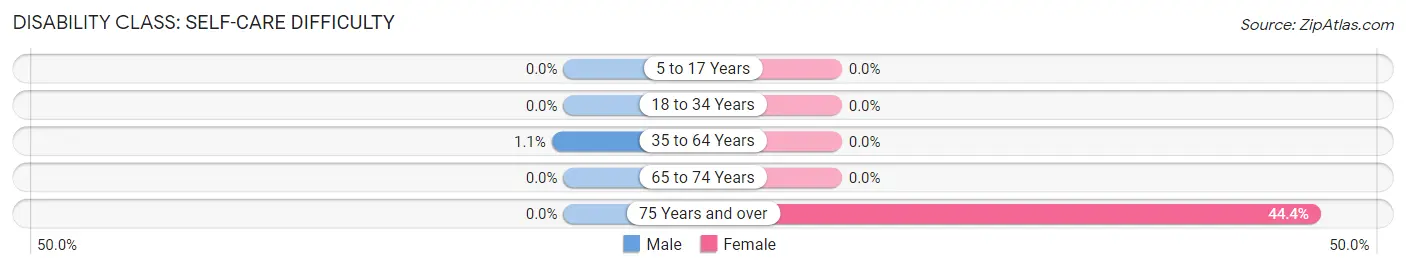
| Age Bracket | Male | Female |
| 5 to 17 Years | 0 (0.0%) | 0 (0.0%) |
| 18 to 34 Years | 0 (0.0%) | 0 (0.0%) |
| 35 to 64 Years | 2 (1.1%) | 0 (0.0%) |
| 65 to 74 Years | 0 (0.0%) | 0 (0.0%) |
| 75 Years and over | 0 (0.0%) | 8 (44.4%) |
Technology Access in Josephville
Computing Device Access in Josephville
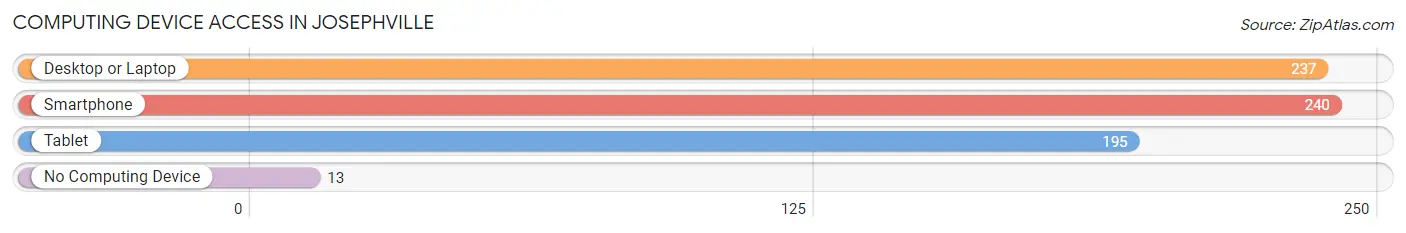
| Device Type | # Households | % Households |
| Desktop or Laptop | 237 | 90.8% |
| Smartphone | 240 | 91.9% |
| Tablet | 195 | 74.7% |
| No Computing Device | 13 | 5.0% |
| Total | 261 | 100.0% |
Internet Access in Josephville
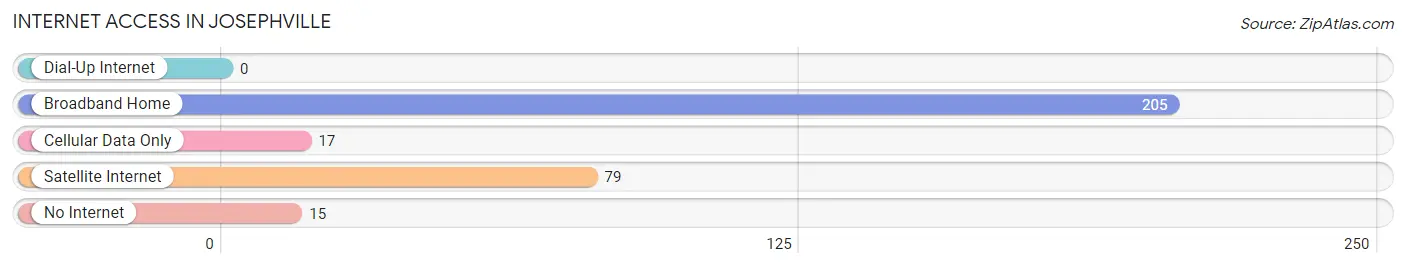
| Internet Type | # Households | % Households |
| Dial-Up Internet | 0 | 0.0% |
| Broadband Home | 205 | 78.5% |
| Cellular Data Only | 17 | 6.5% |
| Satellite Internet | 79 | 30.3% |
| No Internet | 15 | 5.8% |
| Total | 261 | 100.0% |
Josephville Summary
Josephville, Missouri is a small unincorporated community located in St. Charles County, Missouri. It is situated on the banks of the Missouri River, approximately 25 miles northwest of St. Louis. The community was founded in 1837 by Joseph and Mary Joseph, who were among the first settlers in the area.
History
Josephville was founded in 1837 by Joseph and Mary Joseph, who were among the first settlers in the area. The Josephs were of German descent and had immigrated to the United States from Bavaria in 1834. They purchased land in the area and began to build a small community. The Josephs named the community after themselves, and it quickly grew to become a thriving farming community.
In 1845, the Josephs built a small church, which was the first in the area. The church was used for religious services, as well as for community gatherings. The Josephs also built a schoolhouse, which was used to educate the children of the community.
In 1851, the Josephs sold their land to the St. Charles County government, and the community was officially incorporated as Josephville. The town quickly grew, and by the late 1800s, it had become a bustling community with a population of over 500 people.
Geography
Josephville is located in St. Charles County, Missouri, approximately 25 miles northwest of St. Louis. The community is situated on the banks of the Missouri River, and is surrounded by rolling hills and farmland. The climate in the area is temperate, with hot summers and cold winters.
Economy
Josephville is a small, rural community, and the economy is largely based on agriculture. The area is known for its production of corn, soybeans, and hay. In addition, there are several small businesses in the area, including a grocery store, a hardware store, and a few restaurants.
Demographics
As of the 2010 census, the population of Josephville was 545. The racial makeup of the town was 97.3% White, 0.7% African American, 0.2% Native American, 0.2% Asian, and 1.6% from other races. The median household income was $45,000, and the median age was 40.
Conclusion
Josephville, Missouri is a small, rural community located in St. Charles County, Missouri. It was founded in 1837 by Joseph and Mary Joseph, and has since grown to become a thriving farming community. The economy is largely based on agriculture, and the population is predominantly White. Josephville is a peaceful, close-knit community, and is a great place to live and raise a family.
Common Questions
What is Per Capita Income in Josephville?
Per Capita income in Josephville is $57,012.
What is the Median Family Income in Josephville?
Median Family Income in Josephville is $106,250.
What is the Median Household income in Josephville?
Median Household Income in Josephville is $105,893.
What is Income or Wage Gap in Josephville?
Income or Wage Gap in Josephville is 14.1%.
Women in Josephville earn 85.9 cents for every dollar earned by a man.
What is Inequality or Gini Index in Josephville?
Inequality or Gini Index in Josephville is 0.54.
What is the Total Population of Josephville?
Total Population of Josephville is 728.
What is the Total Male Population of Josephville?
Total Male Population of Josephville is 388.
What is the Total Female Population of Josephville?
Total Female Population of Josephville is 340.
What is the Ratio of Males per 100 Females in Josephville?
There are 114.12 Males per 100 Females in Josephville.
What is the Ratio of Females per 100 Males in Josephville?
There are 87.63 Females per 100 Males in Josephville.
What is the Median Population Age in Josephville?
Median Population Age in Josephville is 49.1 Years.
What is the Average Family Size in Josephville
Average Family Size in Josephville is 3.0 People.
What is the Average Household Size in Josephville
Average Household Size in Josephville is 2.8 People.
How Large is the Labor Force in Josephville?
There are 312 People in the Labor Forcein in Josephville.
What is the Percentage of People in the Labor Force in Josephville?
55.9% of People are in the Labor Force in Josephville.