Glendale, MO Map & Demographics
Glendale Map
Glendale Overview
$71,588
PER CAPITA INCOME
$178,333
AVG FAMILY INCOME
$157,750
AVG HOUSEHOLD INCOME
40.0%
WAGE / INCOME GAP [ % ]
60.0¢/ $1
WAGE / INCOME GAP [ $ ]
0.39
INEQUALITY / GINI INDEX
6,131
TOTAL POPULATION
2,688
MALE POPULATION
3,443
FEMALE POPULATION
78.07
MALES / 100 FEMALES
128.09
FEMALES / 100 MALES
39.5
MEDIAN AGE
3.4
AVG FAMILY SIZE
2.7
AVG HOUSEHOLD SIZE
2,625
LABOR FORCE [ PEOPLE ]
56.7%
PERCENT IN LABOR FORCE
0.8%
UNEMPLOYMENT RATE
Income in Glendale
Income Overview in Glendale
Per Capita Income in Glendale is $71,588, while median incomes of families and households are $178,333 and $157,750 respectively.
| Characteristic | Number | Measure |
| Per Capita Income | 6,131 | $71,588 |
| Median Family Income | 1,570 | $178,333 |
| Mean Family Income | 1,570 | $237,801 |
| Median Household Income | 2,239 | $157,750 |
| Mean Household Income | 2,239 | $194,950 |
| Income Deficit | 1,570 | $0 |
| Wage / Income Gap (%) | 6,131 | 40.05% |
| Wage / Income Gap ($) | 6,131 | 59.95¢ per $1 |
| Gini / Inequality Index | 6,131 | 0.39 |
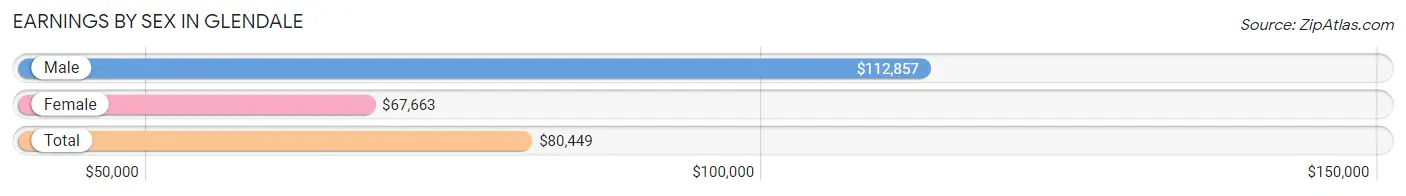
Earnings by Sex in Glendale
Average Earnings in Glendale are $80,449, $112,857 for men and $67,663 for women, a difference of 40.1%.
| Sex | Number | Average Earnings |
| Male | 1,618 (50.7%) | $112,857 |
| Female | 1,573 (49.3%) | $67,663 |
| Total | 3,191 (100.0%) | $80,449 |
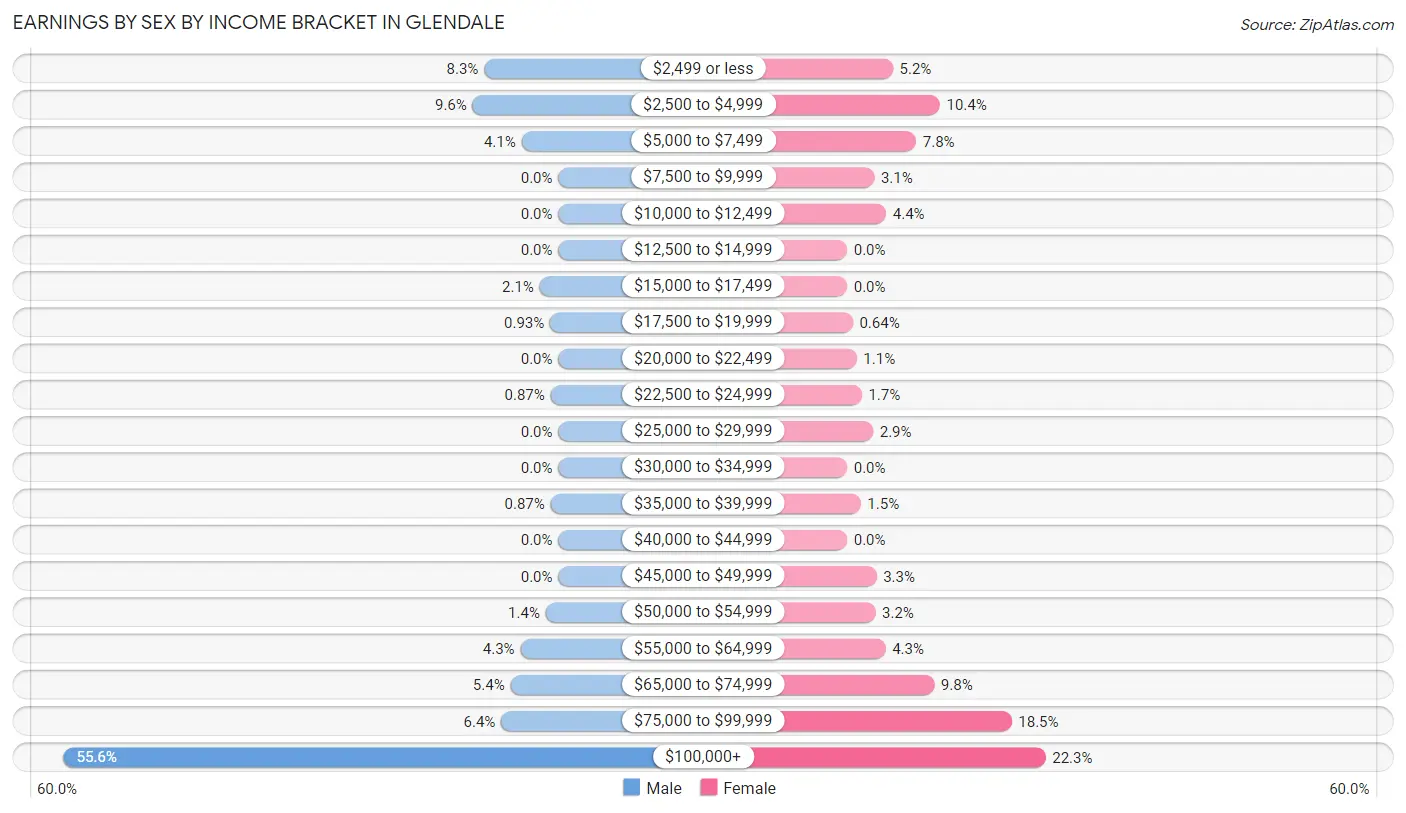
Earnings by Sex by Income Bracket in Glendale
The most common earnings brackets in Glendale are $100,000+ for men (900 | 55.6%) and $100,000+ for women (351 | 22.3%).
| Income | Male | Female |
| $2,499 or less | 135 (8.3%) | 81 (5.1%) |
| $2,500 to $4,999 | 156 (9.6%) | 164 (10.4%) |
| $5,000 to $7,499 | 67 (4.1%) | 122 (7.8%) |
| $7,500 to $9,999 | 0 (0.0%) | 48 (3.0%) |
| $10,000 to $12,499 | 0 (0.0%) | 69 (4.4%) |
| $12,500 to $14,999 | 0 (0.0%) | 0 (0.0%) |
| $15,000 to $17,499 | 34 (2.1%) | 0 (0.0%) |
| $17,500 to $19,999 | 15 (0.9%) | 10 (0.6%) |
| $20,000 to $22,499 | 0 (0.0%) | 17 (1.1%) |
| $22,500 to $24,999 | 14 (0.9%) | 26 (1.7%) |
| $25,000 to $29,999 | 0 (0.0%) | 46 (2.9%) |
| $30,000 to $34,999 | 0 (0.0%) | 0 (0.0%) |
| $35,000 to $39,999 | 14 (0.9%) | 24 (1.5%) |
| $40,000 to $44,999 | 0 (0.0%) | 0 (0.0%) |
| $45,000 to $49,999 | 0 (0.0%) | 52 (3.3%) |
| $50,000 to $54,999 | 23 (1.4%) | 50 (3.2%) |
| $55,000 to $64,999 | 69 (4.3%) | 68 (4.3%) |
| $65,000 to $74,999 | 87 (5.4%) | 154 (9.8%) |
| $75,000 to $99,999 | 104 (6.4%) | 291 (18.5%) |
| $100,000+ | 900 (55.6%) | 351 (22.3%) |
| Total | 1,618 (100.0%) | 1,573 (100.0%) |
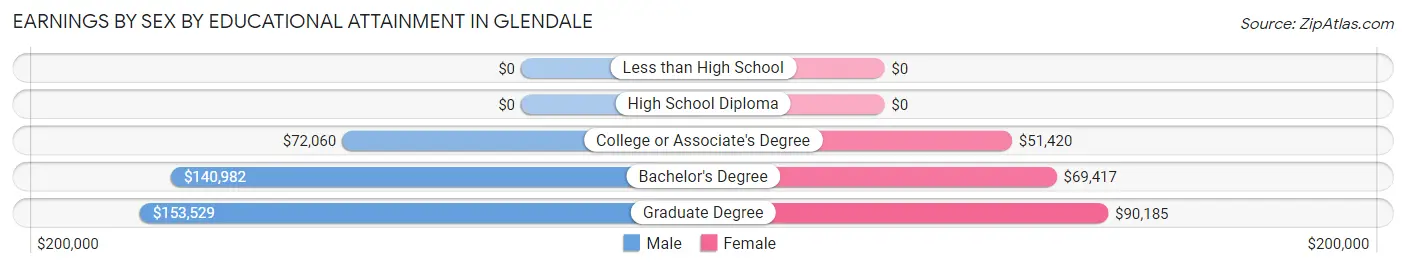
Earnings by Sex by Educational Attainment in Glendale
Average earnings in Glendale are $141,518 for men and $73,036 for women, a difference of 48.4%. Men with an educational attainment of graduate degree enjoy the highest average annual earnings of $153,529, while those with college or associate's degree education earn the least with $72,060. Women with an educational attainment of graduate degree earn the most with the average annual earnings of $90,185, while those with college or associate's degree education have the smallest earnings of $51,420.
| Educational Attainment | Male Income | Female Income |
| Less than High School | - | - |
| High School Diploma | - | - |
| College or Associate's Degree | $72,060 | $51,420 |
| Bachelor's Degree | $140,982 | $69,417 |
| Graduate Degree | $153,529 | $90,185 |
| Total | $141,518 | $73,036 |
Family Income in Glendale
Family Income Brackets in Glendale
According to the Glendale family income data, there are 713 families falling into the $200,000+ income range, which is the most common income bracket and makes up 45.4% of all families.
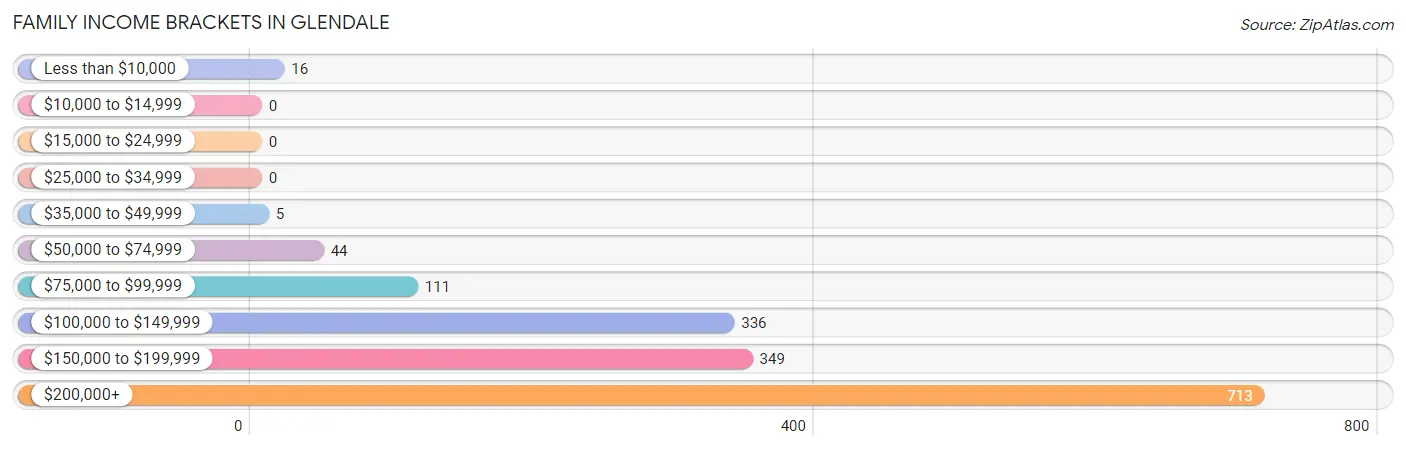
| Income Bracket | # Families | % Families |
| Less than $10,000 | 16 | 1.0% |
| $10,000 to $14,999 | 0 | 0.0% |
| $15,000 to $24,999 | 0 | 0.0% |
| $25,000 to $34,999 | 0 | 0.0% |
| $35,000 to $49,999 | 5 | 0.3% |
| $50,000 to $74,999 | 44 | 2.8% |
| $75,000 to $99,999 | 111 | 7.1% |
| $100,000 to $149,999 | 336 | 21.4% |
| $150,000 to $199,999 | 349 | 22.2% |
| $200,000+ | 713 | 45.4% |
Family Income by Famaliy Size in Glendale
5-person families (253 | 16.1%) account for the highest median family income in Glendale with $250,001 per family, while 2-person families (512 | 32.6%) have the highest median income of $70,416 per family member.
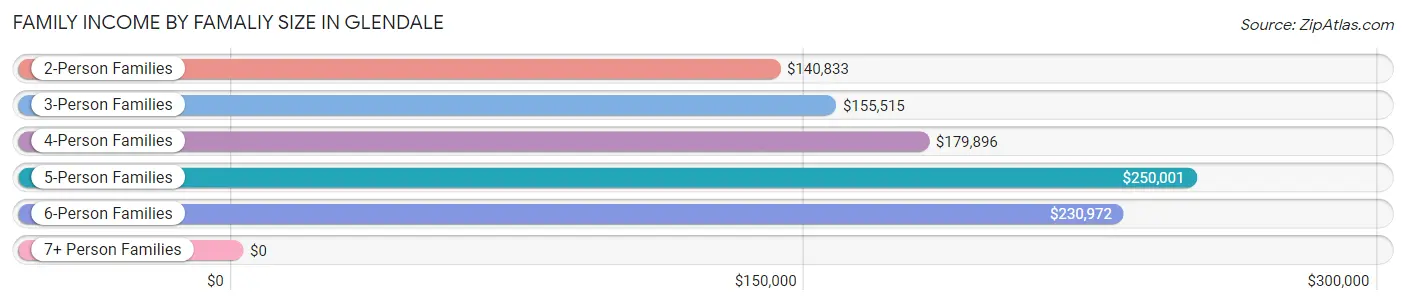
| Income Bracket | # Families | Median Income |
| 2-Person Families | 512 (32.6%) | $140,833 |
| 3-Person Families | 417 (26.6%) | $155,515 |
| 4-Person Families | 323 (20.6%) | $179,896 |
| 5-Person Families | 253 (16.1%) | $250,001 |
| 6-Person Families | 39 (2.5%) | $230,972 |
| 7+ Person Families | 26 (1.7%) | $0 |
| Total | 1,570 (100.0%) | $178,333 |
Family Income by Number of Earners in Glendale
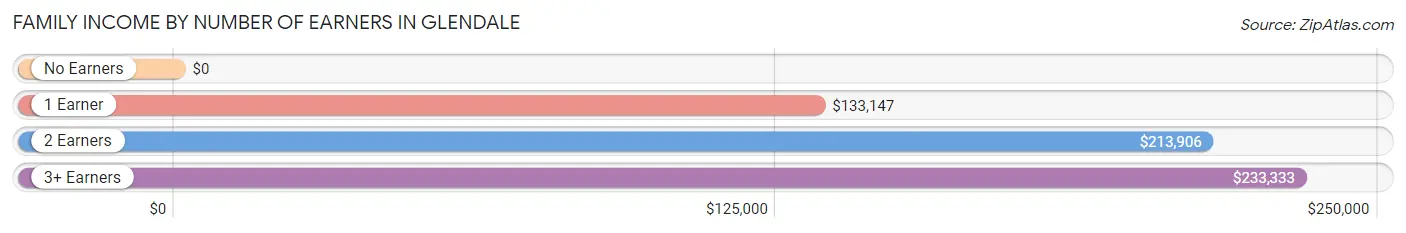
| Number of Earners | # Families | Median Income |
| No Earners | 171 (10.9%) | $0 |
| 1 Earner | 297 (18.9%) | $133,147 |
| 2 Earners | 816 (52.0%) | $213,906 |
| 3+ Earners | 286 (18.2%) | $233,333 |
| Total | 1,570 (100.0%) | $178,333 |
Household Income in Glendale
Household Income Brackets in Glendale
With 761 households falling in the category, the $200,000+ income range is the most frequent in Glendale, accounting for 34.0% of all households. In contrast, only 16 households (0.7%) fall into the $25,000 to $34,999 income bracket, making it the least populous group.
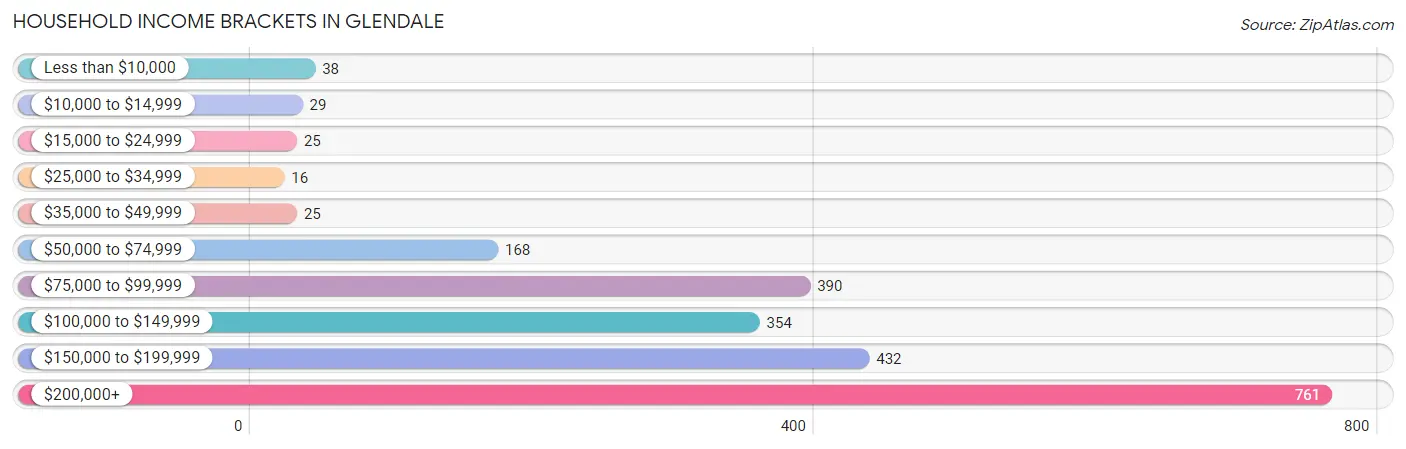
| Income Bracket | # Households | % Households |
| Less than $10,000 | 38 | 1.7% |
| $10,000 to $14,999 | 29 | 1.3% |
| $15,000 to $24,999 | 25 | 1.1% |
| $25,000 to $34,999 | 16 | 0.7% |
| $35,000 to $49,999 | 25 | 1.1% |
| $50,000 to $74,999 | 168 | 7.5% |
| $75,000 to $99,999 | 390 | 17.4% |
| $100,000 to $149,999 | 354 | 15.8% |
| $150,000 to $199,999 | 432 | 19.3% |
| $200,000+ | 761 | 34.0% |
Household Income by Householder Age in Glendale
The median household income in Glendale is $157,750, with the highest median household income of $206,477 found in the 25 to 44 years age bracket for the primary householder. A total of 577 households (25.8%) fall into this category.
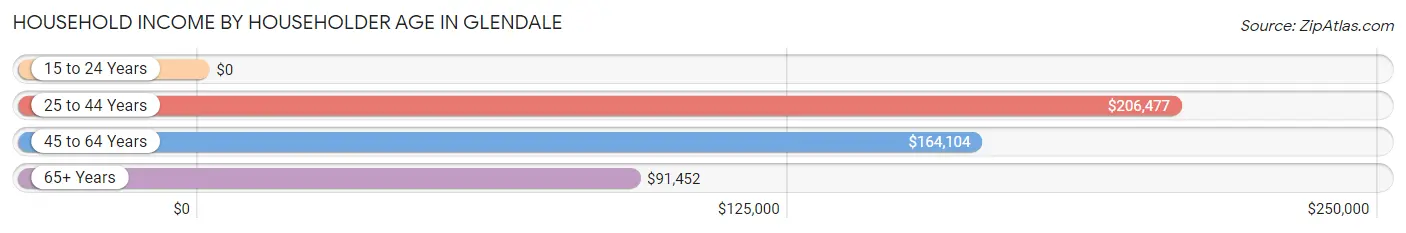
| Income Bracket | # Households | Median Income |
| 15 to 24 Years | 0 (0.0%) | $0 |
| 25 to 44 Years | 577 (25.8%) | $206,477 |
| 45 to 64 Years | 883 (39.4%) | $164,104 |
| 65+ Years | 779 (34.8%) | $91,452 |
| Total | 2,239 (100.0%) | $157,750 |
Poverty in Glendale
Income Below Poverty by Sex and Age in Glendale
With 1.1% poverty level for males and 4.0% for females among the residents of Glendale, 75 year old and over males and 15 year old females are the most vulnerable to poverty, with 16 males (10.8%) and 15 females (37.5%) in their respective age groups living below the poverty level.
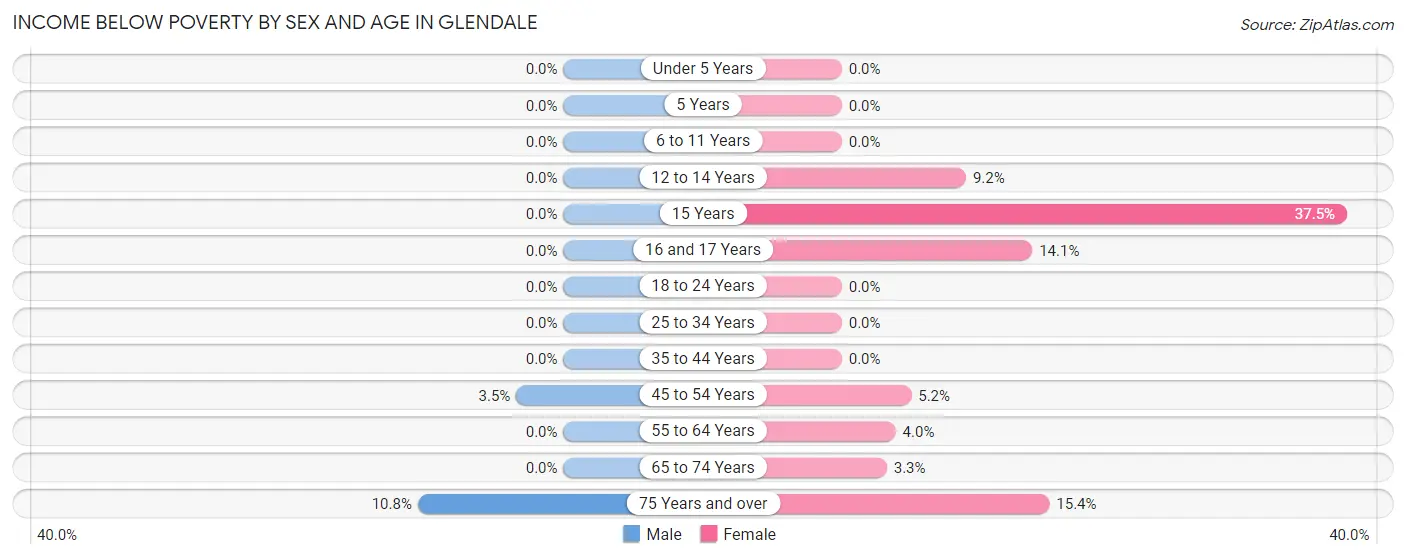
| Age Bracket | Male | Female |
| Under 5 Years | 0 (0.0%) | 0 (0.0%) |
| 5 Years | 0 (0.0%) | 0 (0.0%) |
| 6 to 11 Years | 0 (0.0%) | 0 (0.0%) |
| 12 to 14 Years | 0 (0.0%) | 13 (9.2%) |
| 15 Years | 0 (0.0%) | 15 (37.5%) |
| 16 and 17 Years | 0 (0.0%) | 14 (14.1%) |
| 18 to 24 Years | 0 (0.0%) | 0 (0.0%) |
| 25 to 34 Years | 0 (0.0%) | 0 (0.0%) |
| 35 to 44 Years | 0 (0.0%) | 0 (0.0%) |
| 45 to 54 Years | 15 (3.5%) | 26 (5.2%) |
| 55 to 64 Years | 0 (0.0%) | 12 (4.0%) |
| 65 to 74 Years | 0 (0.0%) | 14 (3.3%) |
| 75 Years and over | 16 (10.8%) | 43 (15.4%) |
| Total | 31 (1.1%) | 137 (4.0%) |
Income Above Poverty by Sex and Age in Glendale
According to the poverty statistics in Glendale, males aged under 5 years and females aged under 5 years are the age groups that are most secure financially, with 100.0% of males and 100.0% of females in these age groups living above the poverty line.
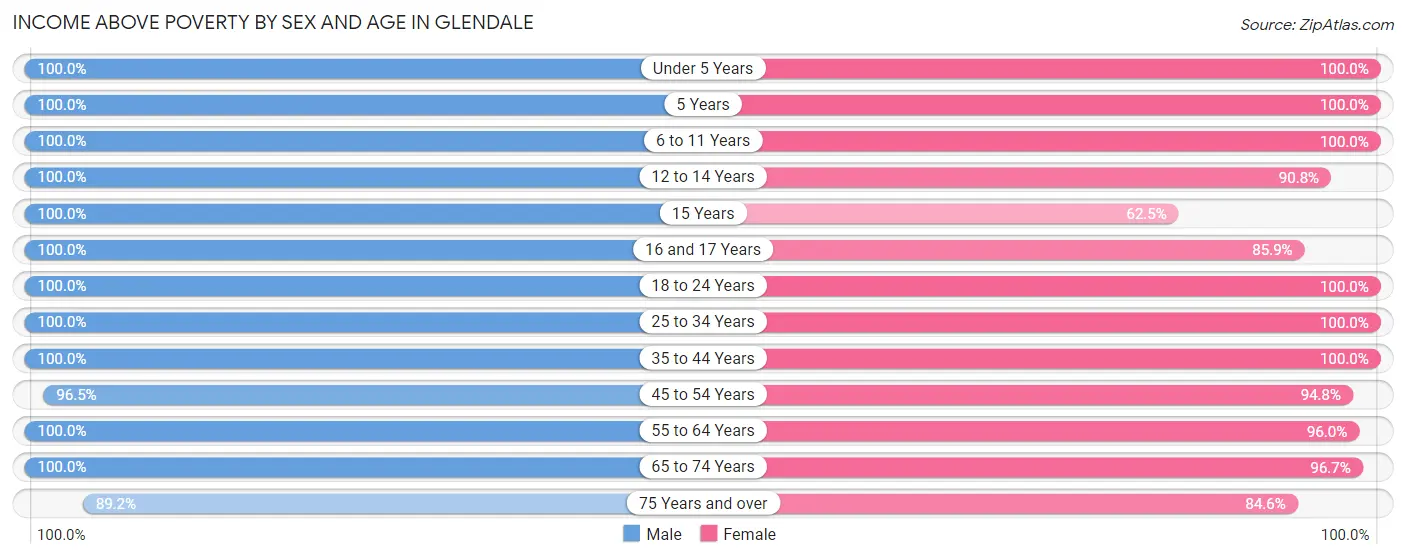
| Age Bracket | Male | Female |
| Under 5 Years | 111 (100.0%) | 310 (100.0%) |
| 5 Years | 99 (100.0%) | 36 (100.0%) |
| 6 to 11 Years | 297 (100.0%) | 320 (100.0%) |
| 12 to 14 Years | 121 (100.0%) | 128 (90.8%) |
| 15 Years | 11 (100.0%) | 25 (62.5%) |
| 16 and 17 Years | 39 (100.0%) | 85 (85.9%) |
| 18 to 24 Years | 327 (100.0%) | 392 (100.0%) |
| 25 to 34 Years | 119 (100.0%) | 146 (100.0%) |
| 35 to 44 Years | 395 (100.0%) | 442 (100.0%) |
| 45 to 54 Years | 413 (96.5%) | 478 (94.8%) |
| 55 to 64 Years | 282 (100.0%) | 288 (96.0%) |
| 65 to 74 Years | 311 (100.0%) | 405 (96.7%) |
| 75 Years and over | 132 (89.2%) | 236 (84.6%) |
| Total | 2,657 (98.9%) | 3,291 (96.0%) |
Income Below Poverty Among Married-Couple Families in Glendale
The poverty statistics for married-couple families in Glendale show that 1.1% or 15 of the total 1,405 families live below the poverty line. Families with 1 or 2 children have the highest poverty rate of 3.0%, comprising of 15 families. On the other hand, families with no children have the lowest poverty rate of 0.0%, which includes 0 families.
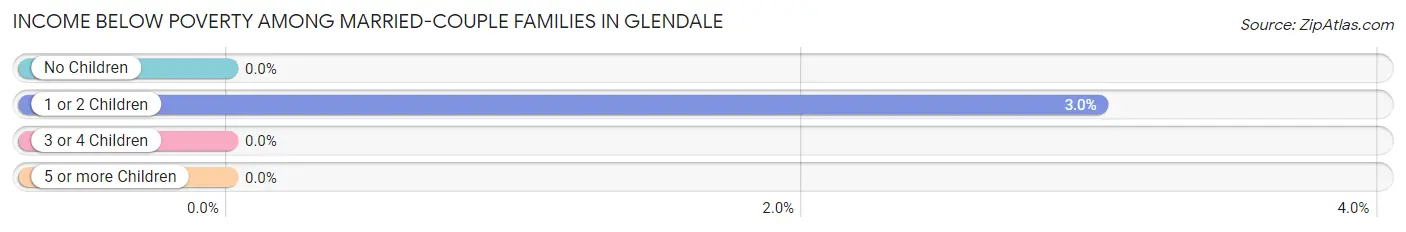
| Children | Above Poverty | Below Poverty |
| No Children | 663 (100.0%) | 0 (0.0%) |
| 1 or 2 Children | 480 (97.0%) | 15 (3.0%) |
| 3 or 4 Children | 247 (100.0%) | 0 (0.0%) |
| 5 or more Children | 0 (0.0%) | 0 (0.0%) |
| Total | 1,390 (98.9%) | 15 (1.1%) |
Income Below Poverty Among Single-Parent Households in Glendale
| Children | Single Father | Single Mother |
| No Children | 0 (0.0%) | 0 (0.0%) |
| 1 or 2 Children | 0 (0.0%) | 0 (0.0%) |
| 3 or 4 Children | 0 (0.0%) | 0 (0.0%) |
| 5 or more Children | 0 (0.0%) | 0 (0.0%) |
| Total | 0 (0.0%) | 0 (0.0%) |
Income Below Poverty Among Married-Couple vs Single-Parent Households in Glendale
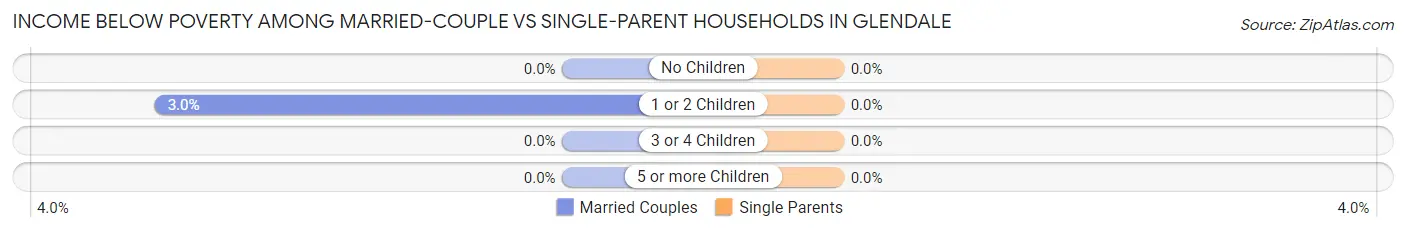
| Children | Married-Couple Families | Single-Parent Households |
| No Children | 0 (0.0%) | 0 (0.0%) |
| 1 or 2 Children | 15 (3.0%) | 0 (0.0%) |
| 3 or 4 Children | 0 (0.0%) | 0 (0.0%) |
| 5 or more Children | 0 (0.0%) | 0 (0.0%) |
| Total | 15 (1.1%) | 0 (0.0%) |
Race in Glendale
The most populous races in Glendale are White / Caucasian (5,741 | 93.6%), Two or more Races (221 | 3.6%), and Asian (127 | 2.1%).
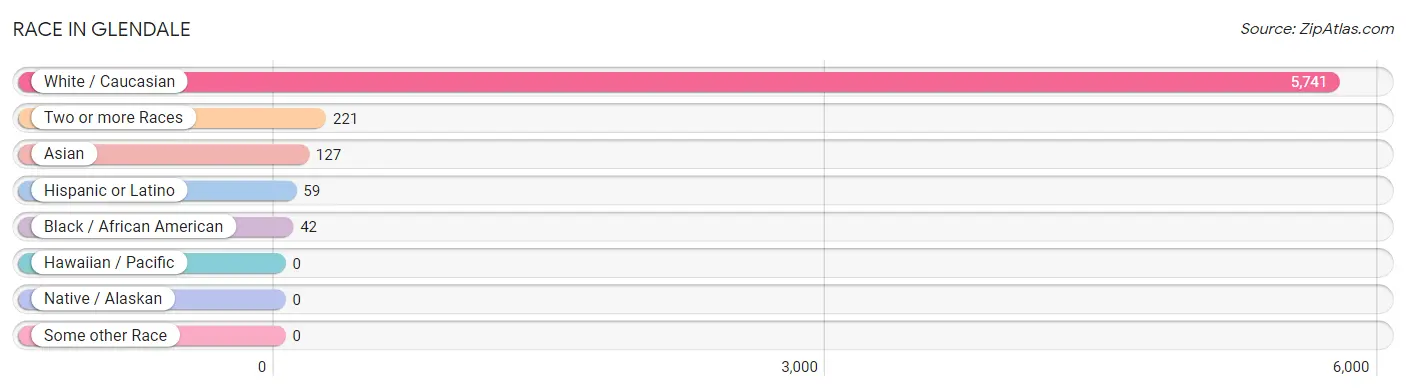
| Race | # Population | % Population |
| Asian | 127 | 2.1% |
| Black / African American | 42 | 0.7% |
| Hawaiian / Pacific | 0 | 0.0% |
| Hispanic or Latino | 59 | 1.0% |
| Native / Alaskan | 0 | 0.0% |
| White / Caucasian | 5,741 | 93.6% |
| Two or more Races | 221 | 3.6% |
| Some other Race | 0 | 0.0% |
| Total | 6,131 | 100.0% |
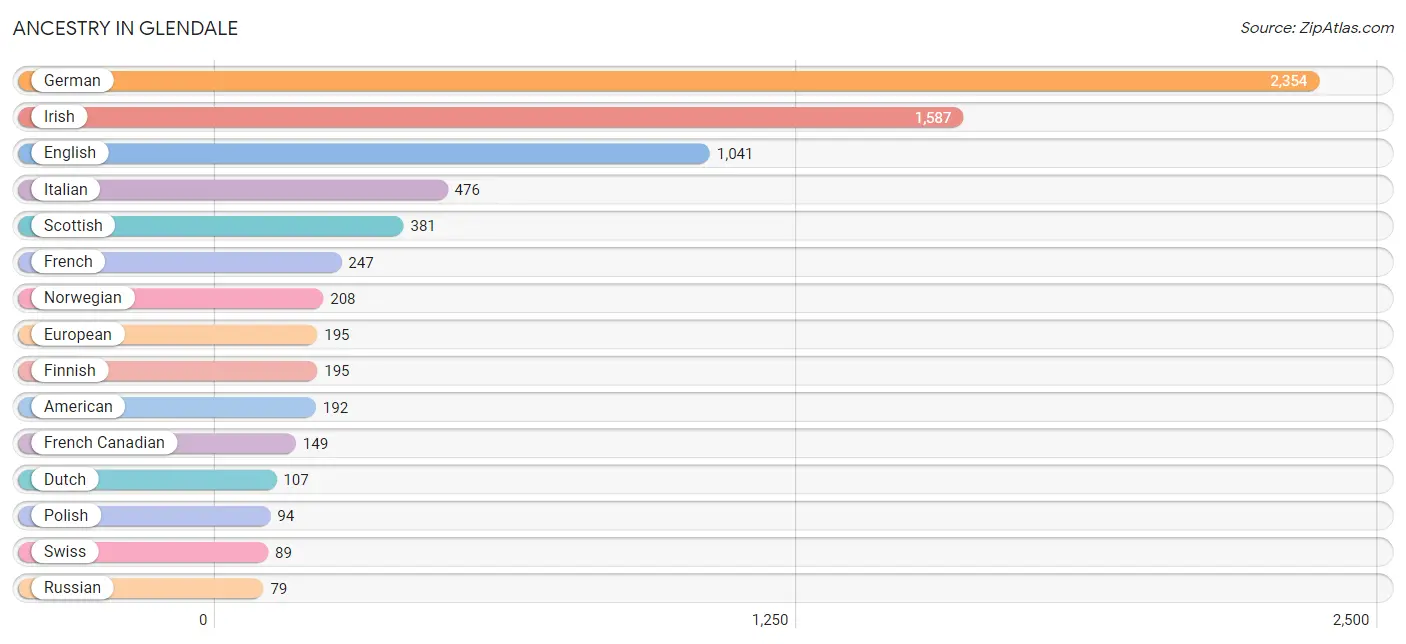
Ancestry in Glendale
The most populous ancestries reported in Glendale are German (2,354 | 38.4%), Irish (1,587 | 25.9%), English (1,041 | 17.0%), Italian (476 | 7.8%), and Scottish (381 | 6.2%), together accounting for 95.2% of all Glendale residents.
| Ancestry | # Population | % Population |
| Alsatian | 16 | 0.3% |
| American | 192 | 3.1% |
| Arab | 14 | 0.2% |
| Australian | 21 | 0.3% |
| British | 16 | 0.3% |
| Czech | 64 | 1.0% |
| Dutch | 107 | 1.8% |
| Eastern European | 14 | 0.2% |
| English | 1,041 | 17.0% |
| European | 195 | 3.2% |
| Finnish | 195 | 3.2% |
| French | 247 | 4.0% |
| French Canadian | 149 | 2.4% |
| German | 2,354 | 38.4% |
| Greek | 44 | 0.7% |
| Hungarian | 53 | 0.9% |
| Indian (Asian) | 51 | 0.8% |
| Irish | 1,587 | 25.9% |
| Italian | 476 | 7.8% |
| Korean | 3 | 0.1% |
| Mexican | 58 | 0.9% |
| Norwegian | 208 | 3.4% |
| Polish | 94 | 1.5% |
| Romanian | 12 | 0.2% |
| Russian | 79 | 1.3% |
| Scandinavian | 23 | 0.4% |
| Scotch-Irish | 49 | 0.8% |
| Scottish | 381 | 6.2% |
| Slovak | 10 | 0.2% |
| Spaniard | 1 | 0.0% |
| Sri Lankan | 8 | 0.1% |
| Swedish | 60 | 1.0% |
| Swiss | 89 | 1.5% |
| Syrian | 14 | 0.2% |
| Thai | 73 | 1.2% |
| Ukrainian | 40 | 0.6% |
| Welsh | 41 | 0.7% | View All 37 Rows |
Immigrants in Glendale
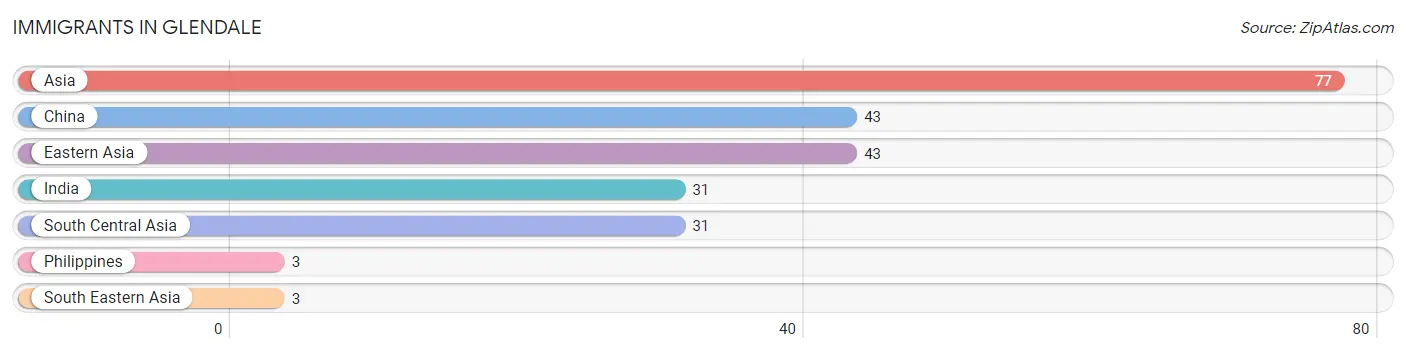
The most numerous immigrant groups reported in Glendale came from Asia (77 | 1.3%), China (43 | 0.7%), Eastern Asia (43 | 0.7%), India (31 | 0.5%), and South Central Asia (31 | 0.5%), together accounting for 3.7% of all Glendale residents.
| Immigration Origin | # Population | % Population |
| Asia | 77 | 1.3% |
| China | 43 | 0.7% |
| Eastern Asia | 43 | 0.7% |
| India | 31 | 0.5% |
| Philippines | 3 | 0.1% |
| South Central Asia | 31 | 0.5% |
| South Eastern Asia | 3 | 0.1% | View All 7 Rows |
Sex and Age in Glendale
Sex and Age in Glendale
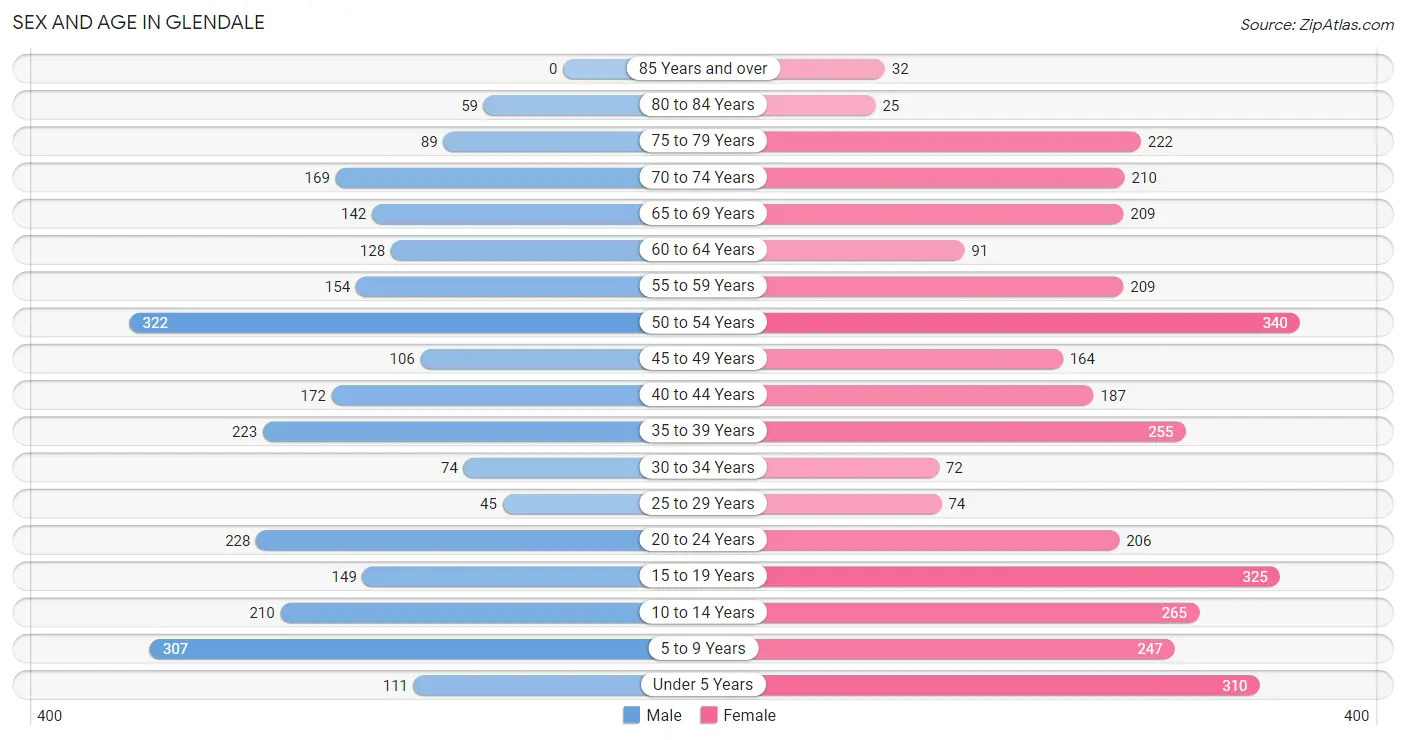
The most populous age groups in Glendale are 50 to 54 Years (322 | 12.0%) for men and 50 to 54 Years (340 | 9.9%) for women.
| Age Bracket | Male | Female |
| Under 5 Years | 111 (4.1%) | 310 (9.0%) |
| 5 to 9 Years | 307 (11.4%) | 247 (7.2%) |
| 10 to 14 Years | 210 (7.8%) | 265 (7.7%) |
| 15 to 19 Years | 149 (5.5%) | 325 (9.4%) |
| 20 to 24 Years | 228 (8.5%) | 206 (6.0%) |
| 25 to 29 Years | 45 (1.7%) | 74 (2.1%) |
| 30 to 34 Years | 74 (2.8%) | 72 (2.1%) |
| 35 to 39 Years | 223 (8.3%) | 255 (7.4%) |
| 40 to 44 Years | 172 (6.4%) | 187 (5.4%) |
| 45 to 49 Years | 106 (3.9%) | 164 (4.8%) |
| 50 to 54 Years | 322 (12.0%) | 340 (9.9%) |
| 55 to 59 Years | 154 (5.7%) | 209 (6.1%) |
| 60 to 64 Years | 128 (4.8%) | 91 (2.6%) |
| 65 to 69 Years | 142 (5.3%) | 209 (6.1%) |
| 70 to 74 Years | 169 (6.3%) | 210 (6.1%) |
| 75 to 79 Years | 89 (3.3%) | 222 (6.5%) |
| 80 to 84 Years | 59 (2.2%) | 25 (0.7%) |
| 85 Years and over | 0 (0.0%) | 32 (0.9%) |
| Total | 2,688 (100.0%) | 3,443 (100.0%) |
Families and Households in Glendale
Median Family Size in Glendale
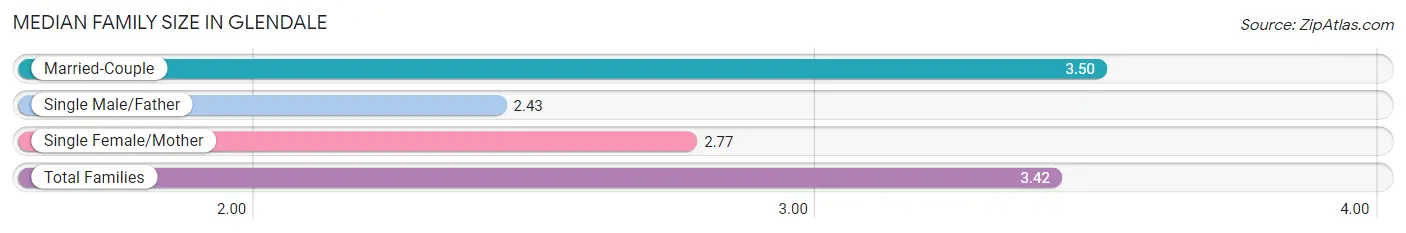
The median family size in Glendale is 3.42 persons per family, with married-couple families (1,405 | 89.5%) accounting for the largest median family size of 3.5 persons per family. On the other hand, single male/father families (30 | 1.9%) represent the smallest median family size with 2.43 persons per family.
| Family Type | # Families | Family Size |
| Married-Couple | 1,405 (89.5%) | 3.50 |
| Single Male/Father | 30 (1.9%) | 2.43 |
| Single Female/Mother | 135 (8.6%) | 2.77 |
| Total Families | 1,570 (100.0%) | 3.42 |
Median Household Size in Glendale
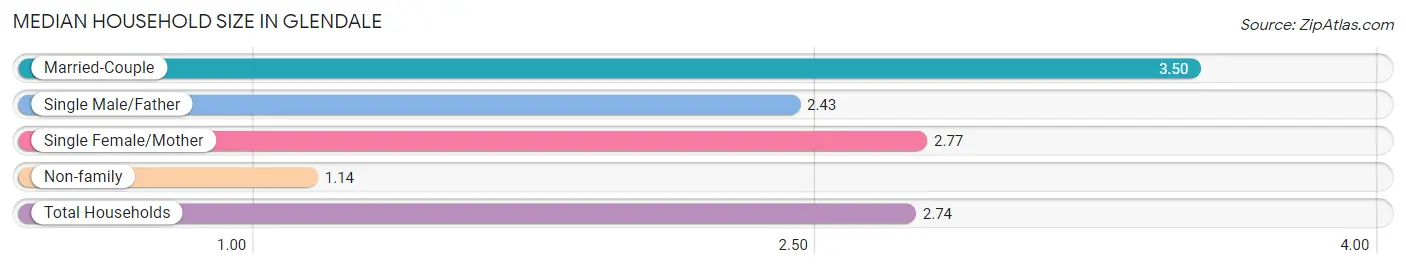
The median household size in Glendale is 2.74 persons per household, with married-couple households (1,405 | 62.7%) accounting for the largest median household size of 3.5 persons per household. non-family households (669 | 29.9%) represent the smallest median household size with 1.14 persons per household.
| Household Type | # Households | Household Size |
| Married-Couple | 1,405 (62.7%) | 3.50 |
| Single Male/Father | 30 (1.3%) | 2.43 |
| Single Female/Mother | 135 (6.0%) | 2.77 |
| Non-family | 669 (29.9%) | 1.14 |
| Total Households | 2,239 (100.0%) | 2.74 |
Household Size by Marriage Status in Glendale
Out of a total of 2,239 households in Glendale, 1,570 (70.1%) are family households, while 669 (29.9%) are nonfamily households. The most numerous type of family households are 2-person households, comprising 512, and the most common type of nonfamily households are 1-person households, comprising 605.
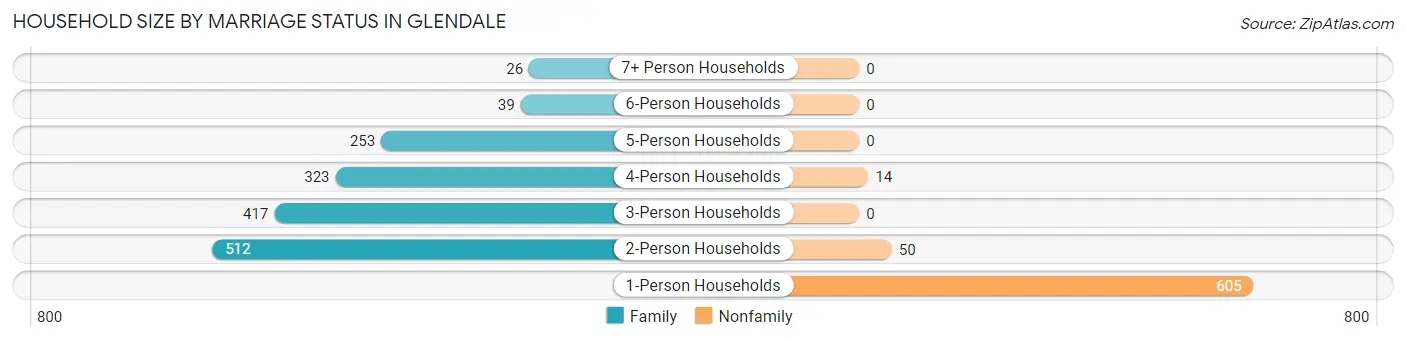
| Household Size | Family Households | Nonfamily Households |
| 1-Person Households | - | 605 (27.0%) |
| 2-Person Households | 512 (22.9%) | 50 (2.2%) |
| 3-Person Households | 417 (18.6%) | 0 (0.0%) |
| 4-Person Households | 323 (14.4%) | 14 (0.6%) |
| 5-Person Households | 253 (11.3%) | 0 (0.0%) |
| 6-Person Households | 39 (1.7%) | 0 (0.0%) |
| 7+ Person Households | 26 (1.2%) | 0 (0.0%) |
| Total | 1,570 (70.1%) | 669 (29.9%) |
Female Fertility in Glendale
Fertility by Age in Glendale
Average fertility rate in Glendale is 46.0 births per 1,000 women. Women in the age bracket of 35 to 50 years have the highest fertility rate with 70.0 births per 1,000 women. Women in the age bracket of 35 to 50 years acount for 79.7% of all women with births.
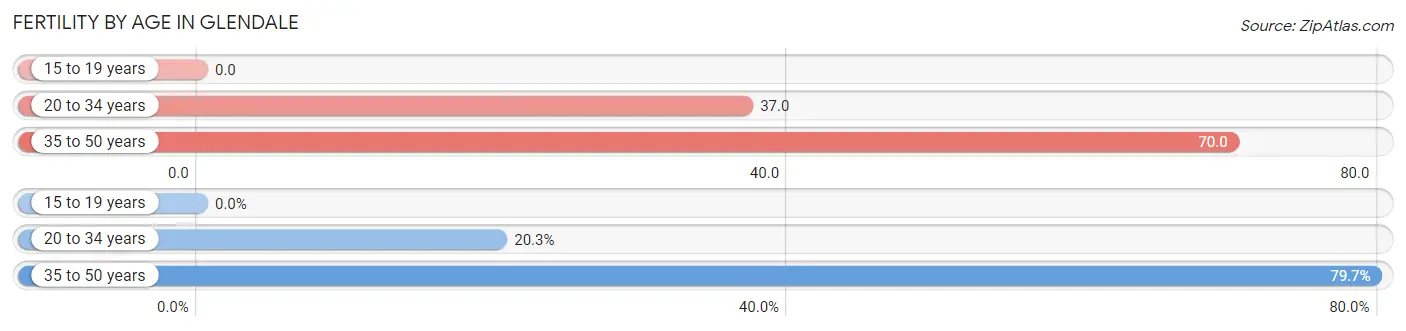
| Age Bracket | Women with Births | Births / 1,000 Women |
| 15 to 19 years | 0 (0.0%) | 0.0 |
| 20 to 34 years | 13 (20.3%) | 37.0 |
| 35 to 50 years | 51 (79.7%) | 70.0 |
| Total | 64 (100.0%) | 46.0 |
Fertility by Age by Marriage Status in Glendale
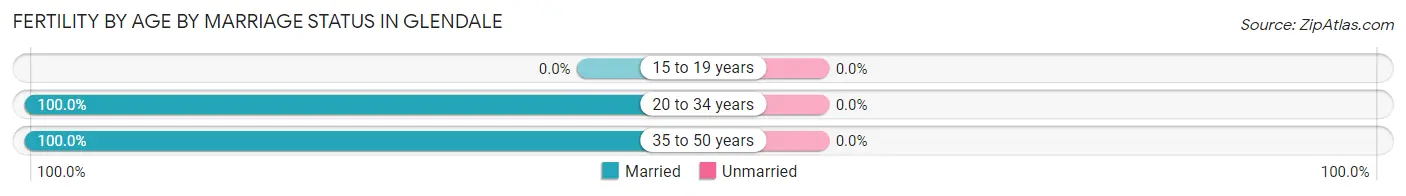
| Age Bracket | Married | Unmarried |
| 15 to 19 years | 0 (0.0%) | 0 (0.0%) |
| 20 to 34 years | 13 (100.0%) | 0 (0.0%) |
| 35 to 50 years | 51 (100.0%) | 0 (0.0%) |
| Total | 64 (100.0%) | 0 (0.0%) |
Fertility by Education in Glendale
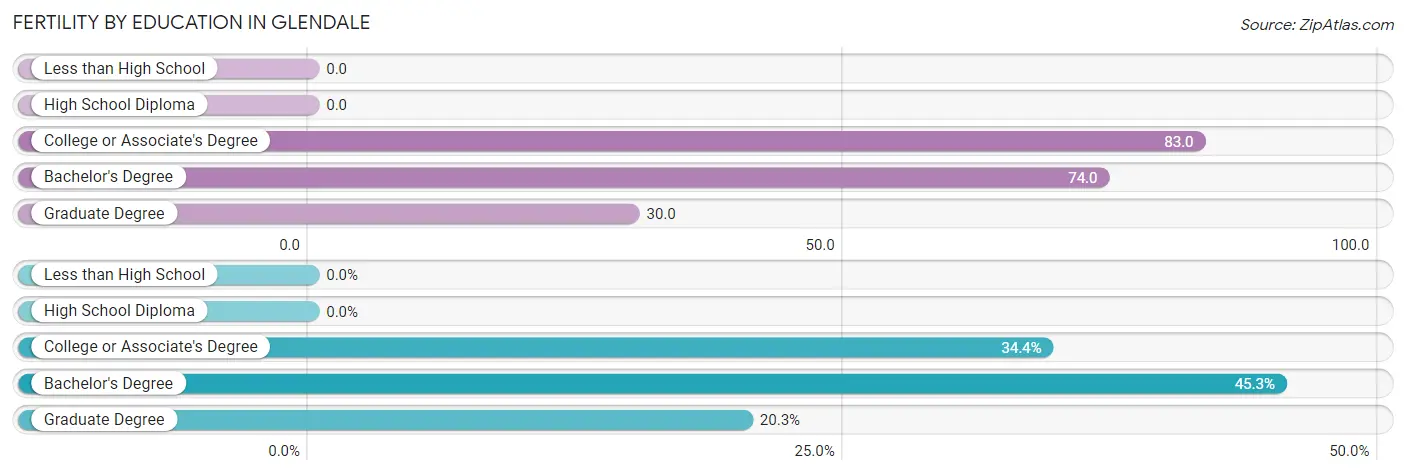
| Educational Attainment | Women with Births | Births / 1,000 Women |
| Less than High School | 0 (0.0%) | 0.0 |
| High School Diploma | 0 (0.0%) | 0.0 |
| College or Associate's Degree | 22 (34.4%) | 83.0 |
| Bachelor's Degree | 29 (45.3%) | 74.0 |
| Graduate Degree | 13 (20.3%) | 30.0 |
| Total | 64 (100.0%) | 46.0 |
Fertility by Education by Marriage Status in Glendale
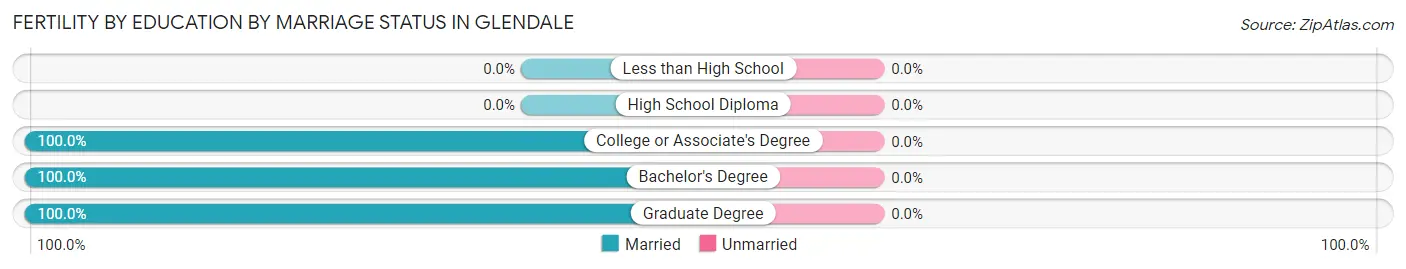
| Educational Attainment | Married | Unmarried |
| Less than High School | 0 (0.0%) | 0 (0.0%) |
| High School Diploma | 0 (0.0%) | 0 (0.0%) |
| College or Associate's Degree | 22 (100.0%) | 0 (0.0%) |
| Bachelor's Degree | 29 (100.0%) | 0 (0.0%) |
| Graduate Degree | 13 (100.0%) | 0 (0.0%) |
| Total | 64 (100.0%) | 0 (0.0%) |
Employment Characteristics in Glendale
Employment by Class of Employer in Glendale
Among the 2,604 employed individuals in Glendale, private company employees (1,866 | 71.7%), not-for-profit organizations (353 | 13.6%), and self-employed (incorporated) (139 | 5.3%) make up the most common classes of employment.
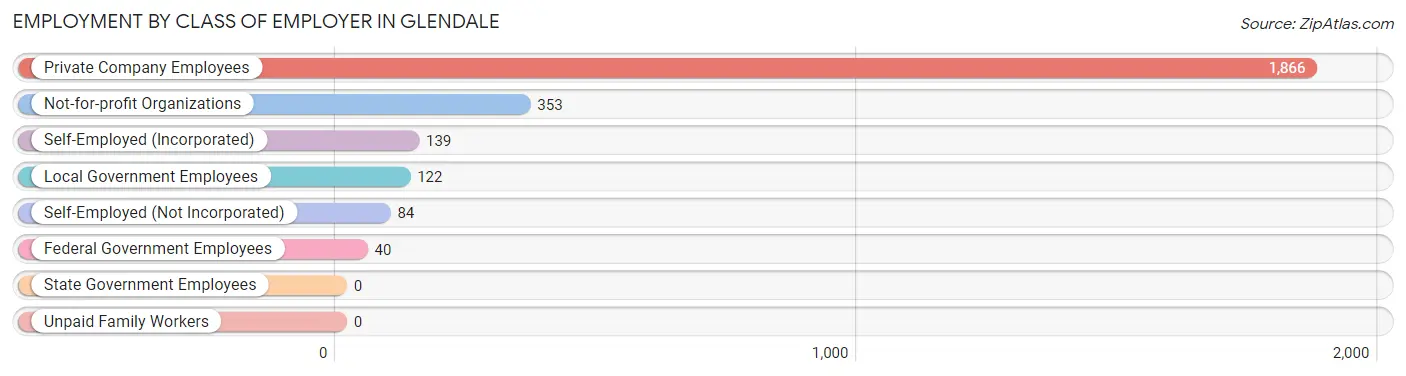
| Employer Class | # Employees | % Employees |
| Private Company Employees | 1,866 | 71.7% |
| Self-Employed (Incorporated) | 139 | 5.3% |
| Self-Employed (Not Incorporated) | 84 | 3.2% |
| Not-for-profit Organizations | 353 | 13.6% |
| Local Government Employees | 122 | 4.7% |
| State Government Employees | 0 | 0.0% |
| Federal Government Employees | 40 | 1.5% |
| Unpaid Family Workers | 0 | 0.0% |
| Total | 2,604 | 100.0% |
Employment Status by Age in Glendale
According to the labor force statistics for Glendale, out of the total population over 16 years of age (4,630), 56.7% or 2,625 individuals are in the labor force, with 0.8% or 21 of them unemployed. The age group with the highest labor force participation rate is 25 to 29 years, with 100.0% or 119 individuals in the labor force. Within the labor force, the 55 to 59 years age range has the highest percentage of unemployed individuals, with 5.9% or 16 of them being unemployed.
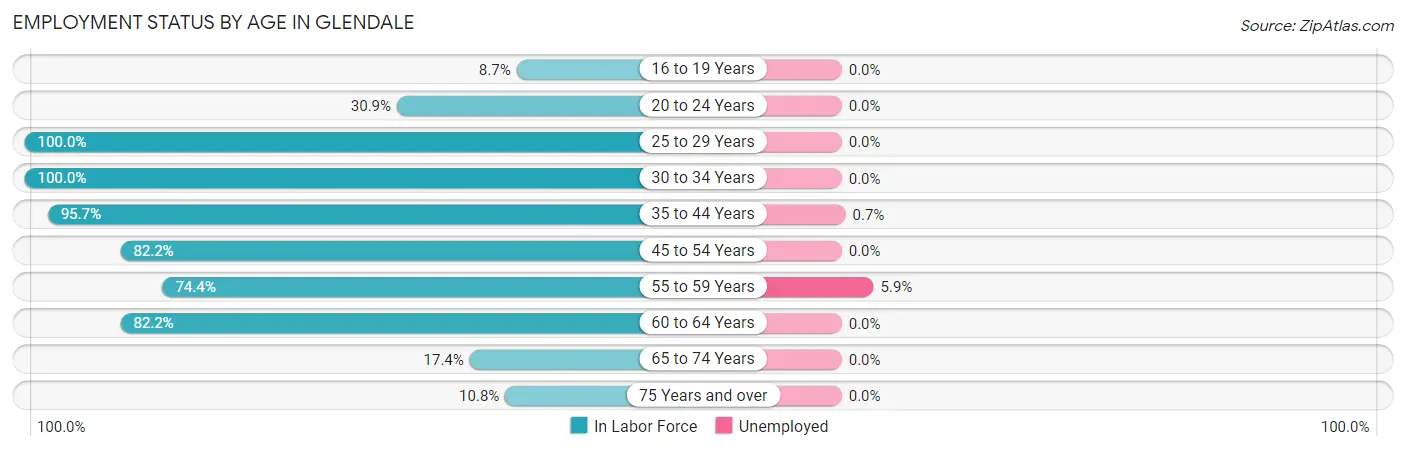
| Age Bracket | In Labor Force | Unemployed |
| 16 to 19 Years | 37 (8.7%) | 0 (0.0%) |
| 20 to 24 Years | 134 (30.9%) | 0 (0.0%) |
| 25 to 29 Years | 119 (100.0%) | 0 (0.0%) |
| 30 to 34 Years | 146 (100.0%) | 0 (0.0%) |
| 35 to 44 Years | 801 (95.7%) | 6 (0.7%) |
| 45 to 54 Years | 766 (82.2%) | 0 (0.0%) |
| 55 to 59 Years | 270 (74.4%) | 16 (5.9%) |
| 60 to 64 Years | 180 (82.2%) | 0 (0.0%) |
| 65 to 74 Years | 127 (17.4%) | 0 (0.0%) |
| 75 Years and over | 46 (10.8%) | 0 (0.0%) |
| Total | 2,625 (56.7%) | 21 (0.8%) |
Employment Status by Educational Attainment in Glendale
According to labor force statistics for Glendale, 87.2% of individuals (2,281) out of the total population between 25 and 64 years of age (2,616) are in the labor force, with 1.0% or 23 of them being unemployed. The group with the highest labor force participation rate are those with the educational attainment of high school diploma, with 100.0% or 22 individuals in the labor force. Within the labor force, individuals with bachelor's degree or higher education have the highest percentage of unemployment, with 1.1% or 21 of them being unemployed.
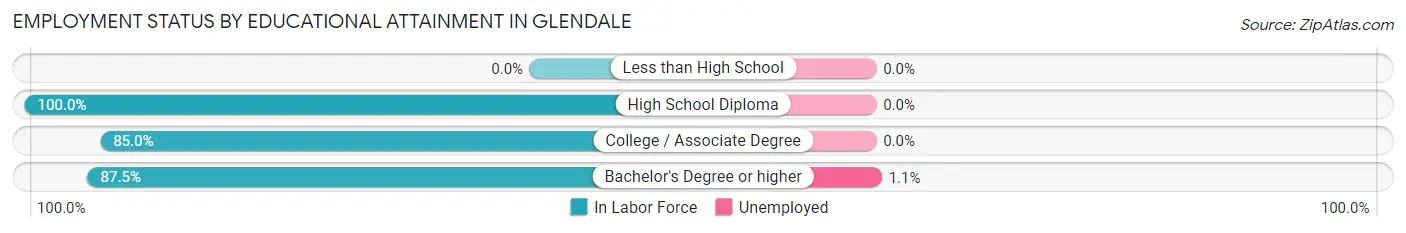
| Educational Attainment | In Labor Force | Unemployed |
| Less than High School | 0 (0.0%) | 0 (0.0%) |
| High School Diploma | 22 (100.0%) | 0 (0.0%) |
| College / Associate Degree | 307 (85.0%) | 0 (0.0%) |
| Bachelor's Degree or higher | 1,954 (87.5%) | 25 (1.1%) |
| Total | 2,281 (87.2%) | 26 (1.0%) |
Employment Occupations by Sex in Glendale
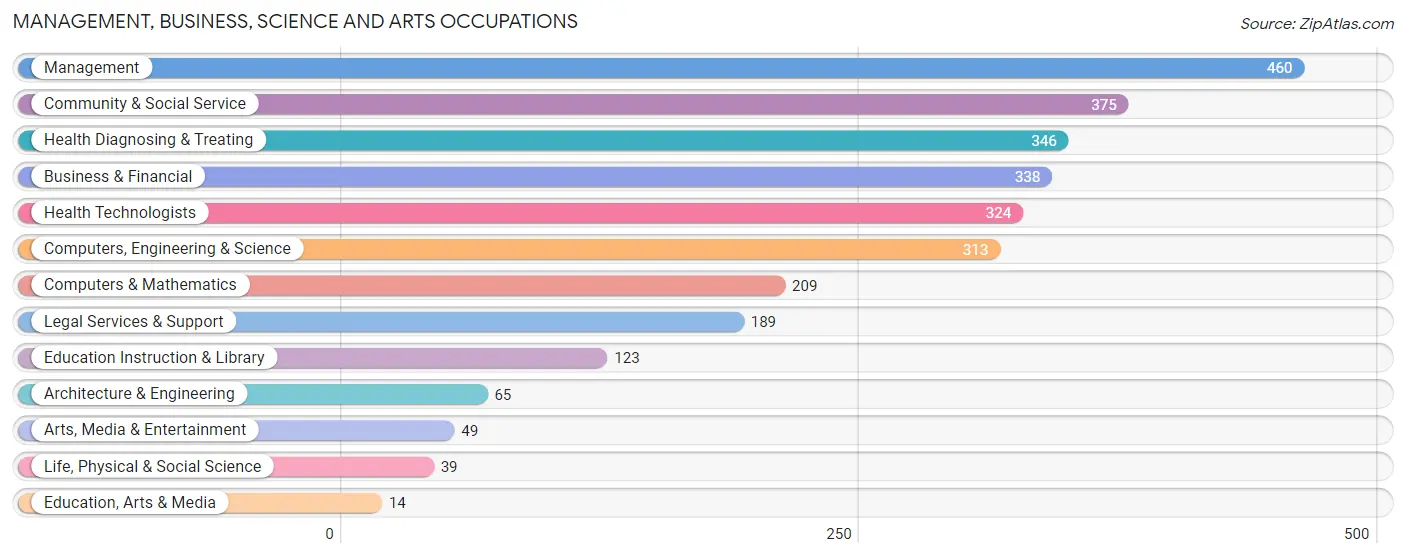
Management, Business, Science and Arts Occupations
The most common Management, Business, Science and Arts occupations in Glendale are Management (460 | 17.7%), Community & Social Service (375 | 14.4%), Health Diagnosing & Treating (346 | 13.3%), Business & Financial (338 | 13.0%), and Health Technologists (324 | 12.4%).
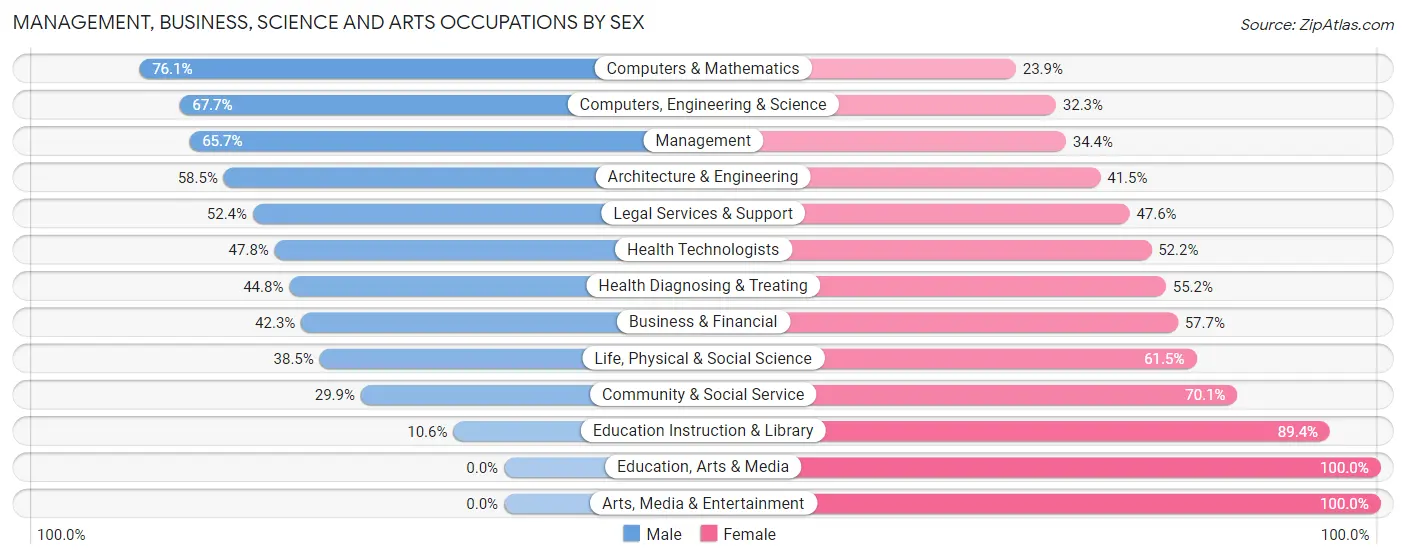
Management, Business, Science and Arts Occupations by Sex
Within the Management, Business, Science and Arts occupations in Glendale, the most male-oriented occupations are Computers & Mathematics (76.1%), Computers, Engineering & Science (67.7%), and Management (65.6%), while the most female-oriented occupations are Education, Arts & Media (100.0%), Arts, Media & Entertainment (100.0%), and Education Instruction & Library (89.4%).
| Occupation | Male | Female |
| Management | 302 (65.6%) | 158 (34.4%) |
| Business & Financial | 143 (42.3%) | 195 (57.7%) |
| Computers, Engineering & Science | 212 (67.7%) | 101 (32.3%) |
| Computers & Mathematics | 159 (76.1%) | 50 (23.9%) |
| Architecture & Engineering | 38 (58.5%) | 27 (41.5%) |
| Life, Physical & Social Science | 15 (38.5%) | 24 (61.5%) |
| Community & Social Service | 112 (29.9%) | 263 (70.1%) |
| Education, Arts & Media | 0 (0.0%) | 14 (100.0%) |
| Legal Services & Support | 99 (52.4%) | 90 (47.6%) |
| Education Instruction & Library | 13 (10.6%) | 110 (89.4%) |
| Arts, Media & Entertainment | 0 (0.0%) | 49 (100.0%) |
| Health Diagnosing & Treating | 155 (44.8%) | 191 (55.2%) |
| Health Technologists | 155 (47.8%) | 169 (52.2%) |
| Total (Category) | 924 (50.4%) | 908 (49.6%) |
| Total (Overall) | 1,406 (54.0%) | 1,198 (46.0%) |
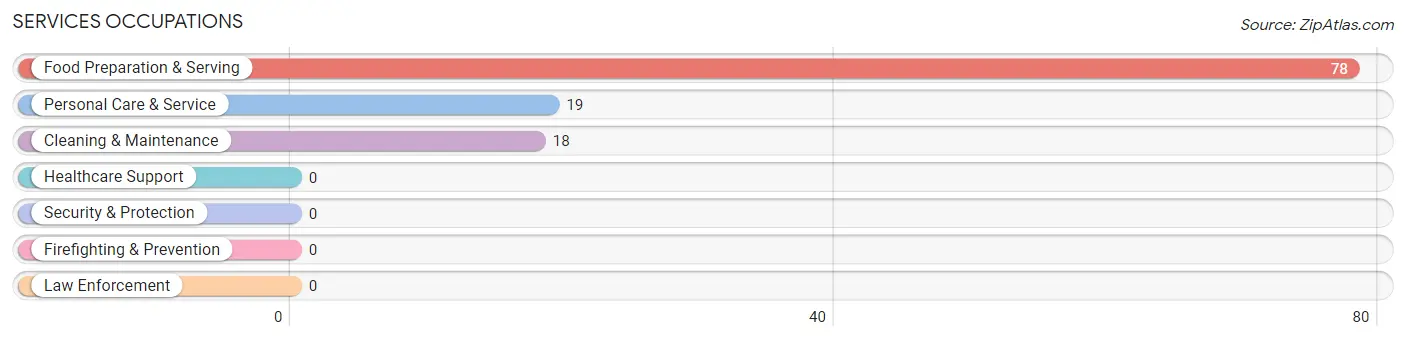
Services Occupations
The most common Services occupations in Glendale are Food Preparation & Serving (78 | 3.0%), Personal Care & Service (19 | 0.7%), and Cleaning & Maintenance (18 | 0.7%).
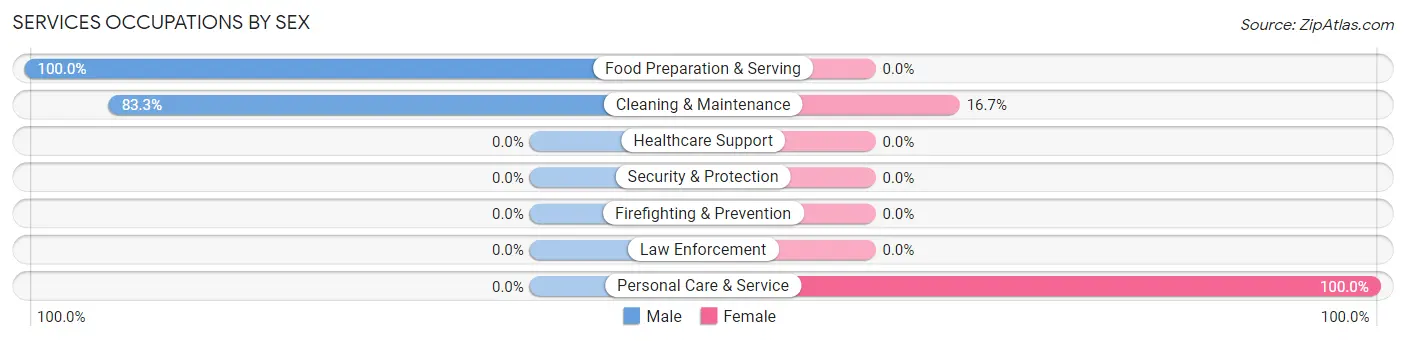
Services Occupations by Sex
Within the Services occupations in Glendale, the most male-oriented occupations are Food Preparation & Serving (100.0%), and Cleaning & Maintenance (83.3%), while the most female-oriented occupations are Personal Care & Service (100.0%), and Cleaning & Maintenance (16.7%).
| Occupation | Male | Female |
| Healthcare Support | 0 (0.0%) | 0 (0.0%) |
| Security & Protection | 0 (0.0%) | 0 (0.0%) |
| Firefighting & Prevention | 0 (0.0%) | 0 (0.0%) |
| Law Enforcement | 0 (0.0%) | 0 (0.0%) |
| Food Preparation & Serving | 78 (100.0%) | 0 (0.0%) |
| Cleaning & Maintenance | 15 (83.3%) | 3 (16.7%) |
| Personal Care & Service | 0 (0.0%) | 19 (100.0%) |
| Total (Category) | 93 (80.9%) | 22 (19.1%) |
| Total (Overall) | 1,406 (54.0%) | 1,198 (46.0%) |
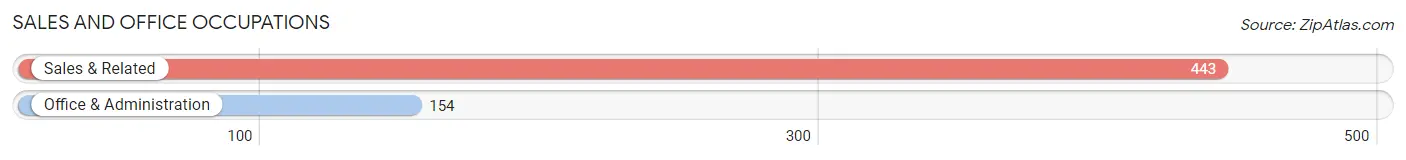
Sales and Office Occupations
The most common Sales and Office occupations in Glendale are Sales & Related (443 | 17.0%), and Office & Administration (154 | 5.9%).
Sales and Office Occupations by Sex
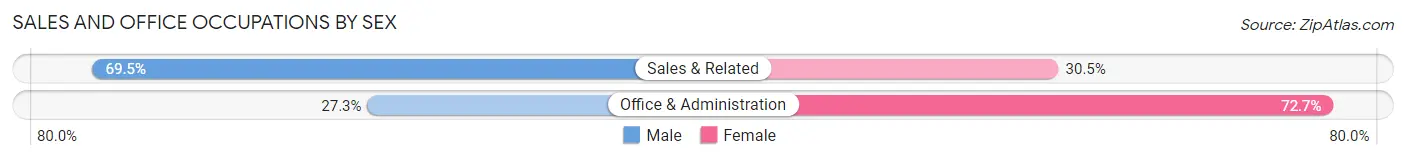
| Occupation | Male | Female |
| Sales & Related | 308 (69.5%) | 135 (30.5%) |
| Office & Administration | 42 (27.3%) | 112 (72.7%) |
| Total (Category) | 350 (58.6%) | 247 (41.4%) |
| Total (Overall) | 1,406 (54.0%) | 1,198 (46.0%) |
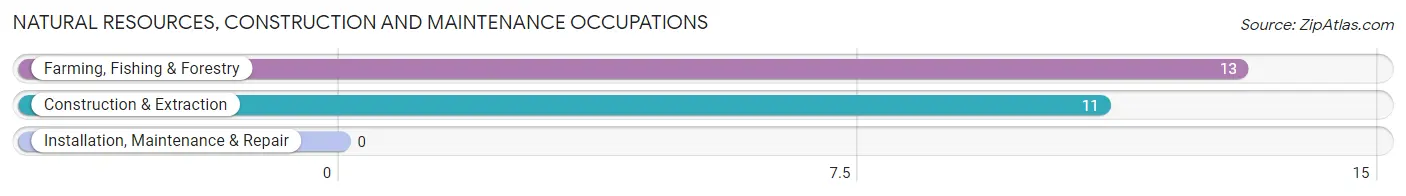
Natural Resources, Construction and Maintenance Occupations
The most common Natural Resources, Construction and Maintenance occupations in Glendale are Farming, Fishing & Forestry (13 | 0.5%), and Construction & Extraction (11 | 0.4%).
Natural Resources, Construction and Maintenance Occupations by Sex
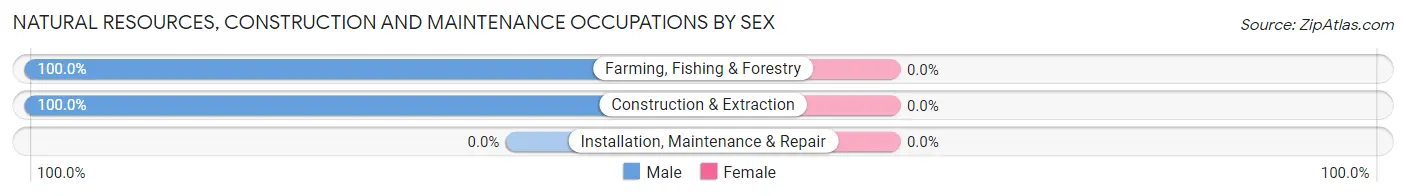
| Occupation | Male | Female |
| Farming, Fishing & Forestry | 13 (100.0%) | 0 (0.0%) |
| Construction & Extraction | 11 (100.0%) | 0 (0.0%) |
| Installation, Maintenance & Repair | 0 (0.0%) | 0 (0.0%) |
| Total (Category) | 24 (100.0%) | 0 (0.0%) |
| Total (Overall) | 1,406 (54.0%) | 1,198 (46.0%) |
Production, Transportation and Moving Occupations
The most common Production, Transportation and Moving occupations in Glendale are Production (21 | 0.8%), and Transportation (15 | 0.6%).
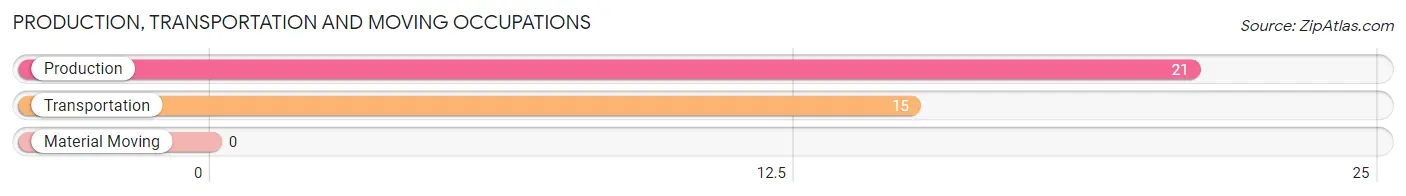
Production, Transportation and Moving Occupations by Sex
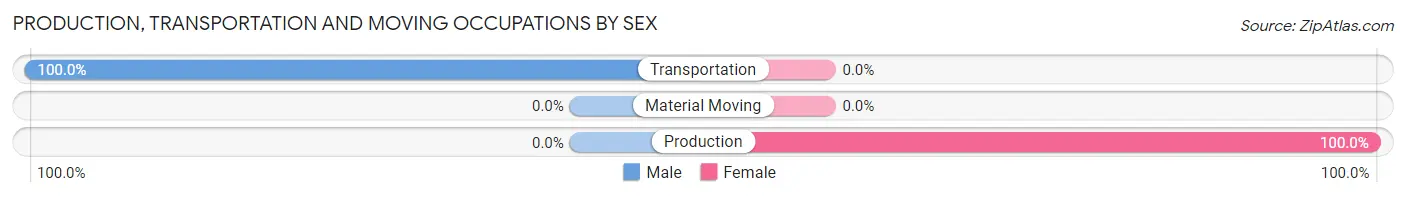
| Occupation | Male | Female |
| Production | 0 (0.0%) | 21 (100.0%) |
| Transportation | 15 (100.0%) | 0 (0.0%) |
| Material Moving | 0 (0.0%) | 0 (0.0%) |
| Total (Category) | 15 (41.7%) | 21 (58.3%) |
| Total (Overall) | 1,406 (54.0%) | 1,198 (46.0%) |
Employment Industries by Sex in Glendale
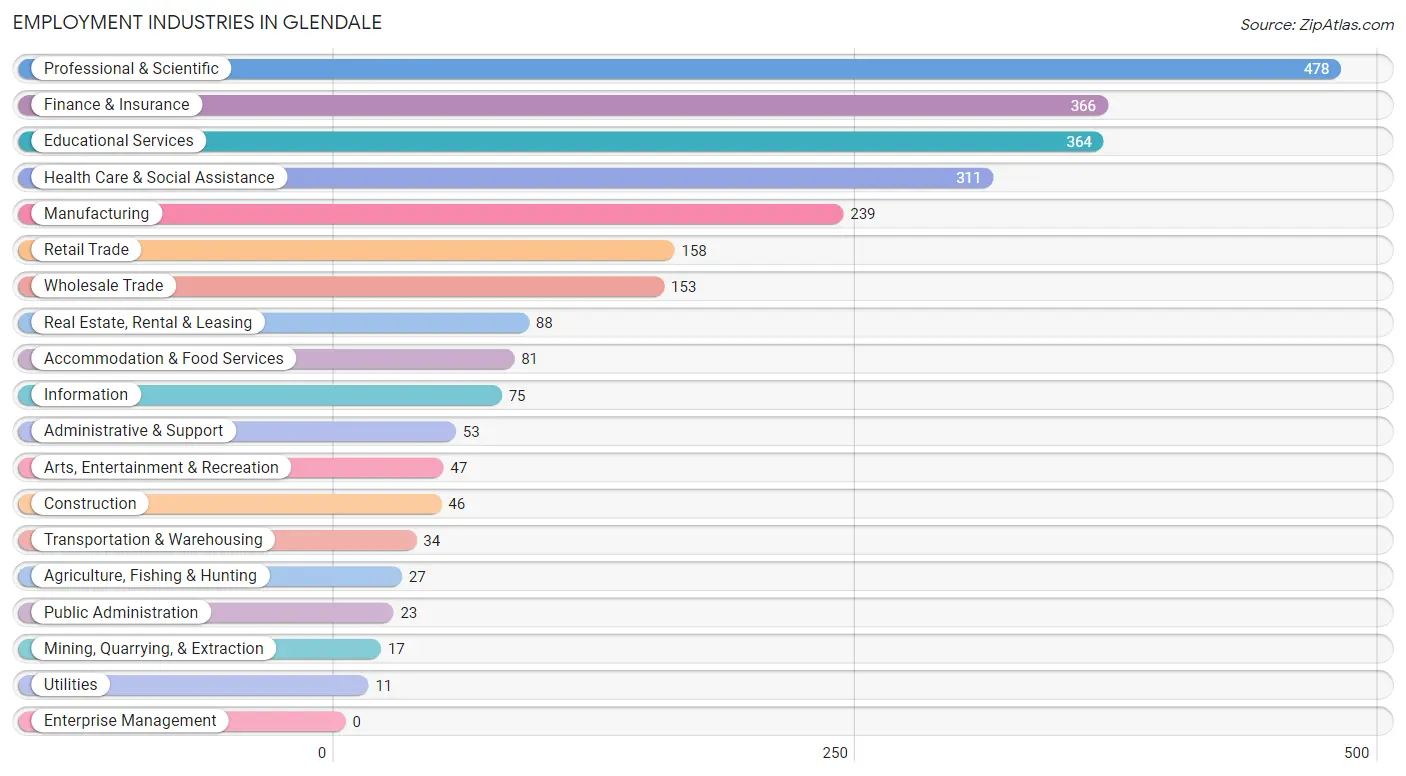
Employment Industries in Glendale
The major employment industries in Glendale include Professional & Scientific (478 | 18.4%), Finance & Insurance (366 | 14.1%), Educational Services (364 | 14.0%), Health Care & Social Assistance (311 | 11.9%), and Manufacturing (239 | 9.2%).
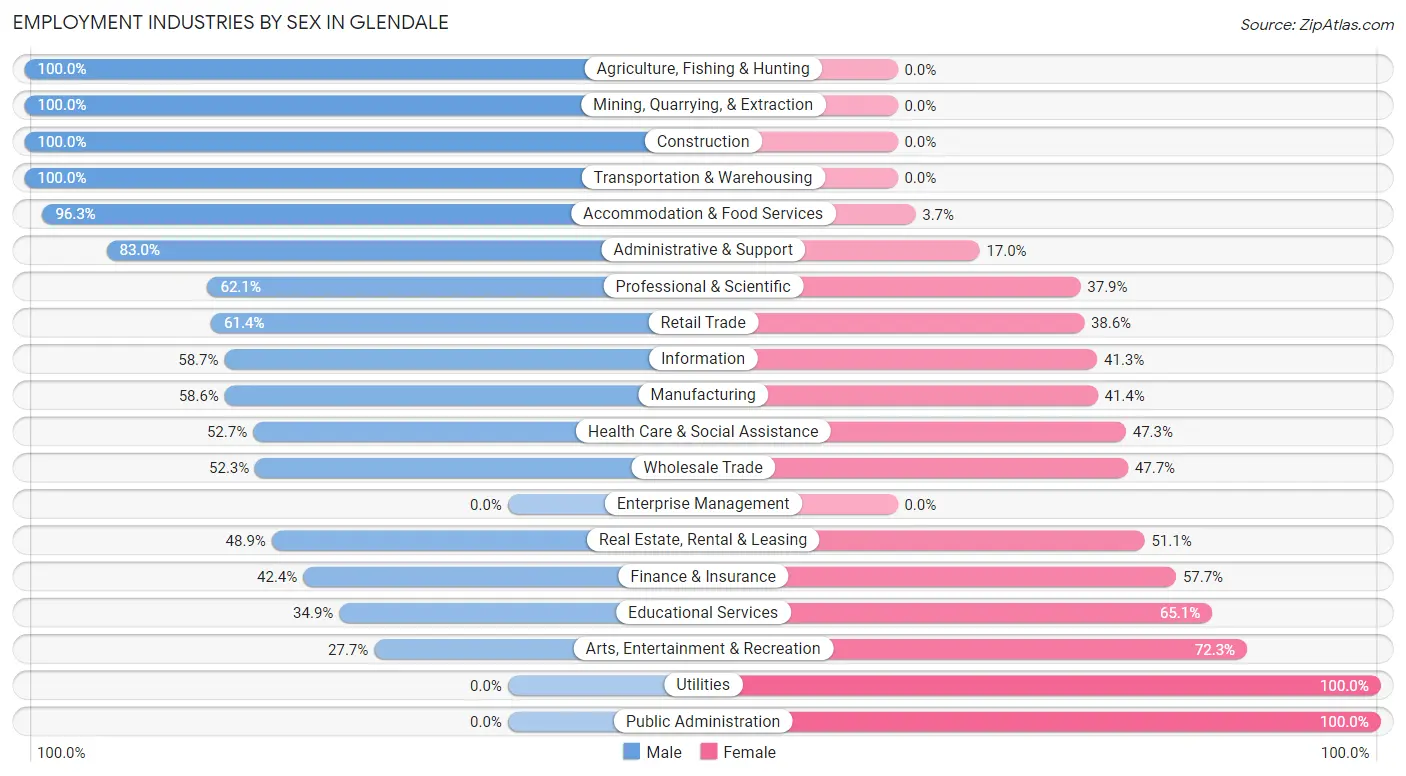
Employment Industries by Sex in Glendale
The Glendale industries that see more men than women are Agriculture, Fishing & Hunting (100.0%), Mining, Quarrying, & Extraction (100.0%), and Construction (100.0%), whereas the industries that tend to have a higher number of women are Utilities (100.0%), Public Administration (100.0%), and Arts, Entertainment & Recreation (72.3%).
| Industry | Male | Female |
| Agriculture, Fishing & Hunting | 27 (100.0%) | 0 (0.0%) |
| Mining, Quarrying, & Extraction | 17 (100.0%) | 0 (0.0%) |
| Construction | 46 (100.0%) | 0 (0.0%) |
| Manufacturing | 140 (58.6%) | 99 (41.4%) |
| Wholesale Trade | 80 (52.3%) | 73 (47.7%) |
| Retail Trade | 97 (61.4%) | 61 (38.6%) |
| Transportation & Warehousing | 34 (100.0%) | 0 (0.0%) |
| Utilities | 0 (0.0%) | 11 (100.0%) |
| Information | 44 (58.7%) | 31 (41.3%) |
| Finance & Insurance | 155 (42.3%) | 211 (57.7%) |
| Real Estate, Rental & Leasing | 43 (48.9%) | 45 (51.1%) |
| Professional & Scientific | 297 (62.1%) | 181 (37.9%) |
| Enterprise Management | 0 (0.0%) | 0 (0.0%) |
| Administrative & Support | 44 (83.0%) | 9 (17.0%) |
| Educational Services | 127 (34.9%) | 237 (65.1%) |
| Health Care & Social Assistance | 164 (52.7%) | 147 (47.3%) |
| Arts, Entertainment & Recreation | 13 (27.7%) | 34 (72.3%) |
| Accommodation & Food Services | 78 (96.3%) | 3 (3.7%) |
| Public Administration | 0 (0.0%) | 23 (100.0%) |
| Total | 1,406 (54.0%) | 1,198 (46.0%) |
Education in Glendale
School Enrollment in Glendale
The most common levels of schooling among the 2,051 students in Glendale are high school (475 | 23.2%), elementary school (431 | 21.0%), and college / undergraduate (424 | 20.7%).
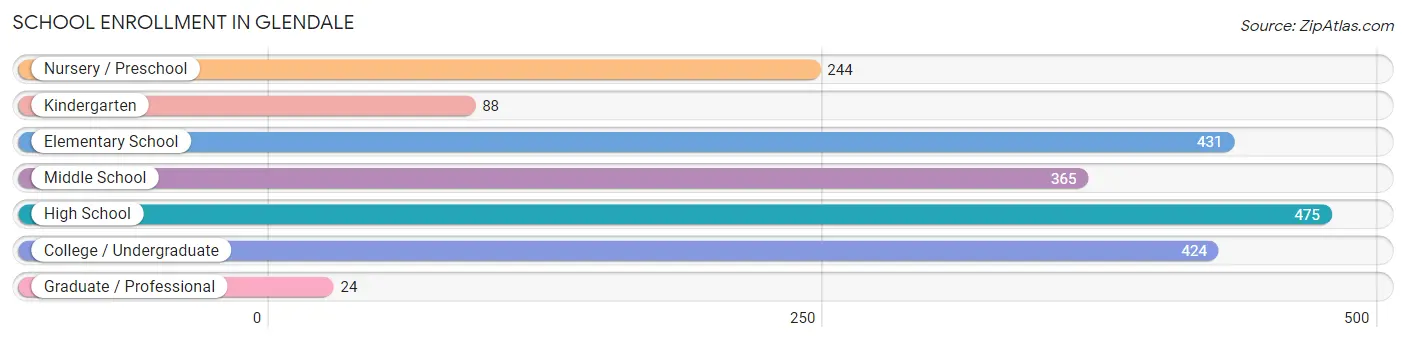
| School Level | # Students | % Students |
| Nursery / Preschool | 244 | 11.9% |
| Kindergarten | 88 | 4.3% |
| Elementary School | 431 | 21.0% |
| Middle School | 365 | 17.8% |
| High School | 475 | 23.2% |
| College / Undergraduate | 424 | 20.7% |
| Graduate / Professional | 24 | 1.2% |
| Total | 2,051 | 100.0% |
School Enrollment by Age by Funding Source in Glendale
Out of a total of 2,051 students who are enrolled in schools in Glendale, 1,001 (48.8%) attend a private institution, while the remaining 1,050 (51.2%) are enrolled in public schools. The age group of 3 to 4 year olds has the highest likelihood of being enrolled in private schools, with 138 (87.9% in the age bracket) enrolled. Conversely, the age group of 10 to 14 year olds has the lowest likelihood of being enrolled in a private school, with 284 (59.8% in the age bracket) attending a public institution.
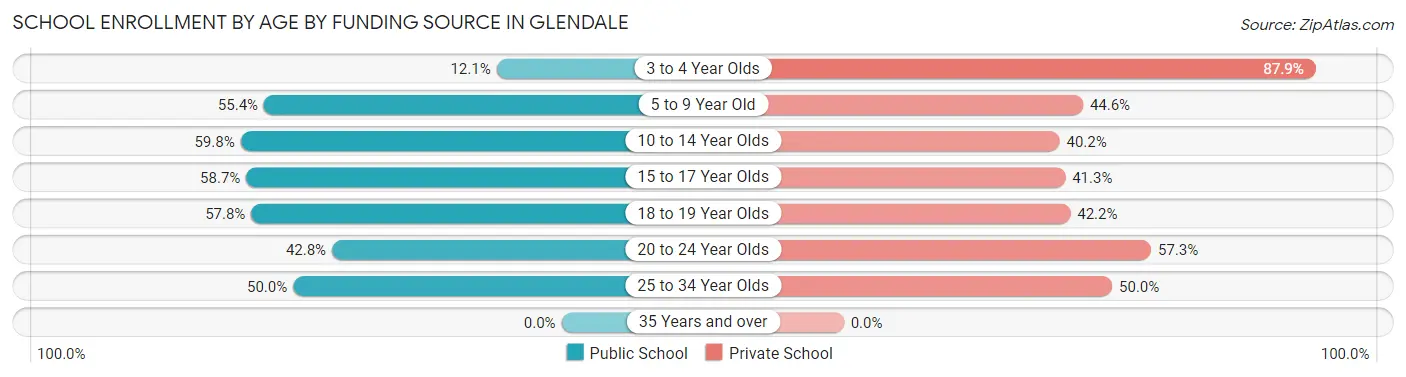
| Age Bracket | Public School | Private School |
| 3 to 4 Year Olds | 19 (12.1%) | 138 (87.9%) |
| 5 to 9 Year Old | 301 (55.4%) | 242 (44.6%) |
| 10 to 14 Year Olds | 284 (59.8%) | 191 (40.2%) |
| 15 to 17 Year Olds | 111 (58.7%) | 78 (41.3%) |
| 18 to 19 Year Olds | 152 (57.8%) | 111 (42.2%) |
| 20 to 24 Year Olds | 171 (42.7%) | 229 (57.3%) |
| 25 to 34 Year Olds | 12 (50.0%) | 12 (50.0%) |
| 35 Years and over | 0 (0.0%) | 0 (0.0%) |
| Total | 1,050 (51.2%) | 1,001 (48.8%) |
Educational Attainment by Field of Study in Glendale
Business (731 | 21.3%), education (411 | 12.0%), communications (295 | 8.6%), science & technology (247 | 7.2%), and literature & languages (234 | 6.8%) are the most common fields of study among 3,431 individuals in Glendale who have obtained a bachelor's degree or higher.
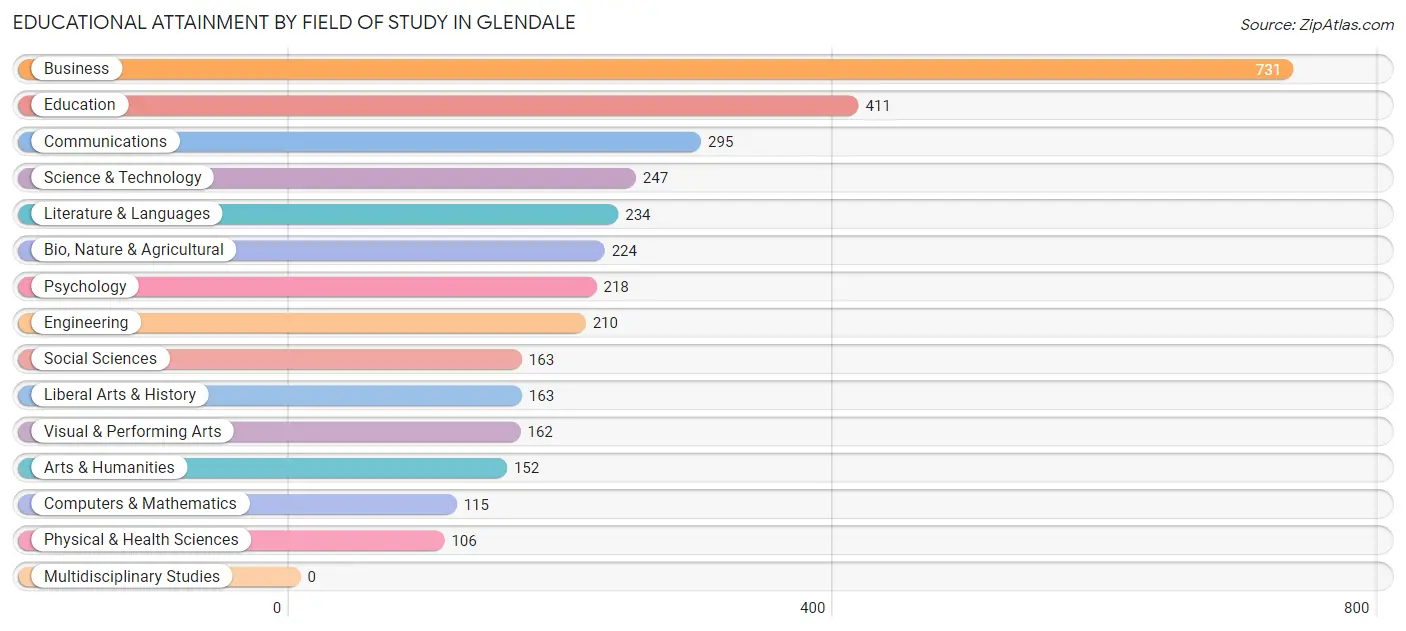
| Field of Study | # Graduates | % Graduates |
| Computers & Mathematics | 115 | 3.4% |
| Bio, Nature & Agricultural | 224 | 6.5% |
| Physical & Health Sciences | 106 | 3.1% |
| Psychology | 218 | 6.4% |
| Social Sciences | 163 | 4.8% |
| Engineering | 210 | 6.1% |
| Multidisciplinary Studies | 0 | 0.0% |
| Science & Technology | 247 | 7.2% |
| Business | 731 | 21.3% |
| Education | 411 | 12.0% |
| Literature & Languages | 234 | 6.8% |
| Liberal Arts & History | 163 | 4.8% |
| Visual & Performing Arts | 162 | 4.7% |
| Communications | 295 | 8.6% |
| Arts & Humanities | 152 | 4.4% |
| Total | 3,431 | 100.0% |
Transportation & Commute in Glendale
Vehicle Availability by Sex in Glendale
The most prevalent vehicle ownership categories in Glendale are males with 2 vehicles (891, accounting for 63.4%) and females with 2 vehicles (631, making up 74.4%).
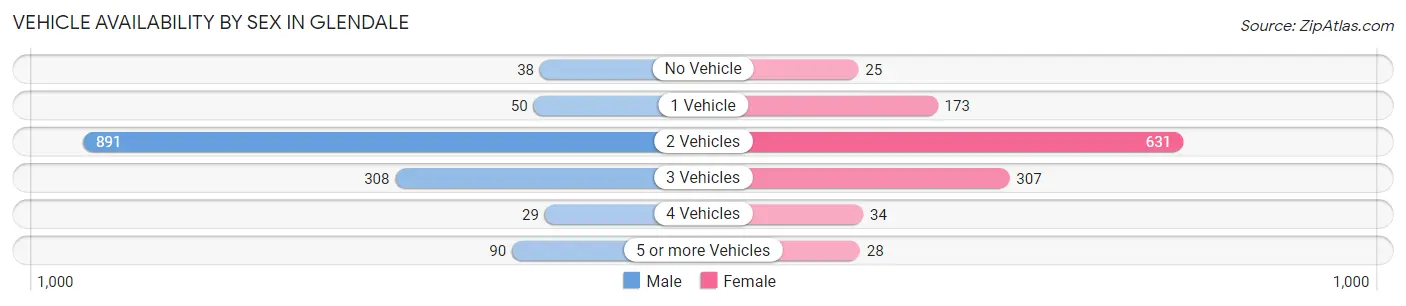
| Vehicles Available | Male | Female |
| No Vehicle | 38 (2.7%) | 25 (2.1%) |
| 1 Vehicle | 50 (3.6%) | 173 (14.4%) |
| 2 Vehicles | 891 (63.4%) | 631 (52.7%) |
| 3 Vehicles | 308 (21.9%) | 307 (25.6%) |
| 4 Vehicles | 29 (2.1%) | 34 (2.8%) |
| 5 or more Vehicles | 90 (6.4%) | 28 (2.3%) |
| Total | 1,406 (100.0%) | 1,198 (100.0%) |
Commute Time in Glendale
The most frequently occuring commute durations in Glendale are 20 to 24 minutes (525 commuters, 26.9%), 15 to 19 minutes (436 commuters, 22.4%), and 25 to 29 minutes (272 commuters, 14.0%).
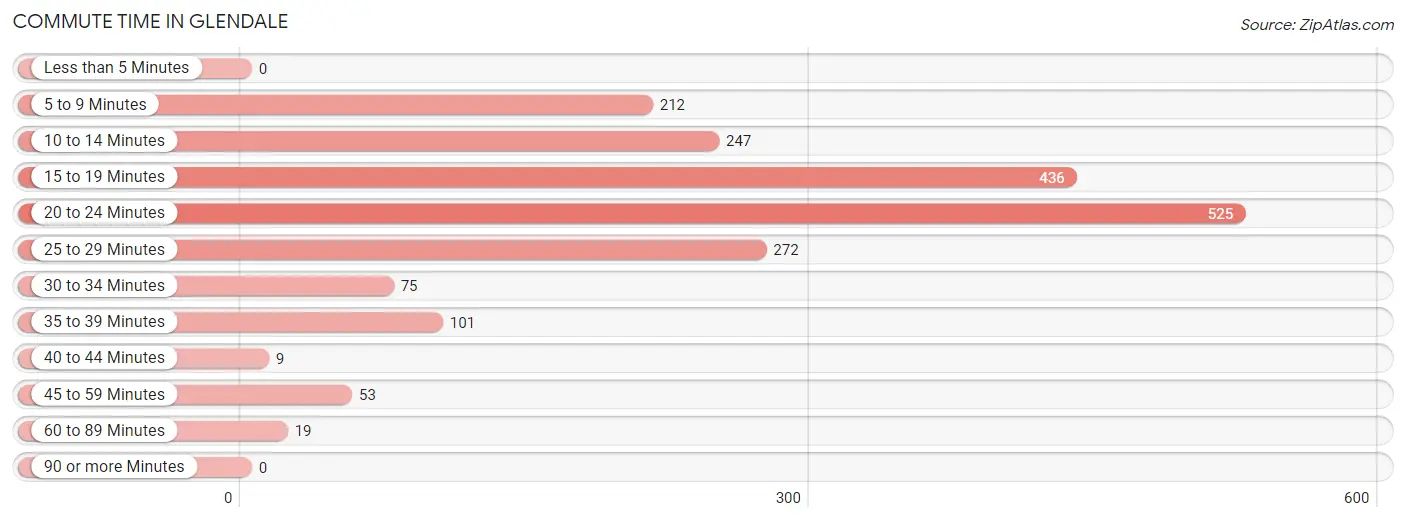
| Commute Time | # Commuters | % Commuters |
| Less than 5 Minutes | 0 | 0.0% |
| 5 to 9 Minutes | 212 | 10.9% |
| 10 to 14 Minutes | 247 | 12.7% |
| 15 to 19 Minutes | 436 | 22.4% |
| 20 to 24 Minutes | 525 | 26.9% |
| 25 to 29 Minutes | 272 | 14.0% |
| 30 to 34 Minutes | 75 | 3.8% |
| 35 to 39 Minutes | 101 | 5.2% |
| 40 to 44 Minutes | 9 | 0.5% |
| 45 to 59 Minutes | 53 | 2.7% |
| 60 to 89 Minutes | 19 | 1.0% |
| 90 or more Minutes | 0 | 0.0% |
Commute Time by Sex in Glendale
The most common commute times in Glendale are 20 to 24 minutes (284 commuters, 25.9%) for males and 20 to 24 minutes (241 commuters, 28.2%) for females.
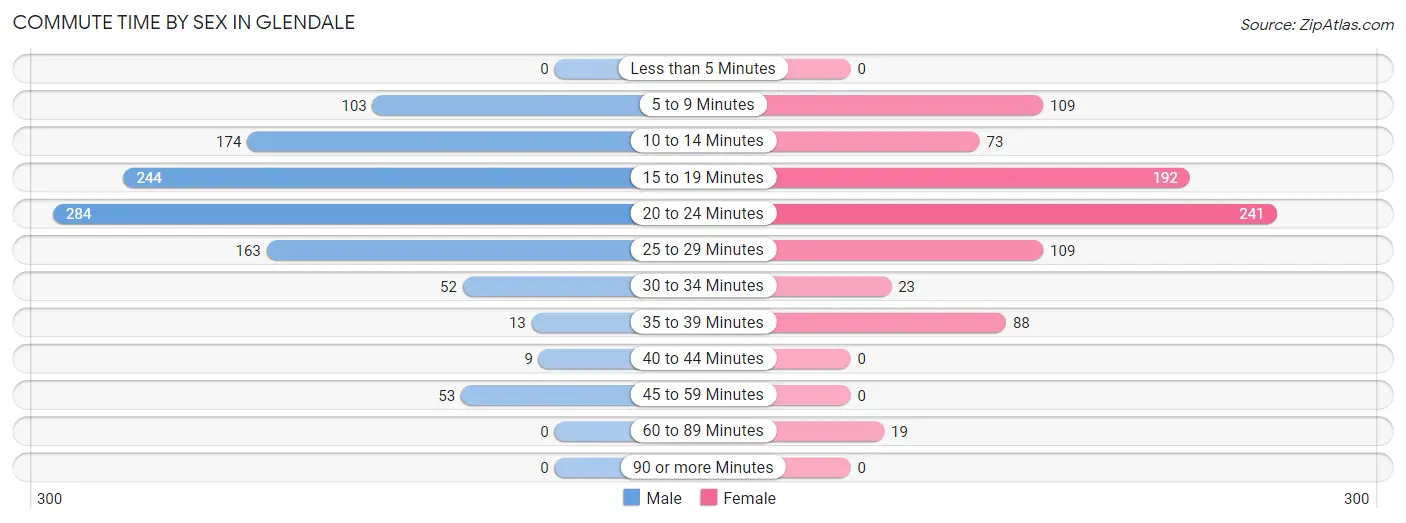
| Commute Time | Male | Female |
| Less than 5 Minutes | 0 (0.0%) | 0 (0.0%) |
| 5 to 9 Minutes | 103 (9.4%) | 109 (12.8%) |
| 10 to 14 Minutes | 174 (15.9%) | 73 (8.6%) |
| 15 to 19 Minutes | 244 (22.3%) | 192 (22.5%) |
| 20 to 24 Minutes | 284 (25.9%) | 241 (28.2%) |
| 25 to 29 Minutes | 163 (14.9%) | 109 (12.8%) |
| 30 to 34 Minutes | 52 (4.8%) | 23 (2.7%) |
| 35 to 39 Minutes | 13 (1.2%) | 88 (10.3%) |
| 40 to 44 Minutes | 9 (0.8%) | 0 (0.0%) |
| 45 to 59 Minutes | 53 (4.8%) | 0 (0.0%) |
| 60 to 89 Minutes | 0 (0.0%) | 19 (2.2%) |
| 90 or more Minutes | 0 (0.0%) | 0 (0.0%) |
Time of Departure to Work by Sex in Glendale
The most frequent times of departure to work in Glendale are 7:00 AM to 7:29 AM (382, 34.9%) for males and 7:30 AM to 7:59 AM (298, 34.9%) for females.
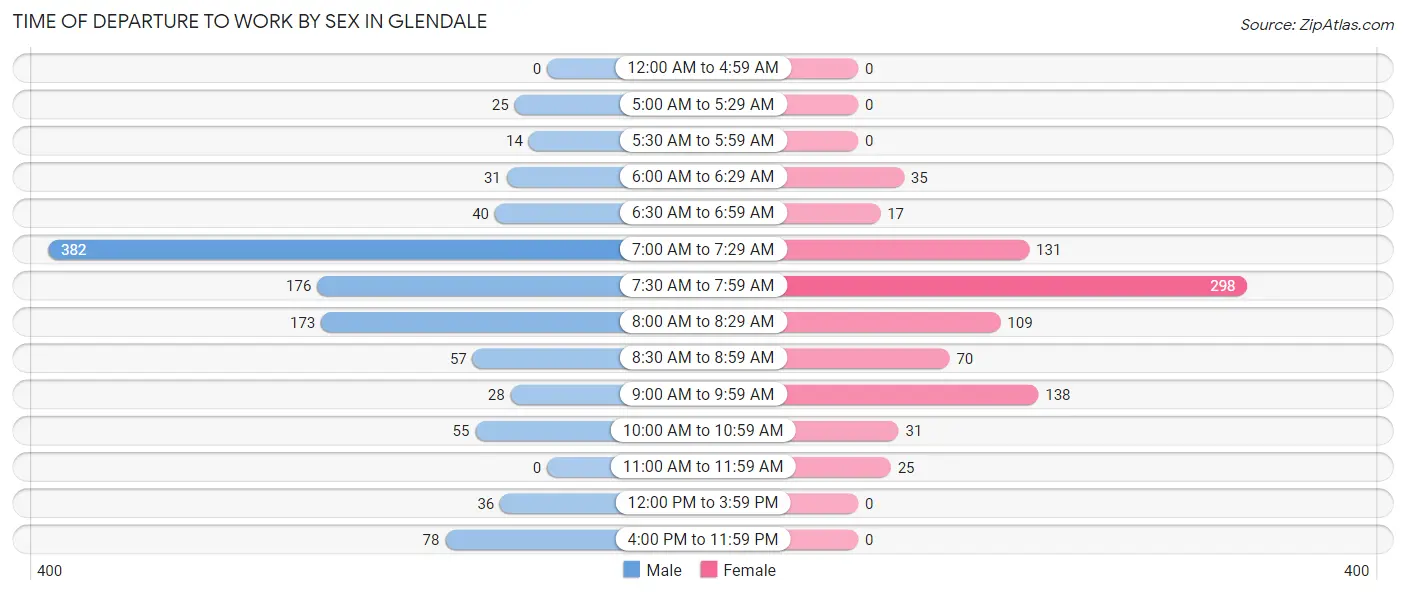
| Time of Departure | Male | Female |
| 12:00 AM to 4:59 AM | 0 (0.0%) | 0 (0.0%) |
| 5:00 AM to 5:29 AM | 25 (2.3%) | 0 (0.0%) |
| 5:30 AM to 5:59 AM | 14 (1.3%) | 0 (0.0%) |
| 6:00 AM to 6:29 AM | 31 (2.8%) | 35 (4.1%) |
| 6:30 AM to 6:59 AM | 40 (3.6%) | 17 (2.0%) |
| 7:00 AM to 7:29 AM | 382 (34.9%) | 131 (15.3%) |
| 7:30 AM to 7:59 AM | 176 (16.1%) | 298 (34.9%) |
| 8:00 AM to 8:29 AM | 173 (15.8%) | 109 (12.8%) |
| 8:30 AM to 8:59 AM | 57 (5.2%) | 70 (8.2%) |
| 9:00 AM to 9:59 AM | 28 (2.6%) | 138 (16.2%) |
| 10:00 AM to 10:59 AM | 55 (5.0%) | 31 (3.6%) |
| 11:00 AM to 11:59 AM | 0 (0.0%) | 25 (2.9%) |
| 12:00 PM to 3:59 PM | 36 (3.3%) | 0 (0.0%) |
| 4:00 PM to 11:59 PM | 78 (7.1%) | 0 (0.0%) |
| Total | 1,095 (100.0%) | 854 (100.0%) |
Housing Occupancy in Glendale
Occupancy by Ownership in Glendale
Of the total 2,239 dwellings in Glendale, owner-occupied units account for 2,169 (96.9%), while renter-occupied units make up 70 (3.1%).
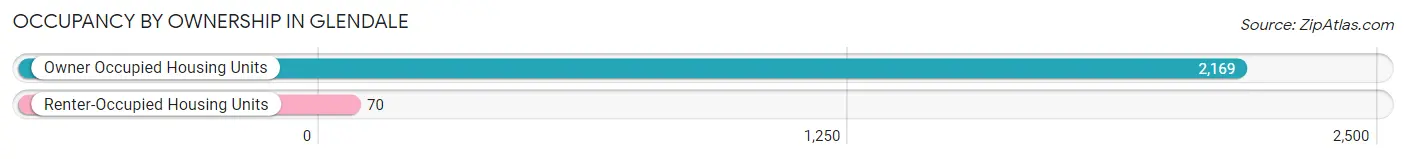
| Occupancy | # Housing Units | % Housing Units |
| Owner Occupied Housing Units | 2,169 | 96.9% |
| Renter-Occupied Housing Units | 70 | 3.1% |
| Total Occupied Housing Units | 2,239 | 100.0% |
Occupancy by Household Size in Glendale
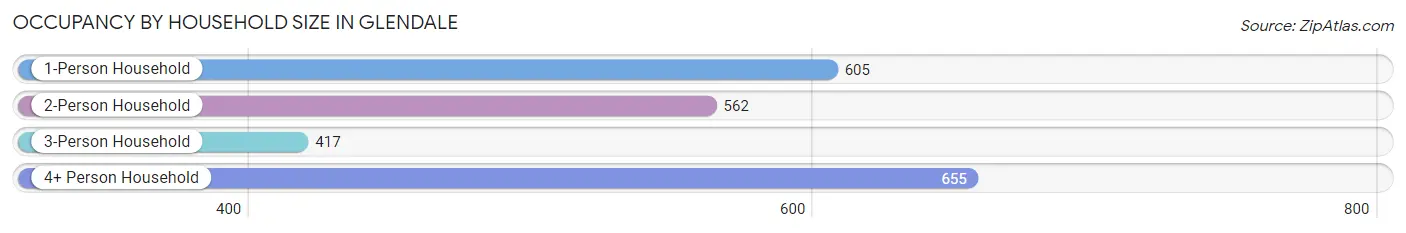
| Household Size | # Housing Units | % Housing Units |
| 1-Person Household | 605 | 27.0% |
| 2-Person Household | 562 | 25.1% |
| 3-Person Household | 417 | 18.6% |
| 4+ Person Household | 655 | 29.2% |
| Total Housing Units | 2,239 | 100.0% |
Occupancy by Ownership by Household Size in Glendale
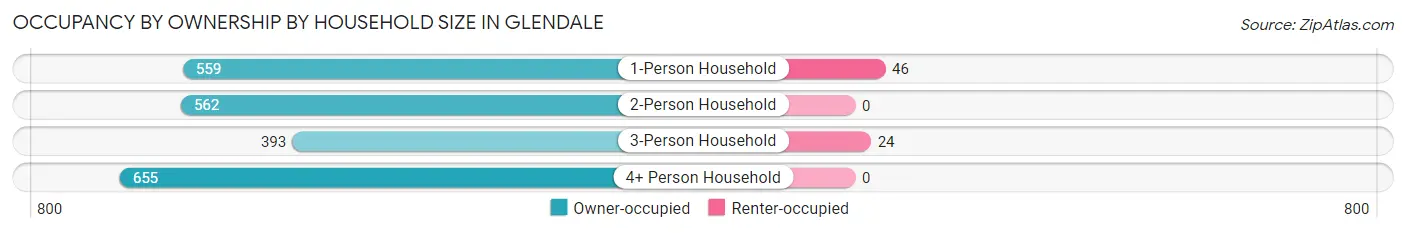
| Household Size | Owner-occupied | Renter-occupied |
| 1-Person Household | 559 (92.4%) | 46 (7.6%) |
| 2-Person Household | 562 (100.0%) | 0 (0.0%) |
| 3-Person Household | 393 (94.2%) | 24 (5.8%) |
| 4+ Person Household | 655 (100.0%) | 0 (0.0%) |
| Total Housing Units | 2,169 (96.9%) | 70 (3.1%) |
Occupancy by Educational Attainment in Glendale
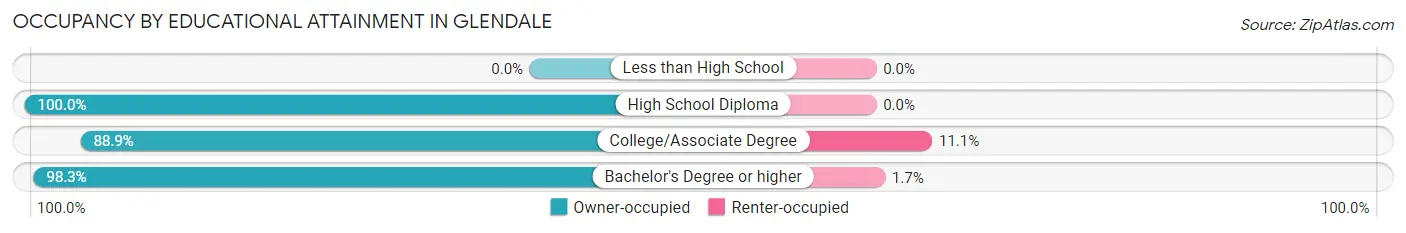
| Household Size | Owner-occupied | Renter-occupied |
| Less than High School | 0 (0.0%) | 0 (0.0%) |
| High School Diploma | 59 (100.0%) | 0 (0.0%) |
| College/Associate Degree | 305 (88.9%) | 38 (11.1%) |
| Bachelor's Degree or higher | 1,805 (98.3%) | 32 (1.7%) |
Occupancy by Age of Householder in Glendale
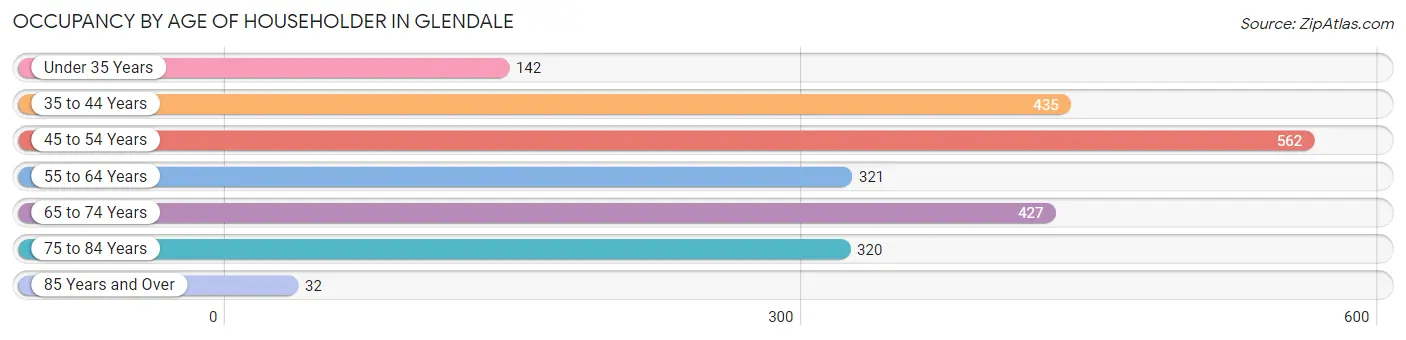
| Age Bracket | # Households | % Households |
| Under 35 Years | 142 | 6.3% |
| 35 to 44 Years | 435 | 19.4% |
| 45 to 54 Years | 562 | 25.1% |
| 55 to 64 Years | 321 | 14.3% |
| 65 to 74 Years | 427 | 19.1% |
| 75 to 84 Years | 320 | 14.3% |
| 85 Years and Over | 32 | 1.4% |
| Total | 2,239 | 100.0% |
Housing Finances in Glendale
Median Income by Occupancy in Glendale
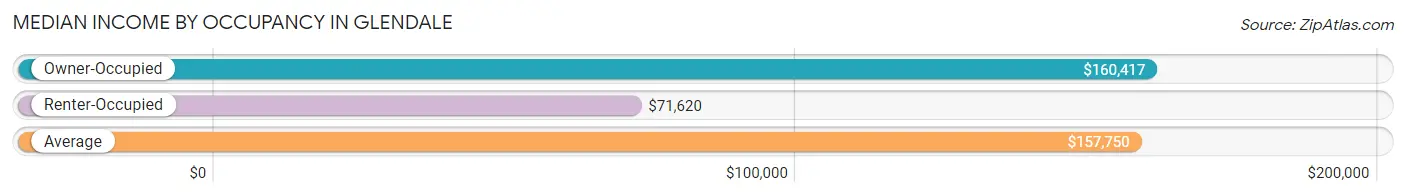
| Occupancy Type | # Households | Median Income |
| Owner-Occupied | 2,169 (96.9%) | $160,417 |
| Renter-Occupied | 70 (3.1%) | $71,620 |
| Average | 2,239 (100.0%) | $157,750 |
Occupancy by Householder Income Bracket in Glendale
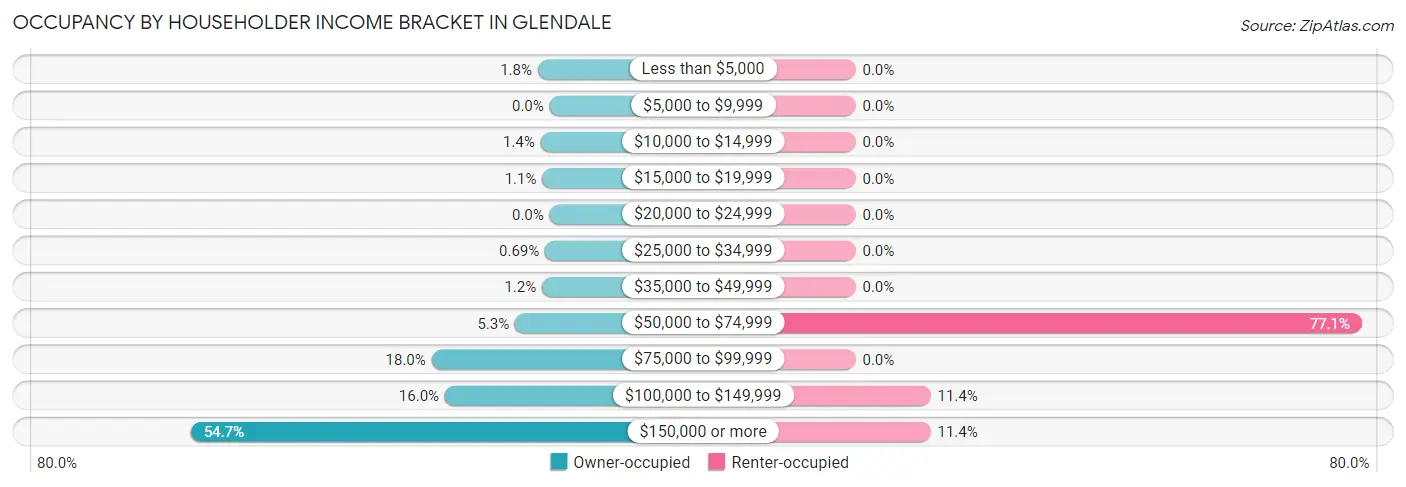
| Income Bracket | Owner-occupied | Renter-occupied |
| Less than $5,000 | 39 (1.8%) | 0 (0.0%) |
| $5,000 to $9,999 | 0 (0.0%) | 0 (0.0%) |
| $10,000 to $14,999 | 30 (1.4%) | 0 (0.0%) |
| $15,000 to $19,999 | 24 (1.1%) | 0 (0.0%) |
| $20,000 to $24,999 | 0 (0.0%) | 0 (0.0%) |
| $25,000 to $34,999 | 15 (0.7%) | 0 (0.0%) |
| $35,000 to $49,999 | 25 (1.1%) | 0 (0.0%) |
| $50,000 to $74,999 | 114 (5.3%) | 54 (77.1%) |
| $75,000 to $99,999 | 390 (18.0%) | 0 (0.0%) |
| $100,000 to $149,999 | 346 (16.0%) | 8 (11.4%) |
| $150,000 or more | 1,186 (54.7%) | 8 (11.4%) |
| Total | 2,169 (100.0%) | 70 (100.0%) |
Monthly Housing Cost Tiers in Glendale
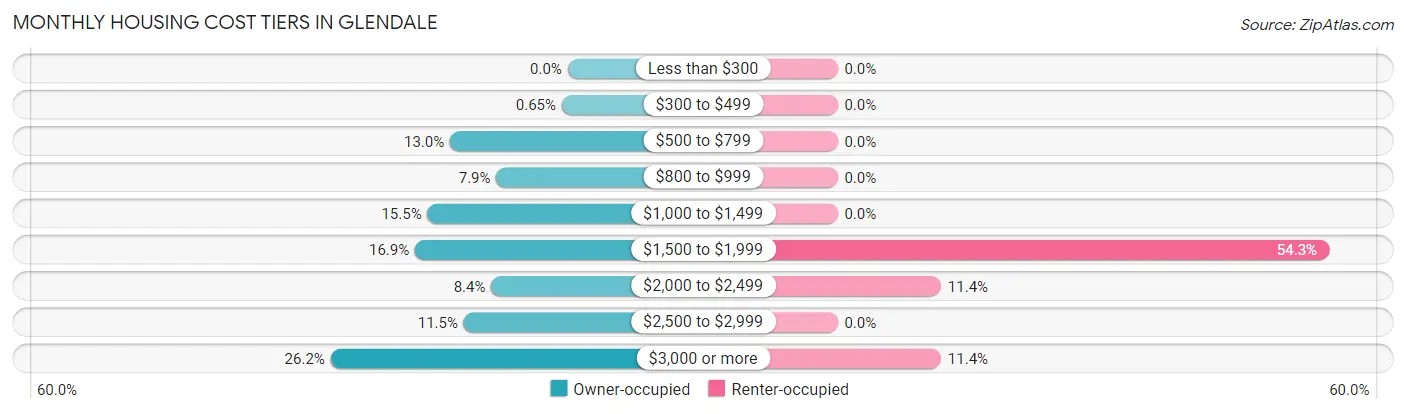
| Monthly Cost | Owner-occupied | Renter-occupied |
| Less than $300 | 0 (0.0%) | 0 (0.0%) |
| $300 to $499 | 14 (0.6%) | 0 (0.0%) |
| $500 to $799 | 282 (13.0%) | 0 (0.0%) |
| $800 to $999 | 171 (7.9%) | 0 (0.0%) |
| $1,000 to $1,499 | 336 (15.5%) | 0 (0.0%) |
| $1,500 to $1,999 | 366 (16.9%) | 38 (54.3%) |
| $2,000 to $2,499 | 183 (8.4%) | 8 (11.4%) |
| $2,500 to $2,999 | 249 (11.5%) | 0 (0.0%) |
| $3,000 or more | 568 (26.2%) | 8 (11.4%) |
| Total | 2,169 (100.0%) | 70 (100.0%) |
Physical Housing Characteristics in Glendale
Housing Structures in Glendale
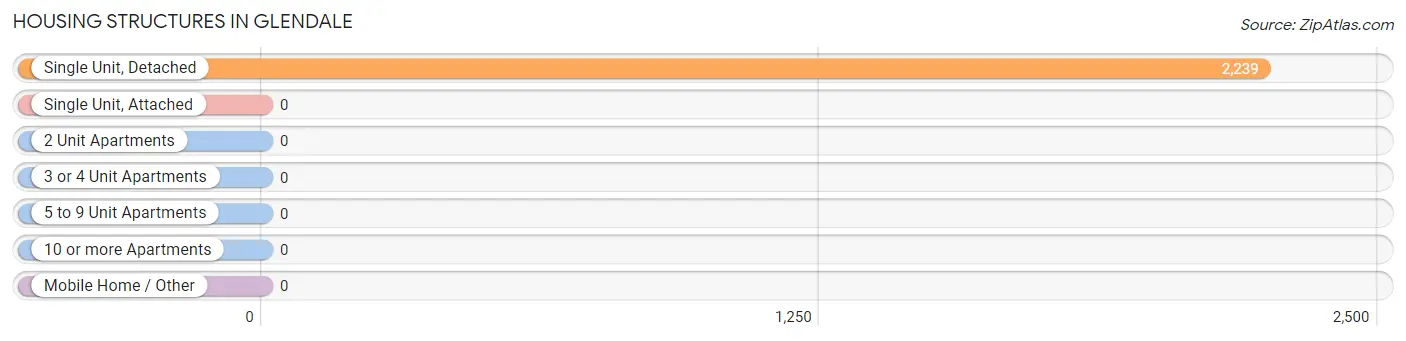
| Structure Type | # Housing Units | % Housing Units |
| Single Unit, Detached | 2,239 | 100.0% |
| Single Unit, Attached | 0 | 0.0% |
| 2 Unit Apartments | 0 | 0.0% |
| 3 or 4 Unit Apartments | 0 | 0.0% |
| 5 to 9 Unit Apartments | 0 | 0.0% |
| 10 or more Apartments | 0 | 0.0% |
| Mobile Home / Other | 0 | 0.0% |
| Total | 2,239 | 100.0% |
Housing Structures by Occupancy in Glendale
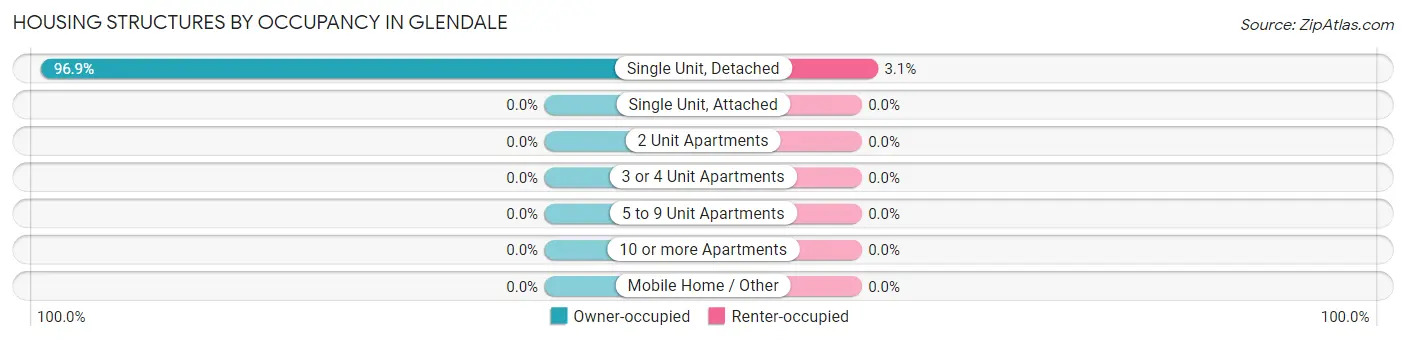
| Structure Type | Owner-occupied | Renter-occupied |
| Single Unit, Detached | 2,169 (96.9%) | 70 (3.1%) |
| Single Unit, Attached | 0 (0.0%) | 0 (0.0%) |
| 2 Unit Apartments | 0 (0.0%) | 0 (0.0%) |
| 3 or 4 Unit Apartments | 0 (0.0%) | 0 (0.0%) |
| 5 to 9 Unit Apartments | 0 (0.0%) | 0 (0.0%) |
| 10 or more Apartments | 0 (0.0%) | 0 (0.0%) |
| Mobile Home / Other | 0 (0.0%) | 0 (0.0%) |
| Total | 2,169 (96.9%) | 70 (3.1%) |
Housing Structures by Number of Rooms in Glendale
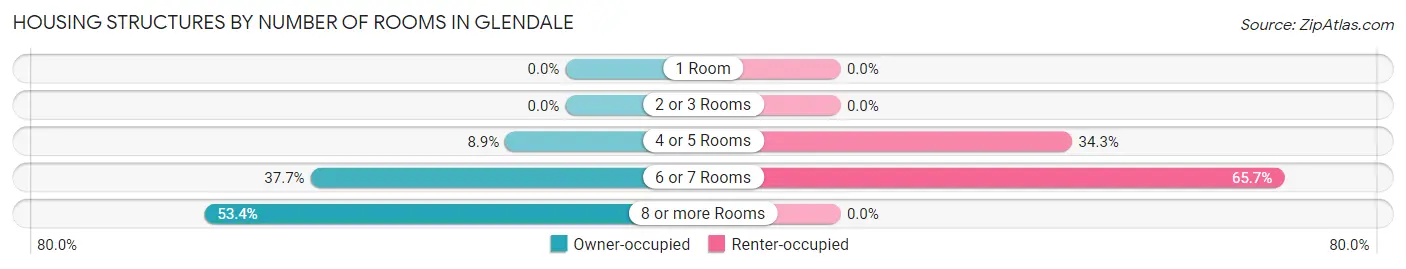
| Number of Rooms | Owner-occupied | Renter-occupied |
| 1 Room | 0 (0.0%) | 0 (0.0%) |
| 2 or 3 Rooms | 0 (0.0%) | 0 (0.0%) |
| 4 or 5 Rooms | 193 (8.9%) | 24 (34.3%) |
| 6 or 7 Rooms | 818 (37.7%) | 46 (65.7%) |
| 8 or more Rooms | 1,158 (53.4%) | 0 (0.0%) |
| Total | 2,169 (100.0%) | 70 (100.0%) |
Housing Structure by Heating Type in Glendale
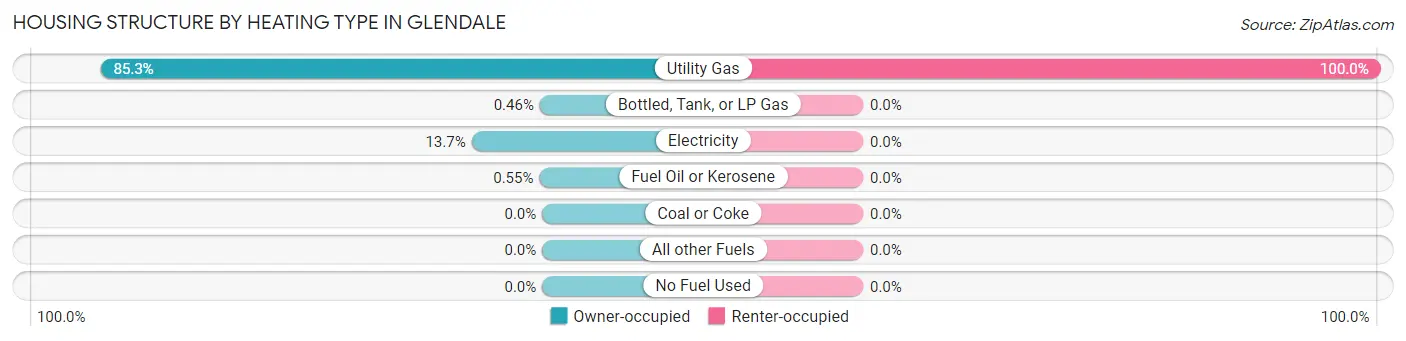
| Heating Type | Owner-occupied | Renter-occupied |
| Utility Gas | 1,851 (85.3%) | 70 (100.0%) |
| Bottled, Tank, or LP Gas | 10 (0.5%) | 0 (0.0%) |
| Electricity | 296 (13.7%) | 0 (0.0%) |
| Fuel Oil or Kerosene | 12 (0.5%) | 0 (0.0%) |
| Coal or Coke | 0 (0.0%) | 0 (0.0%) |
| All other Fuels | 0 (0.0%) | 0 (0.0%) |
| No Fuel Used | 0 (0.0%) | 0 (0.0%) |
| Total | 2,169 (100.0%) | 70 (100.0%) |
Household Vehicle Usage in Glendale
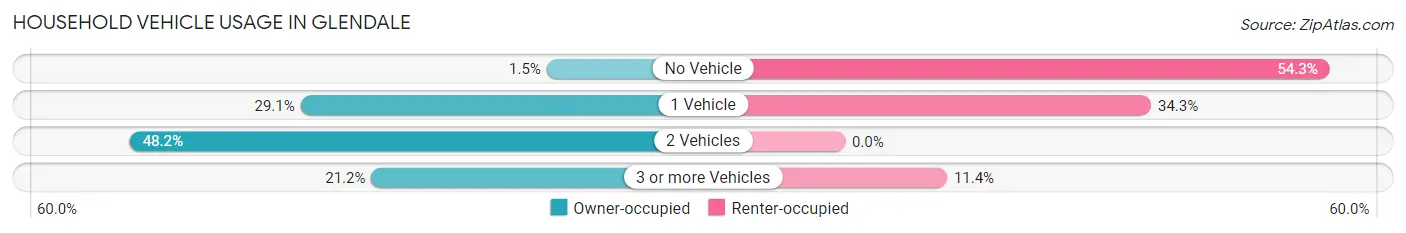
| Vehicles per Household | Owner-occupied | Renter-occupied |
| No Vehicle | 33 (1.5%) | 38 (54.3%) |
| 1 Vehicle | 631 (29.1%) | 24 (34.3%) |
| 2 Vehicles | 1,046 (48.2%) | 0 (0.0%) |
| 3 or more Vehicles | 459 (21.2%) | 8 (11.4%) |
| Total | 2,169 (100.0%) | 70 (100.0%) |
Real Estate & Mortgages in Glendale
Real Estate and Mortgage Overview in Glendale
| Characteristic | Without Mortgage | With Mortgage |
| Housing Units | 672 | 1,497 |
| Median Property Value | $396,700 | $515,400 |
| Median Household Income | $90,901 | $1,041 |
| Monthly Housing Costs | $905 | $568 |
| Real Estate Taxes | $5,235 | $0 |
Property Value by Mortgage Status in Glendale
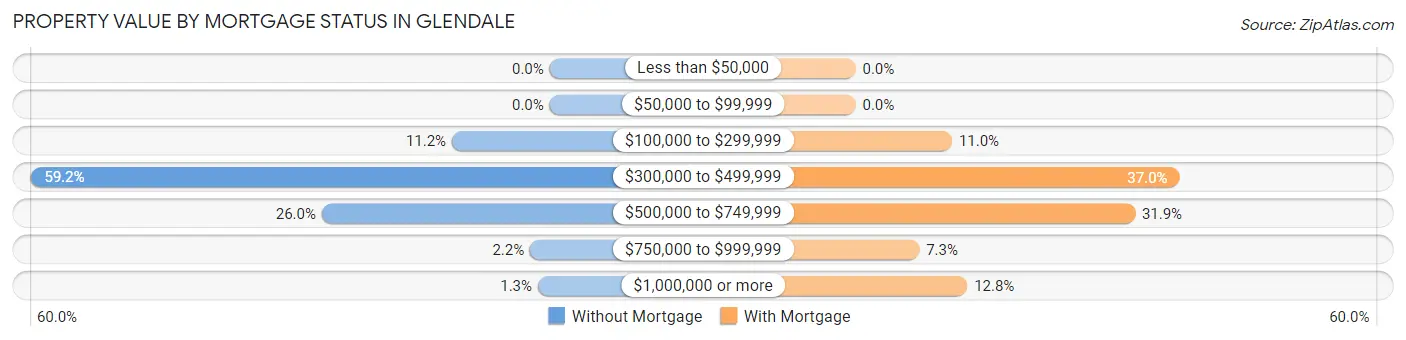
| Property Value | Without Mortgage | With Mortgage |
| Less than $50,000 | 0 (0.0%) | 0 (0.0%) |
| $50,000 to $99,999 | 0 (0.0%) | 0 (0.0%) |
| $100,000 to $299,999 | 75 (11.2%) | 165 (11.0%) |
| $300,000 to $499,999 | 398 (59.2%) | 554 (37.0%) |
| $500,000 to $749,999 | 175 (26.0%) | 478 (31.9%) |
| $750,000 to $999,999 | 15 (2.2%) | 109 (7.3%) |
| $1,000,000 or more | 9 (1.3%) | 191 (12.8%) |
| Total | 672 (100.0%) | 1,497 (100.0%) |
Household Income by Mortgage Status in Glendale
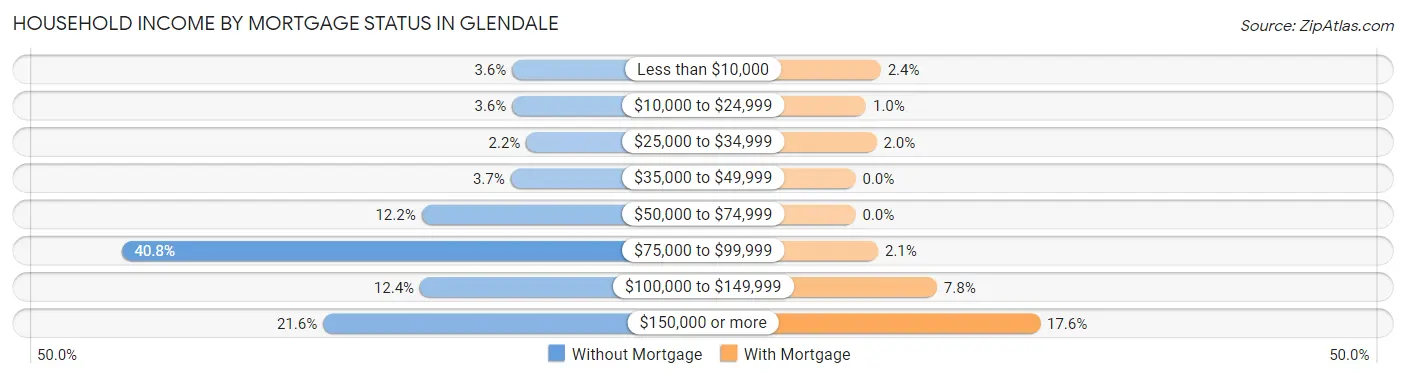
| Household Income | Without Mortgage | With Mortgage |
| Less than $10,000 | 24 (3.6%) | 36 (2.4%) |
| $10,000 to $24,999 | 24 (3.6%) | 15 (1.0%) |
| $25,000 to $34,999 | 15 (2.2%) | 30 (2.0%) |
| $35,000 to $49,999 | 25 (3.7%) | 0 (0.0%) |
| $50,000 to $74,999 | 82 (12.2%) | 0 (0.0%) |
| $75,000 to $99,999 | 274 (40.8%) | 32 (2.1%) |
| $100,000 to $149,999 | 83 (12.3%) | 116 (7.7%) |
| $150,000 or more | 145 (21.6%) | 263 (17.6%) |
| Total | 672 (100.0%) | 1,497 (100.0%) |
Property Value to Household Income Ratio in Glendale
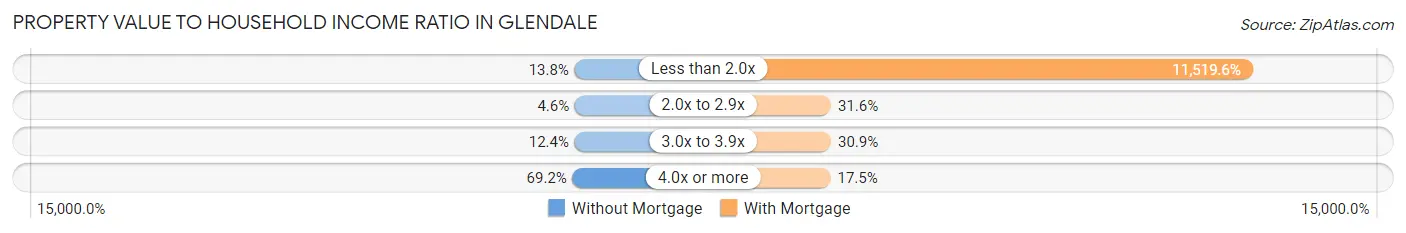
| Value-to-Income Ratio | Without Mortgage | With Mortgage |
| Less than 2.0x | 93 (13.8%) | 172,449 (11,519.6%) |
| 2.0x to 2.9x | 31 (4.6%) | 473 (31.6%) |
| 3.0x to 3.9x | 83 (12.3%) | 463 (30.9%) |
| 4.0x or more | 465 (69.2%) | 262 (17.5%) |
| Total | 672 (100.0%) | 1,497 (100.0%) |
Real Estate Taxes by Mortgage Status in Glendale
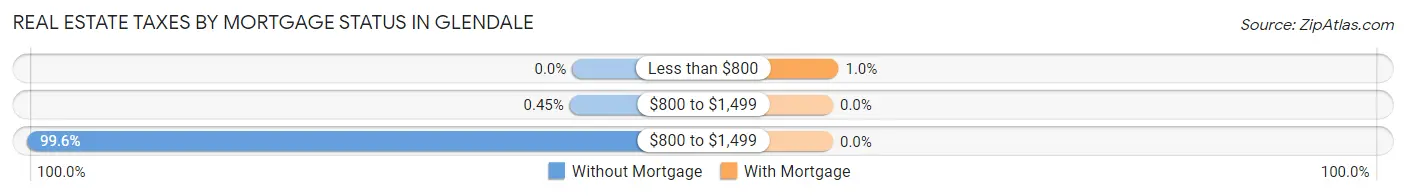
| Property Taxes | Without Mortgage | With Mortgage |
| Less than $800 | 0 (0.0%) | 15 (1.0%) |
| $800 to $1,499 | 3 (0.4%) | 0 (0.0%) |
| $800 to $1,499 | 669 (99.6%) | 0 (0.0%) |
| Total | 672 (100.0%) | 1,497 (100.0%) |
Health & Disability in Glendale
Health Insurance Coverage by Age in Glendale
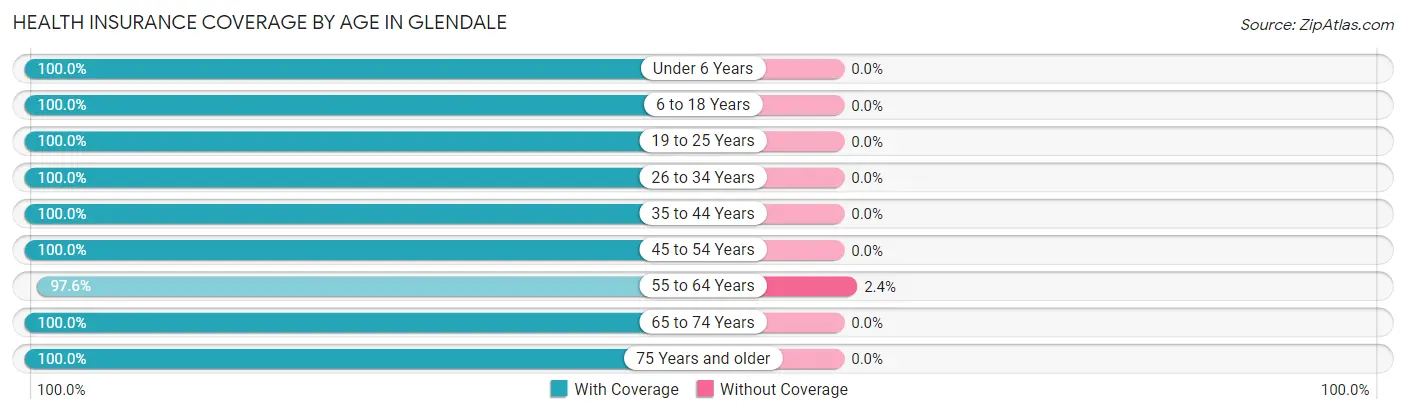
| Age Bracket | With Coverage | Without Coverage |
| Under 6 Years | 556 (100.0%) | 0 (0.0%) |
| 6 to 18 Years | 1,322 (100.0%) | 0 (0.0%) |
| 19 to 25 Years | 480 (100.0%) | 0 (0.0%) |
| 26 to 34 Years | 265 (100.0%) | 0 (0.0%) |
| 35 to 44 Years | 837 (100.0%) | 0 (0.0%) |
| 45 to 54 Years | 932 (100.0%) | 0 (0.0%) |
| 55 to 64 Years | 568 (97.6%) | 14 (2.4%) |
| 65 to 74 Years | 730 (100.0%) | 0 (0.0%) |
| 75 Years and older | 427 (100.0%) | 0 (0.0%) |
| Total | 6,117 (99.8%) | 14 (0.2%) |
Health Insurance Coverage by Citizenship Status in Glendale
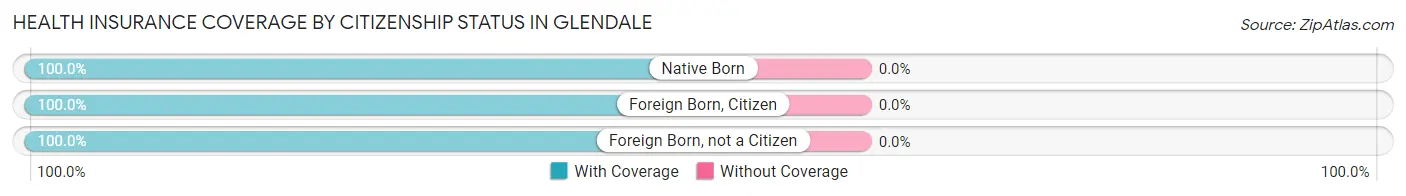
| Citizenship Status | With Coverage | Without Coverage |
| Native Born | 556 (100.0%) | 0 (0.0%) |
| Foreign Born, Citizen | 1,322 (100.0%) | 0 (0.0%) |
| Foreign Born, not a Citizen | 480 (100.0%) | 0 (0.0%) |
Health Insurance Coverage by Household Income in Glendale
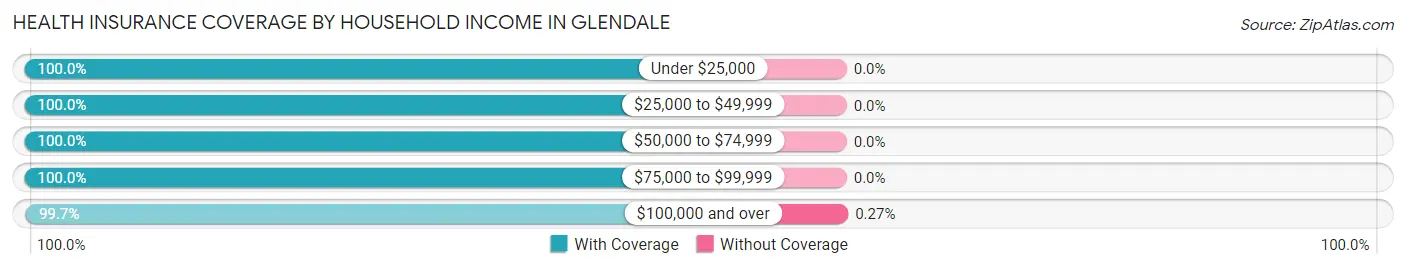
| Household Income | With Coverage | Without Coverage |
| Under $25,000 | 150 (100.0%) | 0 (0.0%) |
| $25,000 to $49,999 | 46 (100.0%) | 0 (0.0%) |
| $50,000 to $74,999 | 231 (100.0%) | 0 (0.0%) |
| $75,000 to $99,999 | 556 (100.0%) | 0 (0.0%) |
| $100,000 and over | 5,134 (99.7%) | 14 (0.3%) |
Public vs Private Health Insurance Coverage by Age in Glendale
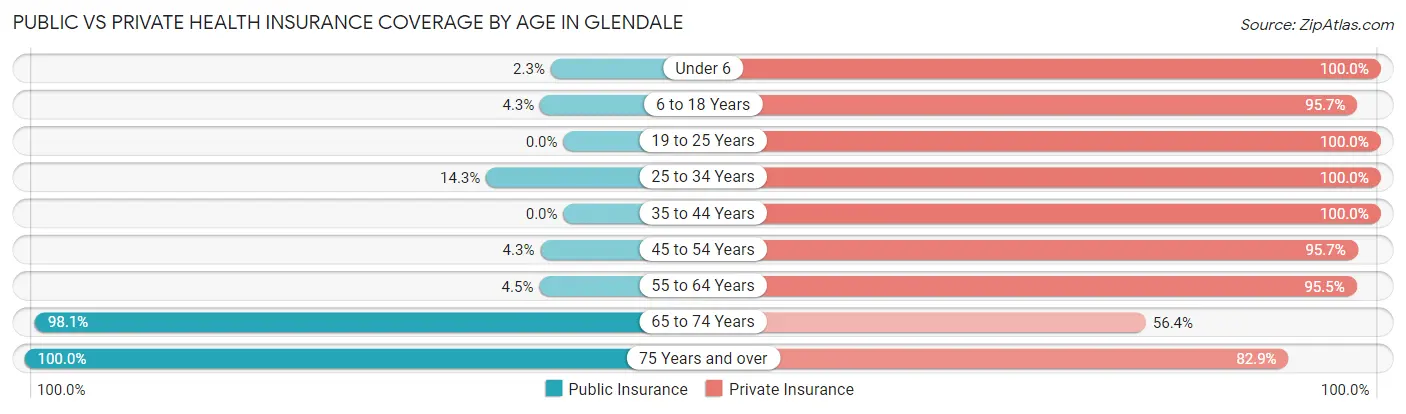
| Age Bracket | Public Insurance | Private Insurance |
| Under 6 | 13 (2.3%) | 556 (100.0%) |
| 6 to 18 Years | 57 (4.3%) | 1,265 (95.7%) |
| 19 to 25 Years | 0 (0.0%) | 480 (100.0%) |
| 25 to 34 Years | 38 (14.3%) | 265 (100.0%) |
| 35 to 44 Years | 0 (0.0%) | 837 (100.0%) |
| 45 to 54 Years | 40 (4.3%) | 892 (95.7%) |
| 55 to 64 Years | 26 (4.5%) | 556 (95.5%) |
| 65 to 74 Years | 716 (98.1%) | 412 (56.4%) |
| 75 Years and over | 427 (100.0%) | 354 (82.9%) |
| Total | 1,317 (21.5%) | 5,617 (91.6%) |
Disability Status by Sex by Age in Glendale
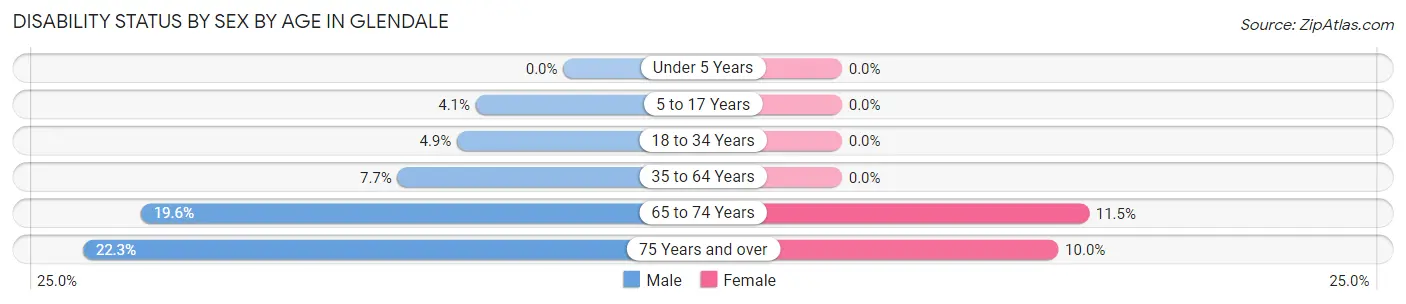
| Age Bracket | Male | Female |
| Under 5 Years | 0 (0.0%) | 0 (0.0%) |
| 5 to 17 Years | 23 (4.1%) | 0 (0.0%) |
| 18 to 34 Years | 22 (4.9%) | 0 (0.0%) |
| 35 to 64 Years | 85 (7.7%) | 0 (0.0%) |
| 65 to 74 Years | 61 (19.6%) | 48 (11.5%) |
| 75 Years and over | 33 (22.3%) | 28 (10.0%) |
Disability Class by Sex by Age in Glendale
Disability Class: Hearing Difficulty
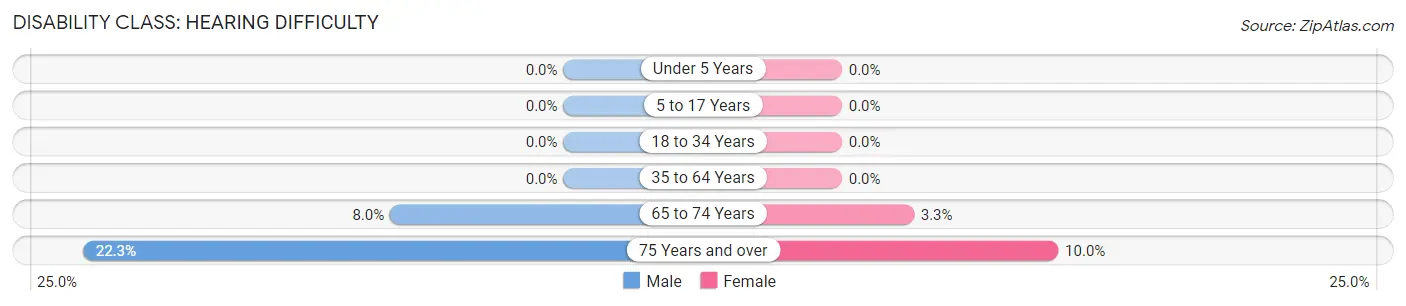
| Age Bracket | Male | Female |
| Under 5 Years | 0 (0.0%) | 0 (0.0%) |
| 5 to 17 Years | 0 (0.0%) | 0 (0.0%) |
| 18 to 34 Years | 0 (0.0%) | 0 (0.0%) |
| 35 to 64 Years | 0 (0.0%) | 0 (0.0%) |
| 65 to 74 Years | 25 (8.0%) | 14 (3.3%) |
| 75 Years and over | 33 (22.3%) | 28 (10.0%) |
Disability Class: Vision Difficulty
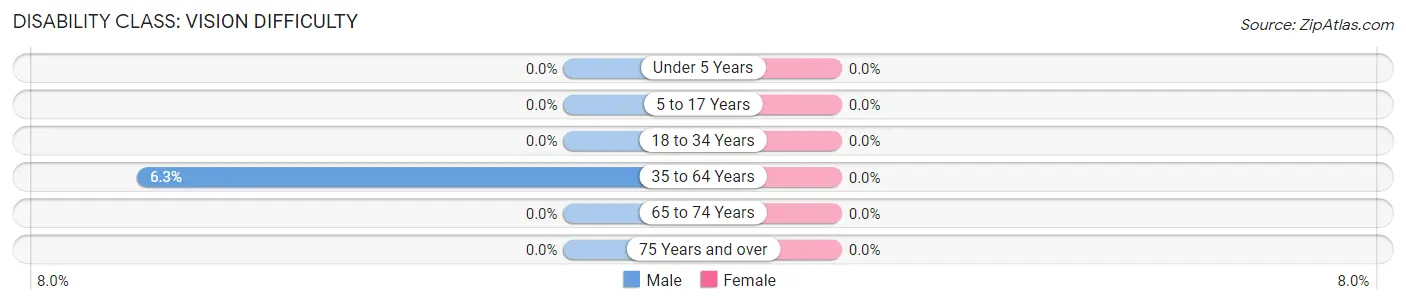
| Age Bracket | Male | Female |
| Under 5 Years | 0 (0.0%) | 0 (0.0%) |
| 5 to 17 Years | 0 (0.0%) | 0 (0.0%) |
| 18 to 34 Years | 0 (0.0%) | 0 (0.0%) |
| 35 to 64 Years | 70 (6.3%) | 0 (0.0%) |
| 65 to 74 Years | 0 (0.0%) | 0 (0.0%) |
| 75 Years and over | 0 (0.0%) | 0 (0.0%) |
Disability Class: Cognitive Difficulty
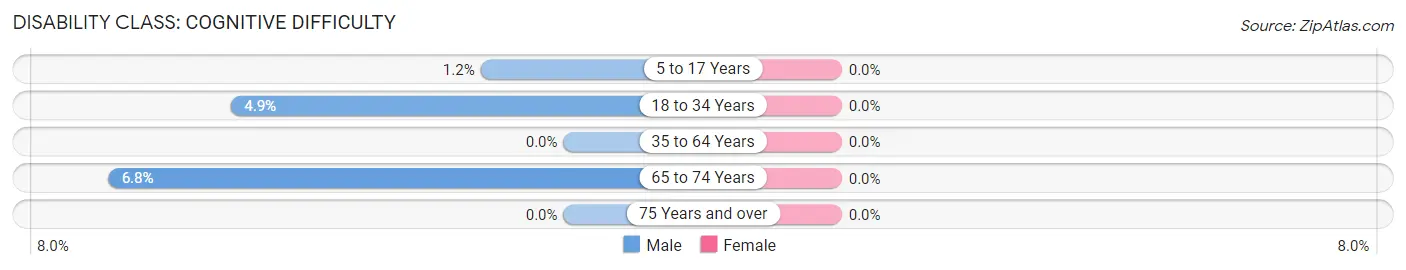
| Age Bracket | Male | Female |
| 5 to 17 Years | 7 (1.2%) | 0 (0.0%) |
| 18 to 34 Years | 22 (4.9%) | 0 (0.0%) |
| 35 to 64 Years | 0 (0.0%) | 0 (0.0%) |
| 65 to 74 Years | 21 (6.8%) | 0 (0.0%) |
| 75 Years and over | 0 (0.0%) | 0 (0.0%) |
Disability Class: Ambulatory Difficulty
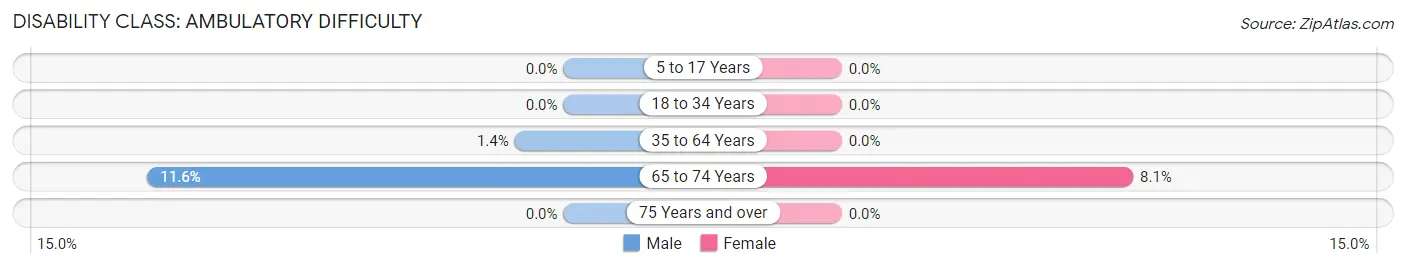
| Age Bracket | Male | Female |
| 5 to 17 Years | 0 (0.0%) | 0 (0.0%) |
| 18 to 34 Years | 0 (0.0%) | 0 (0.0%) |
| 35 to 64 Years | 15 (1.4%) | 0 (0.0%) |
| 65 to 74 Years | 36 (11.6%) | 34 (8.1%) |
| 75 Years and over | 0 (0.0%) | 0 (0.0%) |
Disability Class: Self-Care Difficulty
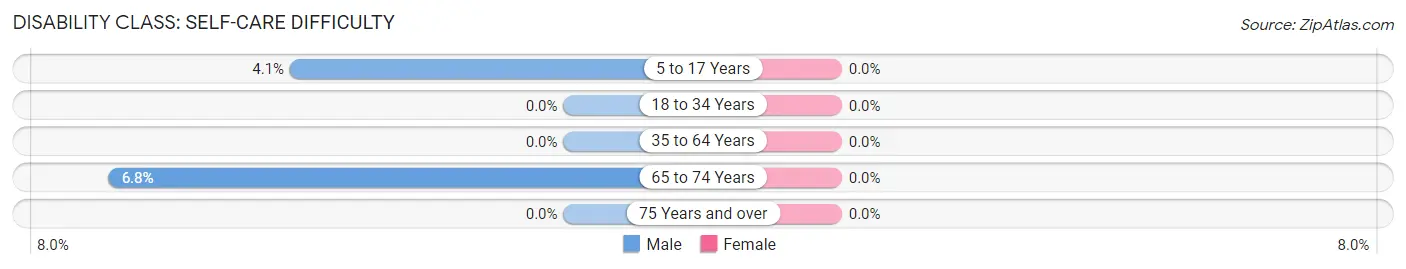
| Age Bracket | Male | Female |
| 5 to 17 Years | 23 (4.1%) | 0 (0.0%) |
| 18 to 34 Years | 0 (0.0%) | 0 (0.0%) |
| 35 to 64 Years | 0 (0.0%) | 0 (0.0%) |
| 65 to 74 Years | 21 (6.8%) | 0 (0.0%) |
| 75 Years and over | 0 (0.0%) | 0 (0.0%) |
Technology Access in Glendale
Computing Device Access in Glendale
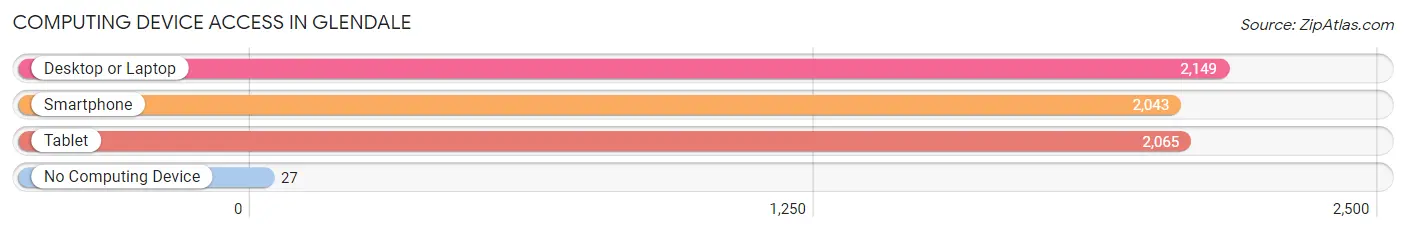
| Device Type | # Households | % Households |
| Desktop or Laptop | 2,149 | 96.0% |
| Smartphone | 2,043 | 91.2% |
| Tablet | 2,065 | 92.2% |
| No Computing Device | 27 | 1.2% |
| Total | 2,239 | 100.0% |
Internet Access in Glendale
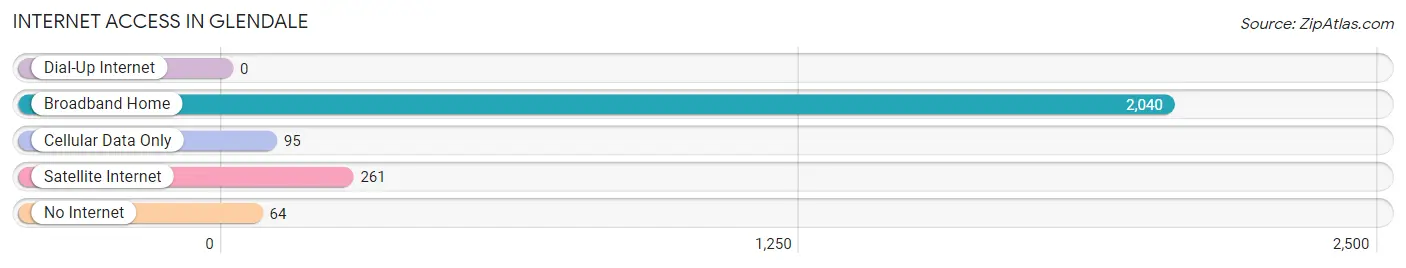
| Internet Type | # Households | % Households |
| Dial-Up Internet | 0 | 0.0% |
| Broadband Home | 2,040 | 91.1% |
| Cellular Data Only | 95 | 4.2% |
| Satellite Internet | 261 | 11.7% |
| No Internet | 64 | 2.9% |
| Total | 2,239 | 100.0% |
Glendale Summary
Glendale, Missouri is a small city located in St. Louis County, Missouri. It is situated in the northwest corner of the county, just south of the Missouri River. The city has a population of approximately 4,000 people and is part of the Greater St. Louis metropolitan area.
History
Glendale was founded in 1856 by a group of German immigrants who had recently arrived in the area. The city was named after the nearby Glendale Creek, which was named after the German word for “valley”. The city was incorporated in 1875 and has remained relatively unchanged since then.
Geography
Glendale is located in the northwest corner of St. Louis County, just south of the Missouri River. The city is bordered by the cities of St. Louis, Maryland Heights, and Overland. The city is situated on a plateau, with an elevation of approximately 500 feet above sea level. The city is located in the humid continental climate zone, with hot summers and cold winters.
Economy
Glendale’s economy is largely based on the service industry, with many businesses providing services to the surrounding area. The city is home to a variety of restaurants, retail stores, and other businesses. The city also has a number of manufacturing and industrial businesses, including a large printing company.
Demographics
As of the 2010 census, Glendale had a population of 4,000 people. The racial makeup of the city was 87.3% White, 8.2% African American, 0.7% Native American, 0.7% Asian, 0.2% Pacific Islander, and 2.1% from other races. The median household income was $45,000, and the median family income was $50,000.
Conclusion
Glendale, Missouri is a small city located in St. Louis County, Missouri. It is situated in the northwest corner of the county, just south of the Missouri River. The city has a population of approximately 4,000 people and is part of the Greater St. Louis metropolitan area. The city’s economy is largely based on the service industry, with many businesses providing services to the surrounding area. The city is home to a variety of restaurants, retail stores, and other businesses. The racial makeup of the city is 87.3% White, 8.2% African American, 0.7% Native American, 0.7% Asian, 0.2% Pacific Islander, and 2.1% from other races. The median household income was $45,000, and the median family income was $50,000. Glendale is a small city with a rich history and a diverse population.
Common Questions
What is Per Capita Income in Glendale?
Per Capita income in Glendale is $71,588.
What is the Median Family Income in Glendale?
Median Family Income in Glendale is $178,333.
What is the Median Household income in Glendale?
Median Household Income in Glendale is $157,750.
What is Income or Wage Gap in Glendale?
Income or Wage Gap in Glendale is 40.0%.
Women in Glendale earn 60.0 cents for every dollar earned by a man.
What is Inequality or Gini Index in Glendale?
Inequality or Gini Index in Glendale is 0.39.
What is the Total Population of Glendale?
Total Population of Glendale is 6,131.
What is the Total Male Population of Glendale?
Total Male Population of Glendale is 2,688.
What is the Total Female Population of Glendale?
Total Female Population of Glendale is 3,443.
What is the Ratio of Males per 100 Females in Glendale?
There are 78.07 Males per 100 Females in Glendale.
What is the Ratio of Females per 100 Males in Glendale?
There are 128.09 Females per 100 Males in Glendale.
What is the Median Population Age in Glendale?
Median Population Age in Glendale is 39.5 Years.
What is the Average Family Size in Glendale
Average Family Size in Glendale is 3.4 People.
What is the Average Household Size in Glendale
Average Household Size in Glendale is 2.7 People.
How Large is the Labor Force in Glendale?
There are 2,625 People in the Labor Forcein in Glendale.
What is the Percentage of People in the Labor Force in Glendale?
56.7% of People are in the Labor Force in Glendale.
What is the Unemployment Rate in Glendale?
Unemployment Rate in Glendale is 0.8%.