Leawood, MO Map & Demographics
Leawood Map
Leawood Overview
$52,958
PER CAPITA INCOME
$99,135
AVG FAMILY INCOME
$95,938
AVG HOUSEHOLD INCOME
29.5%
WAGE / INCOME GAP [ % ]
70.5¢/ $1
WAGE / INCOME GAP [ $ ]
0.51
INEQUALITY / GINI INDEX
692
TOTAL POPULATION
323
MALE POPULATION
369
FEMALE POPULATION
87.53
MALES / 100 FEMALES
114.24
FEMALES / 100 MALES
40.3
MEDIAN AGE
3.2
AVG FAMILY SIZE
2.6
AVG HOUSEHOLD SIZE
319
LABOR FORCE [ PEOPLE ]
61.8%
PERCENT IN LABOR FORCE
0.9%
UNEMPLOYMENT RATE
Income in Leawood
Income Overview in Leawood
Per Capita Income in Leawood is $52,958, while median incomes of families and households are $99,135 and $95,938 respectively.
| Characteristic | Number | Measure |
| Per Capita Income | 692 | $52,958 |
| Median Family Income | 187 | $99,135 |
| Mean Family Income | 187 | $163,664 |
| Median Household Income | 263 | $95,938 |
| Mean Household Income | 263 | $138,379 |
| Income Deficit | 187 | $0 |
| Wage / Income Gap (%) | 692 | 29.53% |
| Wage / Income Gap ($) | 692 | 70.47¢ per $1 |
| Gini / Inequality Index | 692 | 0.51 |
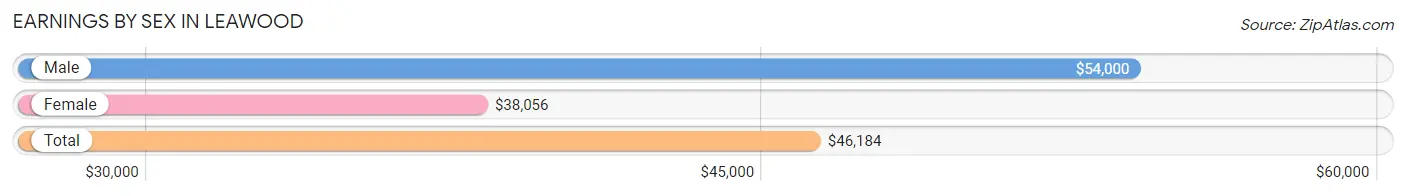
Earnings by Sex in Leawood
Average Earnings in Leawood are $46,184, $54,000 for men and $38,056 for women, a difference of 29.5%.
| Sex | Number | Average Earnings |
| Male | 168 (48.8%) | $54,000 |
| Female | 176 (51.2%) | $38,056 |
| Total | 344 (100.0%) | $46,184 |
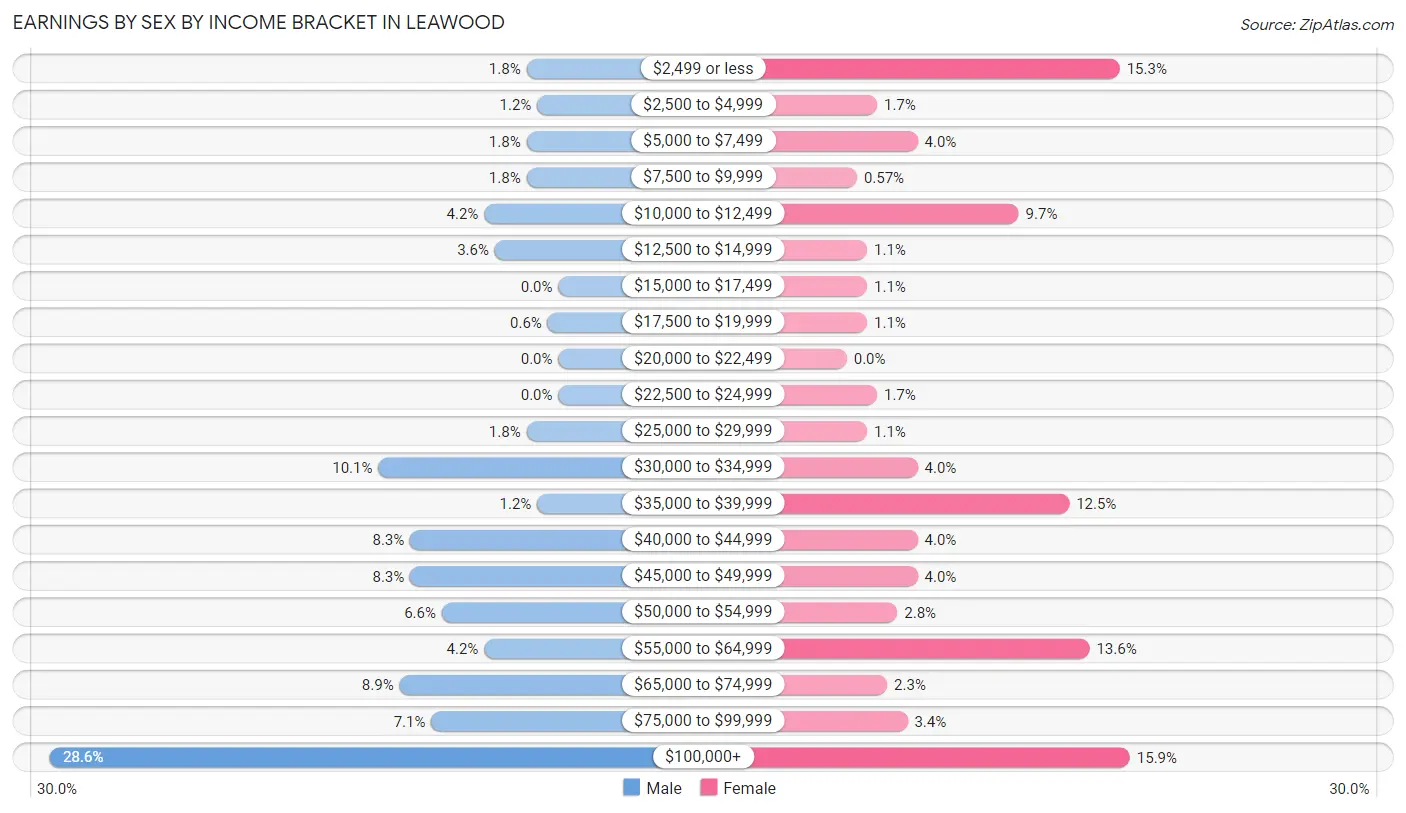
Earnings by Sex by Income Bracket in Leawood
The most common earnings brackets in Leawood are $100,000+ for men (48 | 28.6%) and $100,000+ for women (28 | 15.9%).
| Income | Male | Female |
| $2,499 or less | 3 (1.8%) | 27 (15.3%) |
| $2,500 to $4,999 | 2 (1.2%) | 3 (1.7%) |
| $5,000 to $7,499 | 3 (1.8%) | 7 (4.0%) |
| $7,500 to $9,999 | 3 (1.8%) | 1 (0.6%) |
| $10,000 to $12,499 | 7 (4.2%) | 17 (9.7%) |
| $12,500 to $14,999 | 6 (3.6%) | 2 (1.1%) |
| $15,000 to $17,499 | 0 (0.0%) | 2 (1.1%) |
| $17,500 to $19,999 | 1 (0.6%) | 2 (1.1%) |
| $20,000 to $22,499 | 0 (0.0%) | 0 (0.0%) |
| $22,500 to $24,999 | 0 (0.0%) | 3 (1.7%) |
| $25,000 to $29,999 | 3 (1.8%) | 2 (1.1%) |
| $30,000 to $34,999 | 17 (10.1%) | 7 (4.0%) |
| $35,000 to $39,999 | 2 (1.2%) | 22 (12.5%) |
| $40,000 to $44,999 | 14 (8.3%) | 7 (4.0%) |
| $45,000 to $49,999 | 14 (8.3%) | 7 (4.0%) |
| $50,000 to $54,999 | 11 (6.6%) | 5 (2.8%) |
| $55,000 to $64,999 | 7 (4.2%) | 24 (13.6%) |
| $65,000 to $74,999 | 15 (8.9%) | 4 (2.3%) |
| $75,000 to $99,999 | 12 (7.1%) | 6 (3.4%) |
| $100,000+ | 48 (28.6%) | 28 (15.9%) |
| Total | 168 (100.0%) | 176 (100.0%) |
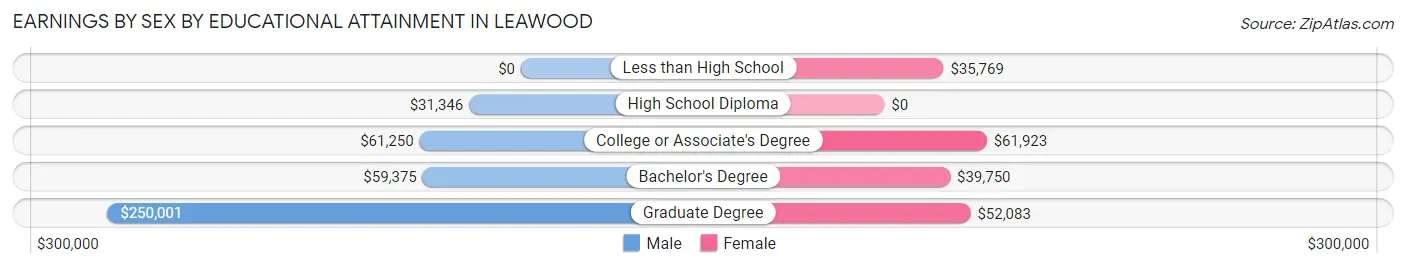
Earnings by Sex by Educational Attainment in Leawood
Average earnings in Leawood are $57,500 for men and $44,107 for women, a difference of 23.3%. Men with an educational attainment of graduate degree enjoy the highest average annual earnings of $250,001, while those with high school diploma education earn the least with $31,346. Women with an educational attainment of college or associate's degree earn the most with the average annual earnings of $61,923, while those with less than high school education have the smallest earnings of $35,769.
| Educational Attainment | Male Income | Female Income |
| Less than High School | - | - |
| High School Diploma | $31,346 | $0 |
| College or Associate's Degree | $61,250 | $61,923 |
| Bachelor's Degree | $59,375 | $39,750 |
| Graduate Degree | $250,001 | $52,083 |
| Total | $57,500 | $44,107 |
Family Income in Leawood
Family Income Brackets in Leawood
According to the Leawood family income data, there are 56 families falling into the $200,000+ income range, which is the most common income bracket and makes up 29.9% of all families.
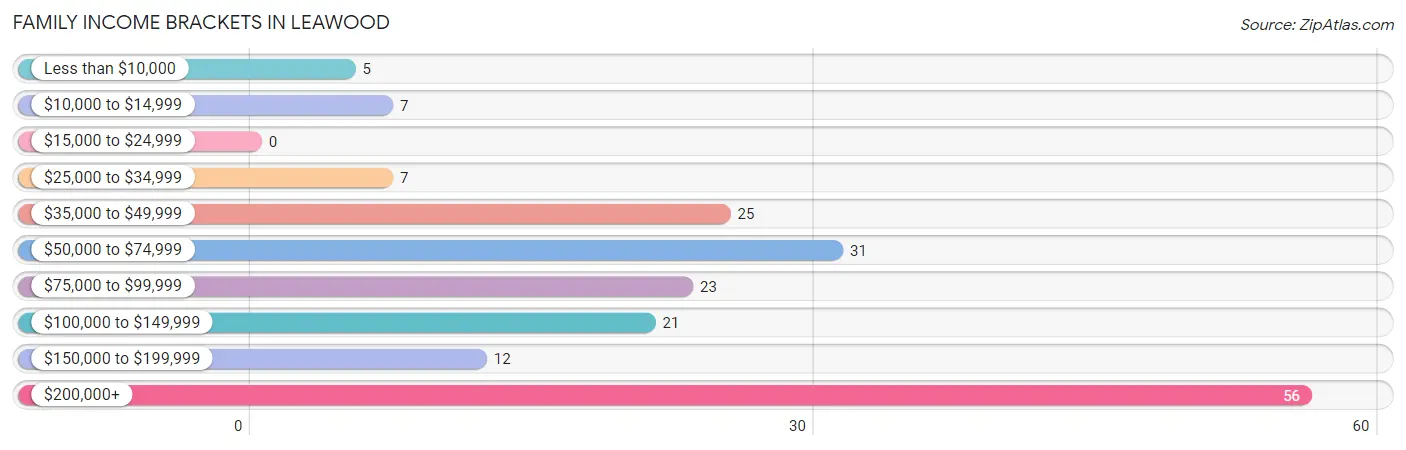
| Income Bracket | # Families | % Families |
| Less than $10,000 | 5 | 2.7% |
| $10,000 to $14,999 | 7 | 3.7% |
| $15,000 to $24,999 | 0 | 0.0% |
| $25,000 to $34,999 | 7 | 3.7% |
| $35,000 to $49,999 | 25 | 13.4% |
| $50,000 to $74,999 | 31 | 16.6% |
| $75,000 to $99,999 | 23 | 12.3% |
| $100,000 to $149,999 | 21 | 11.2% |
| $150,000 to $199,999 | 12 | 6.4% |
| $200,000+ | 56 | 29.9% |
Family Income by Famaliy Size in Leawood
5-person families (8 | 4.3%) account for the highest median family income in Leawood with $150,625 per family, while 2-person families (75 | 40.1%) have the highest median income of $52,344 per family member.
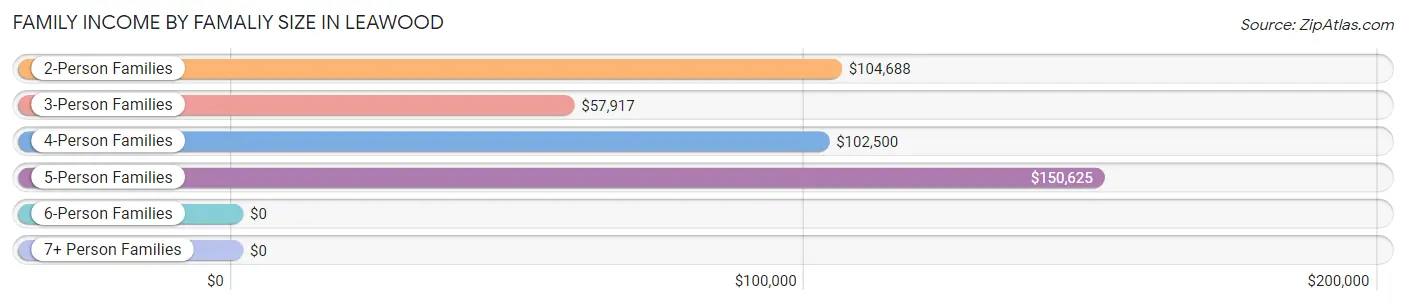
| Income Bracket | # Families | Median Income |
| 2-Person Families | 75 (40.1%) | $104,688 |
| 3-Person Families | 58 (31.0%) | $57,917 |
| 4-Person Families | 36 (19.3%) | $102,500 |
| 5-Person Families | 8 (4.3%) | $150,625 |
| 6-Person Families | 10 (5.3%) | $0 |
| 7+ Person Families | 0 (0.0%) | $0 |
| Total | 187 (100.0%) | $99,135 |
Family Income by Number of Earners in Leawood
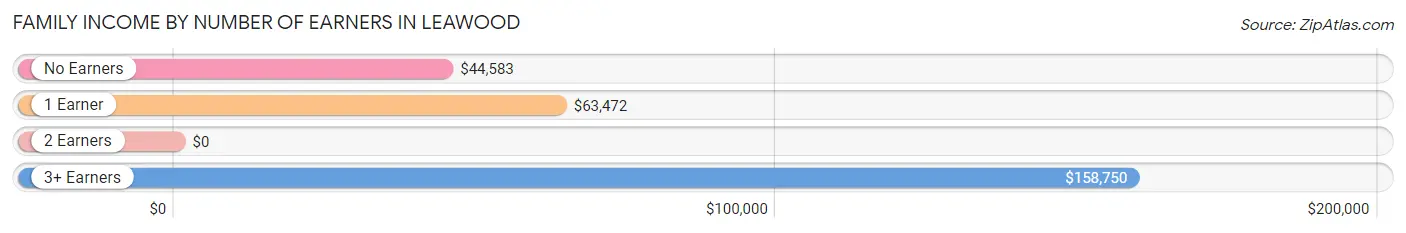
| Number of Earners | # Families | Median Income |
| No Earners | 23 (12.3%) | $44,583 |
| 1 Earner | 67 (35.8%) | $63,472 |
| 2 Earners | 83 (44.4%) | $0 |
| 3+ Earners | 14 (7.5%) | $158,750 |
| Total | 187 (100.0%) | $99,135 |
Household Income in Leawood
Household Income Brackets in Leawood
With 60 households falling in the category, the $200,000+ income range is the most frequent in Leawood, accounting for 22.8% of all households. In contrast, only 4 households (1.5%) fall into the $15,000 to $24,999 income bracket, making it the least populous group.
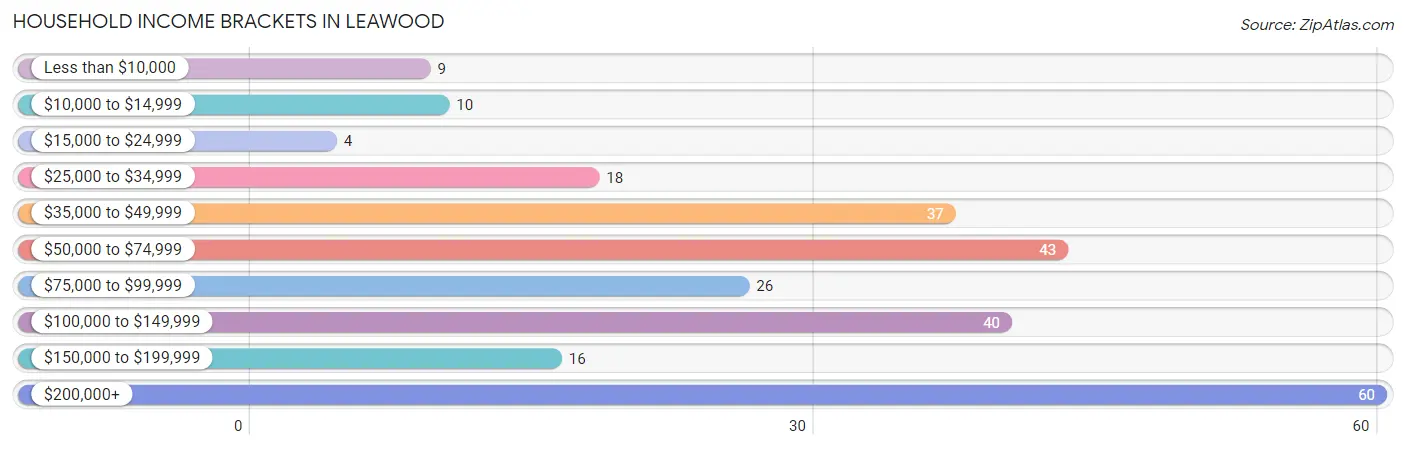
| Income Bracket | # Households | % Households |
| Less than $10,000 | 9 | 3.4% |
| $10,000 to $14,999 | 10 | 3.8% |
| $15,000 to $24,999 | 4 | 1.5% |
| $25,000 to $34,999 | 18 | 6.8% |
| $35,000 to $49,999 | 37 | 14.1% |
| $50,000 to $74,999 | 43 | 16.3% |
| $75,000 to $99,999 | 26 | 9.9% |
| $100,000 to $149,999 | 40 | 15.2% |
| $150,000 to $199,999 | 16 | 6.1% |
| $200,000+ | 60 | 22.8% |
Household Income by Householder Age in Leawood
The median household income in Leawood is $95,938, with the highest median household income of $106,875 found in the 45 to 64 years age bracket for the primary householder. A total of 105 households (39.9%) fall into this category. Meanwhile, the 15 to 24 years age bracket for the primary householder has the lowest median household income of $0, with 2 households (0.8%) in this group.
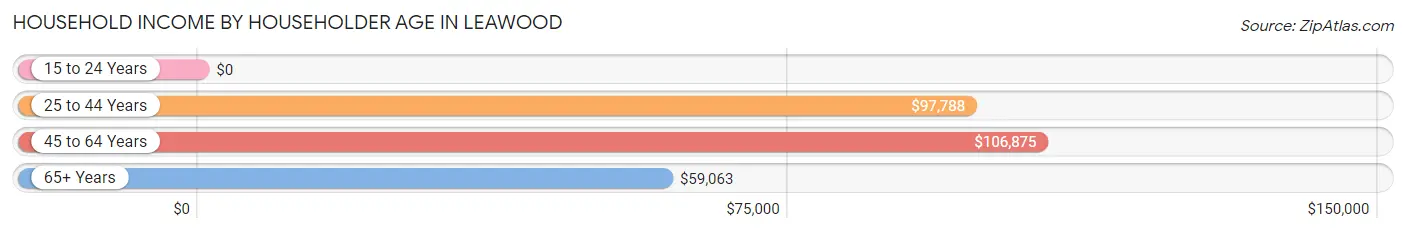
| Income Bracket | # Households | Median Income |
| 15 to 24 Years | 2 (0.8%) | $0 |
| 25 to 44 Years | 63 (23.9%) | $97,788 |
| 45 to 64 Years | 105 (39.9%) | $106,875 |
| 65+ Years | 93 (35.4%) | $59,063 |
| Total | 263 (100.0%) | $95,938 |
Poverty in Leawood
Income Below Poverty by Sex and Age in Leawood
With 4.3% poverty level for males and 7.0% for females among the residents of Leawood, 55 to 64 year old males and under 5 year old females are the most vulnerable to poverty, with 5 males (15.1%) and 4 females (36.4%) in their respective age groups living below the poverty level.
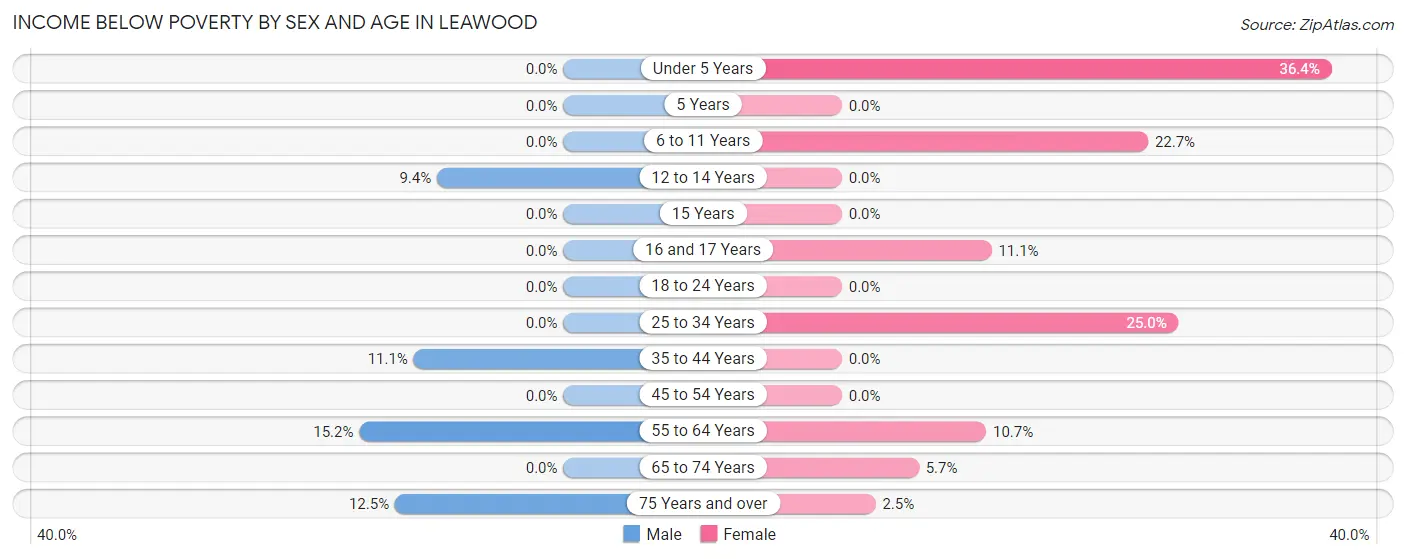
| Age Bracket | Male | Female |
| Under 5 Years | 0 (0.0%) | 4 (36.4%) |
| 5 Years | 0 (0.0%) | 0 (0.0%) |
| 6 to 11 Years | 0 (0.0%) | 5 (22.7%) |
| 12 to 14 Years | 3 (9.4%) | 0 (0.0%) |
| 15 Years | 0 (0.0%) | 0 (0.0%) |
| 16 and 17 Years | 0 (0.0%) | 1 (11.1%) |
| 18 to 24 Years | 0 (0.0%) | 0 (0.0%) |
| 25 to 34 Years | 0 (0.0%) | 7 (25.0%) |
| 35 to 44 Years | 3 (11.1%) | 0 (0.0%) |
| 45 to 54 Years | 0 (0.0%) | 0 (0.0%) |
| 55 to 64 Years | 5 (15.1%) | 6 (10.7%) |
| 65 to 74 Years | 0 (0.0%) | 2 (5.7%) |
| 75 Years and over | 3 (12.5%) | 1 (2.5%) |
| Total | 14 (4.3%) | 26 (7.0%) |
Income Above Poverty by Sex and Age in Leawood
According to the poverty statistics in Leawood, males aged under 5 years and females aged 12 to 14 years are the age groups that are most secure financially, with 100.0% of males and 100.0% of females in these age groups living above the poverty line.
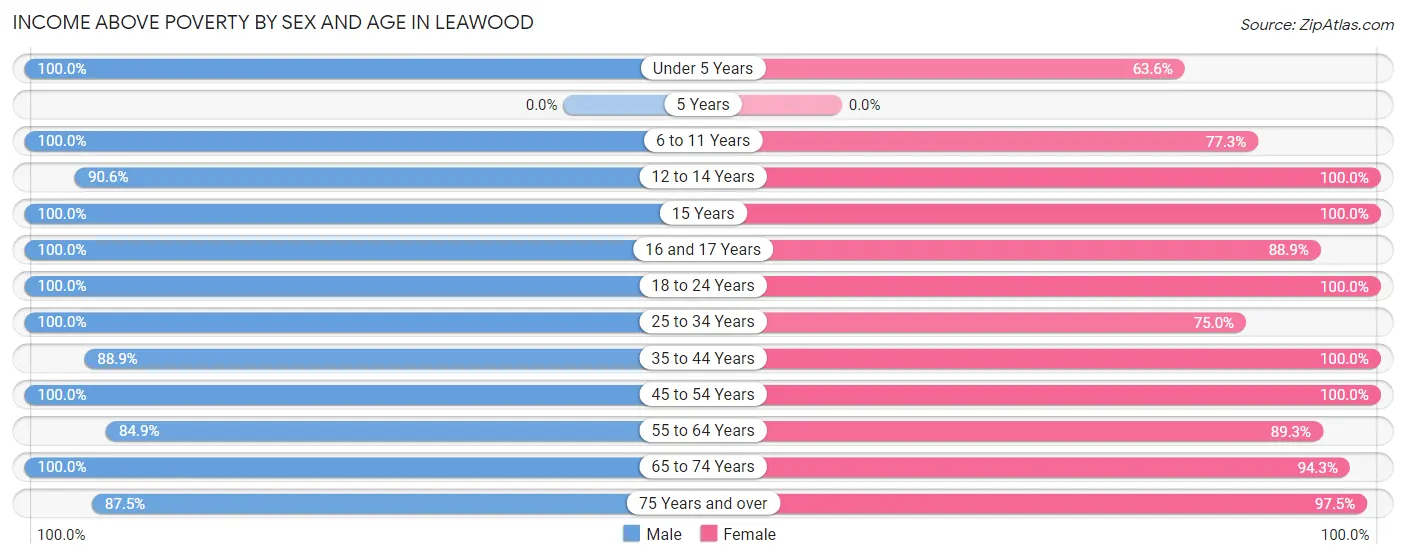
| Age Bracket | Male | Female |
| Under 5 Years | 10 (100.0%) | 7 (63.6%) |
| 5 Years | 0 (0.0%) | 0 (0.0%) |
| 6 to 11 Years | 24 (100.0%) | 17 (77.3%) |
| 12 to 14 Years | 29 (90.6%) | 33 (100.0%) |
| 15 Years | 18 (100.0%) | 26 (100.0%) |
| 16 and 17 Years | 12 (100.0%) | 8 (88.9%) |
| 18 to 24 Years | 10 (100.0%) | 14 (100.0%) |
| 25 to 34 Years | 41 (100.0%) | 21 (75.0%) |
| 35 to 44 Years | 24 (88.9%) | 60 (100.0%) |
| 45 to 54 Years | 53 (100.0%) | 35 (100.0%) |
| 55 to 64 Years | 28 (84.9%) | 50 (89.3%) |
| 65 to 74 Years | 39 (100.0%) | 33 (94.3%) |
| 75 Years and over | 21 (87.5%) | 39 (97.5%) |
| Total | 309 (95.7%) | 343 (92.9%) |
Income Below Poverty Among Married-Couple Families in Leawood
The poverty statistics for married-couple families in Leawood show that 3.1% or 5 of the total 160 families live below the poverty line. Families with 1 or 2 children have the highest poverty rate of 4.5%, comprising of 3 families. On the other hand, families with 3 or 4 children have the lowest poverty rate of 0.0%, which includes 0 families.
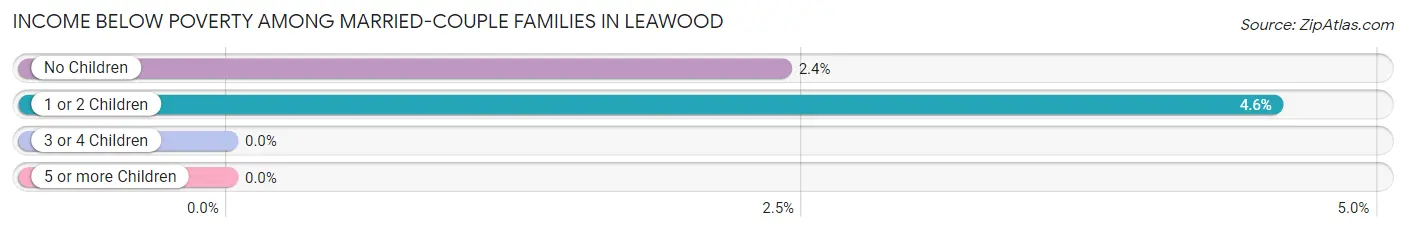
| Children | Above Poverty | Below Poverty |
| No Children | 81 (97.6%) | 2 (2.4%) |
| 1 or 2 Children | 63 (95.5%) | 3 (4.5%) |
| 3 or 4 Children | 11 (100.0%) | 0 (0.0%) |
| 5 or more Children | 0 (0.0%) | 0 (0.0%) |
| Total | 155 (96.9%) | 5 (3.1%) |
Income Below Poverty Among Single-Parent Households in Leawood
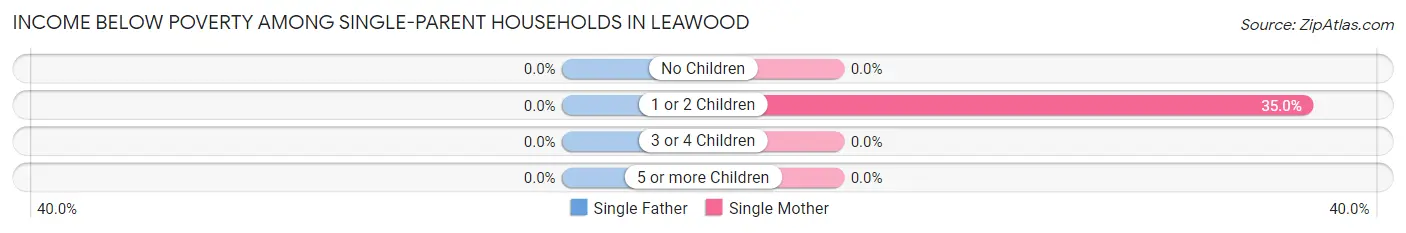
| Children | Single Father | Single Mother |
| No Children | 0 (0.0%) | 0 (0.0%) |
| 1 or 2 Children | 0 (0.0%) | 7 (35.0%) |
| 3 or 4 Children | 0 (0.0%) | 0 (0.0%) |
| 5 or more Children | 0 (0.0%) | 0 (0.0%) |
| Total | 0 (0.0%) | 7 (29.2%) |
Income Below Poverty Among Married-Couple vs Single-Parent Households in Leawood
The poverty data for Leawood shows that 5 of the married-couple family households (3.1%) and 7 of the single-parent households (25.9%) are living below the poverty level. Within the married-couple family households, those with 1 or 2 children have the highest poverty rate, with 3 households (4.5%) falling below the poverty line. Among the single-parent households, those with 1 or 2 children have the highest poverty rate, with 7 household (30.4%) living below poverty.
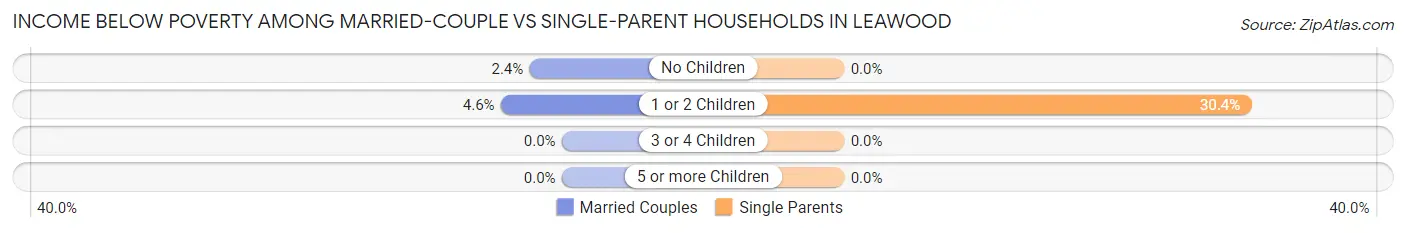
| Children | Married-Couple Families | Single-Parent Households |
| No Children | 2 (2.4%) | 0 (0.0%) |
| 1 or 2 Children | 3 (4.5%) | 7 (30.4%) |
| 3 or 4 Children | 0 (0.0%) | 0 (0.0%) |
| 5 or more Children | 0 (0.0%) | 0 (0.0%) |
| Total | 5 (3.1%) | 7 (25.9%) |
Race in Leawood
The most populous races in Leawood are White / Caucasian (607 | 87.7%), Two or more Races (63 | 9.1%), and Asian (9 | 1.3%).
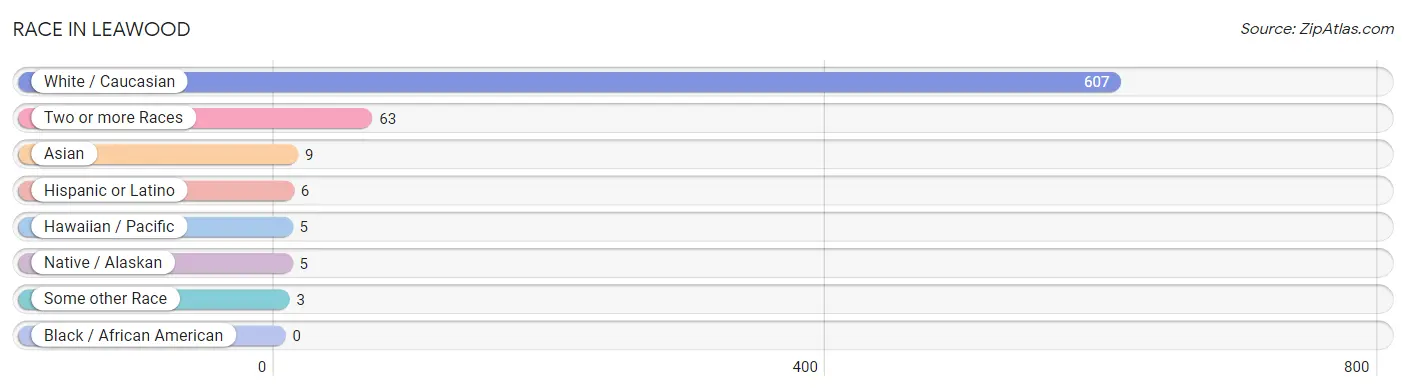
| Race | # Population | % Population |
| Asian | 9 | 1.3% |
| Black / African American | 0 | 0.0% |
| Hawaiian / Pacific | 5 | 0.7% |
| Hispanic or Latino | 6 | 0.9% |
| Native / Alaskan | 5 | 0.7% |
| White / Caucasian | 607 | 87.7% |
| Two or more Races | 63 | 9.1% |
| Some other Race | 3 | 0.4% |
| Total | 692 | 100.0% |
Ancestry in Leawood
The most populous ancestries reported in Leawood are German (158 | 22.8%), English (100 | 14.4%), Irish (91 | 13.2%), American (87 | 12.6%), and Italian (33 | 4.8%), together accounting for 67.8% of all Leawood residents.
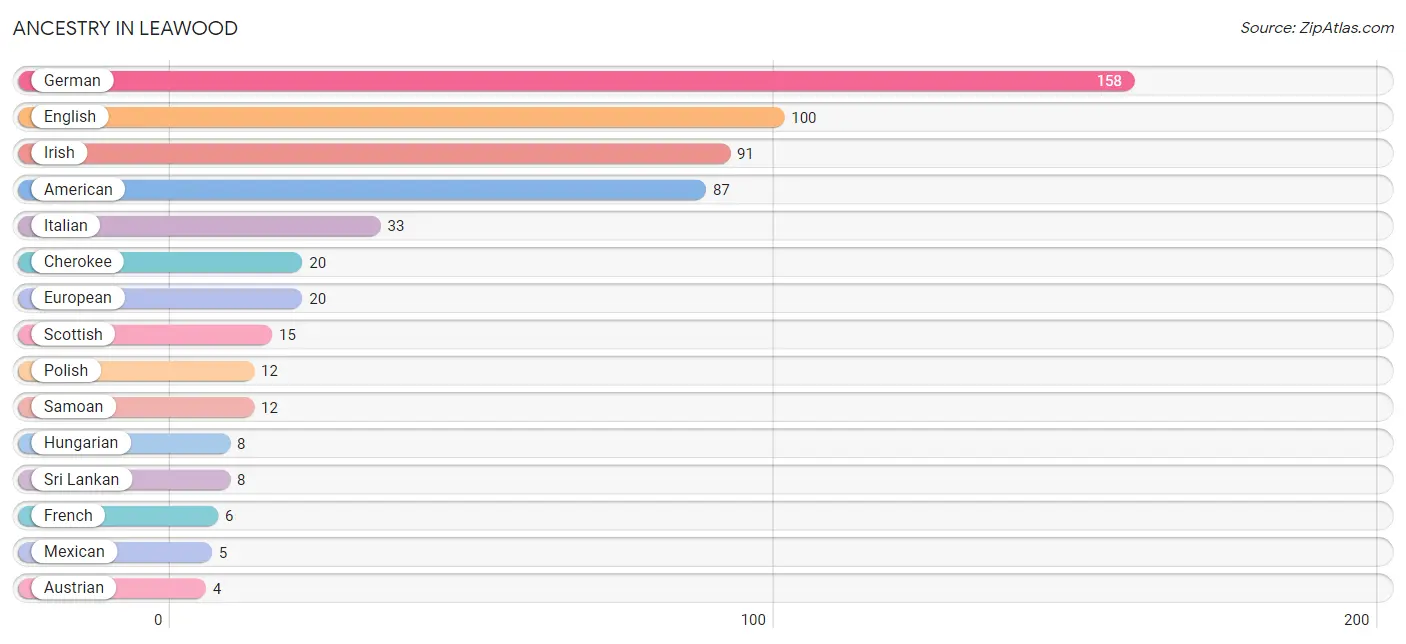
| Ancestry | # Population | % Population |
| American | 87 | 12.6% |
| Austrian | 4 | 0.6% |
| Central American | 1 | 0.1% |
| Cherokee | 20 | 2.9% |
| Dutch | 4 | 0.6% |
| English | 100 | 14.4% |
| European | 20 | 2.9% |
| Filipino | 1 | 0.1% |
| French | 6 | 0.9% |
| French Canadian | 3 | 0.4% |
| German | 158 | 22.8% |
| Guatemalan | 1 | 0.1% |
| Hungarian | 8 | 1.2% |
| Irish | 91 | 13.2% |
| Italian | 33 | 4.8% |
| Mexican | 5 | 0.7% |
| Ottawa | 1 | 0.1% |
| Polish | 12 | 1.7% |
| Samoan | 12 | 1.7% |
| Scotch-Irish | 2 | 0.3% |
| Scottish | 15 | 2.2% |
| Slovene | 2 | 0.3% |
| Sri Lankan | 8 | 1.2% |
| Swedish | 4 | 0.6% |
| Welsh | 2 | 0.3% | View All 25 Rows |
Immigrants in Leawood
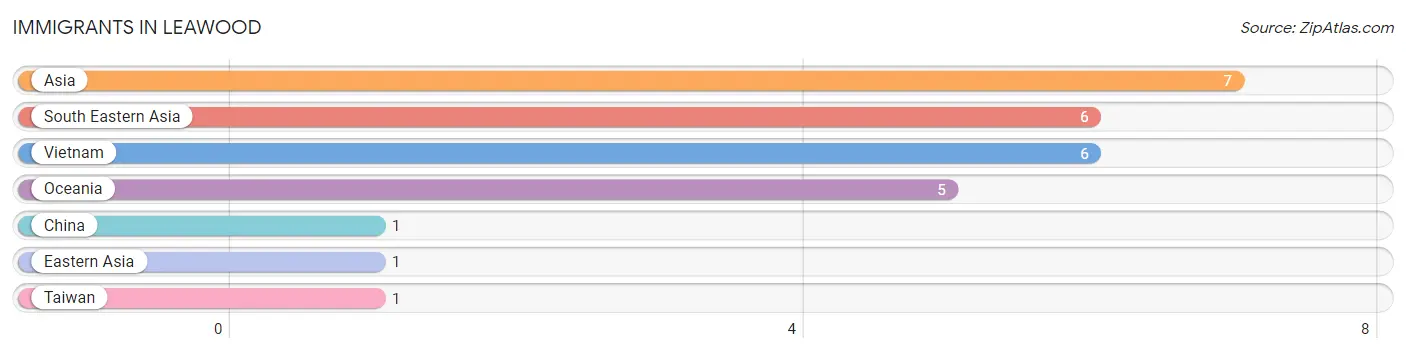
The most numerous immigrant groups reported in Leawood came from Asia (7 | 1.0%), South Eastern Asia (6 | 0.9%), Vietnam (6 | 0.9%), Oceania (5 | 0.7%), and China (1 | 0.1%), together accounting for 3.6% of all Leawood residents.
| Immigration Origin | # Population | % Population |
| Asia | 7 | 1.0% |
| China | 1 | 0.1% |
| Eastern Asia | 1 | 0.1% |
| Oceania | 5 | 0.7% |
| South Eastern Asia | 6 | 0.9% |
| Taiwan | 1 | 0.1% |
| Vietnam | 6 | 0.9% | View All 7 Rows |
Sex and Age in Leawood
Sex and Age in Leawood
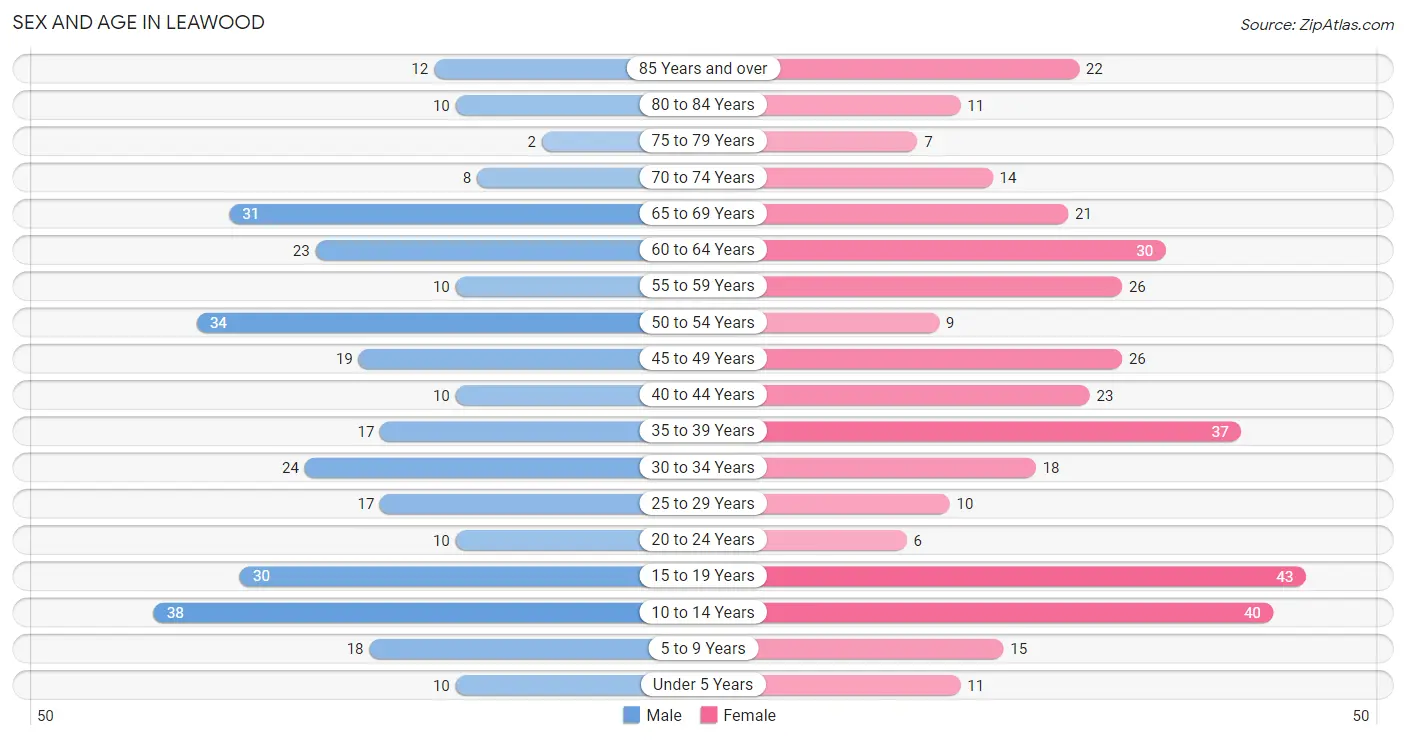
The most populous age groups in Leawood are 10 to 14 Years (38 | 11.8%) for men and 15 to 19 Years (43 | 11.7%) for women.
| Age Bracket | Male | Female |
| Under 5 Years | 10 (3.1%) | 11 (3.0%) |
| 5 to 9 Years | 18 (5.6%) | 15 (4.1%) |
| 10 to 14 Years | 38 (11.8%) | 40 (10.8%) |
| 15 to 19 Years | 30 (9.3%) | 43 (11.7%) |
| 20 to 24 Years | 10 (3.1%) | 6 (1.6%) |
| 25 to 29 Years | 17 (5.3%) | 10 (2.7%) |
| 30 to 34 Years | 24 (7.4%) | 18 (4.9%) |
| 35 to 39 Years | 17 (5.3%) | 37 (10.0%) |
| 40 to 44 Years | 10 (3.1%) | 23 (6.2%) |
| 45 to 49 Years | 19 (5.9%) | 26 (7.0%) |
| 50 to 54 Years | 34 (10.5%) | 9 (2.4%) |
| 55 to 59 Years | 10 (3.1%) | 26 (7.0%) |
| 60 to 64 Years | 23 (7.1%) | 30 (8.1%) |
| 65 to 69 Years | 31 (9.6%) | 21 (5.7%) |
| 70 to 74 Years | 8 (2.5%) | 14 (3.8%) |
| 75 to 79 Years | 2 (0.6%) | 7 (1.9%) |
| 80 to 84 Years | 10 (3.1%) | 11 (3.0%) |
| 85 Years and over | 12 (3.7%) | 22 (6.0%) |
| Total | 323 (100.0%) | 369 (100.0%) |
Families and Households in Leawood
Median Family Size in Leawood
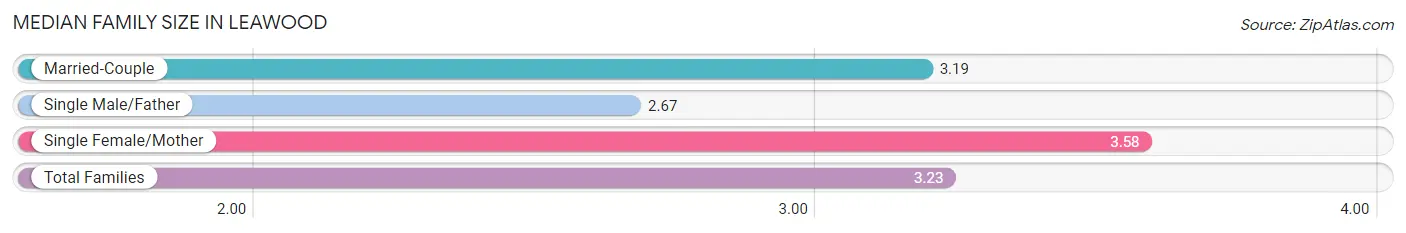
The median family size in Leawood is 3.23 persons per family, with single female/mother families (24 | 12.8%) accounting for the largest median family size of 3.58 persons per family. On the other hand, single male/father families (3 | 1.6%) represent the smallest median family size with 2.67 persons per family.
| Family Type | # Families | Family Size |
| Married-Couple | 160 (85.6%) | 3.19 |
| Single Male/Father | 3 (1.6%) | 2.67 |
| Single Female/Mother | 24 (12.8%) | 3.58 |
| Total Families | 187 (100.0%) | 3.23 |
Median Household Size in Leawood
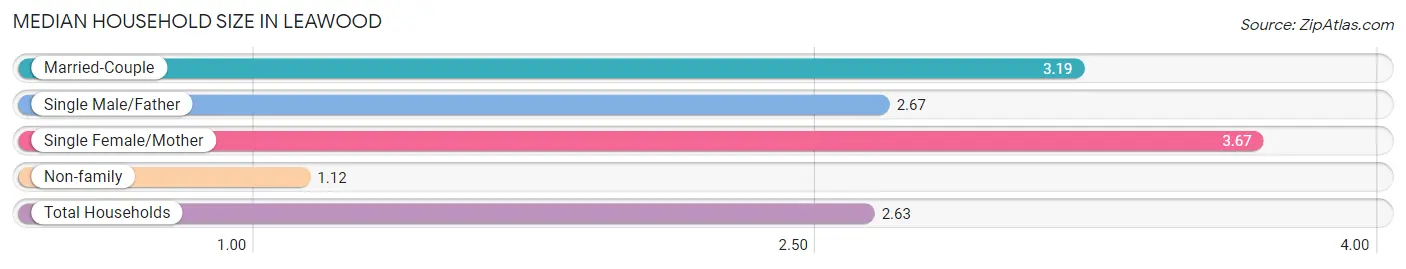
The median household size in Leawood is 2.63 persons per household, with single female/mother households (24 | 9.1%) accounting for the largest median household size of 3.67 persons per household. non-family households (76 | 28.9%) represent the smallest median household size with 1.12 persons per household.
| Household Type | # Households | Household Size |
| Married-Couple | 160 (60.8%) | 3.19 |
| Single Male/Father | 3 (1.1%) | 2.67 |
| Single Female/Mother | 24 (9.1%) | 3.67 |
| Non-family | 76 (28.9%) | 1.12 |
| Total Households | 263 (100.0%) | 2.63 |
Household Size by Marriage Status in Leawood
Out of a total of 263 households in Leawood, 187 (71.1%) are family households, while 76 (28.9%) are nonfamily households. The most numerous type of family households are 2-person households, comprising 73, and the most common type of nonfamily households are 1-person households, comprising 66.
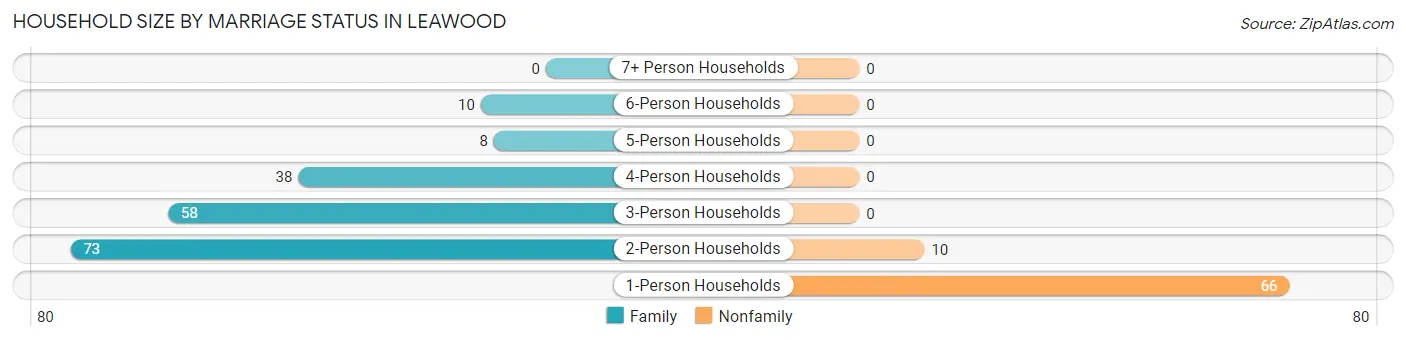
| Household Size | Family Households | Nonfamily Households |
| 1-Person Households | - | 66 (25.1%) |
| 2-Person Households | 73 (27.8%) | 10 (3.8%) |
| 3-Person Households | 58 (22.1%) | 0 (0.0%) |
| 4-Person Households | 38 (14.4%) | 0 (0.0%) |
| 5-Person Households | 8 (3.0%) | 0 (0.0%) |
| 6-Person Households | 10 (3.8%) | 0 (0.0%) |
| 7+ Person Households | 0 (0.0%) | 0 (0.0%) |
| Total | 187 (71.1%) | 76 (28.9%) |
Female Fertility in Leawood
Fertility by Age in Leawood
Average fertility rate in Leawood is 102.0 births per 1,000 women. Women in the age bracket of 20 to 34 years have the highest fertility rate with 500.0 births per 1,000 women. Women in the age bracket of 20 to 34 years acount for 100.0% of all women with births.
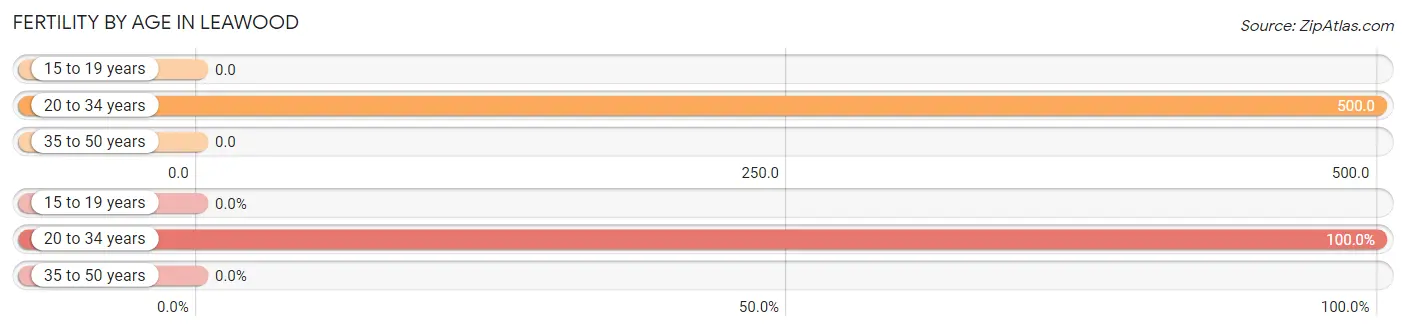
| Age Bracket | Women with Births | Births / 1,000 Women |
| 15 to 19 years | 0 (0.0%) | 0.0 |
| 20 to 34 years | 17 (100.0%) | 500.0 |
| 35 to 50 years | 0 (0.0%) | 0.0 |
| Total | 17 (100.0%) | 102.0 |
Fertility by Age by Marriage Status in Leawood
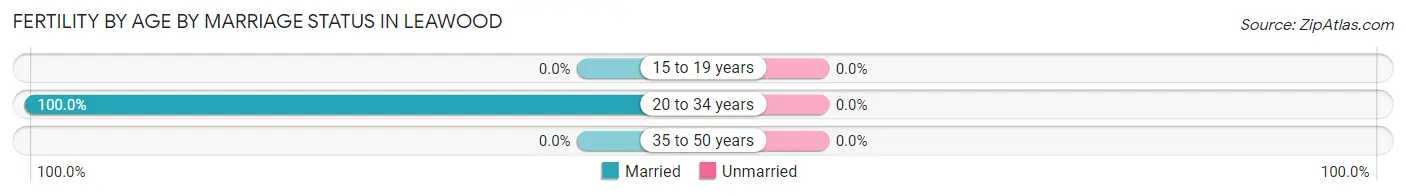
| Age Bracket | Married | Unmarried |
| 15 to 19 years | 0 (0.0%) | 0 (0.0%) |
| 20 to 34 years | 17 (100.0%) | 0 (0.0%) |
| 35 to 50 years | 0 (0.0%) | 0 (0.0%) |
| Total | 17 (100.0%) | 0 (0.0%) |
Fertility by Education in Leawood
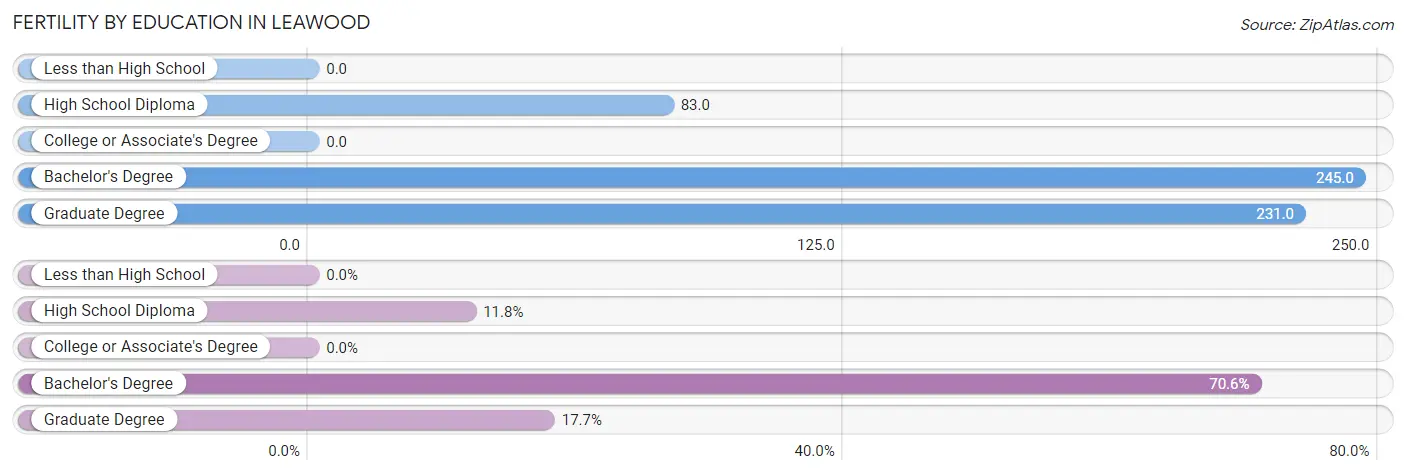
| Educational Attainment | Women with Births | Births / 1,000 Women |
| Less than High School | 0 (0.0%) | 0.0 |
| High School Diploma | 2 (11.8%) | 83.0 |
| College or Associate's Degree | 0 (0.0%) | 0.0 |
| Bachelor's Degree | 12 (70.6%) | 245.0 |
| Graduate Degree | 3 (17.6%) | 231.0 |
| Total | 17 (100.0%) | 102.0 |
Fertility by Education by Marriage Status in Leawood
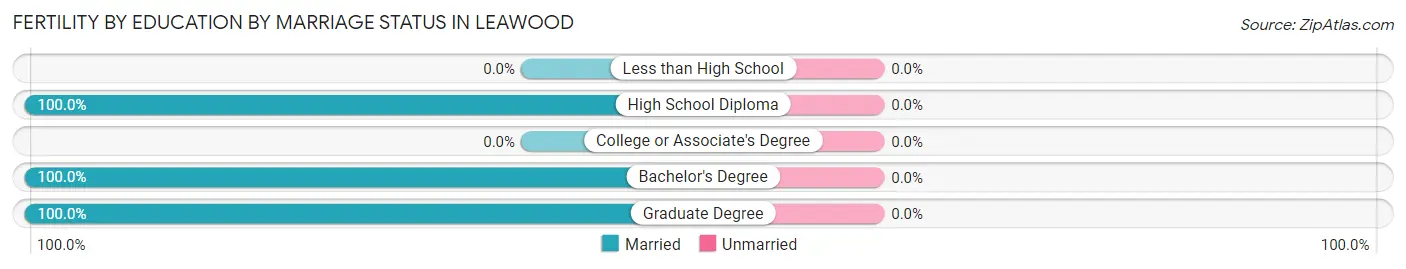
| Educational Attainment | Married | Unmarried |
| Less than High School | 0 (0.0%) | 0 (0.0%) |
| High School Diploma | 2 (100.0%) | 0 (0.0%) |
| College or Associate's Degree | 0 (0.0%) | 0 (0.0%) |
| Bachelor's Degree | 12 (100.0%) | 0 (0.0%) |
| Graduate Degree | 3 (100.0%) | 0 (0.0%) |
| Total | 17 (100.0%) | 0 (0.0%) |
Employment Characteristics in Leawood
Employment by Class of Employer in Leawood
Among the 312 employed individuals in Leawood, private company employees (215 | 68.9%), not-for-profit organizations (42 | 13.5%), and local government employees (28 | 9.0%) make up the most common classes of employment.
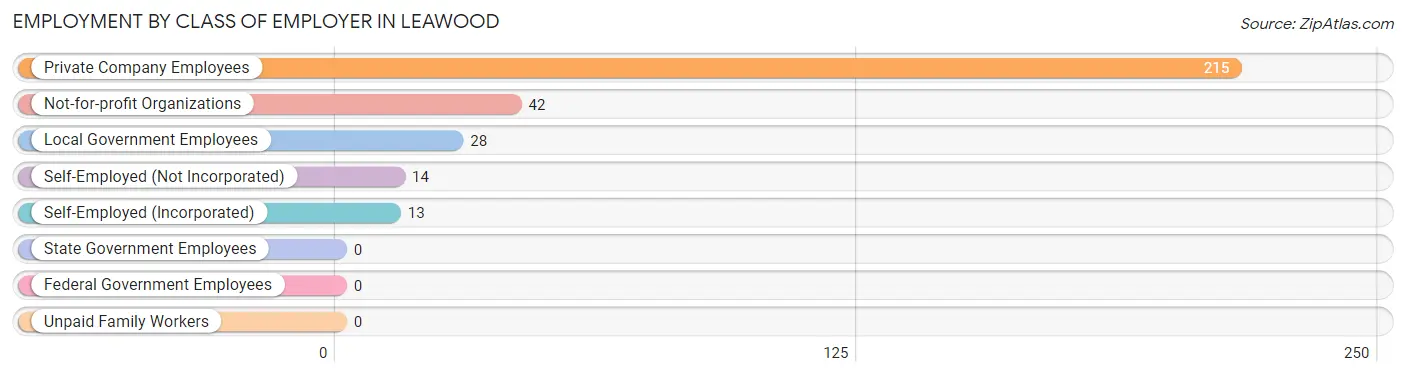
| Employer Class | # Employees | % Employees |
| Private Company Employees | 215 | 68.9% |
| Self-Employed (Incorporated) | 13 | 4.2% |
| Self-Employed (Not Incorporated) | 14 | 4.5% |
| Not-for-profit Organizations | 42 | 13.5% |
| Local Government Employees | 28 | 9.0% |
| State Government Employees | 0 | 0.0% |
| Federal Government Employees | 0 | 0.0% |
| Unpaid Family Workers | 0 | 0.0% |
| Total | 312 | 100.0% |
Employment Status by Age in Leawood
According to the labor force statistics for Leawood, out of the total population over 16 years of age (516), 61.8% or 319 individuals are in the labor force, with 0.9% or 3 of them unemployed. The age group with the highest labor force participation rate is 30 to 34 years, with 100.0% or 42 individuals in the labor force. Within the labor force, the 25 to 29 years age range has the highest percentage of unemployed individuals, with 12.0% or 3 of them being unemployed.
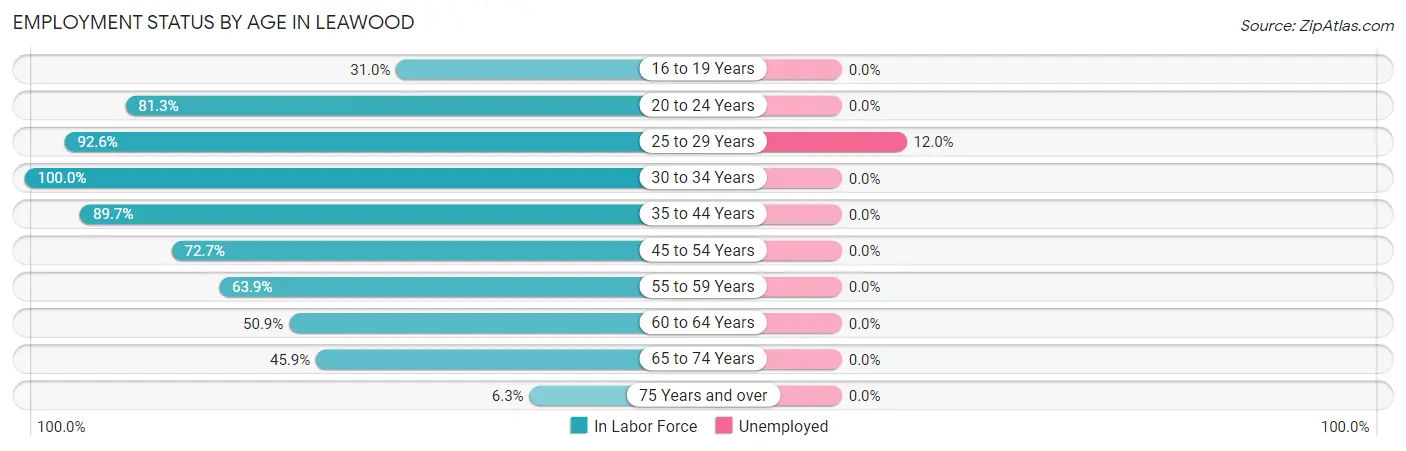
| Age Bracket | In Labor Force | Unemployed |
| 16 to 19 Years | 9 (31.0%) | 0 (0.0%) |
| 20 to 24 Years | 13 (81.3%) | 0 (0.0%) |
| 25 to 29 Years | 25 (92.6%) | 3 (12.0%) |
| 30 to 34 Years | 42 (100.0%) | 0 (0.0%) |
| 35 to 44 Years | 78 (89.7%) | 0 (0.0%) |
| 45 to 54 Years | 64 (72.7%) | 0 (0.0%) |
| 55 to 59 Years | 23 (63.9%) | 0 (0.0%) |
| 60 to 64 Years | 27 (50.9%) | 0 (0.0%) |
| 65 to 74 Years | 34 (45.9%) | 0 (0.0%) |
| 75 Years and over | 4 (6.3%) | 0 (0.0%) |
| Total | 319 (61.8%) | 3 (0.9%) |
Employment Status by Educational Attainment in Leawood
According to labor force statistics for Leawood, 77.8% of individuals (259) out of the total population between 25 and 64 years of age (333) are in the labor force, with 1.2% or 3 of them being unemployed. The group with the highest labor force participation rate are those with the educational attainment of college / associate degree, with 94.7% or 72 individuals in the labor force. Within the labor force, individuals with less than high school education have the highest percentage of unemployment, with 15.8% or 3 of them being unemployed.
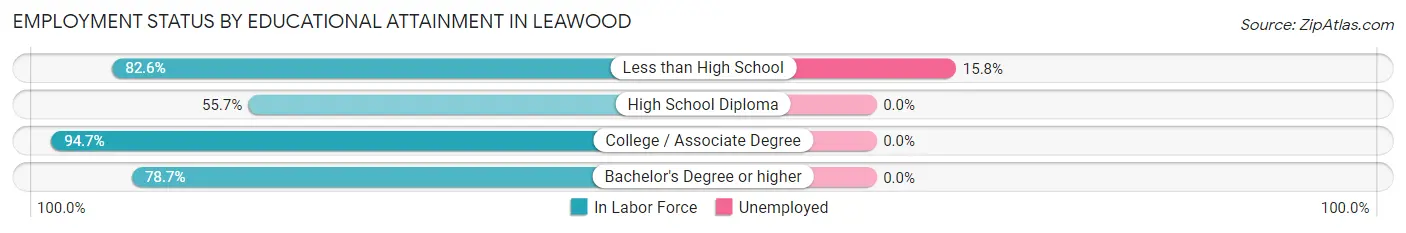
| Educational Attainment | In Labor Force | Unemployed |
| Less than High School | 19 (82.6%) | 4 (15.8%) |
| High School Diploma | 39 (55.7%) | 0 (0.0%) |
| College / Associate Degree | 72 (94.7%) | 0 (0.0%) |
| Bachelor's Degree or higher | 129 (78.7%) | 0 (0.0%) |
| Total | 259 (77.8%) | 4 (1.2%) |
Employment Occupations by Sex in Leawood
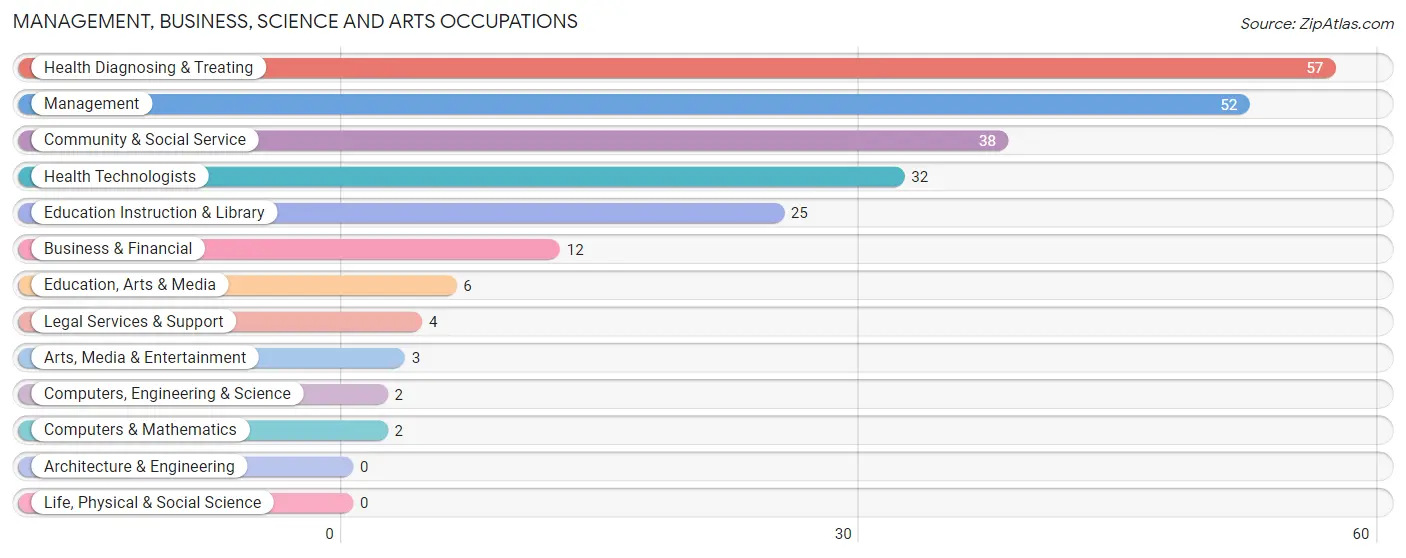
Management, Business, Science and Arts Occupations
The most common Management, Business, Science and Arts occupations in Leawood are Health Diagnosing & Treating (57 | 18.0%), Management (52 | 16.5%), Community & Social Service (38 | 12.0%), Health Technologists (32 | 10.1%), and Education Instruction & Library (25 | 7.9%).
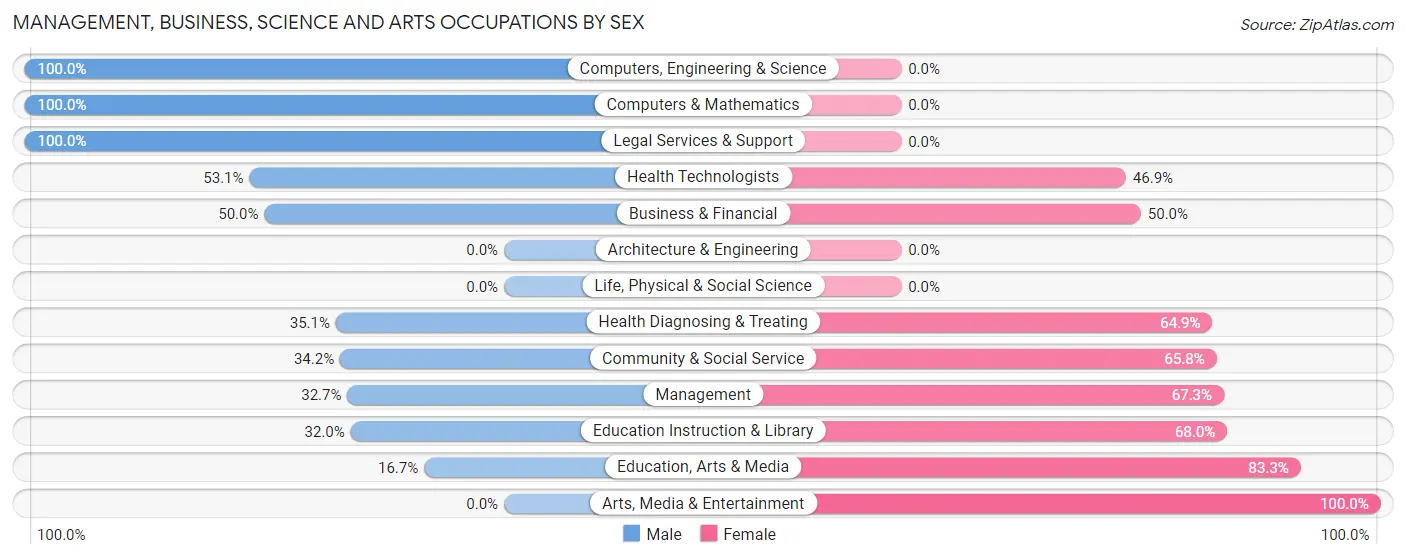
Management, Business, Science and Arts Occupations by Sex
Within the Management, Business, Science and Arts occupations in Leawood, the most male-oriented occupations are Computers, Engineering & Science (100.0%), Computers & Mathematics (100.0%), and Legal Services & Support (100.0%), while the most female-oriented occupations are Arts, Media & Entertainment (100.0%), Education, Arts & Media (83.3%), and Education Instruction & Library (68.0%).
| Occupation | Male | Female |
| Management | 17 (32.7%) | 35 (67.3%) |
| Business & Financial | 6 (50.0%) | 6 (50.0%) |
| Computers, Engineering & Science | 2 (100.0%) | 0 (0.0%) |
| Computers & Mathematics | 2 (100.0%) | 0 (0.0%) |
| Architecture & Engineering | 0 (0.0%) | 0 (0.0%) |
| Life, Physical & Social Science | 0 (0.0%) | 0 (0.0%) |
| Community & Social Service | 13 (34.2%) | 25 (65.8%) |
| Education, Arts & Media | 1 (16.7%) | 5 (83.3%) |
| Legal Services & Support | 4 (100.0%) | 0 (0.0%) |
| Education Instruction & Library | 8 (32.0%) | 17 (68.0%) |
| Arts, Media & Entertainment | 0 (0.0%) | 3 (100.0%) |
| Health Diagnosing & Treating | 20 (35.1%) | 37 (64.9%) |
| Health Technologists | 17 (53.1%) | 15 (46.9%) |
| Total (Category) | 58 (36.0%) | 103 (64.0%) |
| Total (Overall) | 160 (50.6%) | 156 (49.4%) |
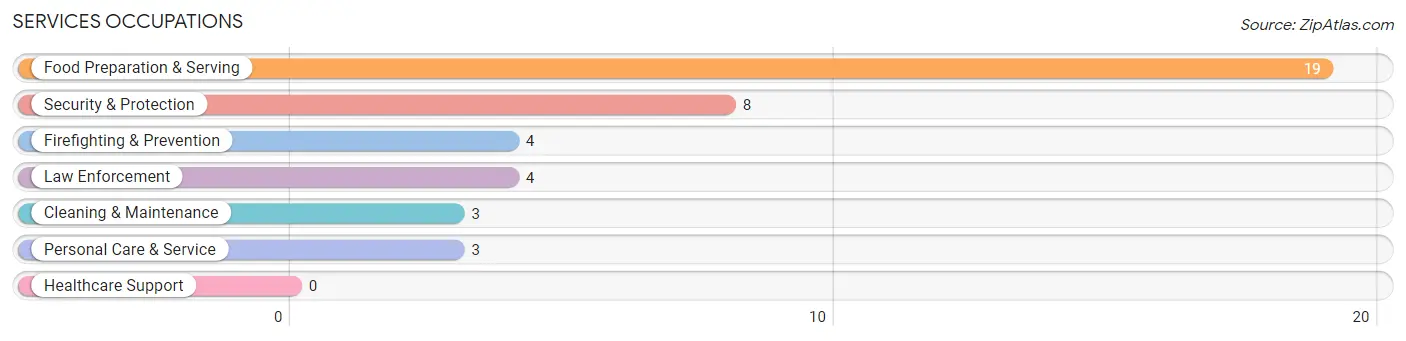
Services Occupations
The most common Services occupations in Leawood are Food Preparation & Serving (19 | 6.0%), Security & Protection (8 | 2.5%), Firefighting & Prevention (4 | 1.3%), Law Enforcement (4 | 1.3%), and Cleaning & Maintenance (3 | 0.9%).
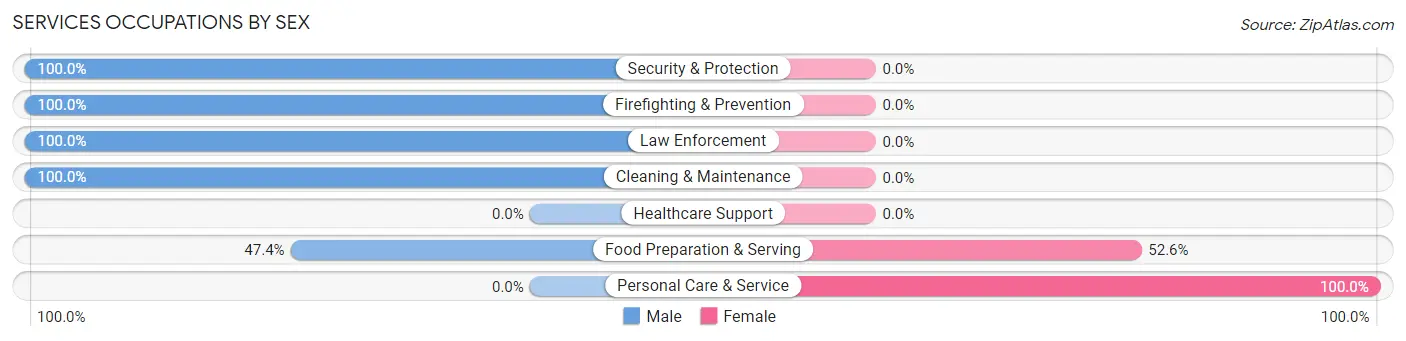
Services Occupations by Sex
Within the Services occupations in Leawood, the most male-oriented occupations are Security & Protection (100.0%), Firefighting & Prevention (100.0%), and Law Enforcement (100.0%), while the most female-oriented occupations are Personal Care & Service (100.0%), and Food Preparation & Serving (52.6%).
| Occupation | Male | Female |
| Healthcare Support | 0 (0.0%) | 0 (0.0%) |
| Security & Protection | 8 (100.0%) | 0 (0.0%) |
| Firefighting & Prevention | 4 (100.0%) | 0 (0.0%) |
| Law Enforcement | 4 (100.0%) | 0 (0.0%) |
| Food Preparation & Serving | 9 (47.4%) | 10 (52.6%) |
| Cleaning & Maintenance | 3 (100.0%) | 0 (0.0%) |
| Personal Care & Service | 0 (0.0%) | 3 (100.0%) |
| Total (Category) | 20 (60.6%) | 13 (39.4%) |
| Total (Overall) | 160 (50.6%) | 156 (49.4%) |
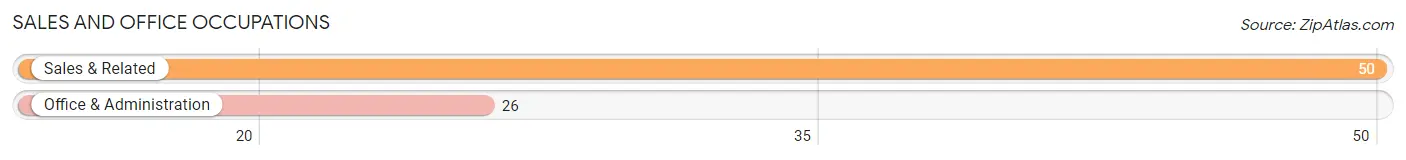
Sales and Office Occupations
The most common Sales and Office occupations in Leawood are Sales & Related (50 | 15.8%), and Office & Administration (26 | 8.2%).
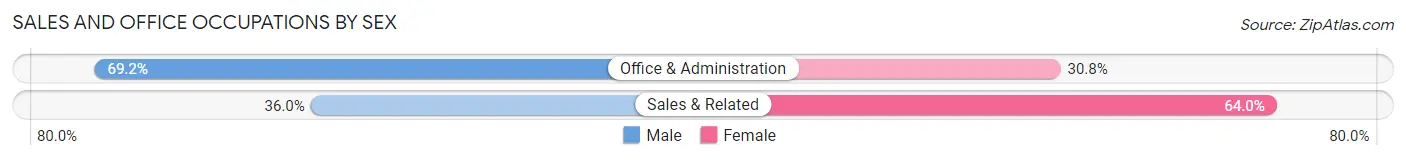
Sales and Office Occupations by Sex
| Occupation | Male | Female |
| Sales & Related | 18 (36.0%) | 32 (64.0%) |
| Office & Administration | 18 (69.2%) | 8 (30.8%) |
| Total (Category) | 36 (47.4%) | 40 (52.6%) |
| Total (Overall) | 160 (50.6%) | 156 (49.4%) |
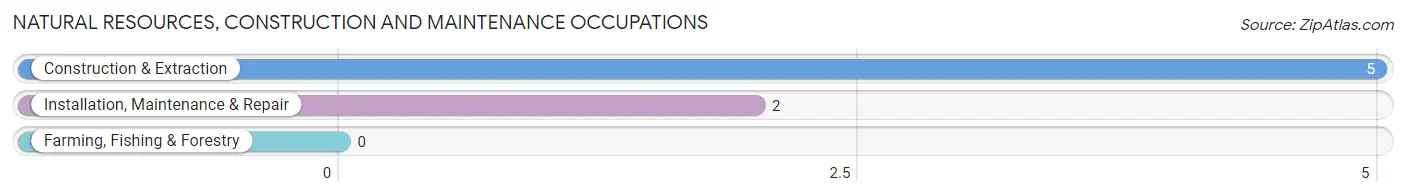
Natural Resources, Construction and Maintenance Occupations
The most common Natural Resources, Construction and Maintenance occupations in Leawood are Construction & Extraction (5 | 1.6%), and Installation, Maintenance & Repair (2 | 0.6%).
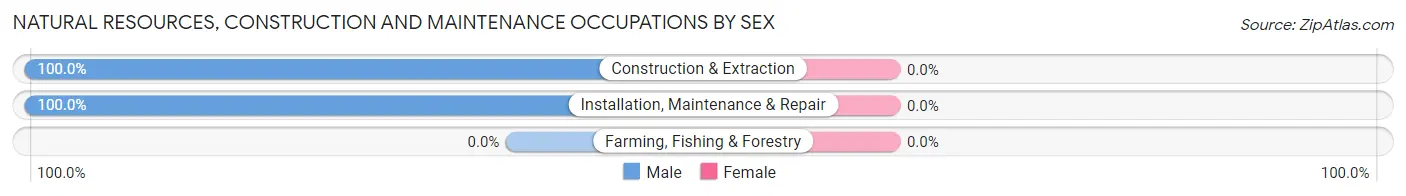
Natural Resources, Construction and Maintenance Occupations by Sex
| Occupation | Male | Female |
| Farming, Fishing & Forestry | 0 (0.0%) | 0 (0.0%) |
| Construction & Extraction | 5 (100.0%) | 0 (0.0%) |
| Installation, Maintenance & Repair | 2 (100.0%) | 0 (0.0%) |
| Total (Category) | 7 (100.0%) | 0 (0.0%) |
| Total (Overall) | 160 (50.6%) | 156 (49.4%) |
Production, Transportation and Moving Occupations
The most common Production, Transportation and Moving occupations in Leawood are Production (32 | 10.1%), and Transportation (7 | 2.2%).
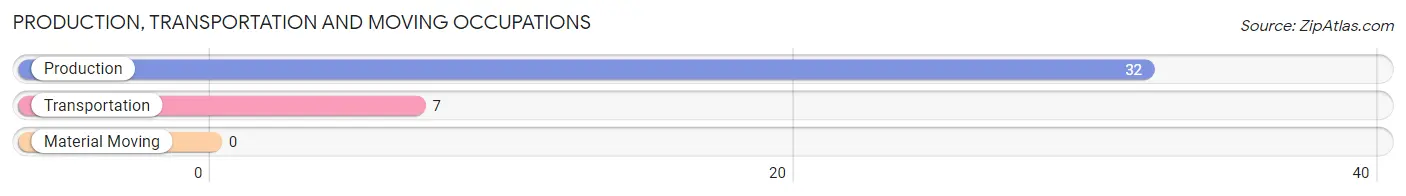
Production, Transportation and Moving Occupations by Sex
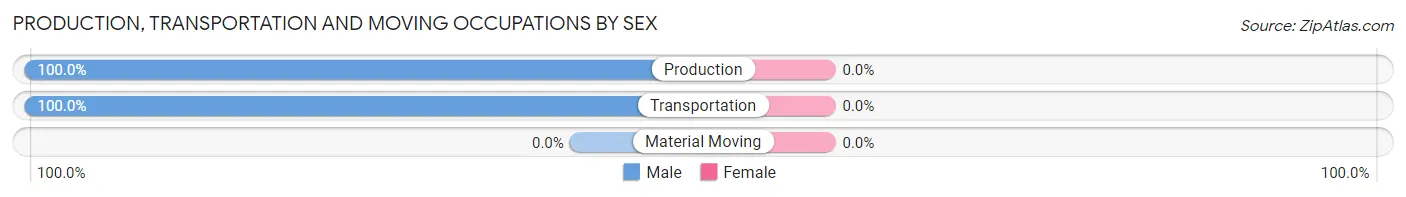
| Occupation | Male | Female |
| Production | 32 (100.0%) | 0 (0.0%) |
| Transportation | 7 (100.0%) | 0 (0.0%) |
| Material Moving | 0 (0.0%) | 0 (0.0%) |
| Total (Category) | 39 (100.0%) | 0 (0.0%) |
| Total (Overall) | 160 (50.6%) | 156 (49.4%) |
Employment Industries by Sex in Leawood
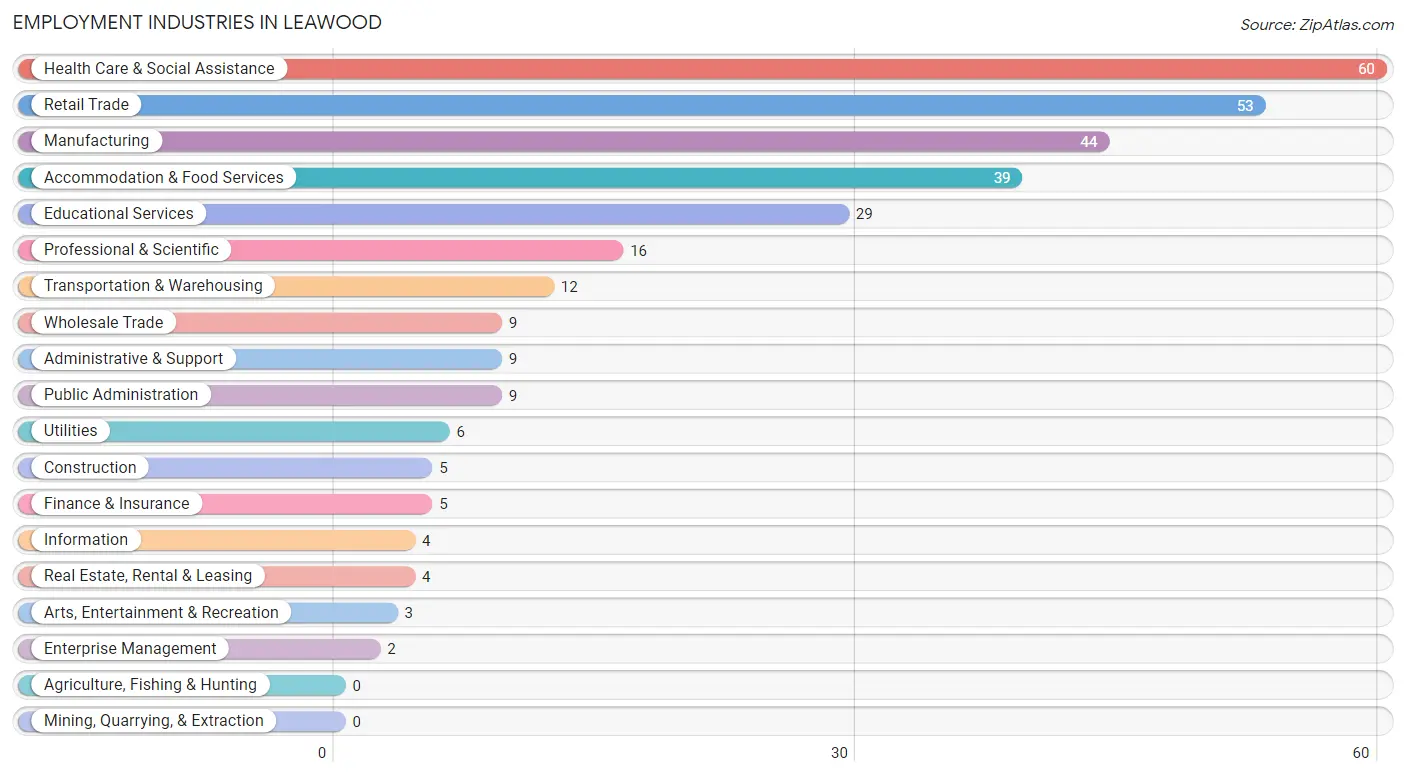
Employment Industries in Leawood
The major employment industries in Leawood include Health Care & Social Assistance (60 | 19.0%), Retail Trade (53 | 16.8%), Manufacturing (44 | 13.9%), Accommodation & Food Services (39 | 12.3%), and Educational Services (29 | 9.2%).
Employment Industries by Sex in Leawood
The Leawood industries that see more men than women are Construction (100.0%), Transportation & Warehousing (100.0%), and Finance & Insurance (100.0%), whereas the industries that tend to have a higher number of women are Enterprise Management (100.0%), Professional & Scientific (75.0%), and Educational Services (72.4%).
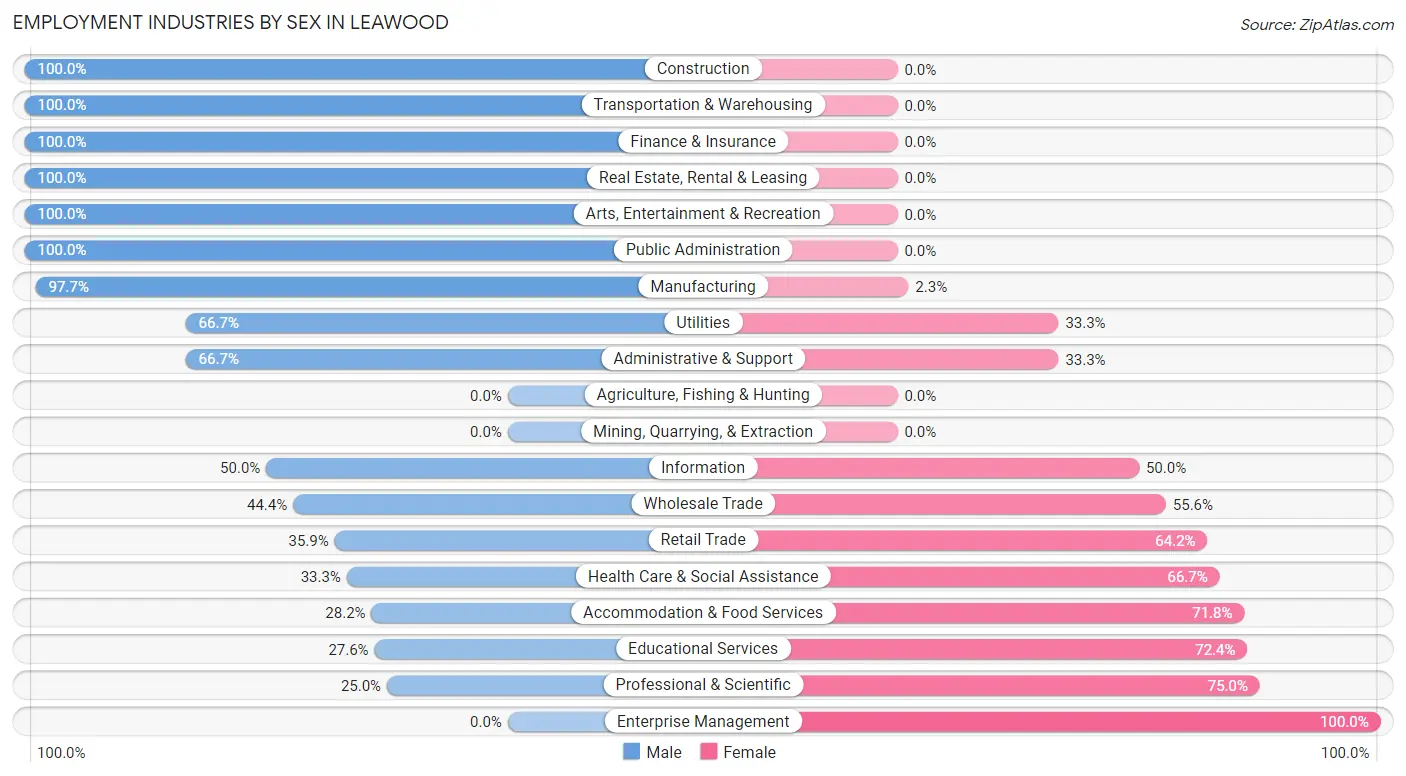
| Industry | Male | Female |
| Agriculture, Fishing & Hunting | 0 (0.0%) | 0 (0.0%) |
| Mining, Quarrying, & Extraction | 0 (0.0%) | 0 (0.0%) |
| Construction | 5 (100.0%) | 0 (0.0%) |
| Manufacturing | 43 (97.7%) | 1 (2.3%) |
| Wholesale Trade | 4 (44.4%) | 5 (55.6%) |
| Retail Trade | 19 (35.8%) | 34 (64.1%) |
| Transportation & Warehousing | 12 (100.0%) | 0 (0.0%) |
| Utilities | 4 (66.7%) | 2 (33.3%) |
| Information | 2 (50.0%) | 2 (50.0%) |
| Finance & Insurance | 5 (100.0%) | 0 (0.0%) |
| Real Estate, Rental & Leasing | 4 (100.0%) | 0 (0.0%) |
| Professional & Scientific | 4 (25.0%) | 12 (75.0%) |
| Enterprise Management | 0 (0.0%) | 2 (100.0%) |
| Administrative & Support | 6 (66.7%) | 3 (33.3%) |
| Educational Services | 8 (27.6%) | 21 (72.4%) |
| Health Care & Social Assistance | 20 (33.3%) | 40 (66.7%) |
| Arts, Entertainment & Recreation | 3 (100.0%) | 0 (0.0%) |
| Accommodation & Food Services | 11 (28.2%) | 28 (71.8%) |
| Public Administration | 9 (100.0%) | 0 (0.0%) |
| Total | 160 (50.6%) | 156 (49.4%) |
Education in Leawood
School Enrollment in Leawood
The most common levels of schooling among the 207 students in Leawood are high school (71 | 34.3%), middle school (66 | 31.9%), and elementary school (39 | 18.8%).
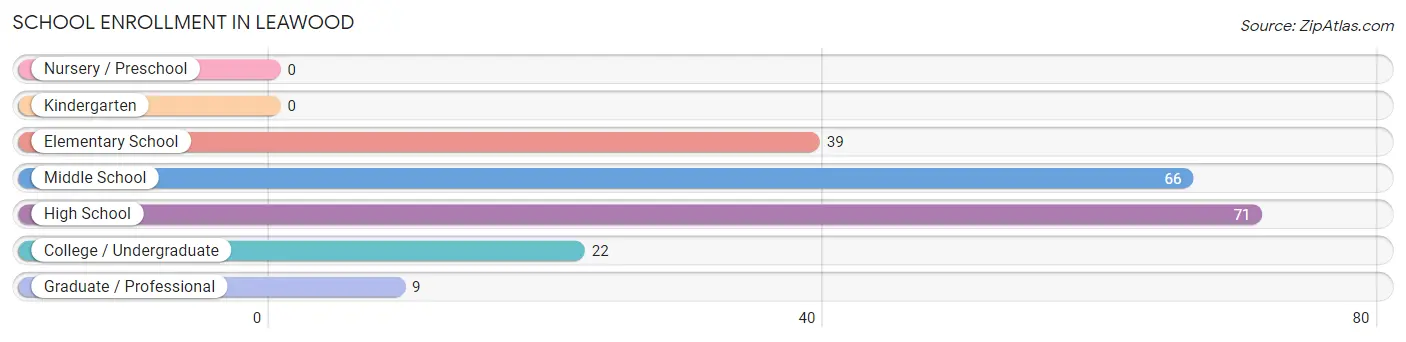
| School Level | # Students | % Students |
| Nursery / Preschool | 0 | 0.0% |
| Kindergarten | 0 | 0.0% |
| Elementary School | 39 | 18.8% |
| Middle School | 66 | 31.9% |
| High School | 71 | 34.3% |
| College / Undergraduate | 22 | 10.6% |
| Graduate / Professional | 9 | 4.3% |
| Total | 207 | 100.0% |
School Enrollment by Age by Funding Source in Leawood
Out of a total of 207 students who are enrolled in schools in Leawood, 18 (8.7%) attend a private institution, while the remaining 189 (91.3%) are enrolled in public schools. The age group of 5 to 9 year old has the highest likelihood of being enrolled in private schools, with 9 (27.3% in the age bracket) enrolled. Conversely, the age group of 15 to 17 year olds has the lowest likelihood of being enrolled in a private school, with 65 (100.0% in the age bracket) attending a public institution.
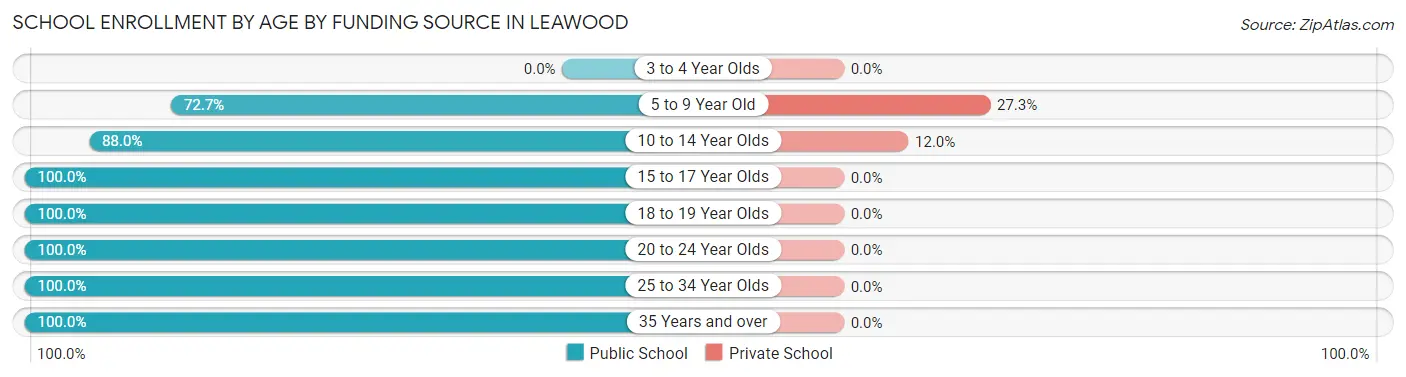
| Age Bracket | Public School | Private School |
| 3 to 4 Year Olds | 0 (0.0%) | 0 (0.0%) |
| 5 to 9 Year Old | 24 (72.7%) | 9 (27.3%) |
| 10 to 14 Year Olds | 66 (88.0%) | 9 (12.0%) |
| 15 to 17 Year Olds | 65 (100.0%) | 0 (0.0%) |
| 18 to 19 Year Olds | 6 (100.0%) | 0 (0.0%) |
| 20 to 24 Year Olds | 10 (100.0%) | 0 (0.0%) |
| 25 to 34 Year Olds | 7 (100.0%) | 0 (0.0%) |
| 35 Years and over | 11 (100.0%) | 0 (0.0%) |
| Total | 189 (91.3%) | 18 (8.7%) |
Educational Attainment by Field of Study in Leawood
Business (54 | 23.7%), science & technology (30 | 13.2%), education (30 | 13.2%), social sciences (21 | 9.2%), and bio, nature & agricultural (18 | 7.9%) are the most common fields of study among 228 individuals in Leawood who have obtained a bachelor's degree or higher.
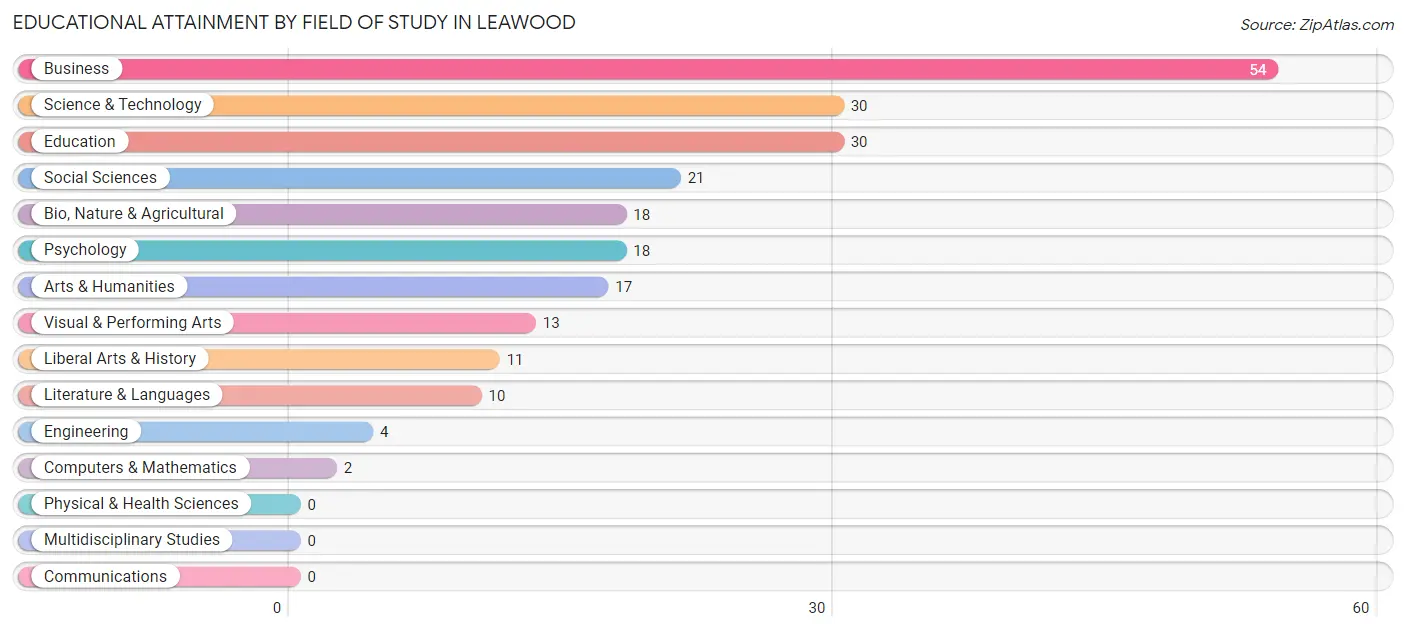
| Field of Study | # Graduates | % Graduates |
| Computers & Mathematics | 2 | 0.9% |
| Bio, Nature & Agricultural | 18 | 7.9% |
| Physical & Health Sciences | 0 | 0.0% |
| Psychology | 18 | 7.9% |
| Social Sciences | 21 | 9.2% |
| Engineering | 4 | 1.8% |
| Multidisciplinary Studies | 0 | 0.0% |
| Science & Technology | 30 | 13.2% |
| Business | 54 | 23.7% |
| Education | 30 | 13.2% |
| Literature & Languages | 10 | 4.4% |
| Liberal Arts & History | 11 | 4.8% |
| Visual & Performing Arts | 13 | 5.7% |
| Communications | 0 | 0.0% |
| Arts & Humanities | 17 | 7.5% |
| Total | 228 | 100.0% |
Transportation & Commute in Leawood
Vehicle Availability by Sex in Leawood
The most prevalent vehicle ownership categories in Leawood are males with 2 vehicles (99, accounting for 62.7%) and females with 2 vehicles (61, making up 64.3%).
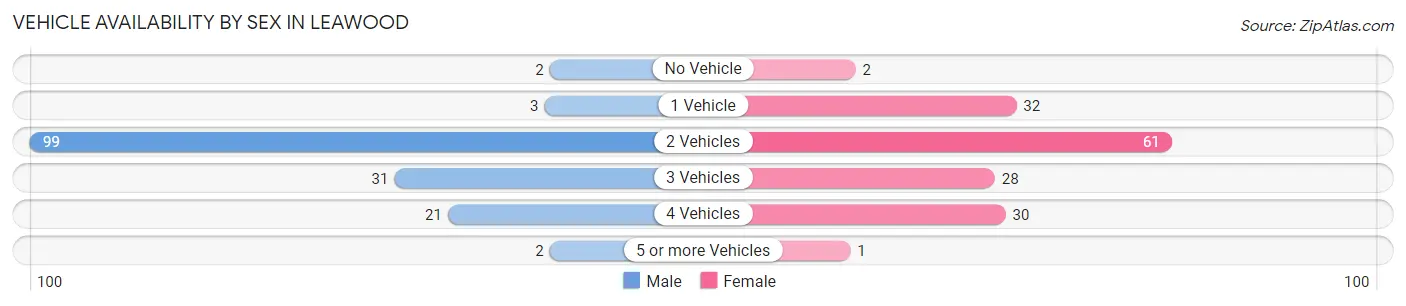
| Vehicles Available | Male | Female |
| No Vehicle | 2 (1.3%) | 2 (1.3%) |
| 1 Vehicle | 3 (1.9%) | 32 (20.8%) |
| 2 Vehicles | 99 (62.7%) | 61 (39.6%) |
| 3 Vehicles | 31 (19.6%) | 28 (18.2%) |
| 4 Vehicles | 21 (13.3%) | 30 (19.5%) |
| 5 or more Vehicles | 2 (1.3%) | 1 (0.6%) |
| Total | 158 (100.0%) | 154 (100.0%) |
Commute Time in Leawood
The most frequently occuring commute durations in Leawood are 15 to 19 minutes (101 commuters, 34.5%), 10 to 14 minutes (84 commuters, 28.7%), and 5 to 9 minutes (58 commuters, 19.8%).
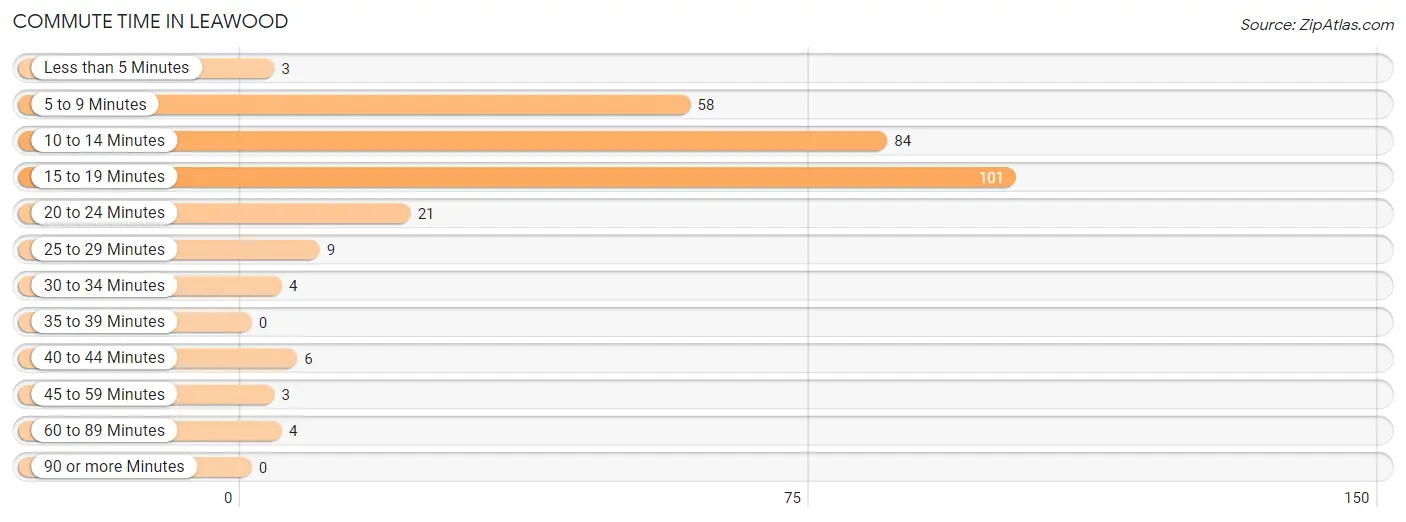
| Commute Time | # Commuters | % Commuters |
| Less than 5 Minutes | 3 | 1.0% |
| 5 to 9 Minutes | 58 | 19.8% |
| 10 to 14 Minutes | 84 | 28.7% |
| 15 to 19 Minutes | 101 | 34.5% |
| 20 to 24 Minutes | 21 | 7.2% |
| 25 to 29 Minutes | 9 | 3.1% |
| 30 to 34 Minutes | 4 | 1.4% |
| 35 to 39 Minutes | 0 | 0.0% |
| 40 to 44 Minutes | 6 | 2.1% |
| 45 to 59 Minutes | 3 | 1.0% |
| 60 to 89 Minutes | 4 | 1.4% |
| 90 or more Minutes | 0 | 0.0% |
Commute Time by Sex in Leawood
The most common commute times in Leawood are 15 to 19 minutes (58 commuters, 38.4%) for males and 10 to 14 minutes (43 commuters, 30.3%) for females.
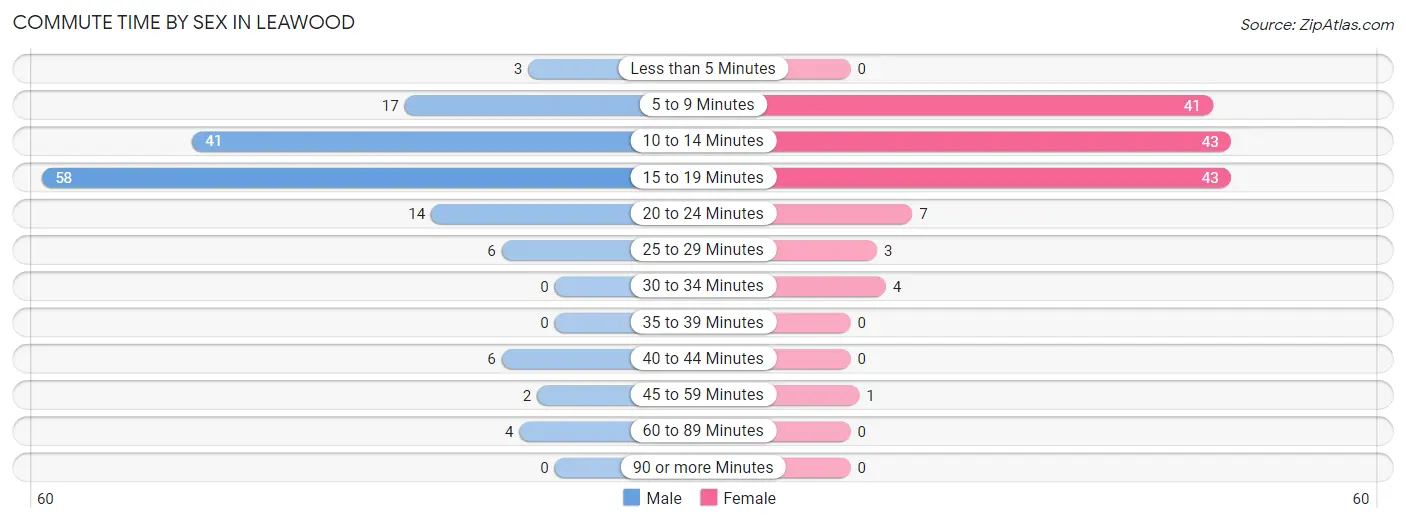
| Commute Time | Male | Female |
| Less than 5 Minutes | 3 (2.0%) | 0 (0.0%) |
| 5 to 9 Minutes | 17 (11.3%) | 41 (28.9%) |
| 10 to 14 Minutes | 41 (27.2%) | 43 (30.3%) |
| 15 to 19 Minutes | 58 (38.4%) | 43 (30.3%) |
| 20 to 24 Minutes | 14 (9.3%) | 7 (4.9%) |
| 25 to 29 Minutes | 6 (4.0%) | 3 (2.1%) |
| 30 to 34 Minutes | 0 (0.0%) | 4 (2.8%) |
| 35 to 39 Minutes | 0 (0.0%) | 0 (0.0%) |
| 40 to 44 Minutes | 6 (4.0%) | 0 (0.0%) |
| 45 to 59 Minutes | 2 (1.3%) | 1 (0.7%) |
| 60 to 89 Minutes | 4 (2.6%) | 0 (0.0%) |
| 90 or more Minutes | 0 (0.0%) | 0 (0.0%) |
Time of Departure to Work by Sex in Leawood
The most frequent times of departure to work in Leawood are 6:30 AM to 6:59 AM (38, 25.2%) for males and 8:00 AM to 8:29 AM (31, 21.8%) for females.
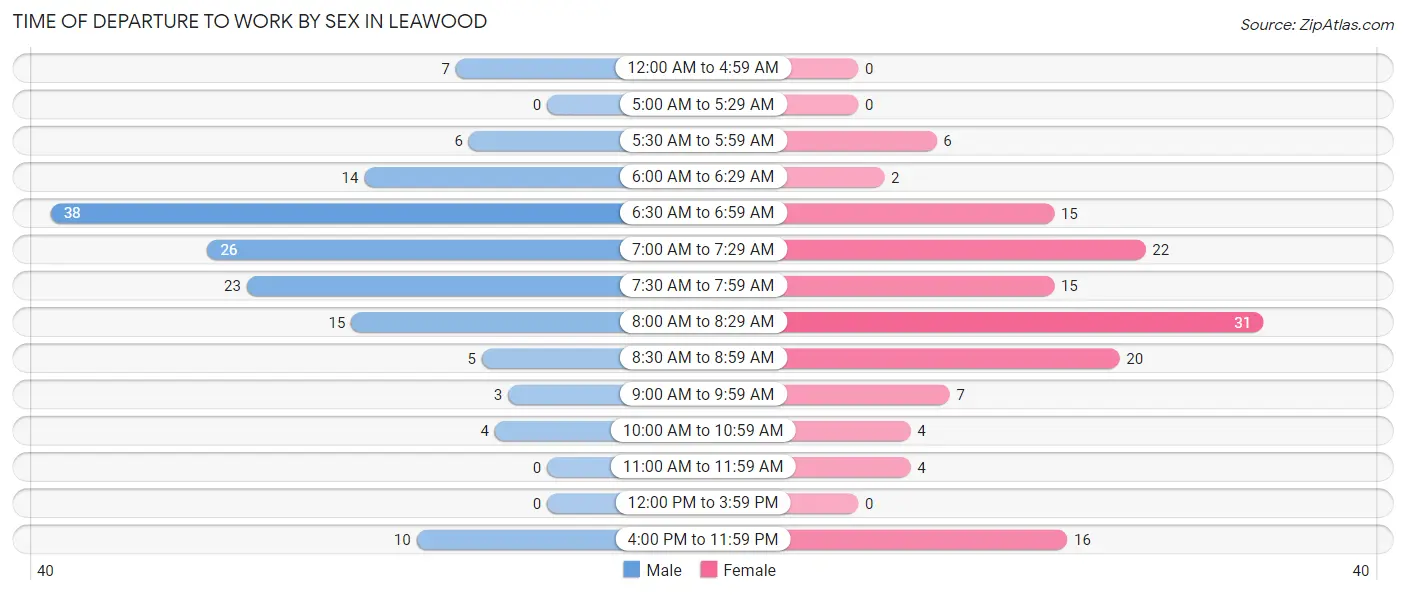
| Time of Departure | Male | Female |
| 12:00 AM to 4:59 AM | 7 (4.6%) | 0 (0.0%) |
| 5:00 AM to 5:29 AM | 0 (0.0%) | 0 (0.0%) |
| 5:30 AM to 5:59 AM | 6 (4.0%) | 6 (4.2%) |
| 6:00 AM to 6:29 AM | 14 (9.3%) | 2 (1.4%) |
| 6:30 AM to 6:59 AM | 38 (25.2%) | 15 (10.6%) |
| 7:00 AM to 7:29 AM | 26 (17.2%) | 22 (15.5%) |
| 7:30 AM to 7:59 AM | 23 (15.2%) | 15 (10.6%) |
| 8:00 AM to 8:29 AM | 15 (9.9%) | 31 (21.8%) |
| 8:30 AM to 8:59 AM | 5 (3.3%) | 20 (14.1%) |
| 9:00 AM to 9:59 AM | 3 (2.0%) | 7 (4.9%) |
| 10:00 AM to 10:59 AM | 4 (2.6%) | 4 (2.8%) |
| 11:00 AM to 11:59 AM | 0 (0.0%) | 4 (2.8%) |
| 12:00 PM to 3:59 PM | 0 (0.0%) | 0 (0.0%) |
| 4:00 PM to 11:59 PM | 10 (6.6%) | 16 (11.3%) |
| Total | 151 (100.0%) | 142 (100.0%) |
Housing Occupancy in Leawood
Occupancy by Ownership in Leawood
Of the total 263 dwellings in Leawood, owner-occupied units account for 228 (86.7%), while renter-occupied units make up 35 (13.3%).
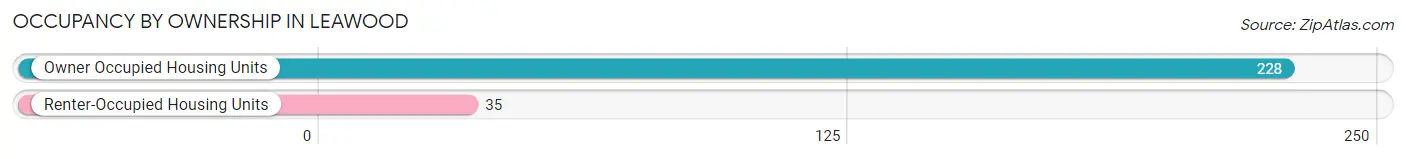
| Occupancy | # Housing Units | % Housing Units |
| Owner Occupied Housing Units | 228 | 86.7% |
| Renter-Occupied Housing Units | 35 | 13.3% |
| Total Occupied Housing Units | 263 | 100.0% |
Occupancy by Household Size in Leawood
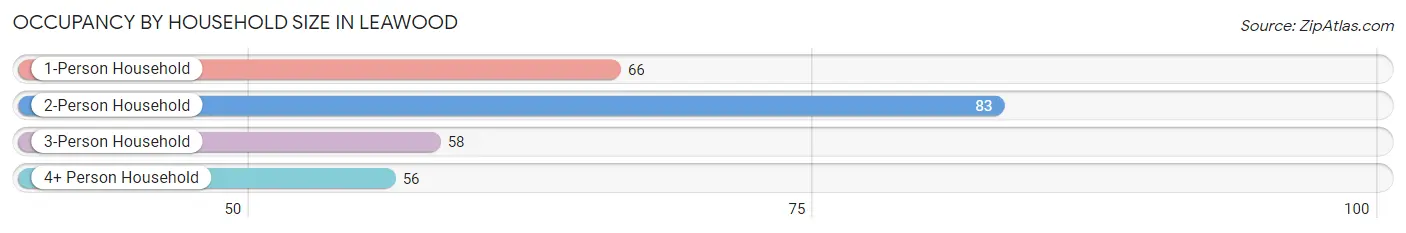
| Household Size | # Housing Units | % Housing Units |
| 1-Person Household | 66 | 25.1% |
| 2-Person Household | 83 | 31.6% |
| 3-Person Household | 58 | 22.1% |
| 4+ Person Household | 56 | 21.3% |
| Total Housing Units | 263 | 100.0% |
Occupancy by Ownership by Household Size in Leawood
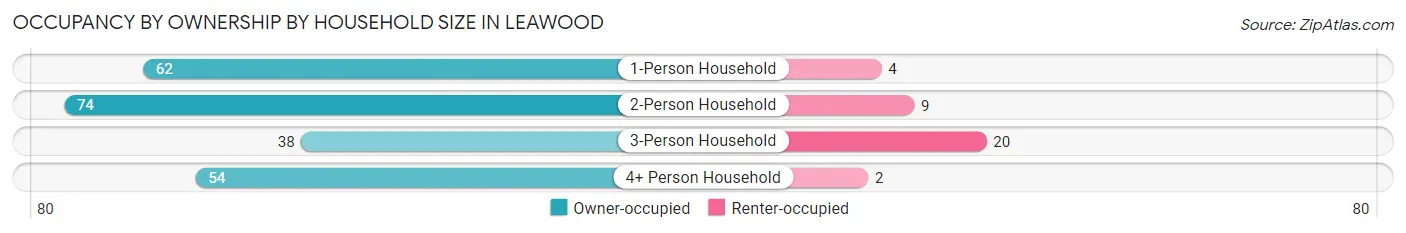
| Household Size | Owner-occupied | Renter-occupied |
| 1-Person Household | 62 (93.9%) | 4 (6.1%) |
| 2-Person Household | 74 (89.2%) | 9 (10.8%) |
| 3-Person Household | 38 (65.5%) | 20 (34.5%) |
| 4+ Person Household | 54 (96.4%) | 2 (3.6%) |
| Total Housing Units | 228 (86.7%) | 35 (13.3%) |
Occupancy by Educational Attainment in Leawood
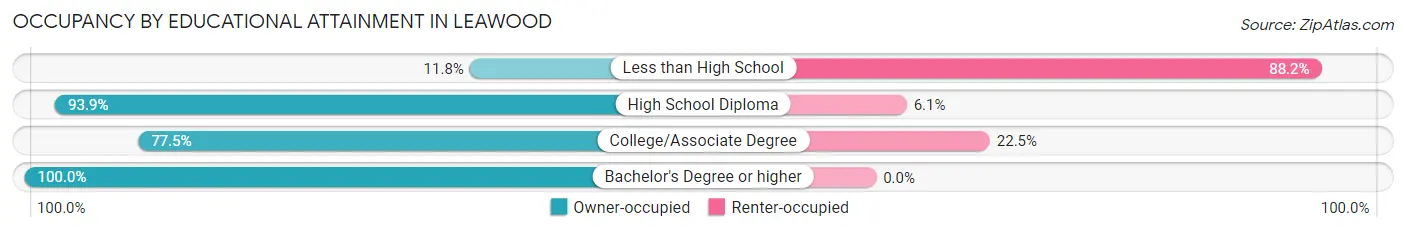
| Household Size | Owner-occupied | Renter-occupied |
| Less than High School | 2 (11.8%) | 15 (88.2%) |
| High School Diploma | 62 (93.9%) | 4 (6.1%) |
| College/Associate Degree | 55 (77.5%) | 16 (22.5%) |
| Bachelor's Degree or higher | 109 (100.0%) | 0 (0.0%) |
Occupancy by Age of Householder in Leawood
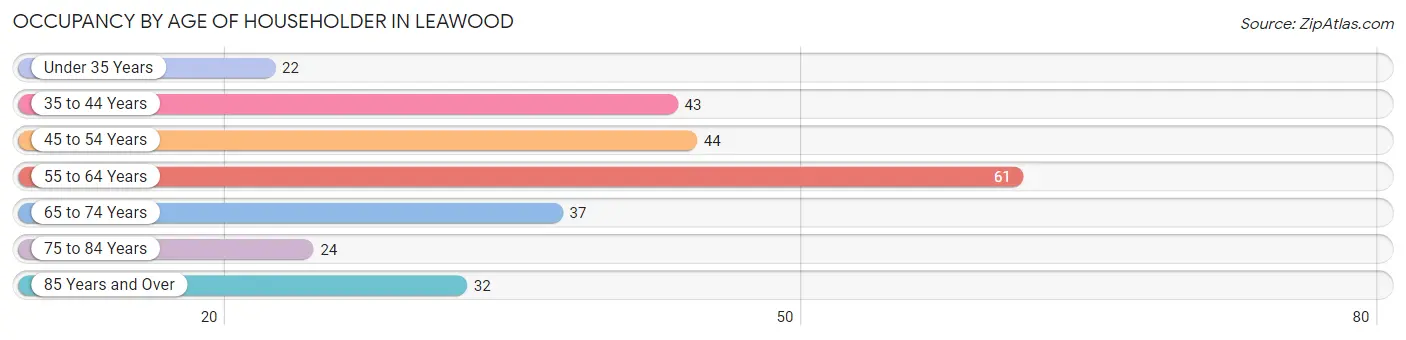
| Age Bracket | # Households | % Households |
| Under 35 Years | 22 | 8.4% |
| 35 to 44 Years | 43 | 16.4% |
| 45 to 54 Years | 44 | 16.7% |
| 55 to 64 Years | 61 | 23.2% |
| 65 to 74 Years | 37 | 14.1% |
| 75 to 84 Years | 24 | 9.1% |
| 85 Years and Over | 32 | 12.2% |
| Total | 263 | 100.0% |
Housing Finances in Leawood
Median Income by Occupancy in Leawood
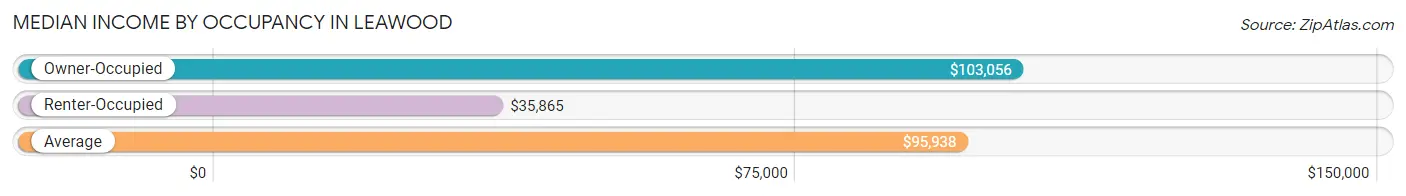
| Occupancy Type | # Households | Median Income |
| Owner-Occupied | 228 (86.7%) | $103,056 |
| Renter-Occupied | 35 (13.3%) | $35,865 |
| Average | 263 (100.0%) | $95,938 |
Occupancy by Householder Income Bracket in Leawood
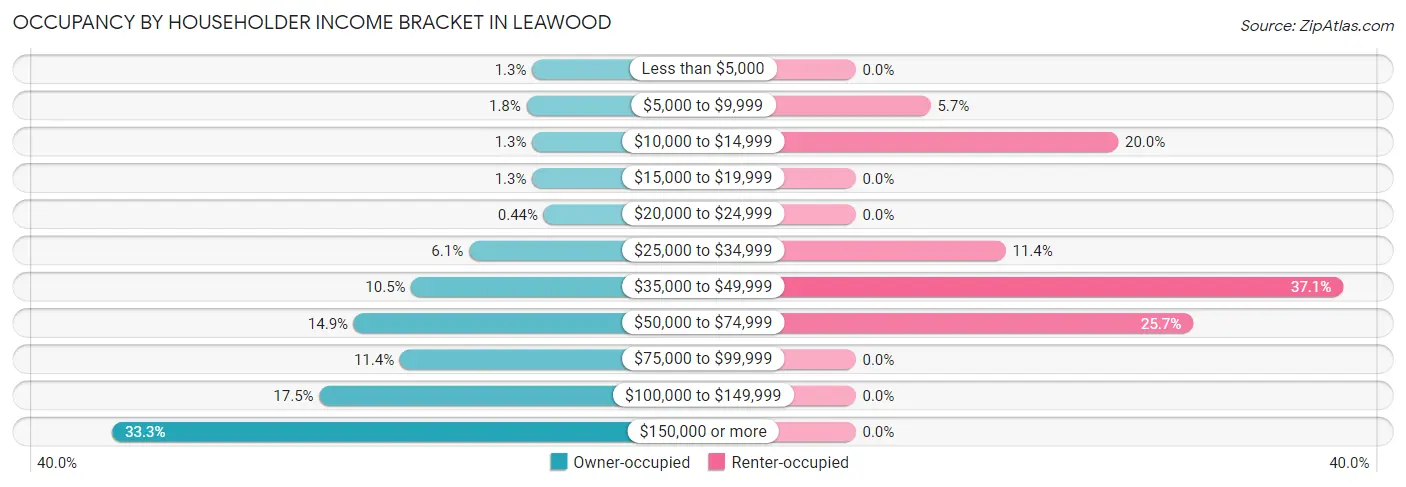
| Income Bracket | Owner-occupied | Renter-occupied |
| Less than $5,000 | 3 (1.3%) | 0 (0.0%) |
| $5,000 to $9,999 | 4 (1.8%) | 2 (5.7%) |
| $10,000 to $14,999 | 3 (1.3%) | 7 (20.0%) |
| $15,000 to $19,999 | 3 (1.3%) | 0 (0.0%) |
| $20,000 to $24,999 | 1 (0.4%) | 0 (0.0%) |
| $25,000 to $34,999 | 14 (6.1%) | 4 (11.4%) |
| $35,000 to $49,999 | 24 (10.5%) | 13 (37.1%) |
| $50,000 to $74,999 | 34 (14.9%) | 9 (25.7%) |
| $75,000 to $99,999 | 26 (11.4%) | 0 (0.0%) |
| $100,000 to $149,999 | 40 (17.5%) | 0 (0.0%) |
| $150,000 or more | 76 (33.3%) | 0 (0.0%) |
| Total | 228 (100.0%) | 35 (100.0%) |
Monthly Housing Cost Tiers in Leawood
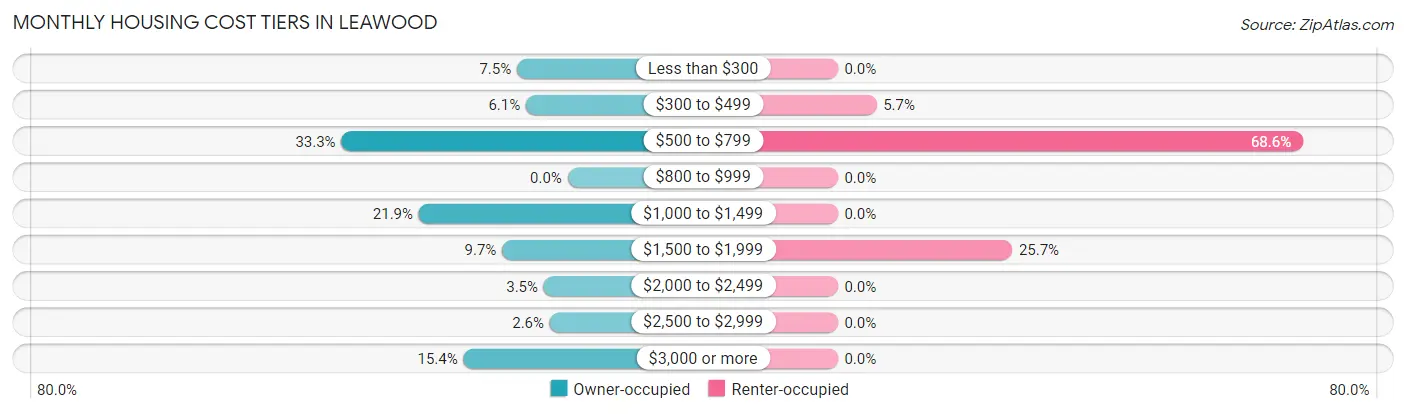
| Monthly Cost | Owner-occupied | Renter-occupied |
| Less than $300 | 17 (7.5%) | 0 (0.0%) |
| $300 to $499 | 14 (6.1%) | 2 (5.7%) |
| $500 to $799 | 76 (33.3%) | 24 (68.6%) |
| $800 to $999 | 0 (0.0%) | 0 (0.0%) |
| $1,000 to $1,499 | 50 (21.9%) | 0 (0.0%) |
| $1,500 to $1,999 | 22 (9.7%) | 9 (25.7%) |
| $2,000 to $2,499 | 8 (3.5%) | 0 (0.0%) |
| $2,500 to $2,999 | 6 (2.6%) | 0 (0.0%) |
| $3,000 or more | 35 (15.3%) | 0 (0.0%) |
| Total | 228 (100.0%) | 35 (100.0%) |
Physical Housing Characteristics in Leawood
Housing Structures in Leawood
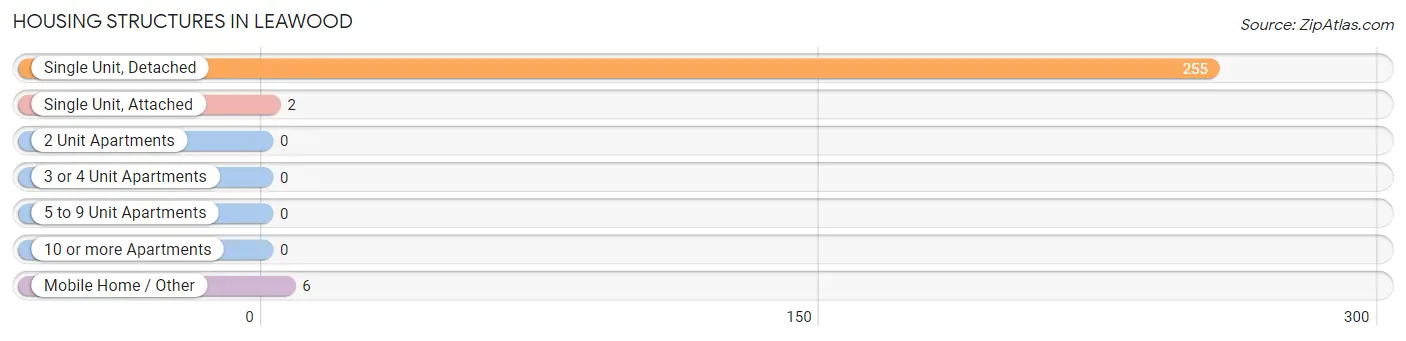
| Structure Type | # Housing Units | % Housing Units |
| Single Unit, Detached | 255 | 97.0% |
| Single Unit, Attached | 2 | 0.8% |
| 2 Unit Apartments | 0 | 0.0% |
| 3 or 4 Unit Apartments | 0 | 0.0% |
| 5 to 9 Unit Apartments | 0 | 0.0% |
| 10 or more Apartments | 0 | 0.0% |
| Mobile Home / Other | 6 | 2.3% |
| Total | 263 | 100.0% |
Housing Structures by Occupancy in Leawood
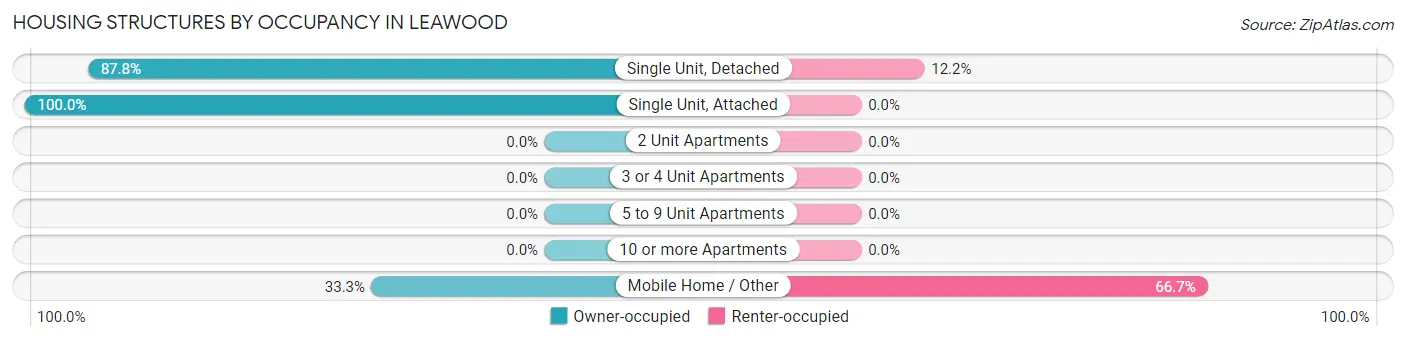
| Structure Type | Owner-occupied | Renter-occupied |
| Single Unit, Detached | 224 (87.8%) | 31 (12.2%) |
| Single Unit, Attached | 2 (100.0%) | 0 (0.0%) |
| 2 Unit Apartments | 0 (0.0%) | 0 (0.0%) |
| 3 or 4 Unit Apartments | 0 (0.0%) | 0 (0.0%) |
| 5 to 9 Unit Apartments | 0 (0.0%) | 0 (0.0%) |
| 10 or more Apartments | 0 (0.0%) | 0 (0.0%) |
| Mobile Home / Other | 2 (33.3%) | 4 (66.7%) |
| Total | 228 (86.7%) | 35 (13.3%) |
Housing Structures by Number of Rooms in Leawood
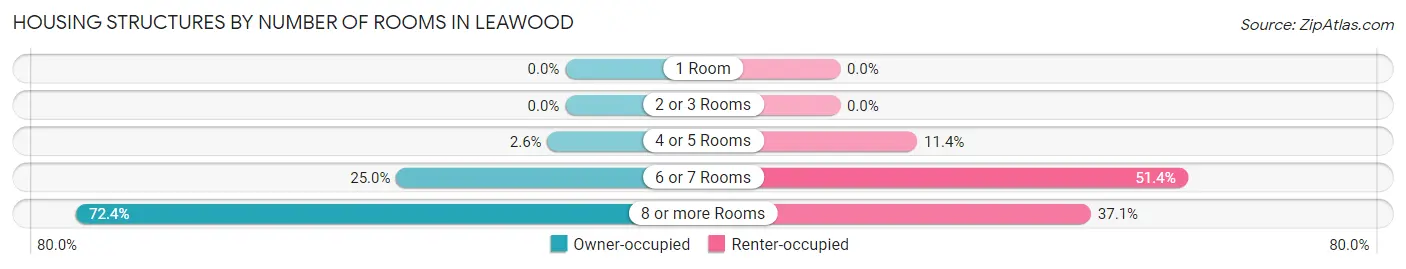
| Number of Rooms | Owner-occupied | Renter-occupied |
| 1 Room | 0 (0.0%) | 0 (0.0%) |
| 2 or 3 Rooms | 0 (0.0%) | 0 (0.0%) |
| 4 or 5 Rooms | 6 (2.6%) | 4 (11.4%) |
| 6 or 7 Rooms | 57 (25.0%) | 18 (51.4%) |
| 8 or more Rooms | 165 (72.4%) | 13 (37.1%) |
| Total | 228 (100.0%) | 35 (100.0%) |
Housing Structure by Heating Type in Leawood
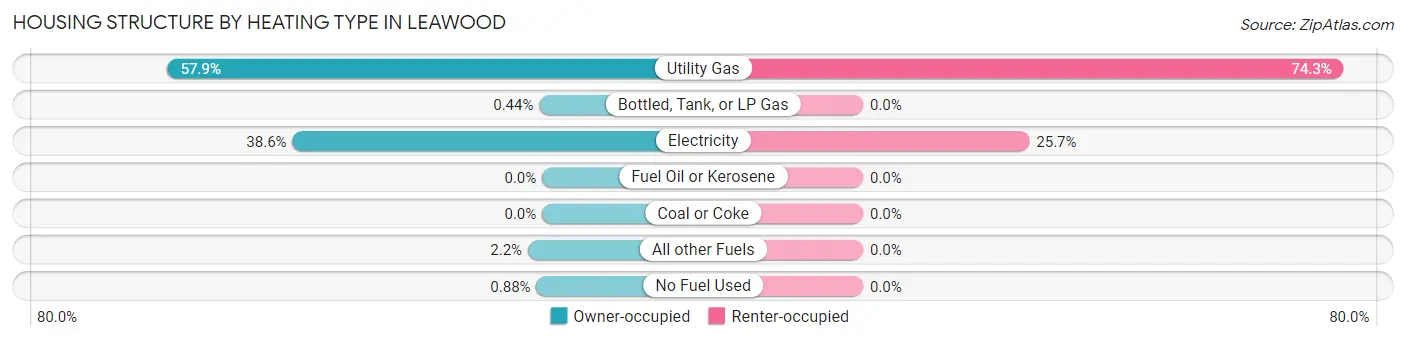
| Heating Type | Owner-occupied | Renter-occupied |
| Utility Gas | 132 (57.9%) | 26 (74.3%) |
| Bottled, Tank, or LP Gas | 1 (0.4%) | 0 (0.0%) |
| Electricity | 88 (38.6%) | 9 (25.7%) |
| Fuel Oil or Kerosene | 0 (0.0%) | 0 (0.0%) |
| Coal or Coke | 0 (0.0%) | 0 (0.0%) |
| All other Fuels | 5 (2.2%) | 0 (0.0%) |
| No Fuel Used | 2 (0.9%) | 0 (0.0%) |
| Total | 228 (100.0%) | 35 (100.0%) |
Household Vehicle Usage in Leawood
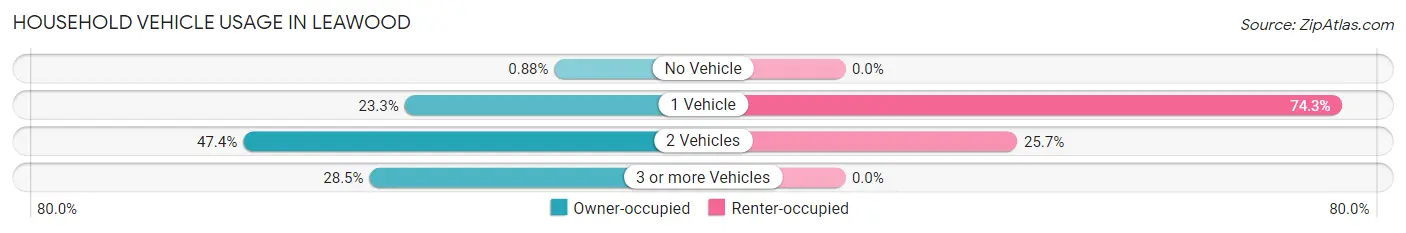
| Vehicles per Household | Owner-occupied | Renter-occupied |
| No Vehicle | 2 (0.9%) | 0 (0.0%) |
| 1 Vehicle | 53 (23.3%) | 26 (74.3%) |
| 2 Vehicles | 108 (47.4%) | 9 (25.7%) |
| 3 or more Vehicles | 65 (28.5%) | 0 (0.0%) |
| Total | 228 (100.0%) | 35 (100.0%) |
Real Estate & Mortgages in Leawood
Real Estate and Mortgage Overview in Leawood
| Characteristic | Without Mortgage | With Mortgage |
| Housing Units | 114 | 114 |
| Median Property Value | $205,000 | $282,500 |
| Median Household Income | $71,429 | $54 |
| Monthly Housing Costs | $596 | $35 |
| Real Estate Taxes | $1,533 | $2 |
Property Value by Mortgage Status in Leawood
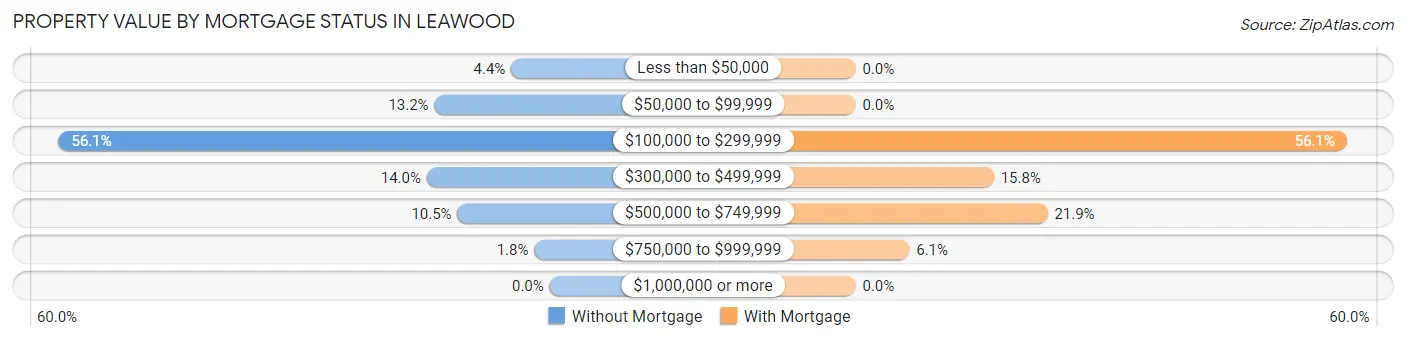
| Property Value | Without Mortgage | With Mortgage |
| Less than $50,000 | 5 (4.4%) | 0 (0.0%) |
| $50,000 to $99,999 | 15 (13.2%) | 0 (0.0%) |
| $100,000 to $299,999 | 64 (56.1%) | 64 (56.1%) |
| $300,000 to $499,999 | 16 (14.0%) | 18 (15.8%) |
| $500,000 to $749,999 | 12 (10.5%) | 25 (21.9%) |
| $750,000 to $999,999 | 2 (1.8%) | 7 (6.1%) |
| $1,000,000 or more | 0 (0.0%) | 0 (0.0%) |
| Total | 114 (100.0%) | 114 (100.0%) |
Household Income by Mortgage Status in Leawood
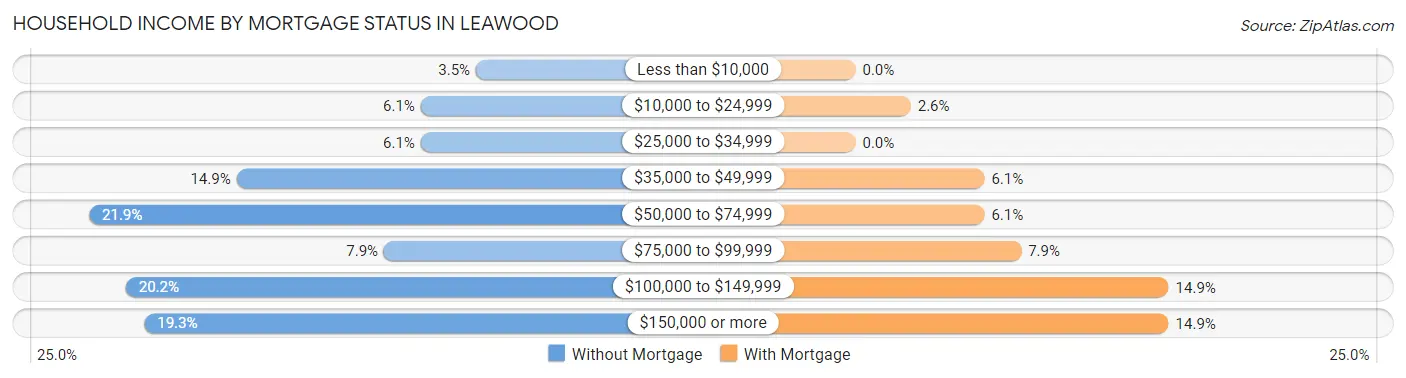
| Household Income | Without Mortgage | With Mortgage |
| Less than $10,000 | 4 (3.5%) | 0 (0.0%) |
| $10,000 to $24,999 | 7 (6.1%) | 3 (2.6%) |
| $25,000 to $34,999 | 7 (6.1%) | 0 (0.0%) |
| $35,000 to $49,999 | 17 (14.9%) | 7 (6.1%) |
| $50,000 to $74,999 | 25 (21.9%) | 7 (6.1%) |
| $75,000 to $99,999 | 9 (7.9%) | 9 (7.9%) |
| $100,000 to $149,999 | 23 (20.2%) | 17 (14.9%) |
| $150,000 or more | 22 (19.3%) | 17 (14.9%) |
| Total | 114 (100.0%) | 114 (100.0%) |
Property Value to Household Income Ratio in Leawood
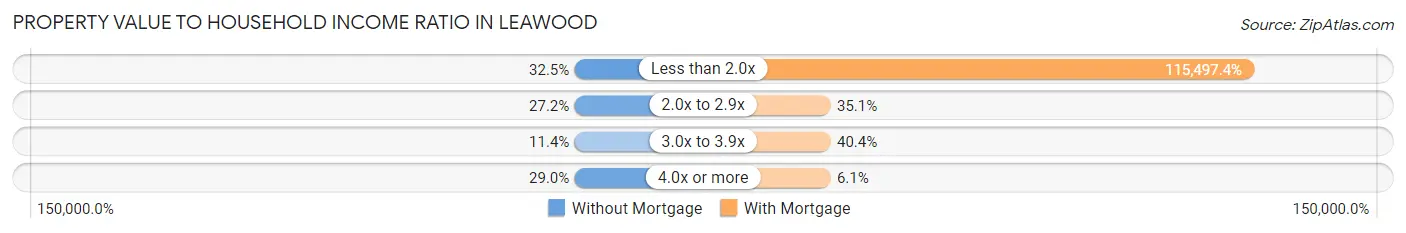
| Value-to-Income Ratio | Without Mortgage | With Mortgage |
| Less than 2.0x | 37 (32.5%) | 131,667 (115,497.4%) |
| 2.0x to 2.9x | 31 (27.2%) | 40 (35.1%) |
| 3.0x to 3.9x | 13 (11.4%) | 46 (40.4%) |
| 4.0x or more | 33 (28.9%) | 7 (6.1%) |
| Total | 114 (100.0%) | 114 (100.0%) |
Real Estate Taxes by Mortgage Status in Leawood
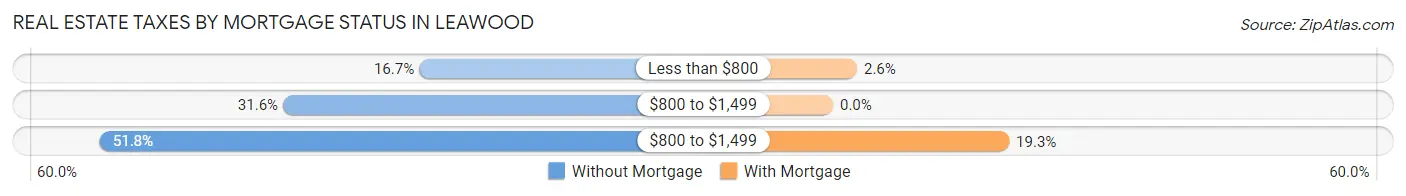
| Property Taxes | Without Mortgage | With Mortgage |
| Less than $800 | 19 (16.7%) | 3 (2.6%) |
| $800 to $1,499 | 36 (31.6%) | 0 (0.0%) |
| $800 to $1,499 | 59 (51.7%) | 22 (19.3%) |
| Total | 114 (100.0%) | 114 (100.0%) |
Health & Disability in Leawood
Health Insurance Coverage by Age in Leawood
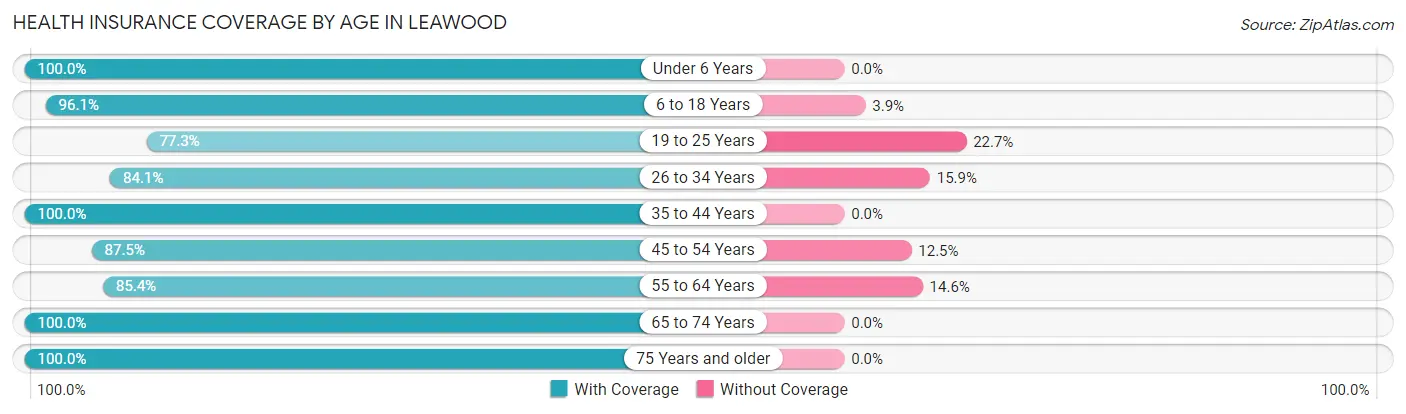
| Age Bracket | With Coverage | Without Coverage |
| Under 6 Years | 21 (100.0%) | 0 (0.0%) |
| 6 to 18 Years | 171 (96.1%) | 7 (3.9%) |
| 19 to 25 Years | 17 (77.3%) | 5 (22.7%) |
| 26 to 34 Years | 58 (84.1%) | 11 (15.9%) |
| 35 to 44 Years | 87 (100.0%) | 0 (0.0%) |
| 45 to 54 Years | 77 (87.5%) | 11 (12.5%) |
| 55 to 64 Years | 76 (85.4%) | 13 (14.6%) |
| 65 to 74 Years | 74 (100.0%) | 0 (0.0%) |
| 75 Years and older | 64 (100.0%) | 0 (0.0%) |
| Total | 645 (93.2%) | 47 (6.8%) |
Health Insurance Coverage by Citizenship Status in Leawood
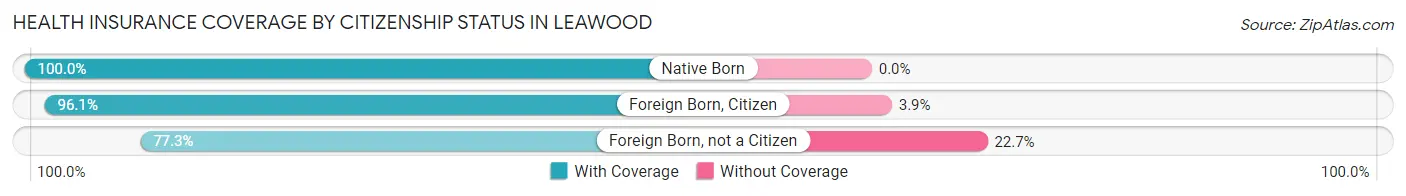
| Citizenship Status | With Coverage | Without Coverage |
| Native Born | 21 (100.0%) | 0 (0.0%) |
| Foreign Born, Citizen | 171 (96.1%) | 7 (3.9%) |
| Foreign Born, not a Citizen | 17 (77.3%) | 5 (22.7%) |
Health Insurance Coverage by Household Income in Leawood
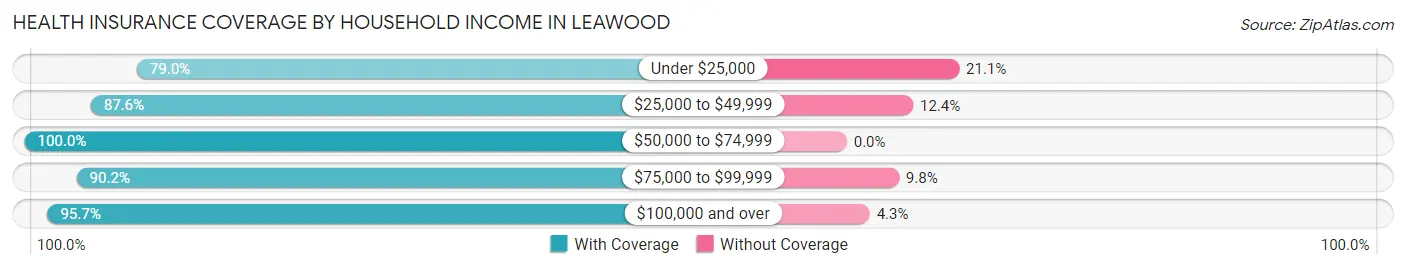
| Household Income | With Coverage | Without Coverage |
| Under $25,000 | 30 (78.9%) | 8 (21.0%) |
| $25,000 to $49,999 | 120 (87.6%) | 17 (12.4%) |
| $50,000 to $74,999 | 109 (100.0%) | 0 (0.0%) |
| $75,000 to $99,999 | 74 (90.2%) | 8 (9.8%) |
| $100,000 and over | 312 (95.7%) | 14 (4.3%) |
Public vs Private Health Insurance Coverage by Age in Leawood
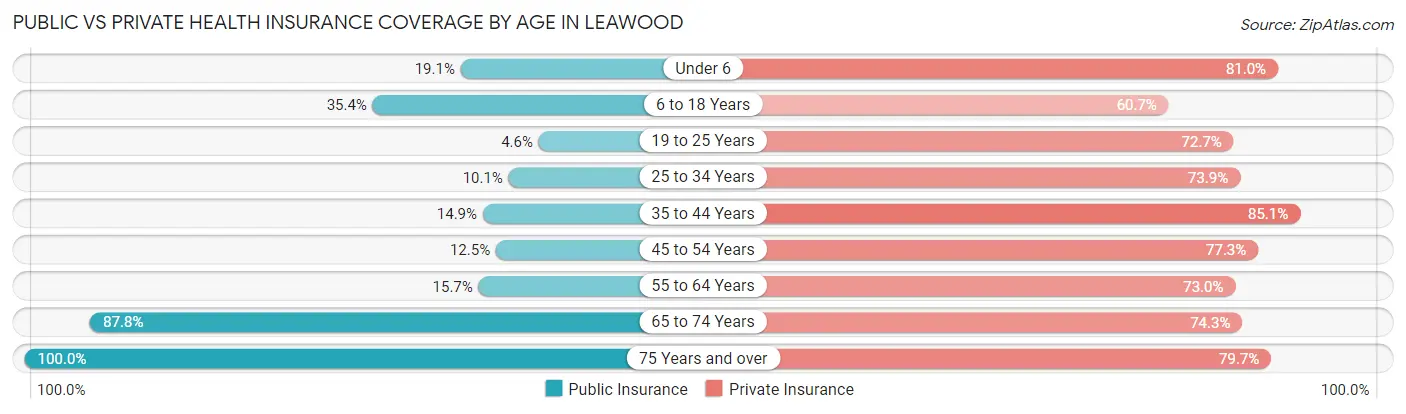
| Age Bracket | Public Insurance | Private Insurance |
| Under 6 | 4 (19.1%) | 17 (80.9%) |
| 6 to 18 Years | 63 (35.4%) | 108 (60.7%) |
| 19 to 25 Years | 1 (4.5%) | 16 (72.7%) |
| 25 to 34 Years | 7 (10.1%) | 51 (73.9%) |
| 35 to 44 Years | 13 (14.9%) | 74 (85.1%) |
| 45 to 54 Years | 11 (12.5%) | 68 (77.3%) |
| 55 to 64 Years | 14 (15.7%) | 65 (73.0%) |
| 65 to 74 Years | 65 (87.8%) | 55 (74.3%) |
| 75 Years and over | 64 (100.0%) | 51 (79.7%) |
| Total | 242 (35.0%) | 505 (73.0%) |
Disability Status by Sex by Age in Leawood
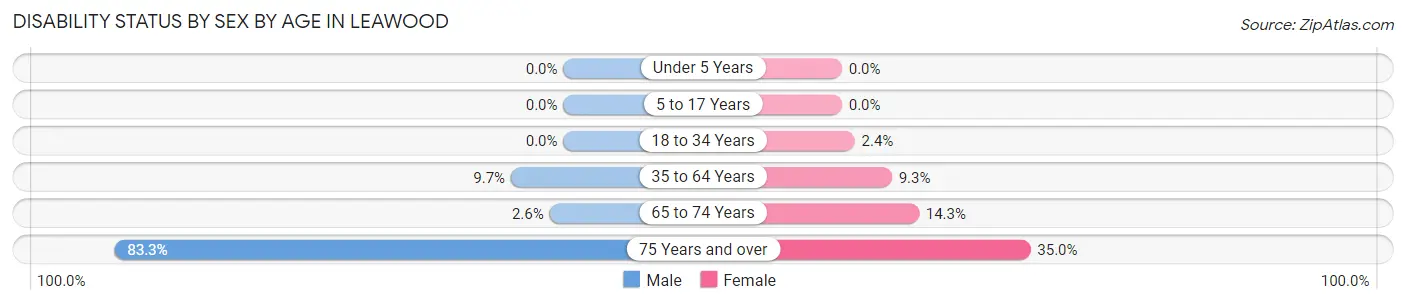
| Age Bracket | Male | Female |
| Under 5 Years | 0 (0.0%) | 0 (0.0%) |
| 5 to 17 Years | 0 (0.0%) | 0 (0.0%) |
| 18 to 34 Years | 0 (0.0%) | 1 (2.4%) |
| 35 to 64 Years | 11 (9.7%) | 14 (9.3%) |
| 65 to 74 Years | 1 (2.6%) | 5 (14.3%) |
| 75 Years and over | 20 (83.3%) | 14 (35.0%) |
Disability Class by Sex by Age in Leawood
Disability Class: Hearing Difficulty
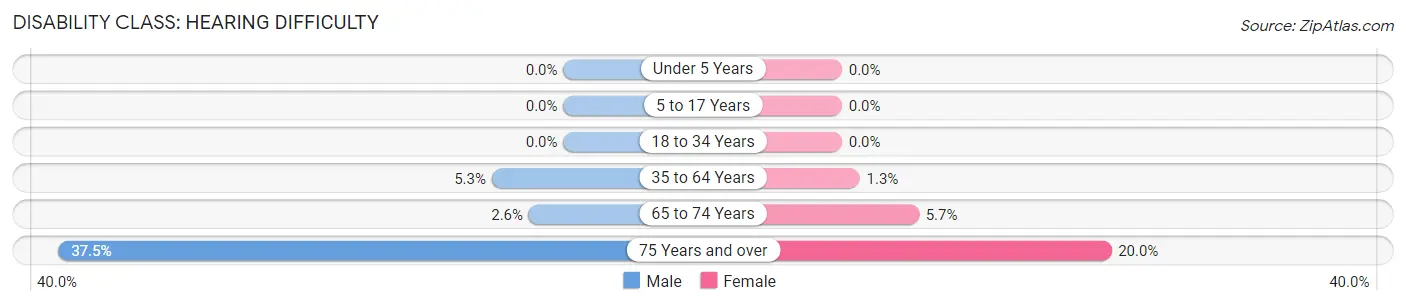
| Age Bracket | Male | Female |
| Under 5 Years | 0 (0.0%) | 0 (0.0%) |
| 5 to 17 Years | 0 (0.0%) | 0 (0.0%) |
| 18 to 34 Years | 0 (0.0%) | 0 (0.0%) |
| 35 to 64 Years | 6 (5.3%) | 2 (1.3%) |
| 65 to 74 Years | 1 (2.6%) | 2 (5.7%) |
| 75 Years and over | 9 (37.5%) | 8 (20.0%) |
Disability Class: Vision Difficulty
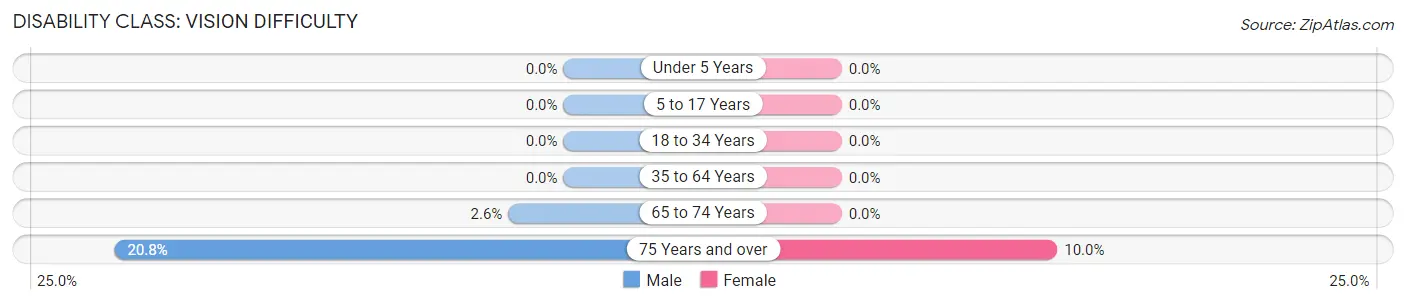
| Age Bracket | Male | Female |
| Under 5 Years | 0 (0.0%) | 0 (0.0%) |
| 5 to 17 Years | 0 (0.0%) | 0 (0.0%) |
| 18 to 34 Years | 0 (0.0%) | 0 (0.0%) |
| 35 to 64 Years | 0 (0.0%) | 0 (0.0%) |
| 65 to 74 Years | 1 (2.6%) | 0 (0.0%) |
| 75 Years and over | 5 (20.8%) | 4 (10.0%) |
Disability Class: Cognitive Difficulty
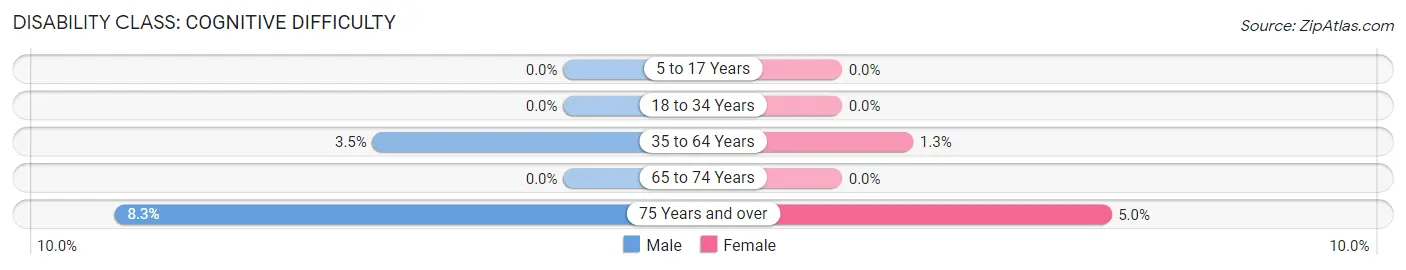
| Age Bracket | Male | Female |
| 5 to 17 Years | 0 (0.0%) | 0 (0.0%) |
| 18 to 34 Years | 0 (0.0%) | 0 (0.0%) |
| 35 to 64 Years | 4 (3.5%) | 2 (1.3%) |
| 65 to 74 Years | 0 (0.0%) | 0 (0.0%) |
| 75 Years and over | 2 (8.3%) | 2 (5.0%) |
Disability Class: Ambulatory Difficulty
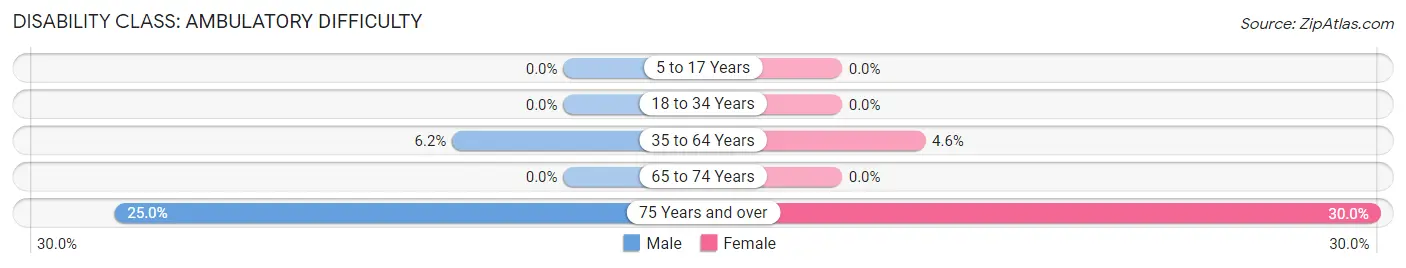
| Age Bracket | Male | Female |
| 5 to 17 Years | 0 (0.0%) | 0 (0.0%) |
| 18 to 34 Years | 0 (0.0%) | 0 (0.0%) |
| 35 to 64 Years | 7 (6.2%) | 7 (4.6%) |
| 65 to 74 Years | 0 (0.0%) | 0 (0.0%) |
| 75 Years and over | 6 (25.0%) | 12 (30.0%) |
Disability Class: Self-Care Difficulty
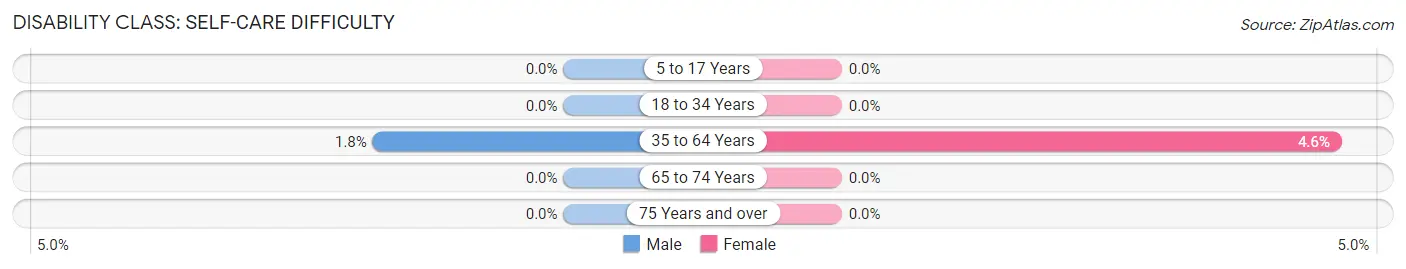
| Age Bracket | Male | Female |
| 5 to 17 Years | 0 (0.0%) | 0 (0.0%) |
| 18 to 34 Years | 0 (0.0%) | 0 (0.0%) |
| 35 to 64 Years | 2 (1.8%) | 7 (4.6%) |
| 65 to 74 Years | 0 (0.0%) | 0 (0.0%) |
| 75 Years and over | 0 (0.0%) | 0 (0.0%) |
Technology Access in Leawood
Computing Device Access in Leawood
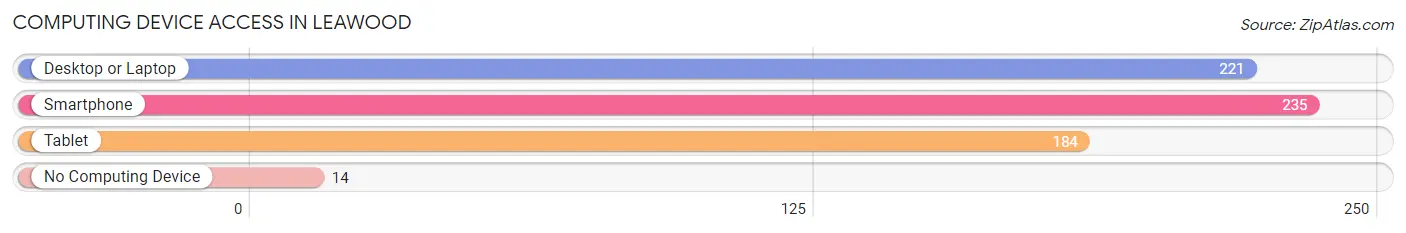
| Device Type | # Households | % Households |
| Desktop or Laptop | 221 | 84.0% |
| Smartphone | 235 | 89.3% |
| Tablet | 184 | 70.0% |
| No Computing Device | 14 | 5.3% |
| Total | 263 | 100.0% |
Internet Access in Leawood
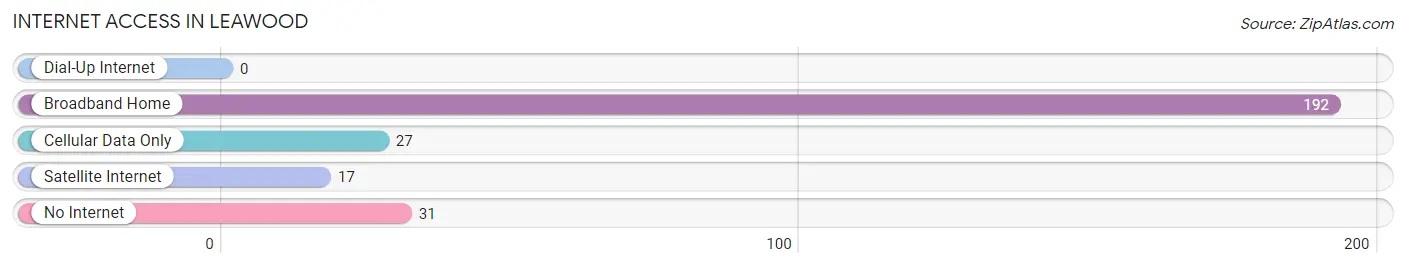
| Internet Type | # Households | % Households |
| Dial-Up Internet | 0 | 0.0% |
| Broadband Home | 192 | 73.0% |
| Cellular Data Only | 27 | 10.3% |
| Satellite Internet | 17 | 6.5% |
| No Internet | 31 | 11.8% |
| Total | 263 | 100.0% |
Leawood Summary
Leawood, Missouri is a small city located in the Kansas City metropolitan area in the state of Missouri. It is situated in the eastern part of Jackson County, and is bordered by the cities of Kansas City, Missouri, and Overland Park, Kansas. The city has a population of approximately 34,000 people, and is known for its high quality of life and strong economy.
History
Leawood was founded in 1887 by William B. Strang Jr., a prominent Kansas City businessman. Strang purchased a large tract of land in the area and began to develop it into a residential community. The city was named after Strang's daughter, Lea, and was incorporated in 1950.
In the early years, Leawood was a small farming community, but it began to grow rapidly in the 1950s and 1960s as the city became a popular suburb of Kansas City. The city experienced a period of rapid growth in the 1970s and 1980s, and by the 1990s, Leawood had become one of the most affluent cities in the Kansas City metropolitan area.
Geography
Leawood is located in the eastern part of Jackson County, and is bordered by the cities of Kansas City, Missouri, and Overland Park, Kansas. The city covers an area of approximately 10 square miles, and is situated at an elevation of 890 feet above sea level.
Leawood is located in the humid continental climate zone, and experiences hot, humid summers and cold, dry winters. The average annual temperature is 54 degrees Fahrenheit, and the average annual precipitation is 40 inches.
Economy
Leawood has a strong and diverse economy, with a variety of industries represented in the city. The largest employers in the city are the University of Kansas Medical Center, the University of Missouri-Kansas City, and the Kansas City Chiefs. Other major employers include the Hallmark Cards, Sprint, and the Federal Reserve Bank of Kansas City.
Leawood is also home to a number of corporate headquarters, including AMC Theatres, AMC Entertainment, and AMC Networks. The city is also home to a number of shopping centers, restaurants, and other businesses.
Demographics
As of the 2010 census, Leawood had a population of 34,227 people. The racial makeup of the city was 87.3% White, 5.2% African American, 0.3% Native American, 4.2% Asian, and 2.9% from other races. The median household income was $97,817, and the median family income was $112,817.
Leawood is a highly educated city, with over 90% of the population having at least a high school diploma, and over 50% having a bachelor's degree or higher. The city is also home to a number of religious institutions, including churches, synagogues, and mosques.
Common Questions
What is Per Capita Income in Leawood?
Per Capita income in Leawood is $52,958.
What is the Median Family Income in Leawood?
Median Family Income in Leawood is $99,135.
What is the Median Household income in Leawood?
Median Household Income in Leawood is $95,938.
What is Income or Wage Gap in Leawood?
Income or Wage Gap in Leawood is 29.5%.
Women in Leawood earn 70.5 cents for every dollar earned by a man.
What is Inequality or Gini Index in Leawood?
Inequality or Gini Index in Leawood is 0.51.
What is the Total Population of Leawood?
Total Population of Leawood is 692.
What is the Total Male Population of Leawood?
Total Male Population of Leawood is 323.
What is the Total Female Population of Leawood?
Total Female Population of Leawood is 369.
What is the Ratio of Males per 100 Females in Leawood?
There are 87.53 Males per 100 Females in Leawood.
What is the Ratio of Females per 100 Males in Leawood?
There are 114.24 Females per 100 Males in Leawood.
What is the Median Population Age in Leawood?
Median Population Age in Leawood is 40.3 Years.
What is the Average Family Size in Leawood
Average Family Size in Leawood is 3.2 People.
What is the Average Household Size in Leawood
Average Household Size in Leawood is 2.6 People.
How Large is the Labor Force in Leawood?
There are 319 People in the Labor Forcein in Leawood.
What is the Percentage of People in the Labor Force in Leawood?
61.8% of People are in the Labor Force in Leawood.
What is the Unemployment Rate in Leawood?
Unemployment Rate in Leawood is 0.9%.