Crestwood, MO Map & Demographics
Crestwood Map
Crestwood Overview
$48,384
PER CAPITA INCOME
$124,878
AVG FAMILY INCOME
$111,791
AVG HOUSEHOLD INCOME
25.0%
WAGE / INCOME GAP [ % ]
75.0¢/ $1
WAGE / INCOME GAP [ $ ]
0.36
INEQUALITY / GINI INDEX
12,315
TOTAL POPULATION
6,004
MALE POPULATION
6,311
FEMALE POPULATION
95.14
MALES / 100 FEMALES
105.11
FEMALES / 100 MALES
42.1
MEDIAN AGE
2.9
AVG FAMILY SIZE
2.5
AVG HOUSEHOLD SIZE
6,787
LABOR FORCE [ PEOPLE ]
67.9%
PERCENT IN LABOR FORCE
1.4%
UNEMPLOYMENT RATE
Income in Crestwood
Income Overview in Crestwood
Per Capita Income in Crestwood is $48,384, while median incomes of families and households are $124,878 and $111,791 respectively.
| Characteristic | Number | Measure |
| Per Capita Income | 12,315 | $48,384 |
| Median Family Income | 3,646 | $124,878 |
| Mean Family Income | 3,646 | $137,266 |
| Median Household Income | 4,827 | $111,791 |
| Mean Household Income | 4,827 | $123,126 |
| Income Deficit | 3,646 | $0 |
| Wage / Income Gap (%) | 12,315 | 24.98% |
| Wage / Income Gap ($) | 12,315 | 75.02¢ per $1 |
| Gini / Inequality Index | 12,315 | 0.36 |
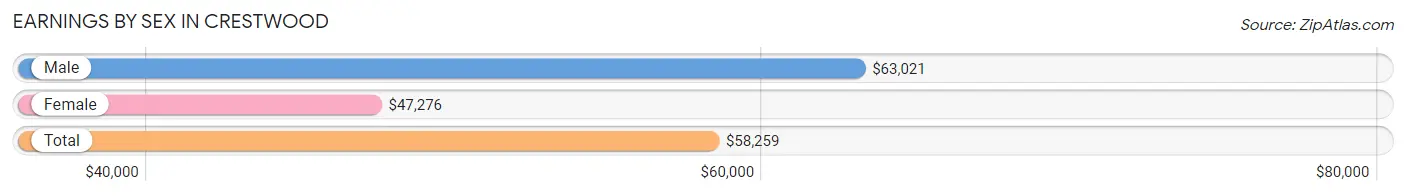
Earnings by Sex in Crestwood
Average Earnings in Crestwood are $58,259, $63,021 for men and $47,276 for women, a difference of 25.0%.
| Sex | Number | Average Earnings |
| Male | 3,809 (52.6%) | $63,021 |
| Female | 3,434 (47.4%) | $47,276 |
| Total | 7,243 (100.0%) | $58,259 |
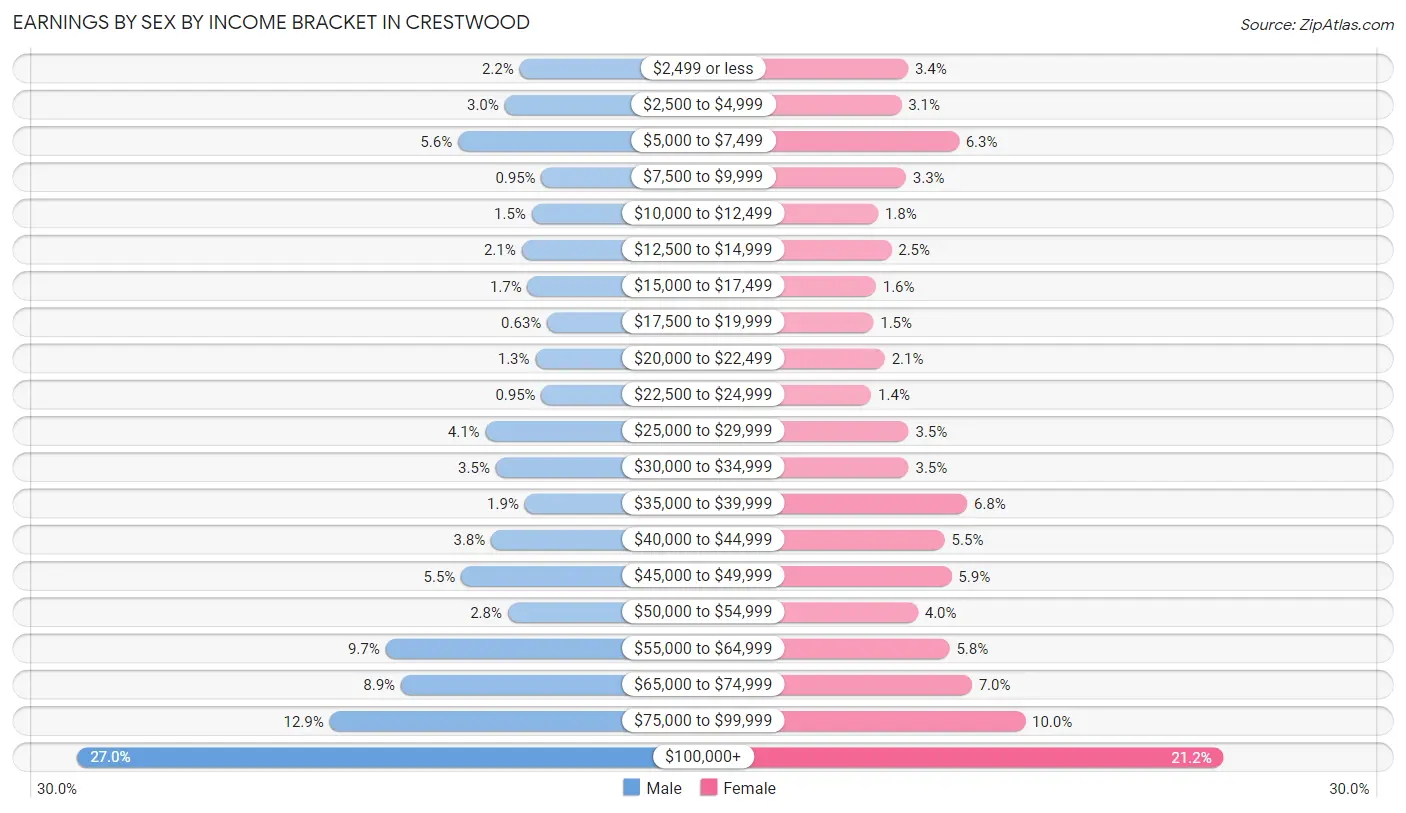
Earnings by Sex by Income Bracket in Crestwood
The most common earnings brackets in Crestwood are $100,000+ for men (1,030 | 27.0%) and $100,000+ for women (727 | 21.2%).
| Income | Male | Female |
| $2,499 or less | 83 (2.2%) | 118 (3.4%) |
| $2,500 to $4,999 | 115 (3.0%) | 105 (3.1%) |
| $5,000 to $7,499 | 215 (5.6%) | 216 (6.3%) |
| $7,500 to $9,999 | 36 (0.9%) | 114 (3.3%) |
| $10,000 to $12,499 | 57 (1.5%) | 60 (1.8%) |
| $12,500 to $14,999 | 79 (2.1%) | 86 (2.5%) |
| $15,000 to $17,499 | 66 (1.7%) | 56 (1.6%) |
| $17,500 to $19,999 | 24 (0.6%) | 51 (1.5%) |
| $20,000 to $22,499 | 49 (1.3%) | 73 (2.1%) |
| $22,500 to $24,999 | 36 (0.9%) | 47 (1.4%) |
| $25,000 to $29,999 | 156 (4.1%) | 119 (3.5%) |
| $30,000 to $34,999 | 134 (3.5%) | 119 (3.5%) |
| $35,000 to $39,999 | 72 (1.9%) | 232 (6.8%) |
| $40,000 to $44,999 | 144 (3.8%) | 189 (5.5%) |
| $45,000 to $49,999 | 208 (5.5%) | 202 (5.9%) |
| $50,000 to $54,999 | 108 (2.8%) | 137 (4.0%) |
| $55,000 to $64,999 | 370 (9.7%) | 198 (5.8%) |
| $65,000 to $74,999 | 337 (8.8%) | 241 (7.0%) |
| $75,000 to $99,999 | 490 (12.9%) | 344 (10.0%) |
| $100,000+ | 1,030 (27.0%) | 727 (21.2%) |
| Total | 3,809 (100.0%) | 3,434 (100.0%) |
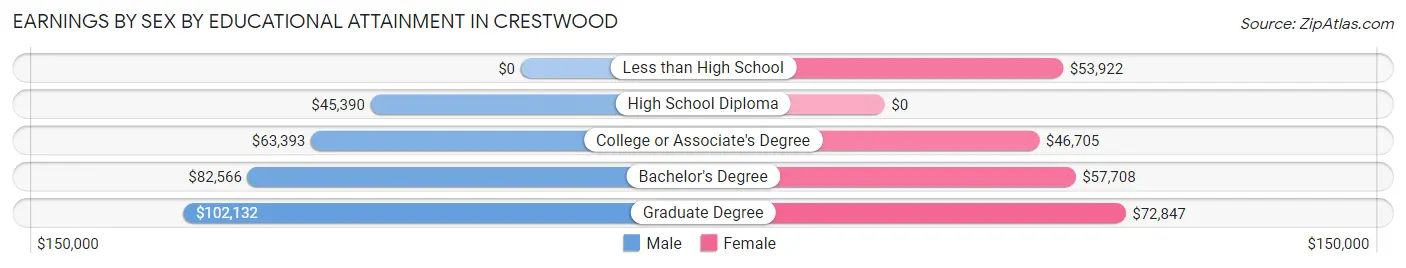
Earnings by Sex by Educational Attainment in Crestwood
Average earnings in Crestwood are $68,333 for men and $52,697 for women, a difference of 22.9%. Men with an educational attainment of graduate degree enjoy the highest average annual earnings of $102,132, while those with high school diploma education earn the least with $45,390. Women with an educational attainment of graduate degree earn the most with the average annual earnings of $72,847, while those with college or associate's degree education have the smallest earnings of $46,705.
| Educational Attainment | Male Income | Female Income |
| Less than High School | - | - |
| High School Diploma | $45,390 | $0 |
| College or Associate's Degree | $63,393 | $46,705 |
| Bachelor's Degree | $82,566 | $57,708 |
| Graduate Degree | $102,132 | $72,847 |
| Total | $68,333 | $52,697 |
Family Income in Crestwood
Family Income Brackets in Crestwood
According to the Crestwood family income data, there are 1,054 families falling into the $100,000 to $149,999 income range, which is the most common income bracket and makes up 28.9% of all families. Conversely, the $10,000 to $14,999 income bracket is the least frequent group with only 15 families (0.4%) belonging to this category.
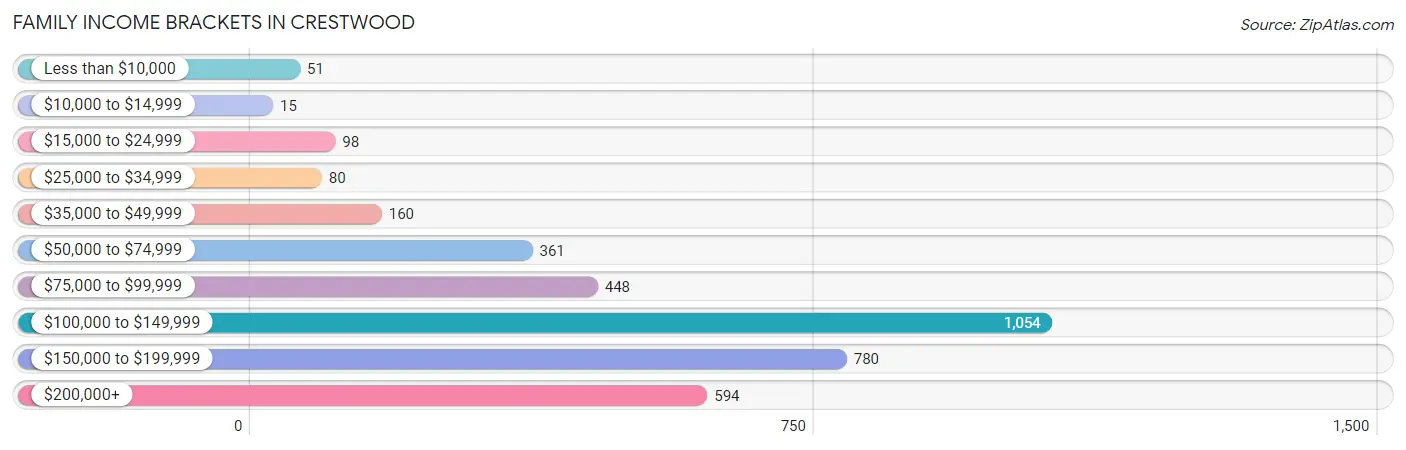
| Income Bracket | # Families | % Families |
| Less than $10,000 | 51 | 1.4% |
| $10,000 to $14,999 | 15 | 0.4% |
| $15,000 to $24,999 | 98 | 2.7% |
| $25,000 to $34,999 | 80 | 2.2% |
| $35,000 to $49,999 | 160 | 4.4% |
| $50,000 to $74,999 | 361 | 9.9% |
| $75,000 to $99,999 | 448 | 12.3% |
| $100,000 to $149,999 | 1,054 | 28.9% |
| $150,000 to $199,999 | 780 | 21.4% |
| $200,000+ | 594 | 16.3% |
Family Income by Famaliy Size in Crestwood
4-person families (660 | 18.1%) account for the highest median family income in Crestwood with $146,809 per family, while 2-person families (1,714 | 47.0%) have the highest median income of $55,331 per family member.
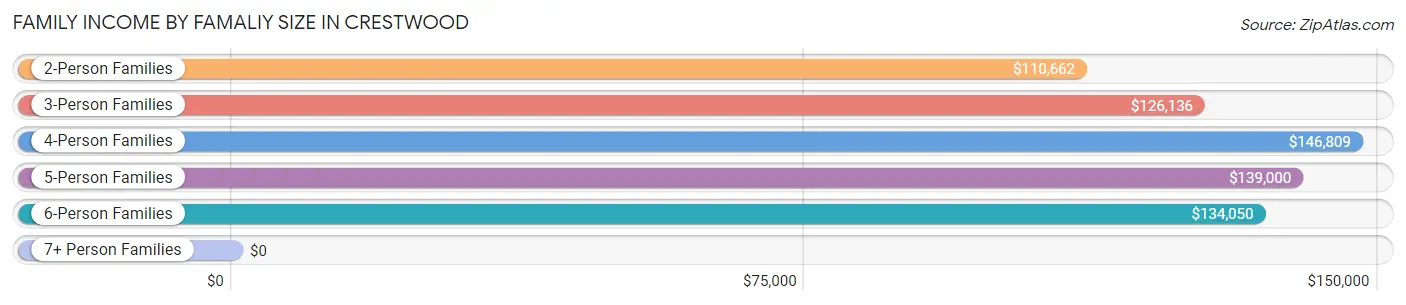
| Income Bracket | # Families | Median Income |
| 2-Person Families | 1,714 (47.0%) | $110,662 |
| 3-Person Families | 990 (27.2%) | $126,136 |
| 4-Person Families | 660 (18.1%) | $146,809 |
| 5-Person Families | 218 (6.0%) | $139,000 |
| 6-Person Families | 57 (1.6%) | $134,050 |
| 7+ Person Families | 7 (0.2%) | $0 |
| Total | 3,646 (100.0%) | $124,878 |
Family Income by Number of Earners in Crestwood
The median family income in Crestwood is $124,878, with families comprising 3+ earners (477) having the highest median family income of $188,273, while families with no earners (451) have the lowest median family income of $65,859, accounting for 13.1% and 12.4% of families, respectively.
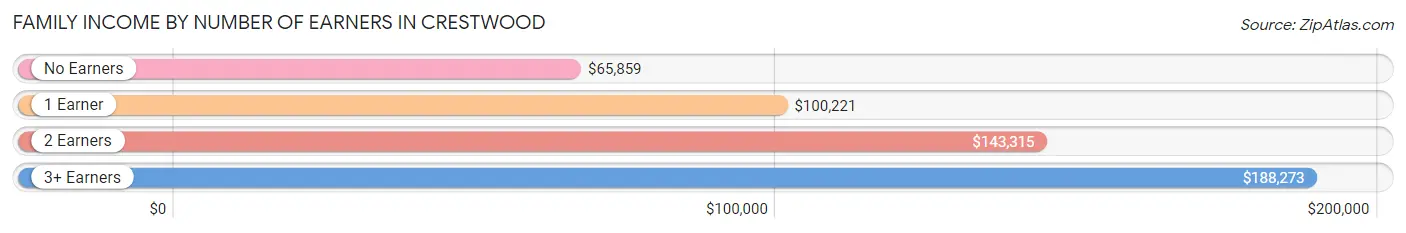
| Number of Earners | # Families | Median Income |
| No Earners | 451 (12.4%) | $65,859 |
| 1 Earner | 831 (22.8%) | $100,221 |
| 2 Earners | 1,887 (51.8%) | $143,315 |
| 3+ Earners | 477 (13.1%) | $188,273 |
| Total | 3,646 (100.0%) | $124,878 |
Household Income in Crestwood
Household Income Brackets in Crestwood
With 1,236 households falling in the category, the $100,000 to $149,999 income range is the most frequent in Crestwood, accounting for 25.6% of all households. In contrast, only 72 households (1.5%) fall into the $10,000 to $14,999 income bracket, making it the least populous group.
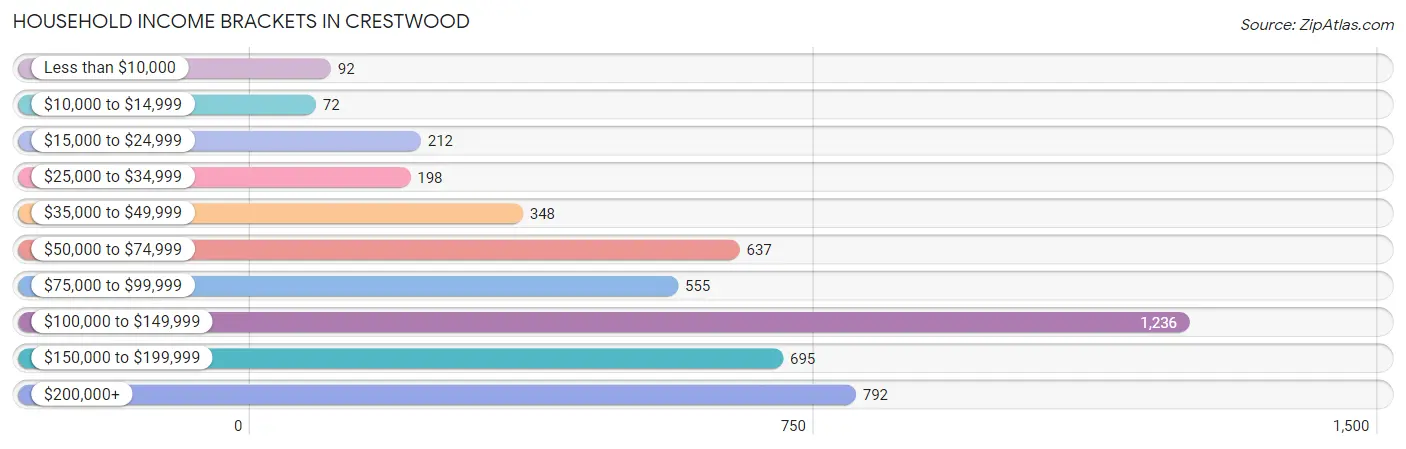
| Income Bracket | # Households | % Households |
| Less than $10,000 | 92 | 1.9% |
| $10,000 to $14,999 | 72 | 1.5% |
| $15,000 to $24,999 | 212 | 4.4% |
| $25,000 to $34,999 | 198 | 4.1% |
| $35,000 to $49,999 | 348 | 7.2% |
| $50,000 to $74,999 | 637 | 13.2% |
| $75,000 to $99,999 | 555 | 11.5% |
| $100,000 to $149,999 | 1,236 | 25.6% |
| $150,000 to $199,999 | 695 | 14.4% |
| $200,000+ | 792 | 16.4% |
Household Income by Householder Age in Crestwood
The median household income in Crestwood is $111,791, with the highest median household income of $135,104 found in the 25 to 44 years age bracket for the primary householder. A total of 1,572 households (32.6%) fall into this category. Meanwhile, the 15 to 24 years age bracket for the primary householder has the lowest median household income of $0, with 27 households (0.6%) in this group.
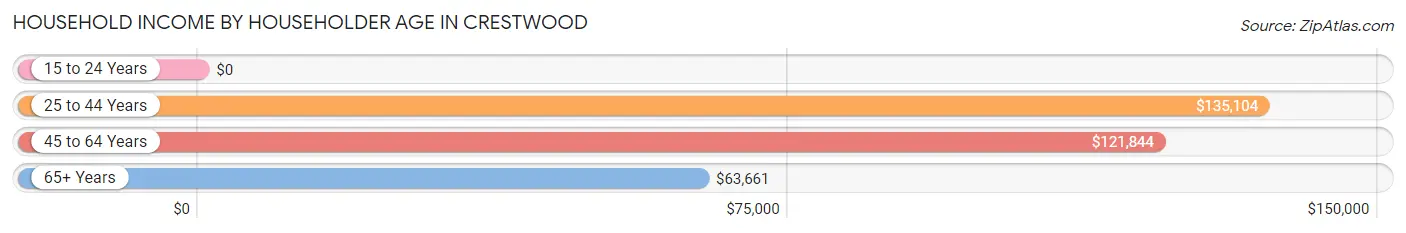
| Income Bracket | # Households | Median Income |
| 15 to 24 Years | 27 (0.6%) | $0 |
| 25 to 44 Years | 1,572 (32.6%) | $135,104 |
| 45 to 64 Years | 1,718 (35.6%) | $121,844 |
| 65+ Years | 1,510 (31.3%) | $63,661 |
| Total | 4,827 (100.0%) | $111,791 |
Poverty in Crestwood
Income Below Poverty by Sex and Age in Crestwood
With 5.8% poverty level for males and 7.5% for females among the residents of Crestwood, 18 to 24 year old males and 5 year old females are the most vulnerable to poverty, with 78 males (26.2%) and 28 females (28.9%) in their respective age groups living below the poverty level.
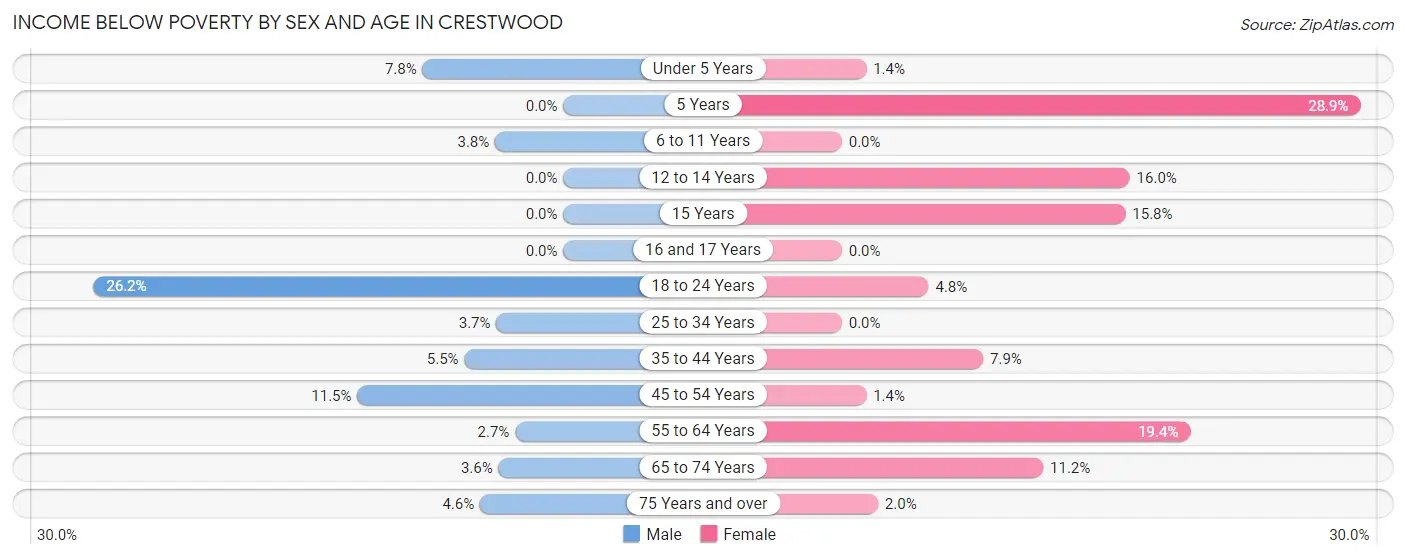
| Age Bracket | Male | Female |
| Under 5 Years | 21 (7.8%) | 6 (1.4%) |
| 5 Years | 0 (0.0%) | 28 (28.9%) |
| 6 to 11 Years | 20 (3.8%) | 0 (0.0%) |
| 12 to 14 Years | 0 (0.0%) | 42 (16.0%) |
| 15 Years | 0 (0.0%) | 6 (15.8%) |
| 16 and 17 Years | 0 (0.0%) | 0 (0.0%) |
| 18 to 24 Years | 78 (26.2%) | 10 (4.8%) |
| 25 to 34 Years | 32 (3.7%) | 0 (0.0%) |
| 35 to 44 Years | 51 (5.5%) | 74 (7.9%) |
| 45 to 54 Years | 79 (11.5%) | 8 (1.4%) |
| 55 to 64 Years | 27 (2.7%) | 226 (19.4%) |
| 65 to 74 Years | 21 (3.6%) | 62 (11.2%) |
| 75 Years and over | 18 (4.6%) | 14 (2.0%) |
| Total | 347 (5.8%) | 476 (7.5%) |
Income Above Poverty by Sex and Age in Crestwood
According to the poverty statistics in Crestwood, males aged 5 years and females aged 6 to 11 years are the age groups that are most secure financially, with 100.0% of males and 100.0% of females in these age groups living above the poverty line.
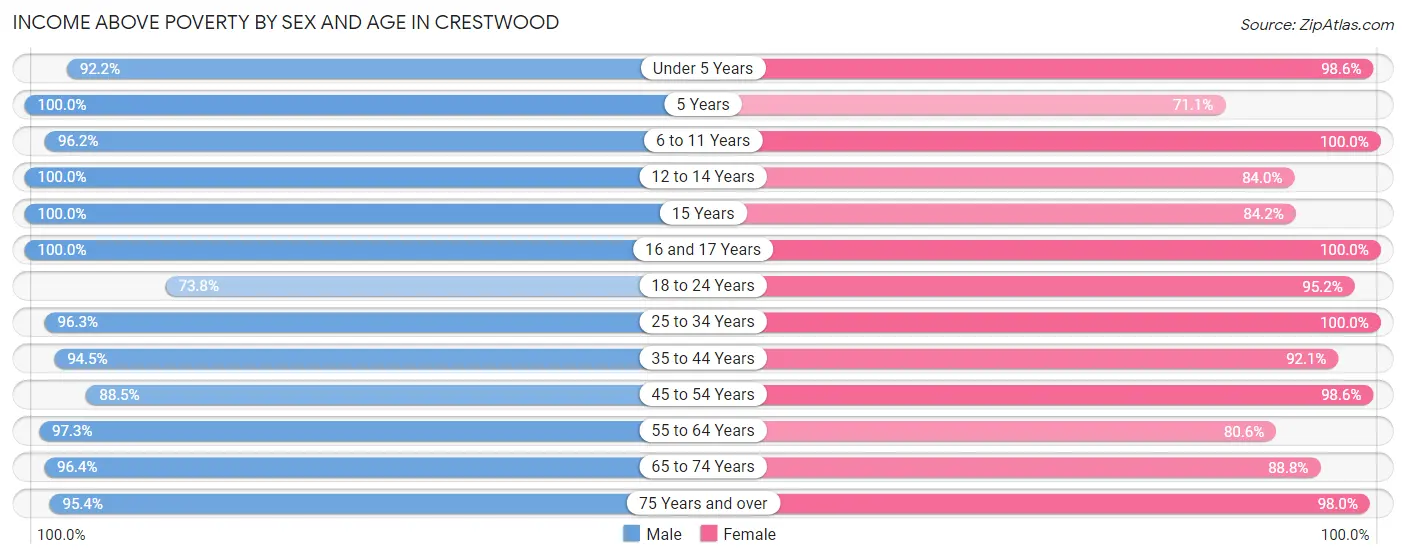
| Age Bracket | Male | Female |
| Under 5 Years | 247 (92.2%) | 436 (98.6%) |
| 5 Years | 51 (100.0%) | 69 (71.1%) |
| 6 to 11 Years | 506 (96.2%) | 361 (100.0%) |
| 12 to 14 Years | 179 (100.0%) | 220 (84.0%) |
| 15 Years | 83 (100.0%) | 32 (84.2%) |
| 16 and 17 Years | 136 (100.0%) | 97 (100.0%) |
| 18 to 24 Years | 220 (73.8%) | 197 (95.2%) |
| 25 to 34 Years | 827 (96.3%) | 863 (100.0%) |
| 35 to 44 Years | 875 (94.5%) | 866 (92.1%) |
| 45 to 54 Years | 610 (88.5%) | 581 (98.6%) |
| 55 to 64 Years | 980 (97.3%) | 939 (80.6%) |
| 65 to 74 Years | 560 (96.4%) | 491 (88.8%) |
| 75 Years and over | 370 (95.4%) | 683 (98.0%) |
| Total | 5,644 (94.2%) | 5,835 (92.5%) |
Income Below Poverty Among Married-Couple Families in Crestwood
The poverty statistics for married-couple families in Crestwood show that 4.8% or 146 of the total 3,066 families live below the poverty line. Families with 1 or 2 children have the highest poverty rate of 8.1%, comprising of 83 families. On the other hand, families with 3 or 4 children have the lowest poverty rate of 2.4%, which includes 6 families.
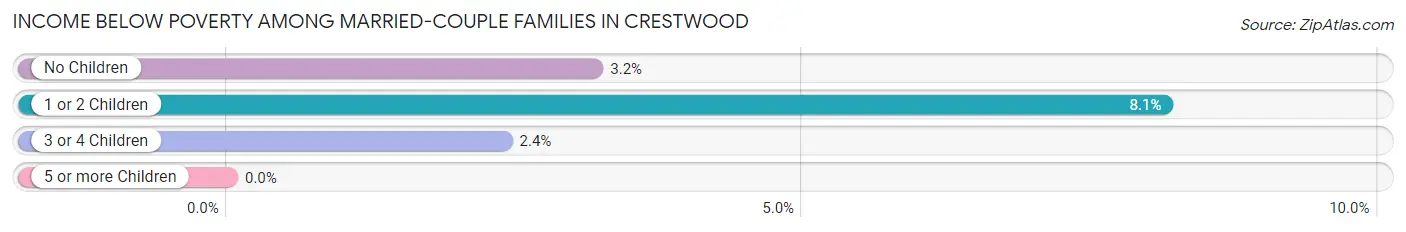
| Children | Above Poverty | Below Poverty |
| No Children | 1,738 (96.8%) | 57 (3.2%) |
| 1 or 2 Children | 937 (91.9%) | 83 (8.1%) |
| 3 or 4 Children | 245 (97.6%) | 6 (2.4%) |
| 5 or more Children | 0 (0.0%) | 0 (0.0%) |
| Total | 2,920 (95.2%) | 146 (4.8%) |
Income Below Poverty Among Single-Parent Households in Crestwood
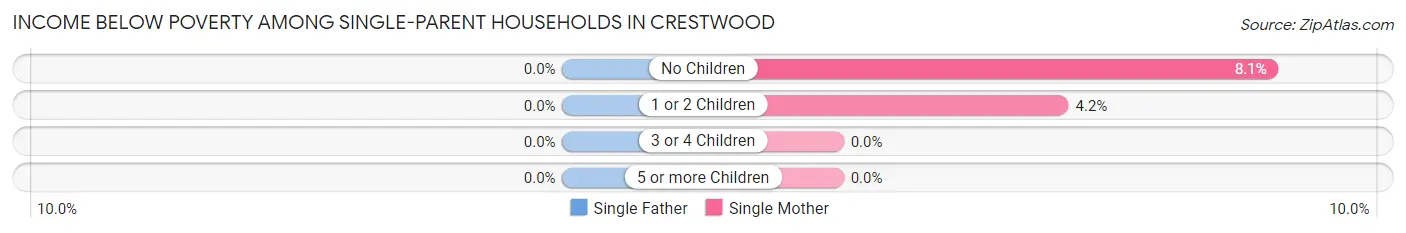
| Children | Single Father | Single Mother |
| No Children | 0 (0.0%) | 17 (8.1%) |
| 1 or 2 Children | 0 (0.0%) | 7 (4.2%) |
| 3 or 4 Children | 0 (0.0%) | 0 (0.0%) |
| 5 or more Children | 0 (0.0%) | 0 (0.0%) |
| Total | 0 (0.0%) | 24 (6.4%) |
Income Below Poverty Among Married-Couple vs Single-Parent Households in Crestwood
The poverty data for Crestwood shows that 146 of the married-couple family households (4.8%) and 24 of the single-parent households (4.1%) are living below the poverty level. Within the married-couple family households, those with 1 or 2 children have the highest poverty rate, with 83 households (8.1%) falling below the poverty line. Among the single-parent households, those with no children have the highest poverty rate, with 17 household (4.4%) living below poverty.
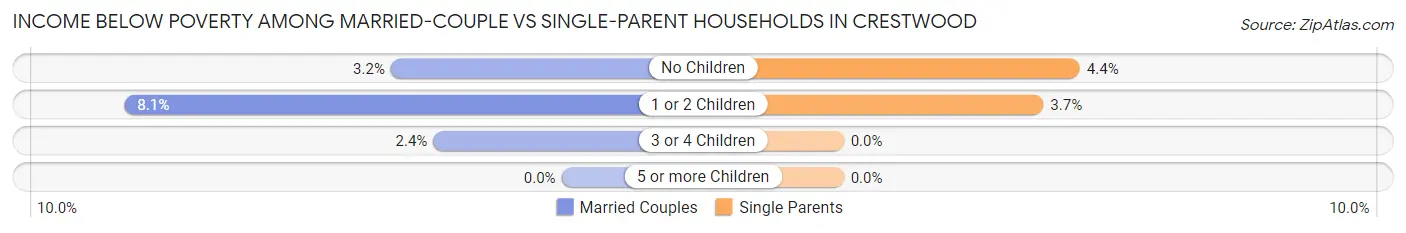
| Children | Married-Couple Families | Single-Parent Households |
| No Children | 57 (3.2%) | 17 (4.4%) |
| 1 or 2 Children | 83 (8.1%) | 7 (3.7%) |
| 3 or 4 Children | 6 (2.4%) | 0 (0.0%) |
| 5 or more Children | 0 (0.0%) | 0 (0.0%) |
| Total | 146 (4.8%) | 24 (4.1%) |
Race in Crestwood
The most populous races in Crestwood are White / Caucasian (11,316 | 91.9%), Two or more Races (440 | 3.6%), and Hispanic or Latino (426 | 3.5%).
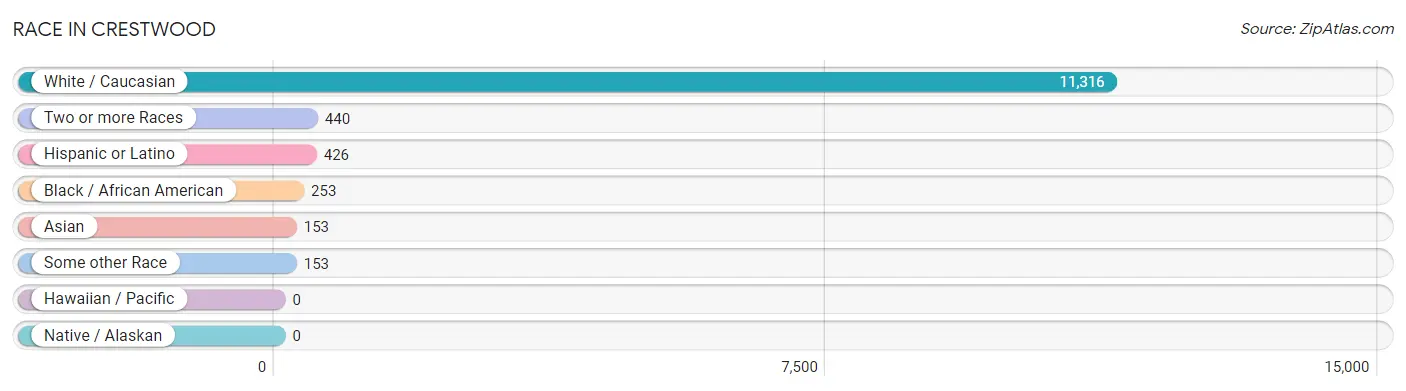
| Race | # Population | % Population |
| Asian | 153 | 1.2% |
| Black / African American | 253 | 2.1% |
| Hawaiian / Pacific | 0 | 0.0% |
| Hispanic or Latino | 426 | 3.5% |
| Native / Alaskan | 0 | 0.0% |
| White / Caucasian | 11,316 | 91.9% |
| Two or more Races | 440 | 3.6% |
| Some other Race | 153 | 1.2% |
| Total | 12,315 | 100.0% |
Ancestry in Crestwood
The most populous ancestries reported in Crestwood are German (4,572 | 37.1%), Irish (2,296 | 18.6%), English (1,648 | 13.4%), Italian (978 | 7.9%), and American (617 | 5.0%), together accounting for 82.1% of all Crestwood residents.
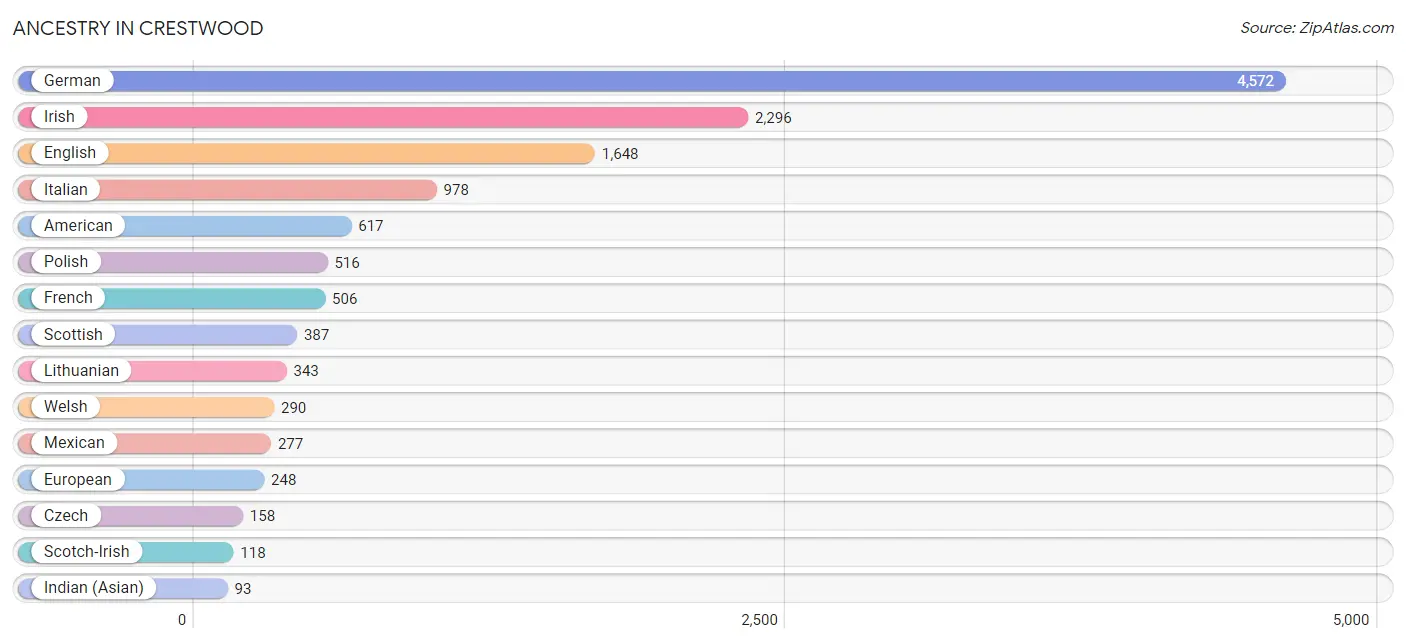
| Ancestry | # Population | % Population |
| African | 5 | 0.0% |
| American | 617 | 5.0% |
| Arab | 58 | 0.5% |
| Argentinean | 1 | 0.0% |
| Armenian | 15 | 0.1% |
| Austrian | 53 | 0.4% |
| Belgian | 14 | 0.1% |
| Blackfeet | 1 | 0.0% |
| British | 48 | 0.4% |
| Central American | 56 | 0.4% |
| Chippewa | 14 | 0.1% |
| Croatian | 21 | 0.2% |
| Czech | 158 | 1.3% |
| Czechoslovakian | 9 | 0.1% |
| Danish | 55 | 0.4% |
| Dutch | 62 | 0.5% |
| Eastern European | 18 | 0.2% |
| Ecuadorian | 9 | 0.1% |
| English | 1,648 | 13.4% |
| European | 248 | 2.0% |
| French | 506 | 4.1% |
| German | 4,572 | 37.1% |
| Greek | 90 | 0.7% |
| Guatemalan | 56 | 0.4% |
| Hungarian | 77 | 0.6% |
| Indian (Asian) | 93 | 0.8% |
| Irish | 2,296 | 18.6% |
| Italian | 978 | 7.9% |
| Korean | 86 | 0.7% |
| Lebanese | 29 | 0.2% |
| Lithuanian | 343 | 2.8% |
| Luxembourger | 1 | 0.0% |
| Mexican | 277 | 2.2% |
| Northern European | 20 | 0.2% |
| Norwegian | 60 | 0.5% |
| Peruvian | 21 | 0.2% |
| Polish | 516 | 4.2% |
| Puerto Rican | 2 | 0.0% |
| Russian | 83 | 0.7% |
| Scandinavian | 78 | 0.6% |
| Scotch-Irish | 118 | 1.0% |
| Scottish | 387 | 3.1% |
| South American | 31 | 0.3% |
| Spaniard | 15 | 0.1% |
| Spanish | 45 | 0.4% |
| Sri Lankan | 15 | 0.1% |
| Subsaharan African | 5 | 0.0% |
| Swedish | 70 | 0.6% |
| Swiss | 27 | 0.2% |
| Syrian | 29 | 0.2% |
| Thai | 13 | 0.1% |
| Ukrainian | 7 | 0.1% |
| Welsh | 290 | 2.4% |
| Yugoslavian | 30 | 0.2% | View All 54 Rows |
Immigrants in Crestwood
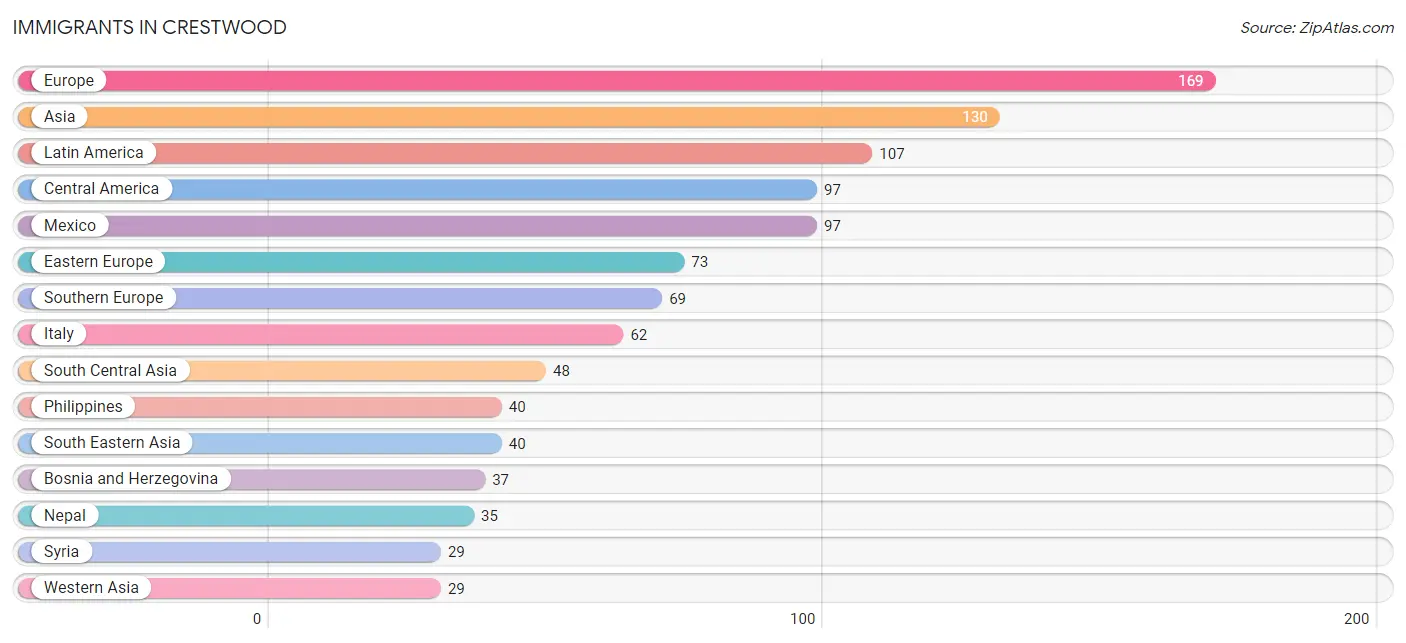
The most numerous immigrant groups reported in Crestwood came from Europe (169 | 1.4%), Asia (130 | 1.1%), Latin America (107 | 0.9%), Central America (97 | 0.8%), and Mexico (97 | 0.8%), together accounting for 4.9% of all Crestwood residents.
| Immigration Origin | # Population | % Population |
| Africa | 8 | 0.1% |
| Albania | 19 | 0.2% |
| Argentina | 1 | 0.0% |
| Asia | 130 | 1.1% |
| Bosnia and Herzegovina | 37 | 0.3% |
| Canada | 8 | 0.1% |
| Central America | 97 | 0.8% |
| China | 13 | 0.1% |
| Denmark | 11 | 0.1% |
| Eastern Asia | 13 | 0.1% |
| Eastern Europe | 73 | 0.6% |
| Ecuador | 9 | 0.1% |
| England | 9 | 0.1% |
| Europe | 169 | 1.4% |
| Greece | 7 | 0.1% |
| India | 13 | 0.1% |
| Italy | 62 | 0.5% |
| Latin America | 107 | 0.9% |
| Mexico | 97 | 0.8% |
| Nepal | 35 | 0.3% |
| Northern Europe | 27 | 0.2% |
| Philippines | 40 | 0.3% |
| Poland | 10 | 0.1% |
| South Africa | 8 | 0.1% |
| South America | 10 | 0.1% |
| South Central Asia | 48 | 0.4% |
| South Eastern Asia | 40 | 0.3% |
| Southern Europe | 69 | 0.6% |
| Syria | 29 | 0.2% |
| Western Asia | 29 | 0.2% | View All 30 Rows |
Sex and Age in Crestwood
Sex and Age in Crestwood
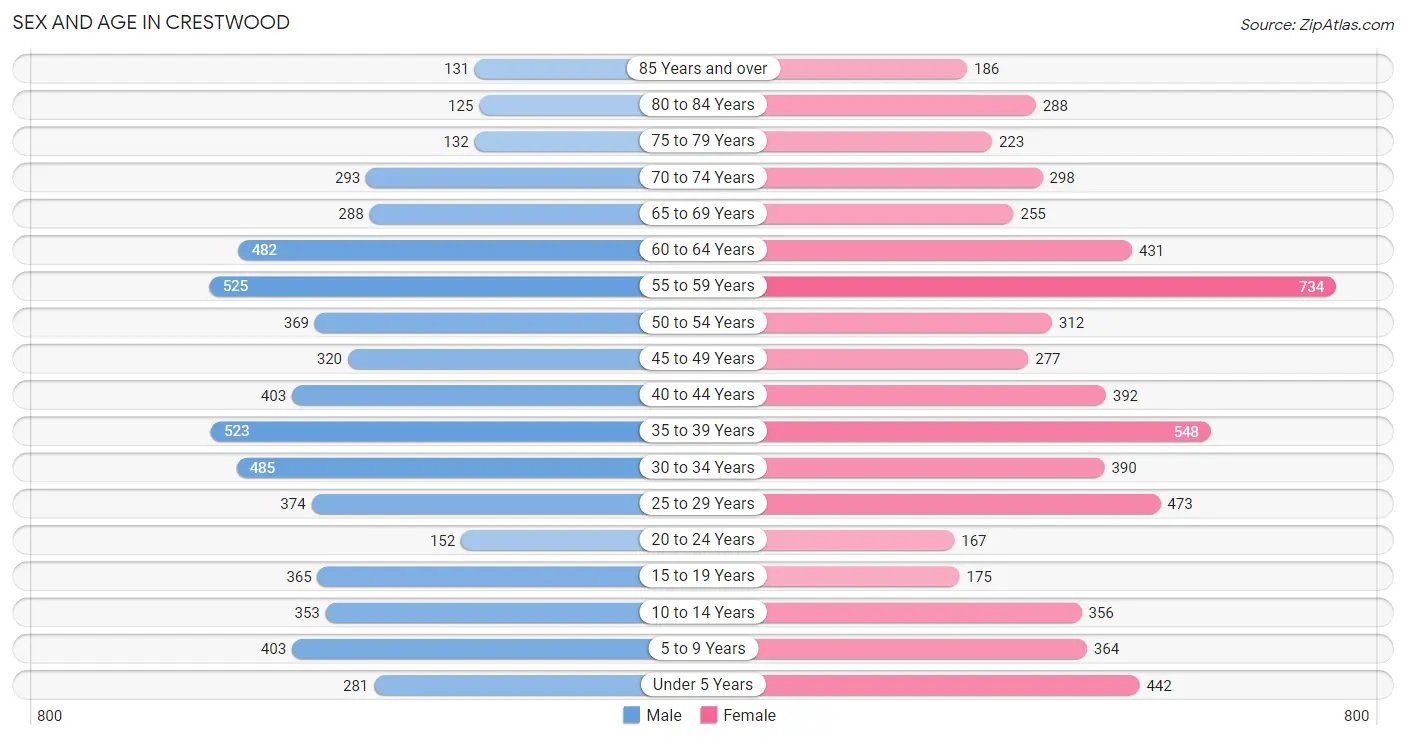
The most populous age groups in Crestwood are 55 to 59 Years (525 | 8.7%) for men and 55 to 59 Years (734 | 11.6%) for women.
| Age Bracket | Male | Female |
| Under 5 Years | 281 (4.7%) | 442 (7.0%) |
| 5 to 9 Years | 403 (6.7%) | 364 (5.8%) |
| 10 to 14 Years | 353 (5.9%) | 356 (5.6%) |
| 15 to 19 Years | 365 (6.1%) | 175 (2.8%) |
| 20 to 24 Years | 152 (2.5%) | 167 (2.6%) |
| 25 to 29 Years | 374 (6.2%) | 473 (7.5%) |
| 30 to 34 Years | 485 (8.1%) | 390 (6.2%) |
| 35 to 39 Years | 523 (8.7%) | 548 (8.7%) |
| 40 to 44 Years | 403 (6.7%) | 392 (6.2%) |
| 45 to 49 Years | 320 (5.3%) | 277 (4.4%) |
| 50 to 54 Years | 369 (6.1%) | 312 (4.9%) |
| 55 to 59 Years | 525 (8.7%) | 734 (11.6%) |
| 60 to 64 Years | 482 (8.0%) | 431 (6.8%) |
| 65 to 69 Years | 288 (4.8%) | 255 (4.0%) |
| 70 to 74 Years | 293 (4.9%) | 298 (4.7%) |
| 75 to 79 Years | 132 (2.2%) | 223 (3.5%) |
| 80 to 84 Years | 125 (2.1%) | 288 (4.6%) |
| 85 Years and over | 131 (2.2%) | 186 (2.9%) |
| Total | 6,004 (100.0%) | 6,311 (100.0%) |
Families and Households in Crestwood
Median Family Size in Crestwood
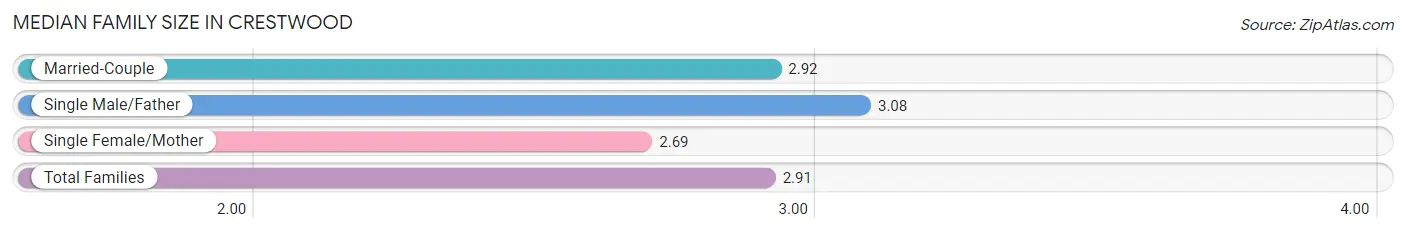
The median family size in Crestwood is 2.91 persons per family, with single male/father families (203 | 5.6%) accounting for the largest median family size of 3.08 persons per family. On the other hand, single female/mother families (377 | 10.3%) represent the smallest median family size with 2.69 persons per family.
| Family Type | # Families | Family Size |
| Married-Couple | 3,066 (84.1%) | 2.92 |
| Single Male/Father | 203 (5.6%) | 3.08 |
| Single Female/Mother | 377 (10.3%) | 2.69 |
| Total Families | 3,646 (100.0%) | 2.91 |
Median Household Size in Crestwood
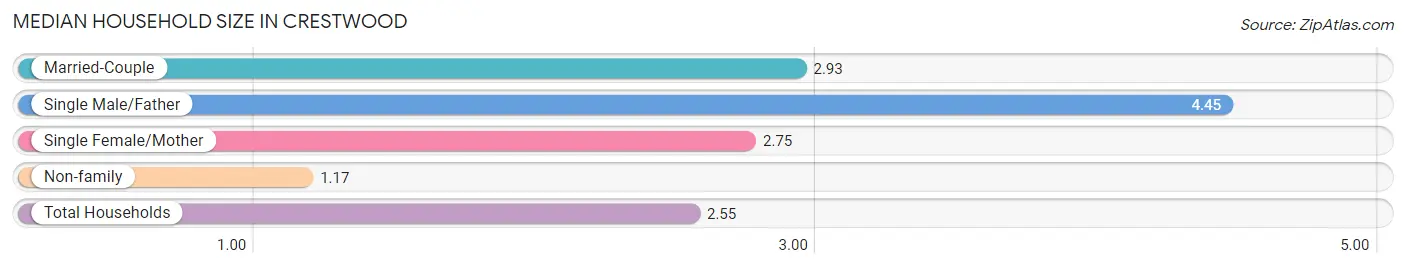
The median household size in Crestwood is 2.55 persons per household, with single male/father households (203 | 4.2%) accounting for the largest median household size of 4.45 persons per household. non-family households (1,181 | 24.5%) represent the smallest median household size with 1.17 persons per household.
| Household Type | # Households | Household Size |
| Married-Couple | 3,066 (63.5%) | 2.93 |
| Single Male/Father | 203 (4.2%) | 4.45 |
| Single Female/Mother | 377 (7.8%) | 2.75 |
| Non-family | 1,181 (24.5%) | 1.17 |
| Total Households | 4,827 (100.0%) | 2.55 |
Household Size by Marriage Status in Crestwood
Out of a total of 4,827 households in Crestwood, 3,646 (75.5%) are family households, while 1,181 (24.5%) are nonfamily households. The most numerous type of family households are 2-person households, comprising 1,714, and the most common type of nonfamily households are 1-person households, comprising 1,009.
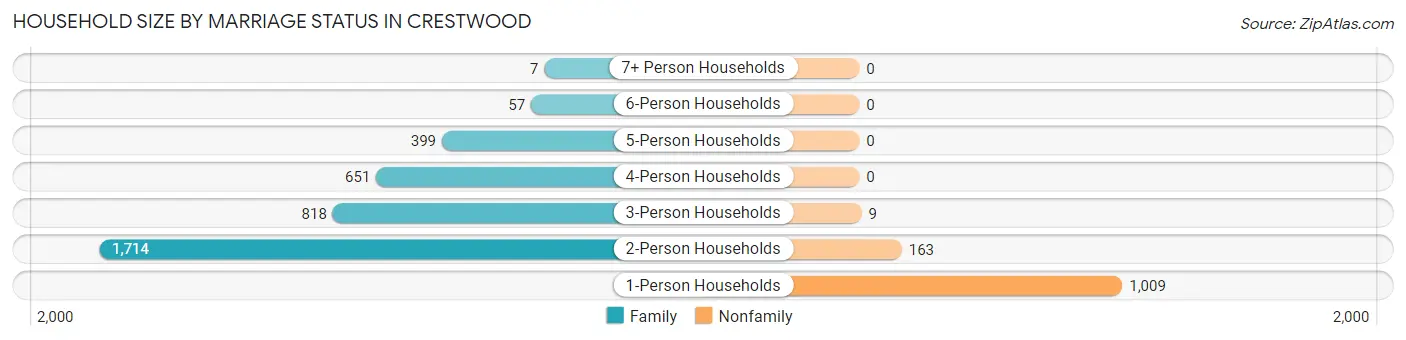
| Household Size | Family Households | Nonfamily Households |
| 1-Person Households | - | 1,009 (20.9%) |
| 2-Person Households | 1,714 (35.5%) | 163 (3.4%) |
| 3-Person Households | 818 (17.0%) | 9 (0.2%) |
| 4-Person Households | 651 (13.5%) | 0 (0.0%) |
| 5-Person Households | 399 (8.3%) | 0 (0.0%) |
| 6-Person Households | 57 (1.2%) | 0 (0.0%) |
| 7+ Person Households | 7 (0.2%) | 0 (0.0%) |
| Total | 3,646 (75.5%) | 1,181 (24.5%) |
Female Fertility in Crestwood
Fertility by Age in Crestwood
Average fertility rate in Crestwood is 30.0 births per 1,000 women. Women in the age bracket of 20 to 34 years have the highest fertility rate with 35.0 births per 1,000 women. Women in the age bracket of 35 to 50 years acount for 50.7% of all women with births.
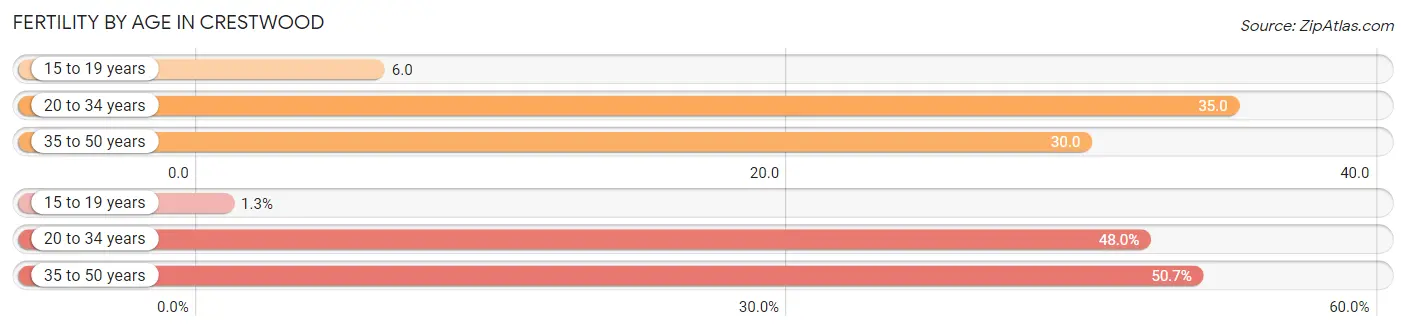
| Age Bracket | Women with Births | Births / 1,000 Women |
| 15 to 19 years | 1 (1.3%) | 6.0 |
| 20 to 34 years | 36 (48.0%) | 35.0 |
| 35 to 50 years | 38 (50.7%) | 30.0 |
| Total | 75 (100.0%) | 30.0 |
Fertility by Age by Marriage Status in Crestwood
97.3% of women with births (75) in Crestwood are married. The highest percentage of unmarried women with births falls into 15 to 19 years age bracket with 100.0% of them unmarried at the time of birth, while the lowest percentage of unmarried women with births belong to 35 to 50 years age bracket with 0.0% of them unmarried.
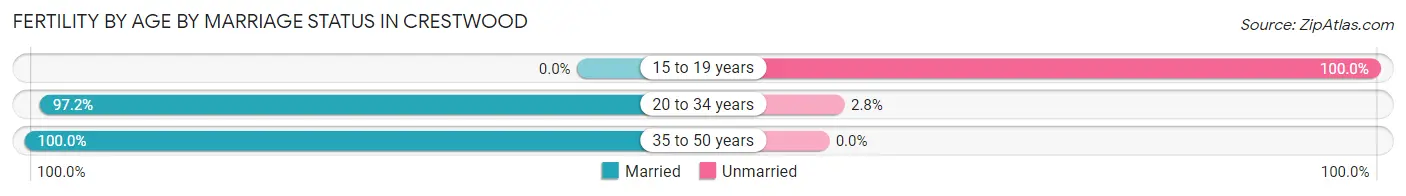
| Age Bracket | Married | Unmarried |
| 15 to 19 years | 0 (0.0%) | 1 (100.0%) |
| 20 to 34 years | 35 (97.2%) | 1 (2.8%) |
| 35 to 50 years | 38 (100.0%) | 0 (0.0%) |
| Total | 73 (97.3%) | 2 (2.7%) |
Fertility by Education in Crestwood
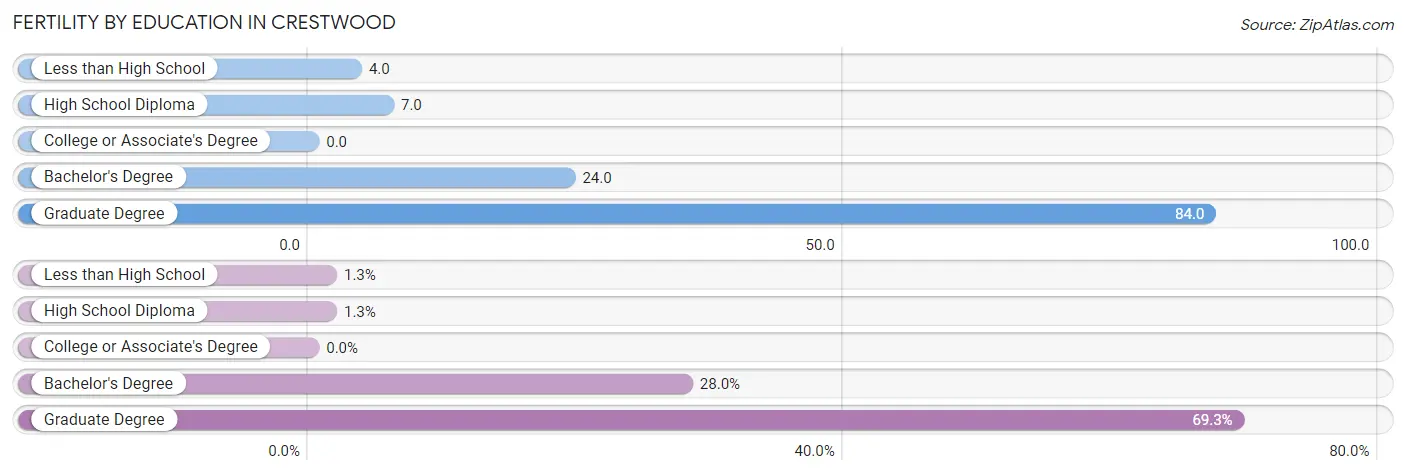
| Educational Attainment | Women with Births | Births / 1,000 Women |
| Less than High School | 1 (1.3%) | 4.0 |
| High School Diploma | 1 (1.3%) | 7.0 |
| College or Associate's Degree | 0 (0.0%) | 0.0 |
| Bachelor's Degree | 21 (28.0%) | 24.0 |
| Graduate Degree | 52 (69.3%) | 84.0 |
| Total | 75 (100.0%) | 30.0 |
Fertility by Education by Marriage Status in Crestwood
2.7% of women with births in Crestwood are unmarried. Women with the educational attainment of bachelor's degree are most likely to be married with 100.0% of them married at childbirth, while women with the educational attainment of less than high school are least likely to be married with 100.0% of them unmarried at childbirth.
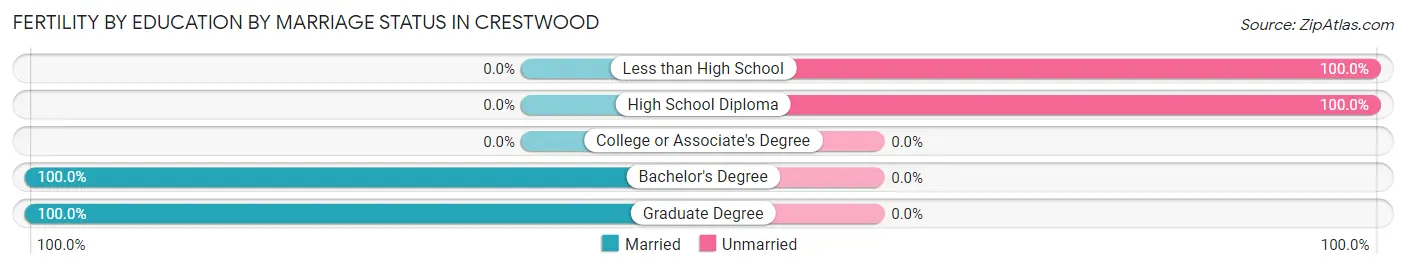
| Educational Attainment | Married | Unmarried |
| Less than High School | 0 (0.0%) | 1 (100.0%) |
| High School Diploma | 0 (0.0%) | 1 (100.0%) |
| College or Associate's Degree | 0 (0.0%) | 0 (0.0%) |
| Bachelor's Degree | 21 (100.0%) | 0 (0.0%) |
| Graduate Degree | 52 (100.0%) | 0 (0.0%) |
| Total | 73 (97.3%) | 2 (2.7%) |
Employment Characteristics in Crestwood
Employment by Class of Employer in Crestwood
Among the 6,537 employed individuals in Crestwood, private company employees (4,263 | 65.2%), not-for-profit organizations (1,032 | 15.8%), and local government employees (455 | 7.0%) make up the most common classes of employment.
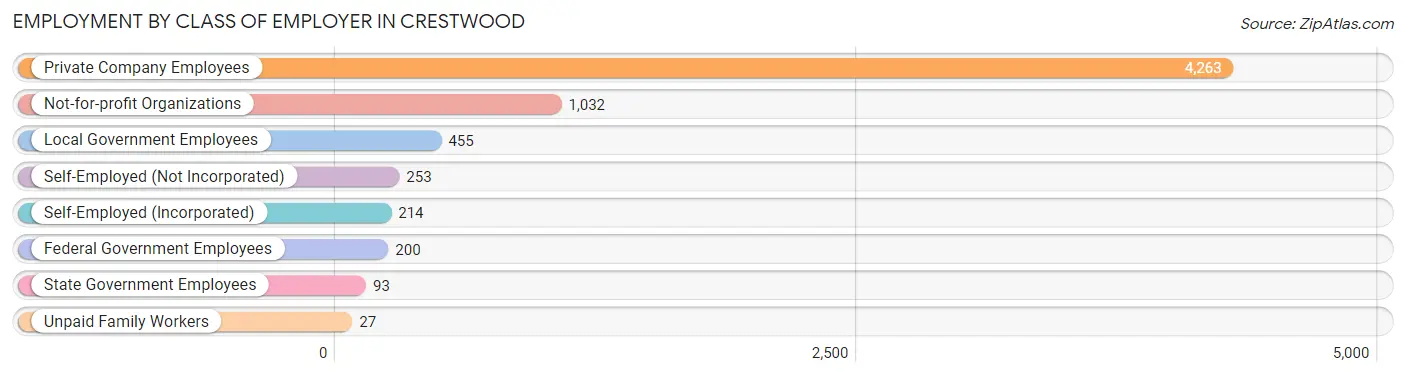
| Employer Class | # Employees | % Employees |
| Private Company Employees | 4,263 | 65.2% |
| Self-Employed (Incorporated) | 214 | 3.3% |
| Self-Employed (Not Incorporated) | 253 | 3.9% |
| Not-for-profit Organizations | 1,032 | 15.8% |
| Local Government Employees | 455 | 7.0% |
| State Government Employees | 93 | 1.4% |
| Federal Government Employees | 200 | 3.1% |
| Unpaid Family Workers | 27 | 0.4% |
| Total | 6,537 | 100.0% |
Employment Status by Age in Crestwood
According to the labor force statistics for Crestwood, out of the total population over 16 years of age (9,995), 67.9% or 6,787 individuals are in the labor force, with 1.4% or 95 of them unemployed. The age group with the highest labor force participation rate is 25 to 29 years, with 95.9% or 812 individuals in the labor force. Within the labor force, the 16 to 19 years age range has the highest percentage of unemployed individuals, with 5.8% or 10 of them being unemployed.
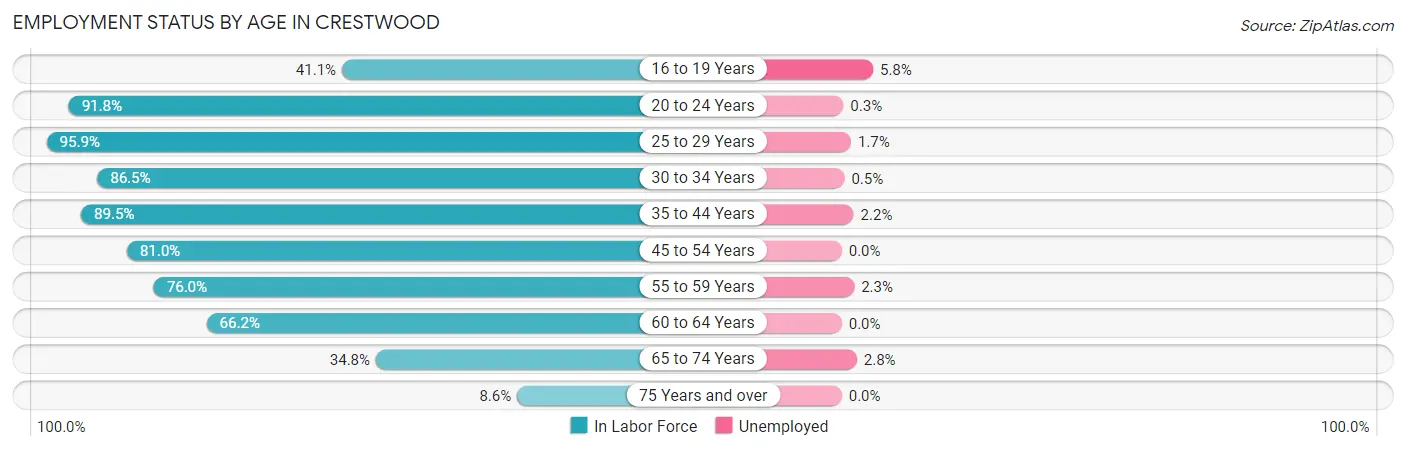
| Age Bracket | In Labor Force | Unemployed |
| 16 to 19 Years | 172 (41.1%) | 10 (5.8%) |
| 20 to 24 Years | 293 (91.8%) | 1 (0.3%) |
| 25 to 29 Years | 812 (95.9%) | 14 (1.7%) |
| 30 to 34 Years | 757 (86.5%) | 4 (0.5%) |
| 35 to 44 Years | 1,670 (89.5%) | 37 (2.2%) |
| 45 to 54 Years | 1,035 (81.0%) | 0 (0.0%) |
| 55 to 59 Years | 957 (76.0%) | 22 (2.3%) |
| 60 to 64 Years | 604 (66.2%) | 0 (0.0%) |
| 65 to 74 Years | 395 (34.8%) | 11 (2.8%) |
| 75 Years and over | 93 (8.6%) | 0 (0.0%) |
| Total | 6,787 (67.9%) | 95 (1.4%) |
Employment Status by Educational Attainment in Crestwood
According to labor force statistics for Crestwood, 82.9% of individuals (5,835) out of the total population between 25 and 64 years of age (7,038) are in the labor force, with 1.3% or 76 of them being unemployed. The group with the highest labor force participation rate are those with the educational attainment of college / associate degree, with 88.0% or 1,375 individuals in the labor force. Within the labor force, individuals with college / associate degree education have the highest percentage of unemployment, with 1.7% or 23 of them being unemployed.
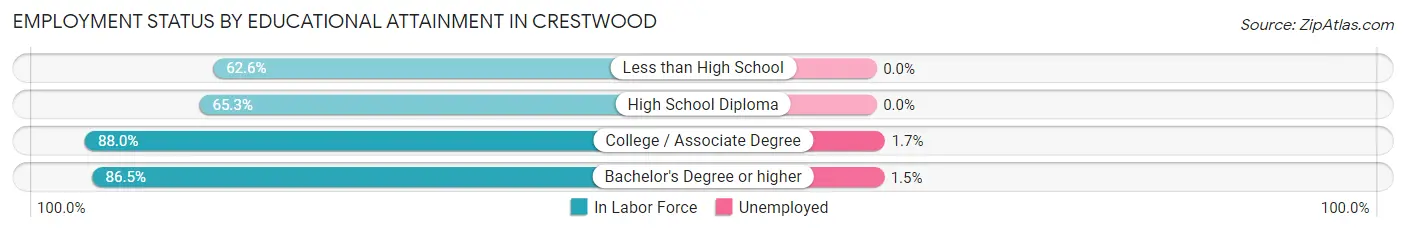
| Educational Attainment | In Labor Force | Unemployed |
| Less than High School | 87 (62.6%) | 0 (0.0%) |
| High School Diploma | 746 (65.3%) | 0 (0.0%) |
| College / Associate Degree | 1,375 (88.0%) | 27 (1.7%) |
| Bachelor's Degree or higher | 3,628 (86.5%) | 63 (1.5%) |
| Total | 5,835 (82.9%) | 91 (1.3%) |
Employment Occupations by Sex in Crestwood
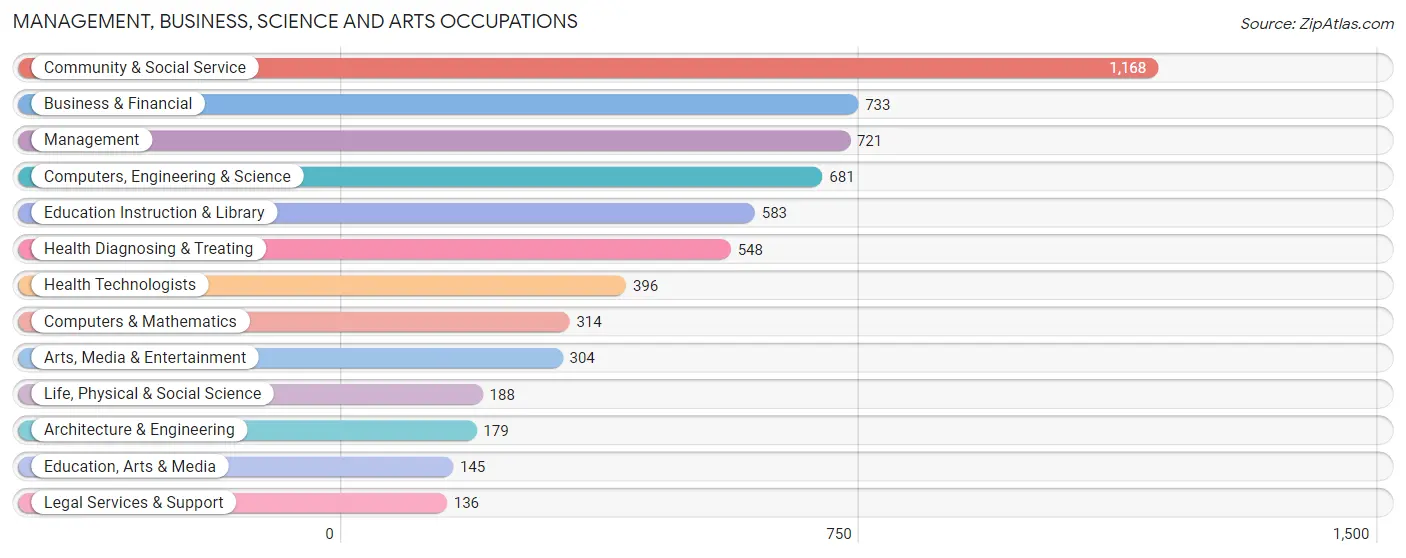
Management, Business, Science and Arts Occupations
The most common Management, Business, Science and Arts occupations in Crestwood are Community & Social Service (1,168 | 17.5%), Business & Financial (733 | 11.0%), Management (721 | 10.8%), Computers, Engineering & Science (681 | 10.2%), and Education Instruction & Library (583 | 8.7%).
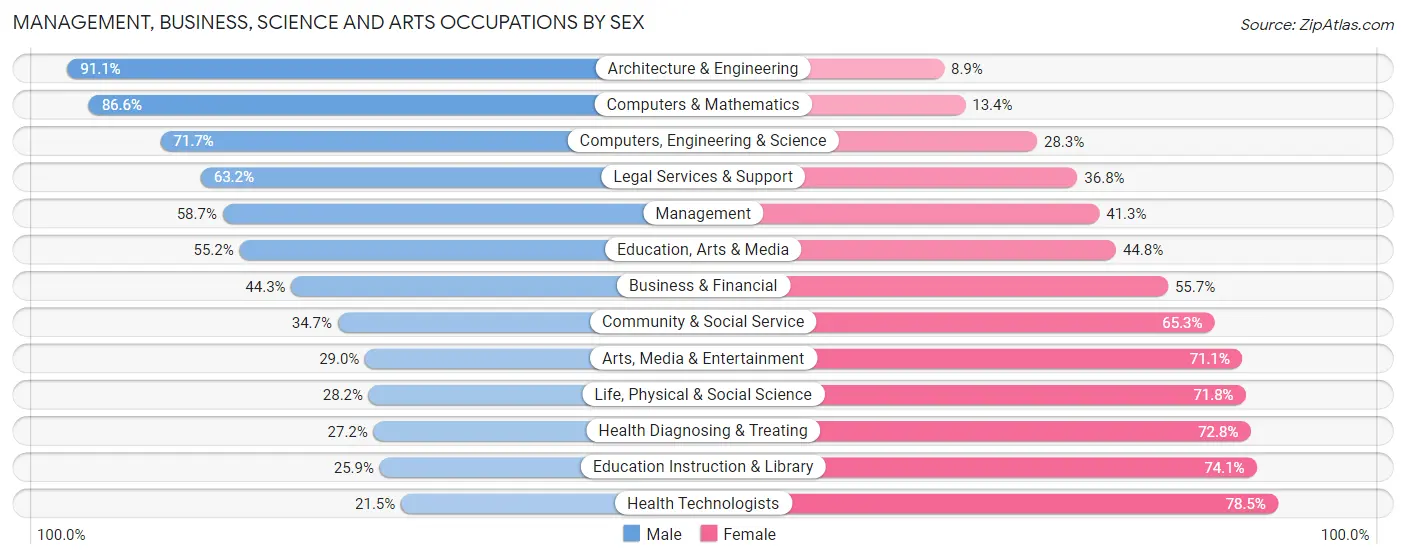
Management, Business, Science and Arts Occupations by Sex
Within the Management, Business, Science and Arts occupations in Crestwood, the most male-oriented occupations are Architecture & Engineering (91.1%), Computers & Mathematics (86.6%), and Computers, Engineering & Science (71.7%), while the most female-oriented occupations are Health Technologists (78.5%), Education Instruction & Library (74.1%), and Health Diagnosing & Treating (72.8%).
| Occupation | Male | Female |
| Management | 423 (58.7%) | 298 (41.3%) |
| Business & Financial | 325 (44.3%) | 408 (55.7%) |
| Computers, Engineering & Science | 488 (71.7%) | 193 (28.3%) |
| Computers & Mathematics | 272 (86.6%) | 42 (13.4%) |
| Architecture & Engineering | 163 (91.1%) | 16 (8.9%) |
| Life, Physical & Social Science | 53 (28.2%) | 135 (71.8%) |
| Community & Social Service | 405 (34.7%) | 763 (65.3%) |
| Education, Arts & Media | 80 (55.2%) | 65 (44.8%) |
| Legal Services & Support | 86 (63.2%) | 50 (36.8%) |
| Education Instruction & Library | 151 (25.9%) | 432 (74.1%) |
| Arts, Media & Entertainment | 88 (28.9%) | 216 (71.1%) |
| Health Diagnosing & Treating | 149 (27.2%) | 399 (72.8%) |
| Health Technologists | 85 (21.5%) | 311 (78.5%) |
| Total (Category) | 1,790 (46.5%) | 2,061 (53.5%) |
| Total (Overall) | 3,552 (53.3%) | 3,111 (46.7%) |
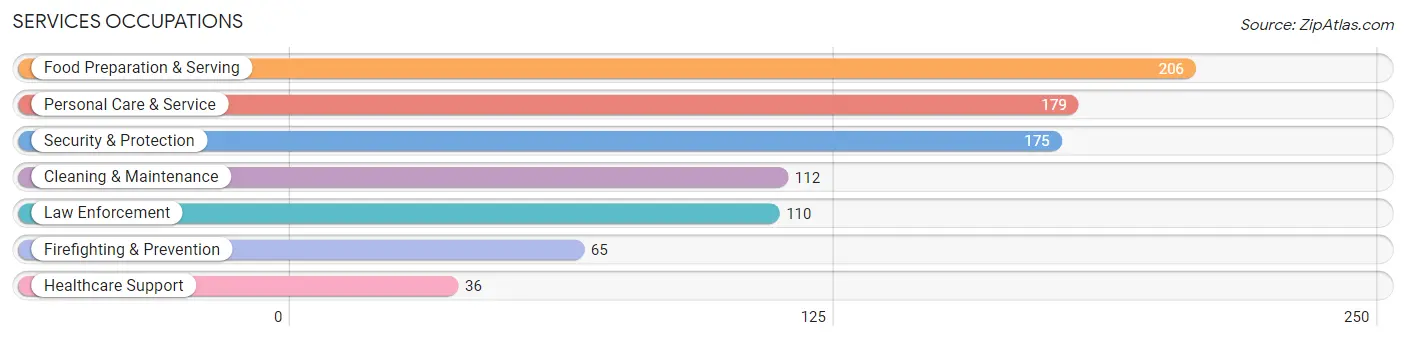
Services Occupations
The most common Services occupations in Crestwood are Food Preparation & Serving (206 | 3.1%), Personal Care & Service (179 | 2.7%), Security & Protection (175 | 2.6%), Cleaning & Maintenance (112 | 1.7%), and Law Enforcement (110 | 1.7%).
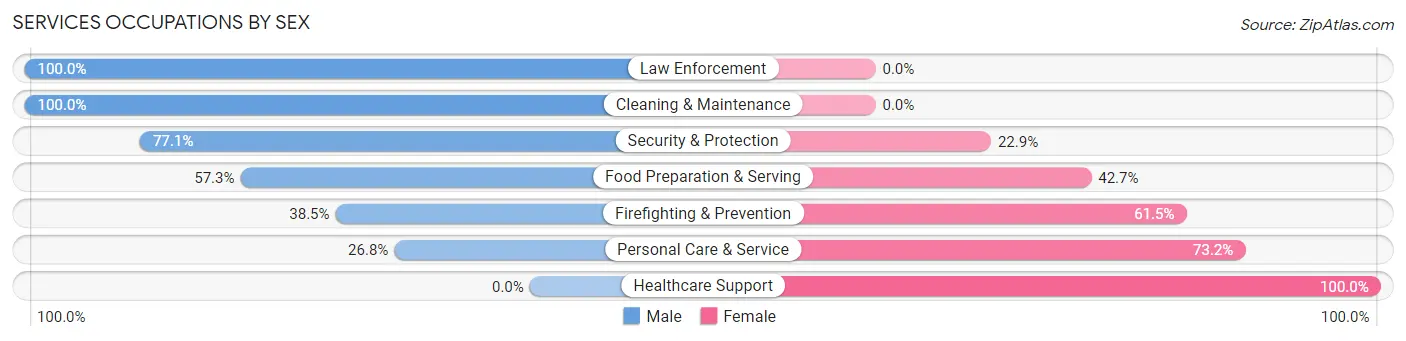
Services Occupations by Sex
Within the Services occupations in Crestwood, the most male-oriented occupations are Law Enforcement (100.0%), Cleaning & Maintenance (100.0%), and Security & Protection (77.1%), while the most female-oriented occupations are Healthcare Support (100.0%), Personal Care & Service (73.2%), and Firefighting & Prevention (61.5%).
| Occupation | Male | Female |
| Healthcare Support | 0 (0.0%) | 36 (100.0%) |
| Security & Protection | 135 (77.1%) | 40 (22.9%) |
| Firefighting & Prevention | 25 (38.5%) | 40 (61.5%) |
| Law Enforcement | 110 (100.0%) | 0 (0.0%) |
| Food Preparation & Serving | 118 (57.3%) | 88 (42.7%) |
| Cleaning & Maintenance | 112 (100.0%) | 0 (0.0%) |
| Personal Care & Service | 48 (26.8%) | 131 (73.2%) |
| Total (Category) | 413 (58.3%) | 295 (41.7%) |
| Total (Overall) | 3,552 (53.3%) | 3,111 (46.7%) |
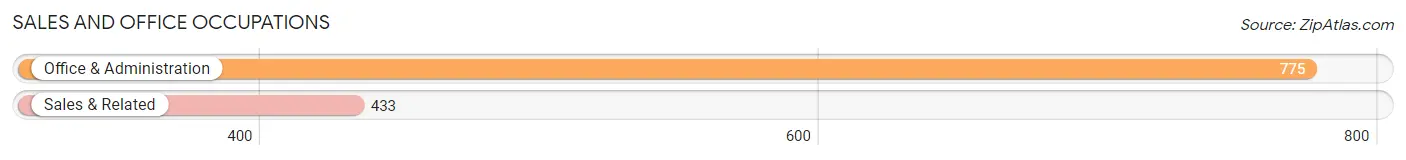
Sales and Office Occupations
The most common Sales and Office occupations in Crestwood are Office & Administration (775 | 11.6%), and Sales & Related (433 | 6.5%).
Sales and Office Occupations by Sex
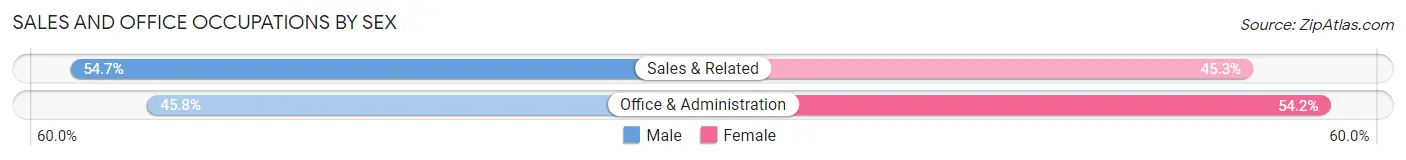
| Occupation | Male | Female |
| Sales & Related | 237 (54.7%) | 196 (45.3%) |
| Office & Administration | 355 (45.8%) | 420 (54.2%) |
| Total (Category) | 592 (49.0%) | 616 (51.0%) |
| Total (Overall) | 3,552 (53.3%) | 3,111 (46.7%) |
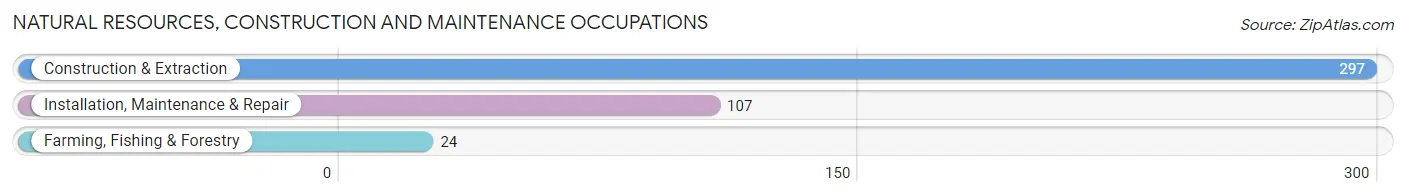
Natural Resources, Construction and Maintenance Occupations
The most common Natural Resources, Construction and Maintenance occupations in Crestwood are Construction & Extraction (297 | 4.5%), Installation, Maintenance & Repair (107 | 1.6%), and Farming, Fishing & Forestry (24 | 0.4%).
Natural Resources, Construction and Maintenance Occupations by Sex
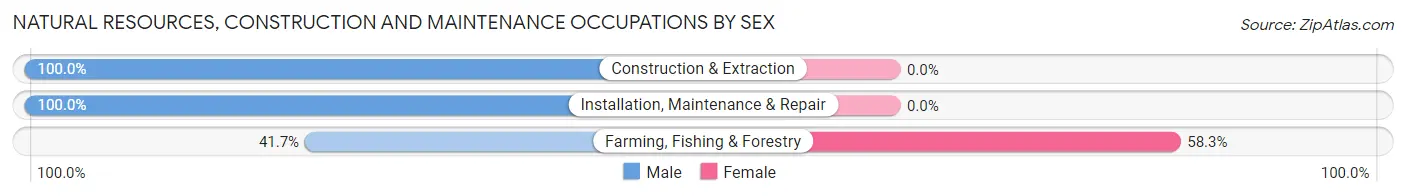
| Occupation | Male | Female |
| Farming, Fishing & Forestry | 10 (41.7%) | 14 (58.3%) |
| Construction & Extraction | 297 (100.0%) | 0 (0.0%) |
| Installation, Maintenance & Repair | 107 (100.0%) | 0 (0.0%) |
| Total (Category) | 414 (96.7%) | 14 (3.3%) |
| Total (Overall) | 3,552 (53.3%) | 3,111 (46.7%) |
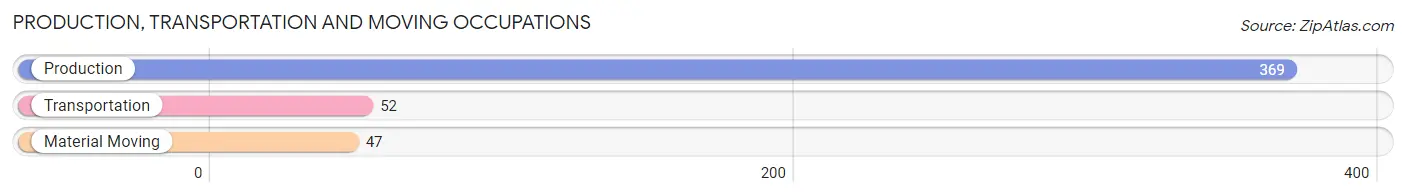
Production, Transportation and Moving Occupations
The most common Production, Transportation and Moving occupations in Crestwood are Production (369 | 5.5%), Transportation (52 | 0.8%), and Material Moving (47 | 0.7%).
Production, Transportation and Moving Occupations by Sex
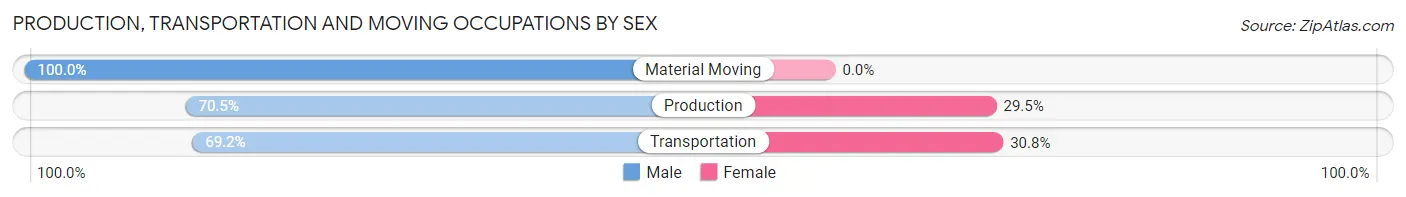
| Occupation | Male | Female |
| Production | 260 (70.5%) | 109 (29.5%) |
| Transportation | 36 (69.2%) | 16 (30.8%) |
| Material Moving | 47 (100.0%) | 0 (0.0%) |
| Total (Category) | 343 (73.3%) | 125 (26.7%) |
| Total (Overall) | 3,552 (53.3%) | 3,111 (46.7%) |
Employment Industries by Sex in Crestwood
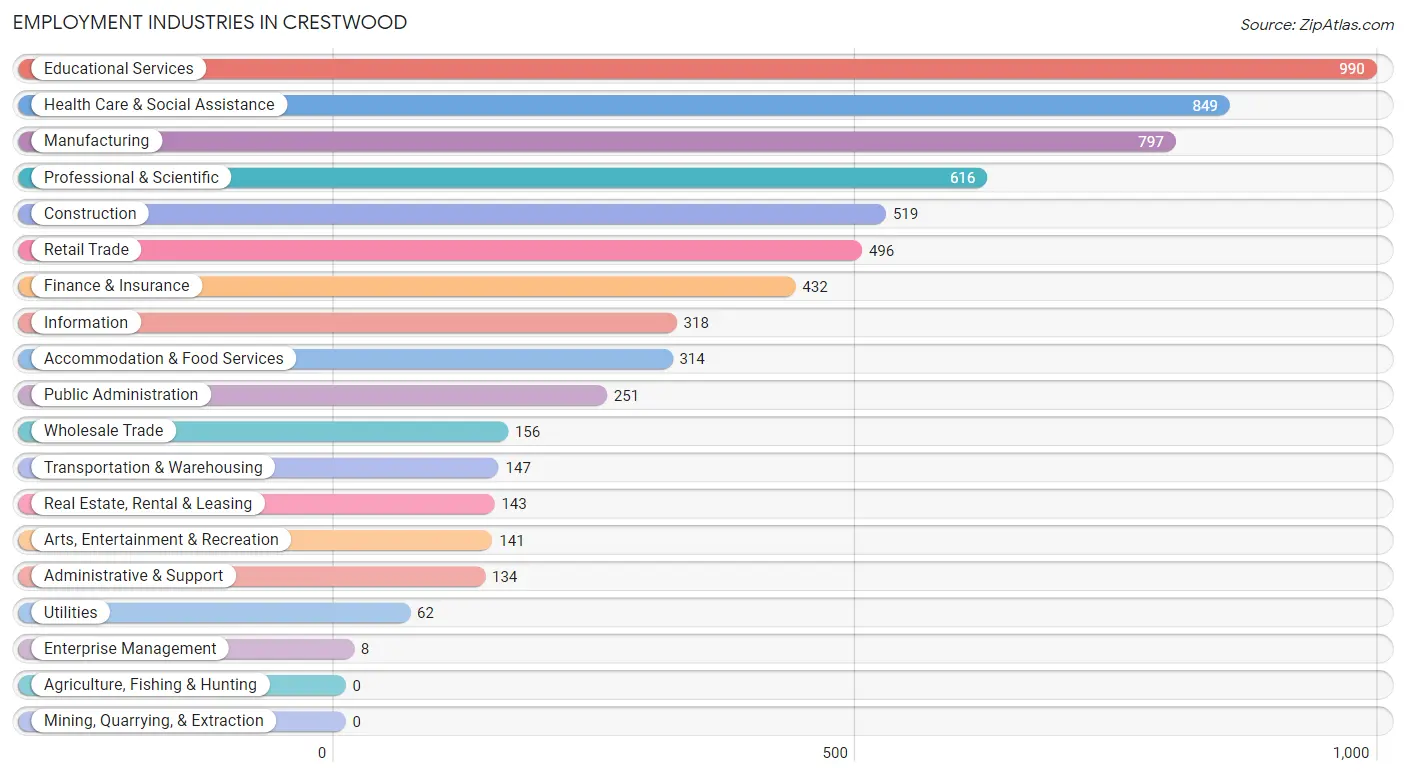
Employment Industries in Crestwood
The major employment industries in Crestwood include Educational Services (990 | 14.9%), Health Care & Social Assistance (849 | 12.7%), Manufacturing (797 | 12.0%), Professional & Scientific (616 | 9.2%), and Construction (519 | 7.8%).
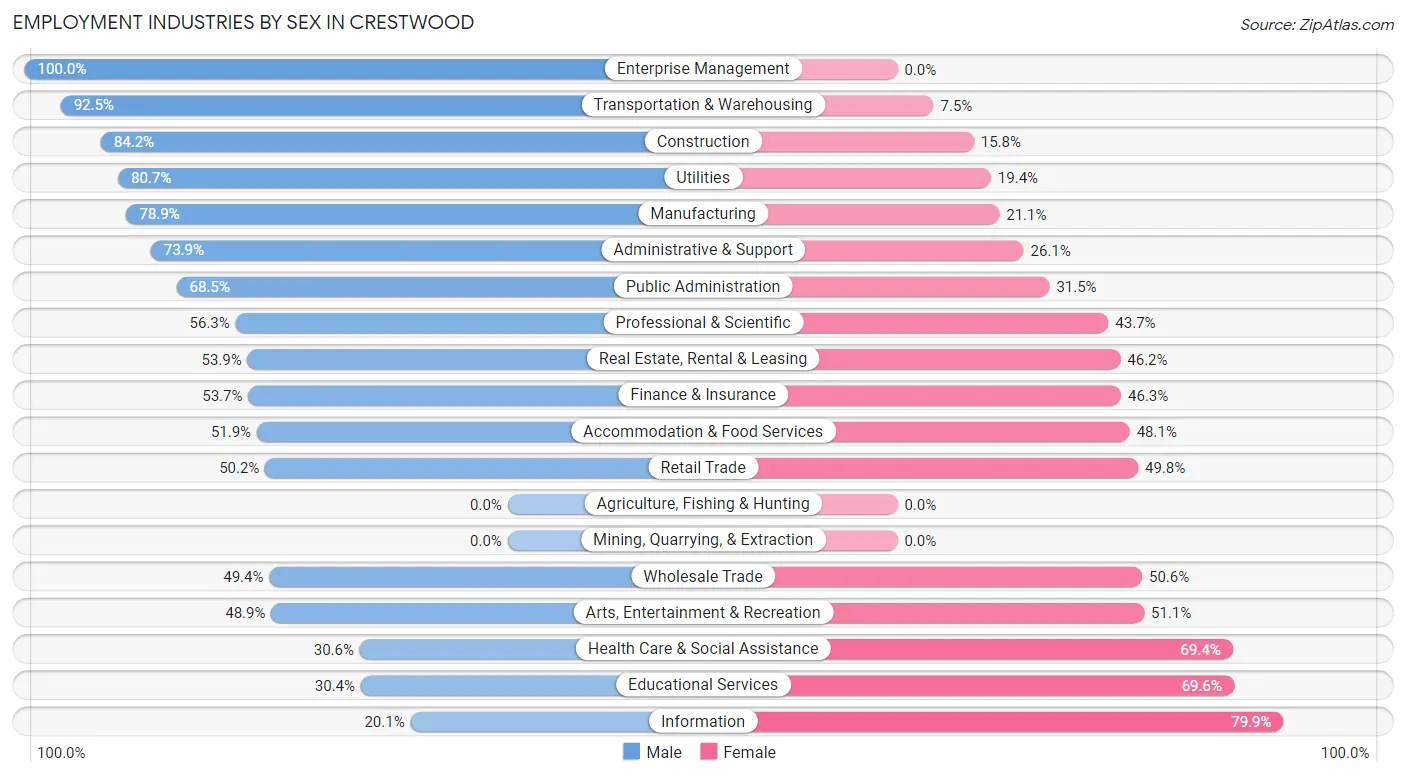
Employment Industries by Sex in Crestwood
The Crestwood industries that see more men than women are Enterprise Management (100.0%), Transportation & Warehousing (92.5%), and Construction (84.2%), whereas the industries that tend to have a higher number of women are Information (79.9%), Educational Services (69.6%), and Health Care & Social Assistance (69.4%).
| Industry | Male | Female |
| Agriculture, Fishing & Hunting | 0 (0.0%) | 0 (0.0%) |
| Mining, Quarrying, & Extraction | 0 (0.0%) | 0 (0.0%) |
| Construction | 437 (84.2%) | 82 (15.8%) |
| Manufacturing | 629 (78.9%) | 168 (21.1%) |
| Wholesale Trade | 77 (49.4%) | 79 (50.6%) |
| Retail Trade | 249 (50.2%) | 247 (49.8%) |
| Transportation & Warehousing | 136 (92.5%) | 11 (7.5%) |
| Utilities | 50 (80.6%) | 12 (19.4%) |
| Information | 64 (20.1%) | 254 (79.9%) |
| Finance & Insurance | 232 (53.7%) | 200 (46.3%) |
| Real Estate, Rental & Leasing | 77 (53.8%) | 66 (46.2%) |
| Professional & Scientific | 347 (56.3%) | 269 (43.7%) |
| Enterprise Management | 8 (100.0%) | 0 (0.0%) |
| Administrative & Support | 99 (73.9%) | 35 (26.1%) |
| Educational Services | 301 (30.4%) | 689 (69.6%) |
| Health Care & Social Assistance | 260 (30.6%) | 589 (69.4%) |
| Arts, Entertainment & Recreation | 69 (48.9%) | 72 (51.1%) |
| Accommodation & Food Services | 163 (51.9%) | 151 (48.1%) |
| Public Administration | 172 (68.5%) | 79 (31.5%) |
| Total | 3,552 (53.3%) | 3,111 (46.7%) |
Education in Crestwood
School Enrollment in Crestwood
The most common levels of schooling among the 2,629 students in Crestwood are middle school (611 | 23.2%), elementary school (589 | 22.4%), and high school (434 | 16.5%).
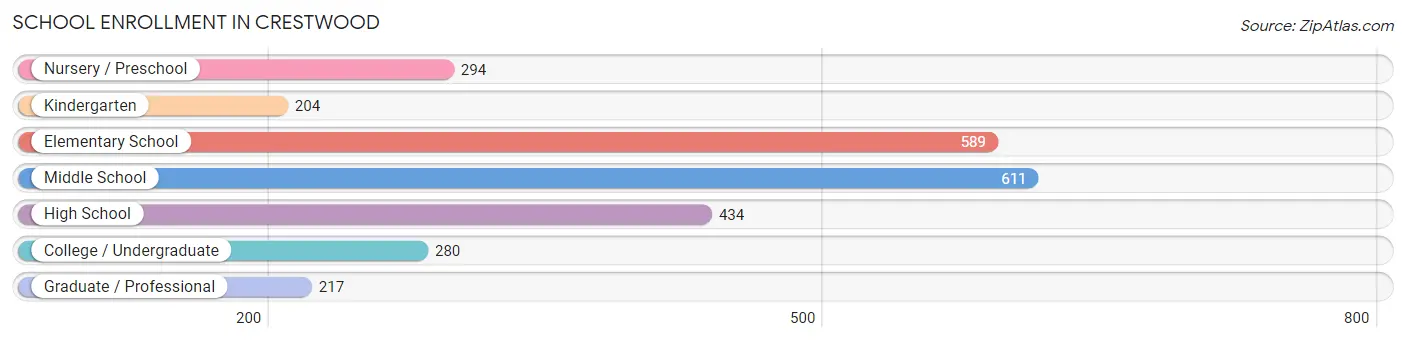
| School Level | # Students | % Students |
| Nursery / Preschool | 294 | 11.2% |
| Kindergarten | 204 | 7.8% |
| Elementary School | 589 | 22.4% |
| Middle School | 611 | 23.2% |
| High School | 434 | 16.5% |
| College / Undergraduate | 280 | 10.6% |
| Graduate / Professional | 217 | 8.3% |
| Total | 2,629 | 100.0% |
School Enrollment by Age by Funding Source in Crestwood
Out of a total of 2,629 students who are enrolled in schools in Crestwood, 873 (33.2%) attend a private institution, while the remaining 1,756 (66.8%) are enrolled in public schools. The age group of 35 years and over has the highest likelihood of being enrolled in private schools, with 75 (64.1% in the age bracket) enrolled. Conversely, the age group of 10 to 14 year olds has the lowest likelihood of being enrolled in a private school, with 572 (81.4% in the age bracket) attending a public institution.
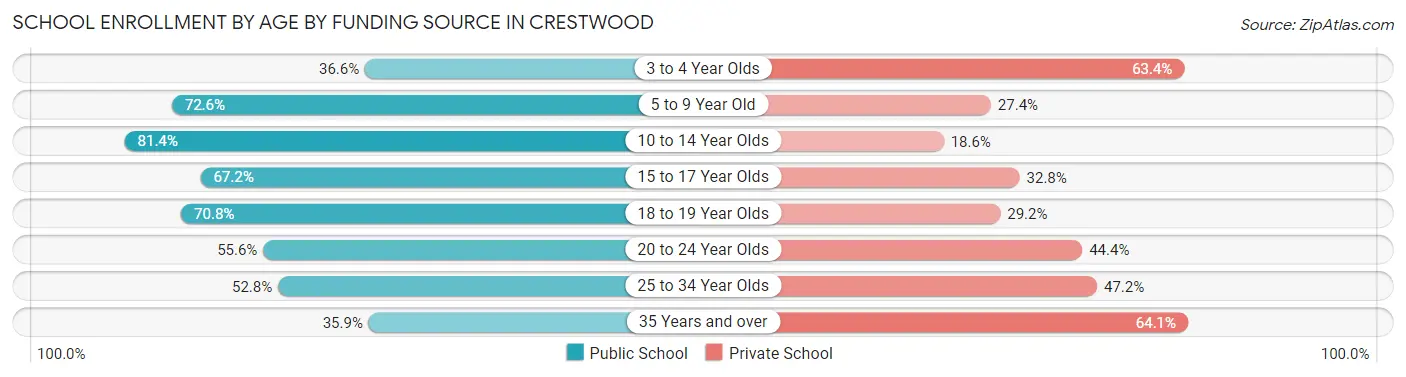
| Age Bracket | Public School | Private School |
| 3 to 4 Year Olds | 94 (36.6%) | 163 (63.4%) |
| 5 to 9 Year Old | 548 (72.6%) | 207 (27.4%) |
| 10 to 14 Year Olds | 572 (81.4%) | 131 (18.6%) |
| 15 to 17 Year Olds | 238 (67.2%) | 116 (32.8%) |
| 18 to 19 Year Olds | 85 (70.8%) | 35 (29.2%) |
| 20 to 24 Year Olds | 110 (55.6%) | 88 (44.4%) |
| 25 to 34 Year Olds | 66 (52.8%) | 59 (47.2%) |
| 35 Years and over | 42 (35.9%) | 75 (64.1%) |
| Total | 1,756 (66.8%) | 873 (33.2%) |
Educational Attainment by Field of Study in Crestwood
Business (1,324 | 23.4%), education (897 | 15.9%), science & technology (615 | 10.9%), engineering (422 | 7.5%), and social sciences (367 | 6.5%) are the most common fields of study among 5,652 individuals in Crestwood who have obtained a bachelor's degree or higher.
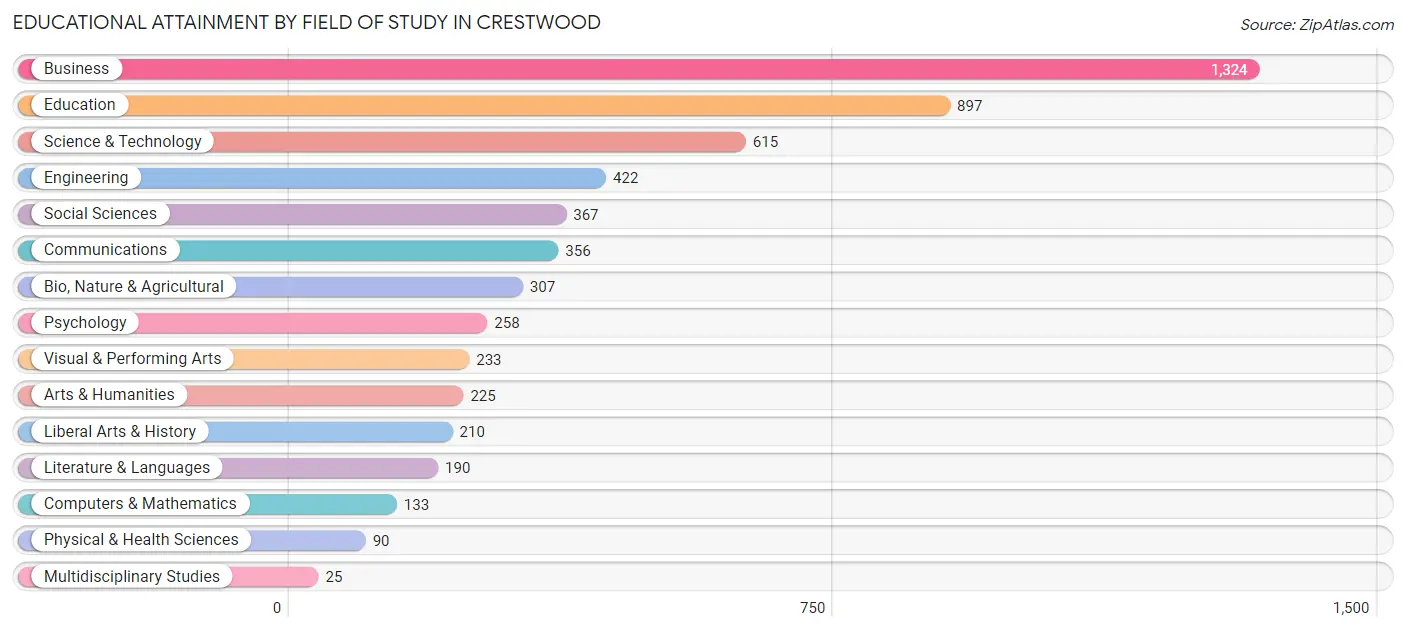
| Field of Study | # Graduates | % Graduates |
| Computers & Mathematics | 133 | 2.4% |
| Bio, Nature & Agricultural | 307 | 5.4% |
| Physical & Health Sciences | 90 | 1.6% |
| Psychology | 258 | 4.6% |
| Social Sciences | 367 | 6.5% |
| Engineering | 422 | 7.5% |
| Multidisciplinary Studies | 25 | 0.4% |
| Science & Technology | 615 | 10.9% |
| Business | 1,324 | 23.4% |
| Education | 897 | 15.9% |
| Literature & Languages | 190 | 3.4% |
| Liberal Arts & History | 210 | 3.7% |
| Visual & Performing Arts | 233 | 4.1% |
| Communications | 356 | 6.3% |
| Arts & Humanities | 225 | 4.0% |
| Total | 5,652 | 100.0% |
Transportation & Commute in Crestwood
Vehicle Availability by Sex in Crestwood
The most prevalent vehicle ownership categories in Crestwood are males with 2 vehicles (1,859, accounting for 52.4%) and females with 2 vehicles (1,721, making up 62.2%).
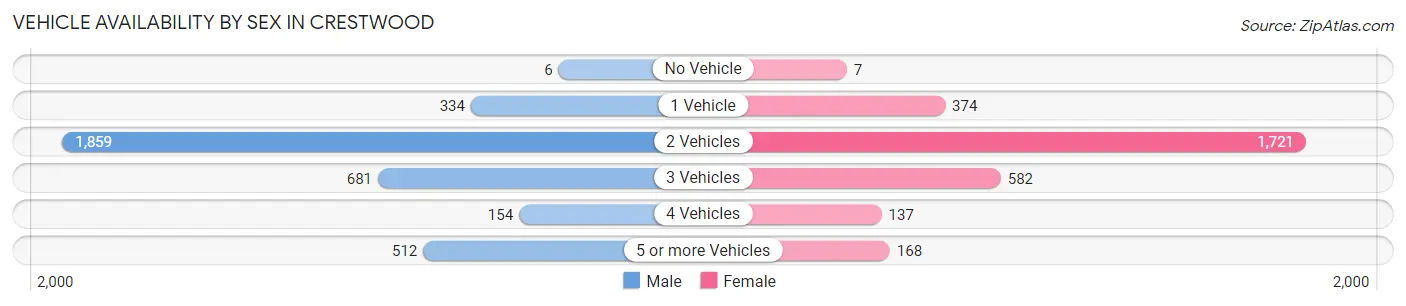
| Vehicles Available | Male | Female |
| No Vehicle | 6 (0.2%) | 7 (0.2%) |
| 1 Vehicle | 334 (9.4%) | 374 (12.5%) |
| 2 Vehicles | 1,859 (52.4%) | 1,721 (57.6%) |
| 3 Vehicles | 681 (19.2%) | 582 (19.5%) |
| 4 Vehicles | 154 (4.3%) | 137 (4.6%) |
| 5 or more Vehicles | 512 (14.4%) | 168 (5.6%) |
| Total | 3,546 (100.0%) | 2,989 (100.0%) |
Commute Time in Crestwood
The most frequently occuring commute durations in Crestwood are 20 to 24 minutes (1,324 commuters, 24.2%), 15 to 19 minutes (981 commuters, 17.9%), and 30 to 34 minutes (935 commuters, 17.1%).
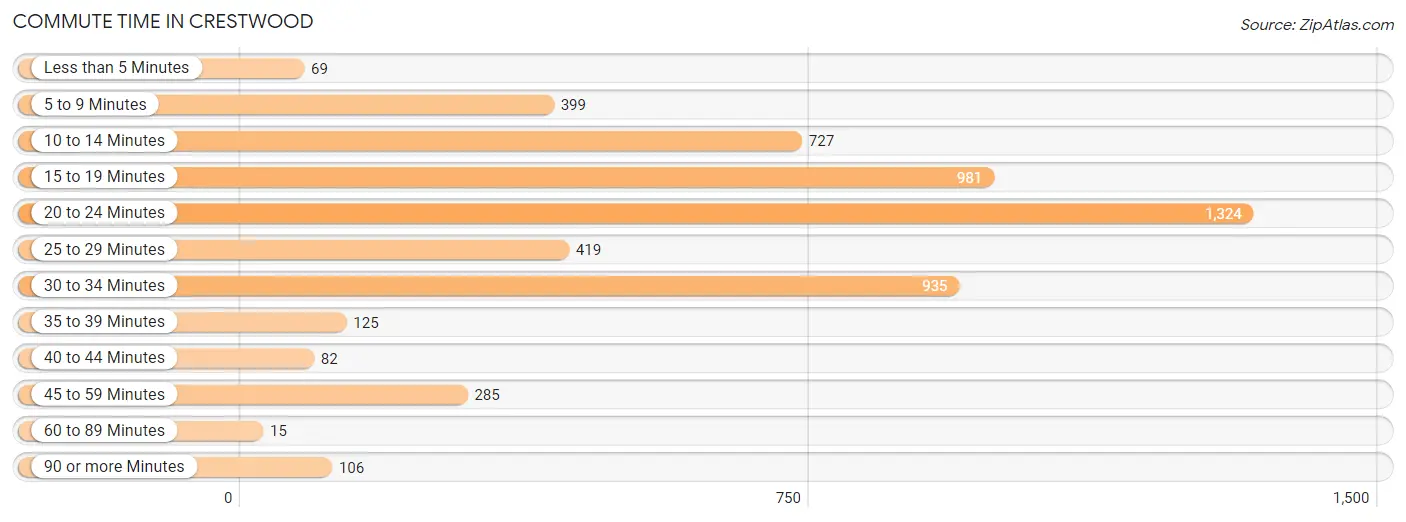
| Commute Time | # Commuters | % Commuters |
| Less than 5 Minutes | 69 | 1.3% |
| 5 to 9 Minutes | 399 | 7.3% |
| 10 to 14 Minutes | 727 | 13.3% |
| 15 to 19 Minutes | 981 | 17.9% |
| 20 to 24 Minutes | 1,324 | 24.2% |
| 25 to 29 Minutes | 419 | 7.7% |
| 30 to 34 Minutes | 935 | 17.1% |
| 35 to 39 Minutes | 125 | 2.3% |
| 40 to 44 Minutes | 82 | 1.5% |
| 45 to 59 Minutes | 285 | 5.2% |
| 60 to 89 Minutes | 15 | 0.3% |
| 90 or more Minutes | 106 | 1.9% |
Commute Time by Sex in Crestwood
The most common commute times in Crestwood are 30 to 34 minutes (715 commuters, 23.8%) for males and 20 to 24 minutes (686 commuters, 27.9%) for females.
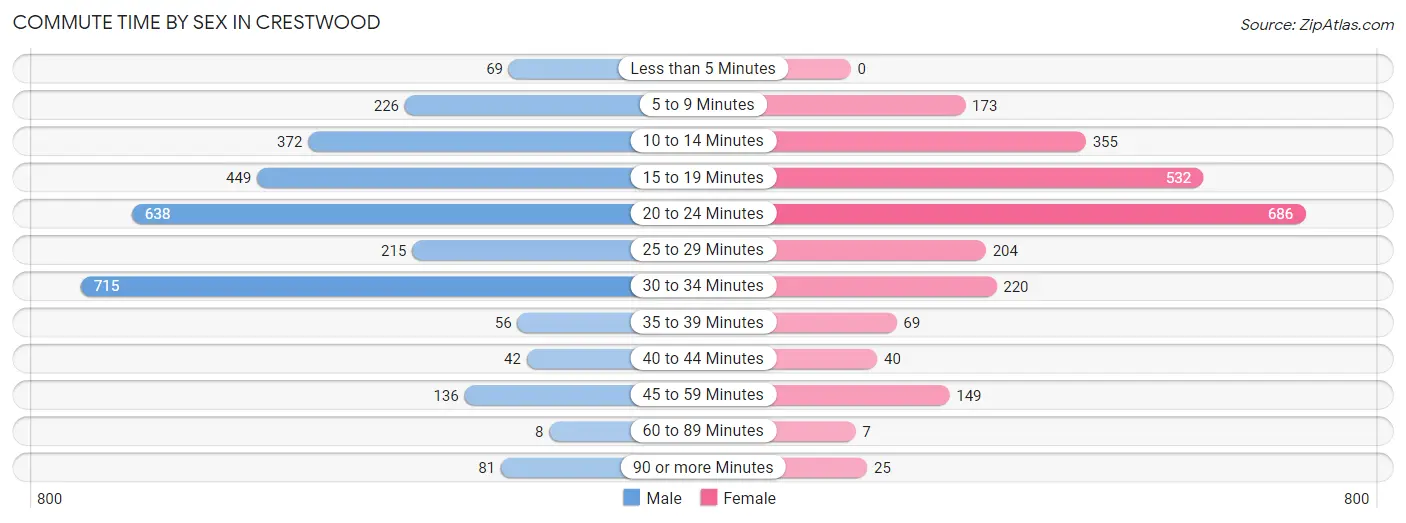
| Commute Time | Male | Female |
| Less than 5 Minutes | 69 (2.3%) | 0 (0.0%) |
| 5 to 9 Minutes | 226 (7.5%) | 173 (7.0%) |
| 10 to 14 Minutes | 372 (12.4%) | 355 (14.4%) |
| 15 to 19 Minutes | 449 (14.9%) | 532 (21.6%) |
| 20 to 24 Minutes | 638 (21.2%) | 686 (27.9%) |
| 25 to 29 Minutes | 215 (7.1%) | 204 (8.3%) |
| 30 to 34 Minutes | 715 (23.8%) | 220 (8.9%) |
| 35 to 39 Minutes | 56 (1.9%) | 69 (2.8%) |
| 40 to 44 Minutes | 42 (1.4%) | 40 (1.6%) |
| 45 to 59 Minutes | 136 (4.5%) | 149 (6.1%) |
| 60 to 89 Minutes | 8 (0.3%) | 7 (0.3%) |
| 90 or more Minutes | 81 (2.7%) | 25 (1.0%) |
Time of Departure to Work by Sex in Crestwood
The most frequent times of departure to work in Crestwood are 7:30 AM to 7:59 AM (650, 21.6%) for males and 7:00 AM to 7:29 AM (535, 21.7%) for females.
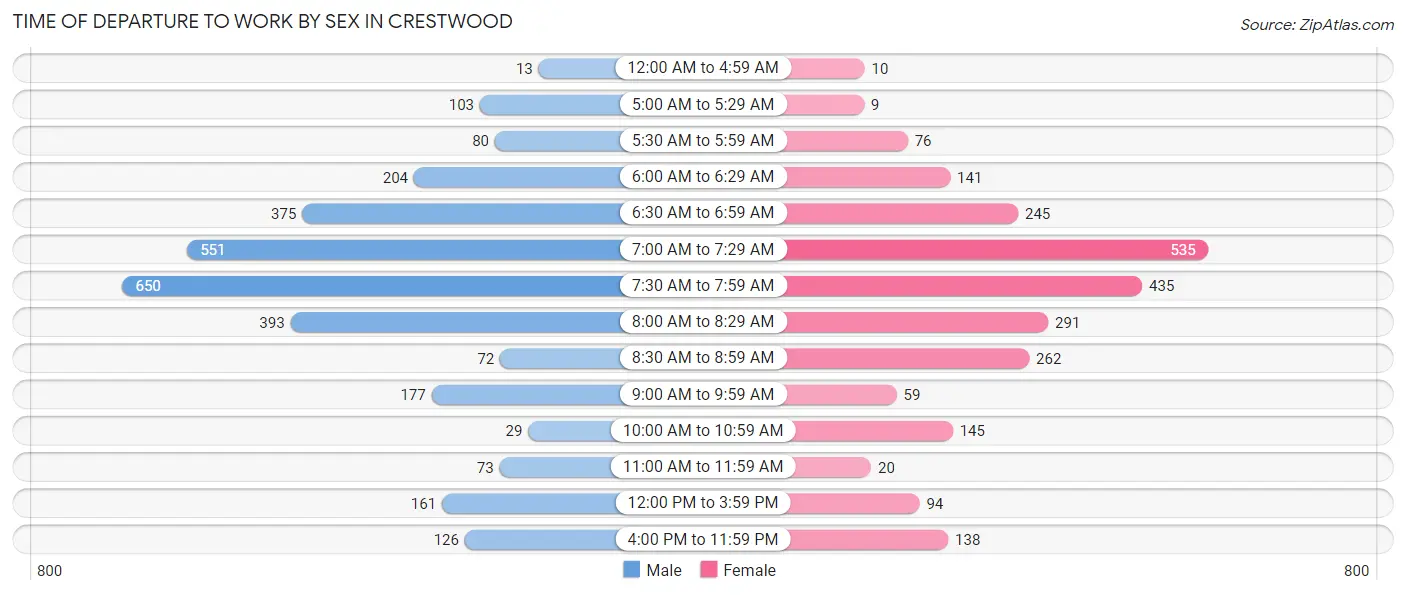
| Time of Departure | Male | Female |
| 12:00 AM to 4:59 AM | 13 (0.4%) | 10 (0.4%) |
| 5:00 AM to 5:29 AM | 103 (3.4%) | 9 (0.4%) |
| 5:30 AM to 5:59 AM | 80 (2.7%) | 76 (3.1%) |
| 6:00 AM to 6:29 AM | 204 (6.8%) | 141 (5.7%) |
| 6:30 AM to 6:59 AM | 375 (12.5%) | 245 (10.0%) |
| 7:00 AM to 7:29 AM | 551 (18.3%) | 535 (21.7%) |
| 7:30 AM to 7:59 AM | 650 (21.6%) | 435 (17.7%) |
| 8:00 AM to 8:29 AM | 393 (13.1%) | 291 (11.8%) |
| 8:30 AM to 8:59 AM | 72 (2.4%) | 262 (10.6%) |
| 9:00 AM to 9:59 AM | 177 (5.9%) | 59 (2.4%) |
| 10:00 AM to 10:59 AM | 29 (1.0%) | 145 (5.9%) |
| 11:00 AM to 11:59 AM | 73 (2.4%) | 20 (0.8%) |
| 12:00 PM to 3:59 PM | 161 (5.3%) | 94 (3.8%) |
| 4:00 PM to 11:59 PM | 126 (4.2%) | 138 (5.6%) |
| Total | 3,007 (100.0%) | 2,460 (100.0%) |
Housing Occupancy in Crestwood
Occupancy by Ownership in Crestwood
Of the total 4,827 dwellings in Crestwood, owner-occupied units account for 4,221 (87.5%), while renter-occupied units make up 606 (12.6%).
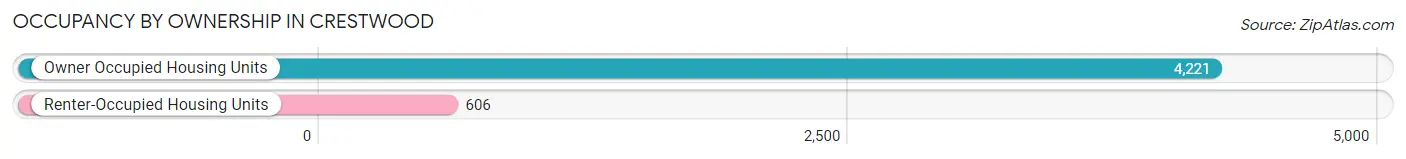
| Occupancy | # Housing Units | % Housing Units |
| Owner Occupied Housing Units | 4,221 | 87.5% |
| Renter-Occupied Housing Units | 606 | 12.6% |
| Total Occupied Housing Units | 4,827 | 100.0% |
Occupancy by Household Size in Crestwood
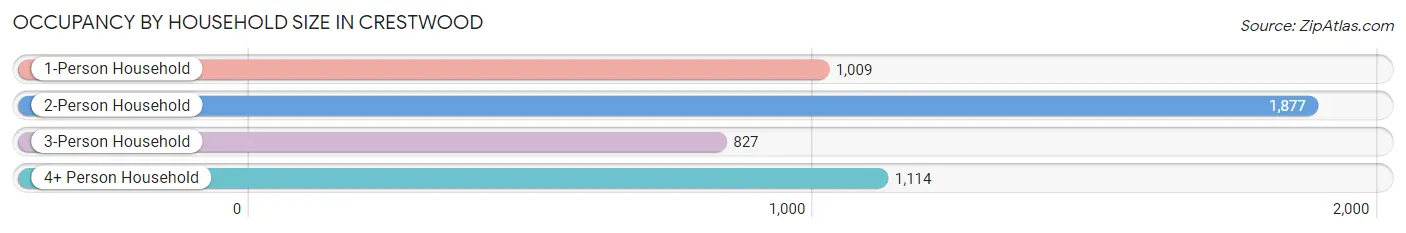
| Household Size | # Housing Units | % Housing Units |
| 1-Person Household | 1,009 | 20.9% |
| 2-Person Household | 1,877 | 38.9% |
| 3-Person Household | 827 | 17.1% |
| 4+ Person Household | 1,114 | 23.1% |
| Total Housing Units | 4,827 | 100.0% |
Occupancy by Ownership by Household Size in Crestwood
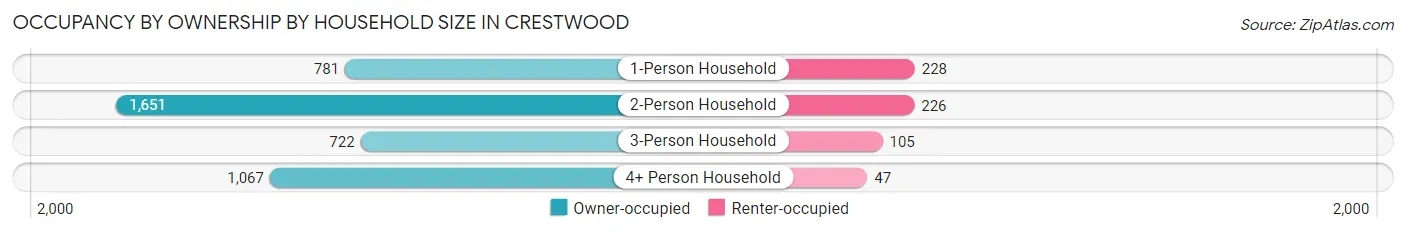
| Household Size | Owner-occupied | Renter-occupied |
| 1-Person Household | 781 (77.4%) | 228 (22.6%) |
| 2-Person Household | 1,651 (88.0%) | 226 (12.0%) |
| 3-Person Household | 722 (87.3%) | 105 (12.7%) |
| 4+ Person Household | 1,067 (95.8%) | 47 (4.2%) |
| Total Housing Units | 4,221 (87.5%) | 606 (12.6%) |
Occupancy by Educational Attainment in Crestwood
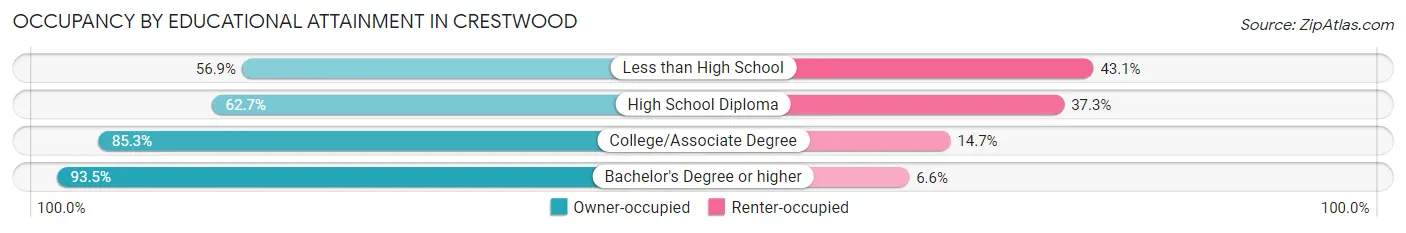
| Household Size | Owner-occupied | Renter-occupied |
| Less than High School | 74 (56.9%) | 56 (43.1%) |
| High School Diploma | 286 (62.7%) | 170 (37.3%) |
| College/Associate Degree | 1,065 (85.3%) | 184 (14.7%) |
| Bachelor's Degree or higher | 2,796 (93.4%) | 196 (6.6%) |
Occupancy by Age of Householder in Crestwood
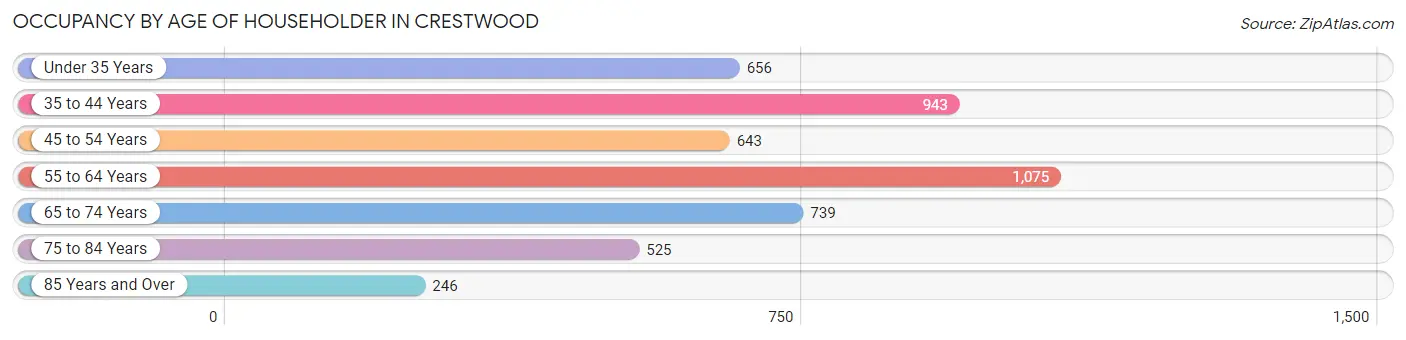
| Age Bracket | # Households | % Households |
| Under 35 Years | 656 | 13.6% |
| 35 to 44 Years | 943 | 19.5% |
| 45 to 54 Years | 643 | 13.3% |
| 55 to 64 Years | 1,075 | 22.3% |
| 65 to 74 Years | 739 | 15.3% |
| 75 to 84 Years | 525 | 10.9% |
| 85 Years and Over | 246 | 5.1% |
| Total | 4,827 | 100.0% |
Housing Finances in Crestwood
Median Income by Occupancy in Crestwood
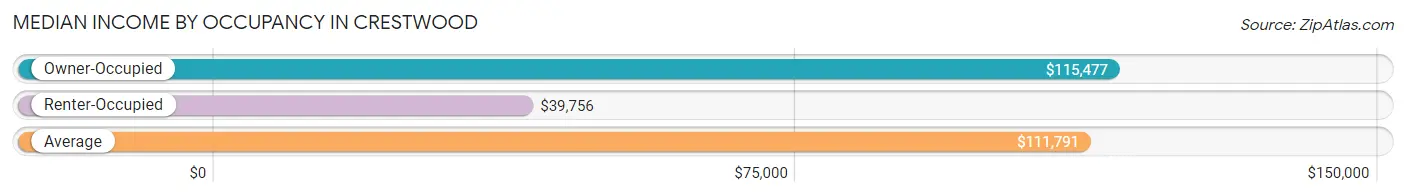
| Occupancy Type | # Households | Median Income |
| Owner-Occupied | 4,221 (87.5%) | $115,477 |
| Renter-Occupied | 606 (12.6%) | $39,756 |
| Average | 4,827 (100.0%) | $111,791 |
Occupancy by Householder Income Bracket in Crestwood
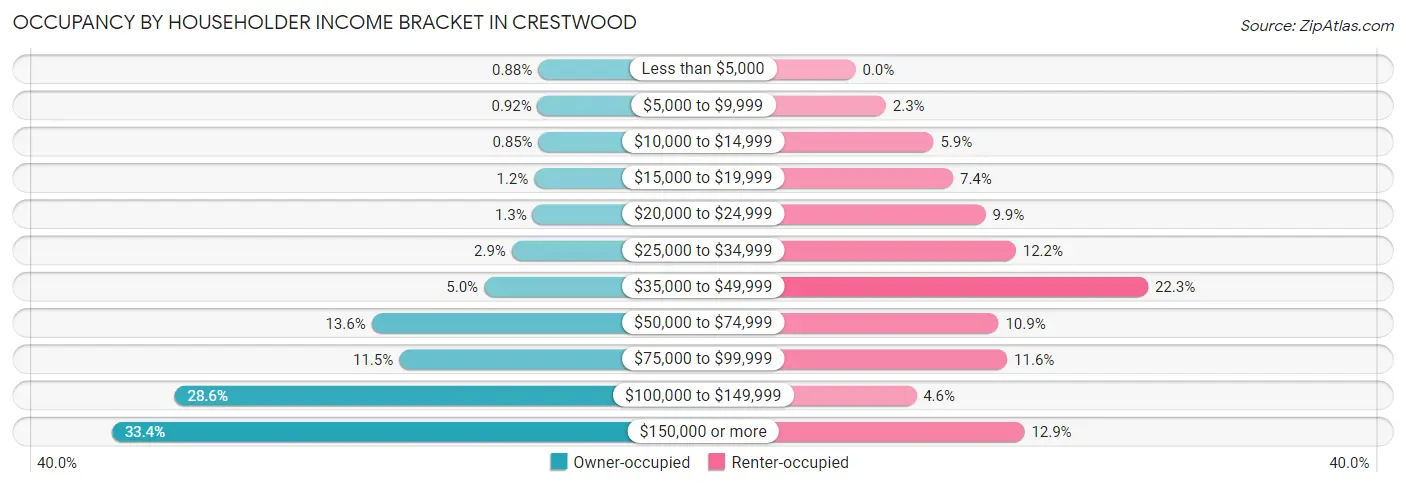
| Income Bracket | Owner-occupied | Renter-occupied |
| Less than $5,000 | 37 (0.9%) | 0 (0.0%) |
| $5,000 to $9,999 | 39 (0.9%) | 14 (2.3%) |
| $10,000 to $14,999 | 36 (0.9%) | 36 (5.9%) |
| $15,000 to $19,999 | 50 (1.2%) | 45 (7.4%) |
| $20,000 to $24,999 | 55 (1.3%) | 60 (9.9%) |
| $25,000 to $34,999 | 122 (2.9%) | 74 (12.2%) |
| $35,000 to $49,999 | 211 (5.0%) | 135 (22.3%) |
| $50,000 to $74,999 | 573 (13.6%) | 66 (10.9%) |
| $75,000 to $99,999 | 484 (11.5%) | 70 (11.6%) |
| $100,000 to $149,999 | 1,206 (28.6%) | 28 (4.6%) |
| $150,000 or more | 1,408 (33.4%) | 78 (12.9%) |
| Total | 4,221 (100.0%) | 606 (100.0%) |
Monthly Housing Cost Tiers in Crestwood
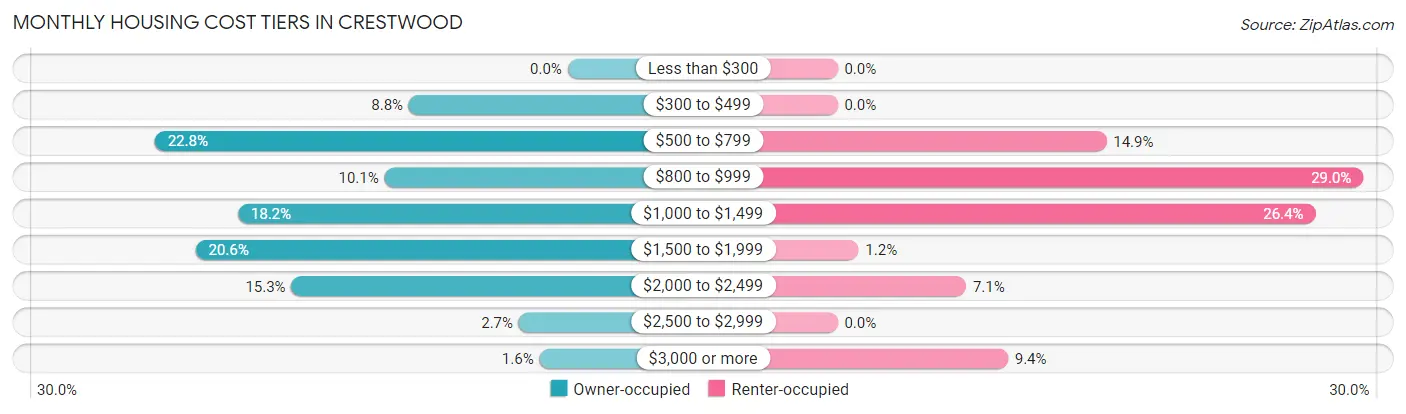
| Monthly Cost | Owner-occupied | Renter-occupied |
| Less than $300 | 0 (0.0%) | 0 (0.0%) |
| $300 to $499 | 370 (8.8%) | 0 (0.0%) |
| $500 to $799 | 963 (22.8%) | 90 (14.8%) |
| $800 to $999 | 427 (10.1%) | 176 (29.0%) |
| $1,000 to $1,499 | 769 (18.2%) | 160 (26.4%) |
| $1,500 to $1,999 | 868 (20.6%) | 7 (1.2%) |
| $2,000 to $2,499 | 644 (15.3%) | 43 (7.1%) |
| $2,500 to $2,999 | 114 (2.7%) | 0 (0.0%) |
| $3,000 or more | 66 (1.6%) | 57 (9.4%) |
| Total | 4,221 (100.0%) | 606 (100.0%) |
Physical Housing Characteristics in Crestwood
Housing Structures in Crestwood
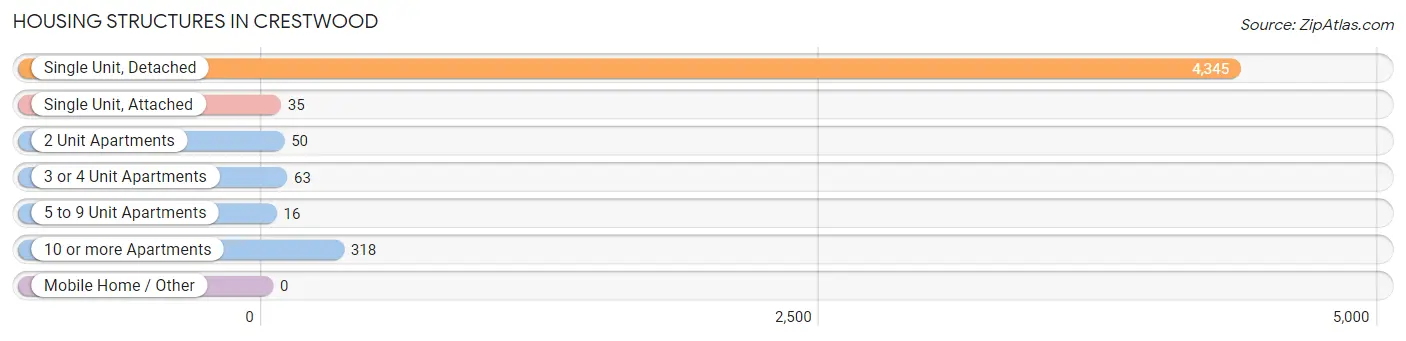
| Structure Type | # Housing Units | % Housing Units |
| Single Unit, Detached | 4,345 | 90.0% |
| Single Unit, Attached | 35 | 0.7% |
| 2 Unit Apartments | 50 | 1.0% |
| 3 or 4 Unit Apartments | 63 | 1.3% |
| 5 to 9 Unit Apartments | 16 | 0.3% |
| 10 or more Apartments | 318 | 6.6% |
| Mobile Home / Other | 0 | 0.0% |
| Total | 4,827 | 100.0% |
Housing Structures by Occupancy in Crestwood
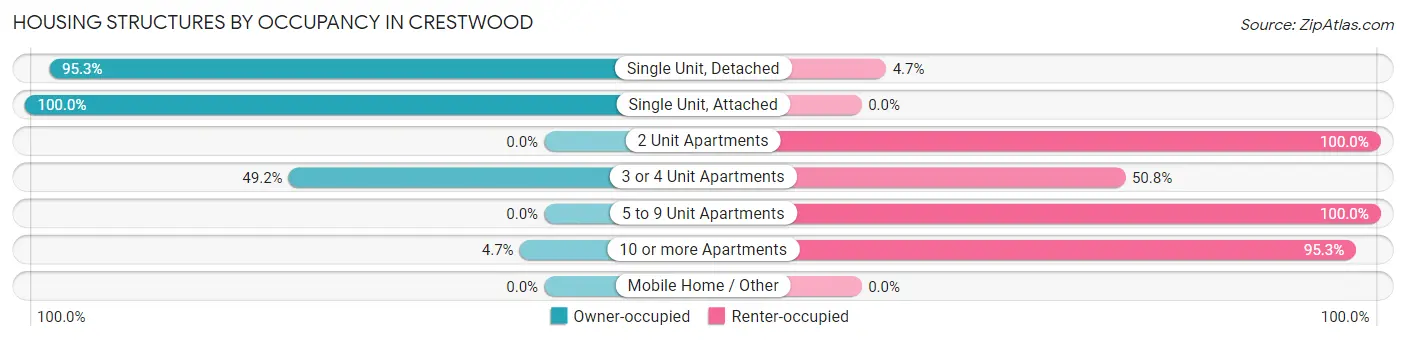
| Structure Type | Owner-occupied | Renter-occupied |
| Single Unit, Detached | 4,140 (95.3%) | 205 (4.7%) |
| Single Unit, Attached | 35 (100.0%) | 0 (0.0%) |
| 2 Unit Apartments | 0 (0.0%) | 50 (100.0%) |
| 3 or 4 Unit Apartments | 31 (49.2%) | 32 (50.8%) |
| 5 to 9 Unit Apartments | 0 (0.0%) | 16 (100.0%) |
| 10 or more Apartments | 15 (4.7%) | 303 (95.3%) |
| Mobile Home / Other | 0 (0.0%) | 0 (0.0%) |
| Total | 4,221 (87.5%) | 606 (12.6%) |
Housing Structures by Number of Rooms in Crestwood
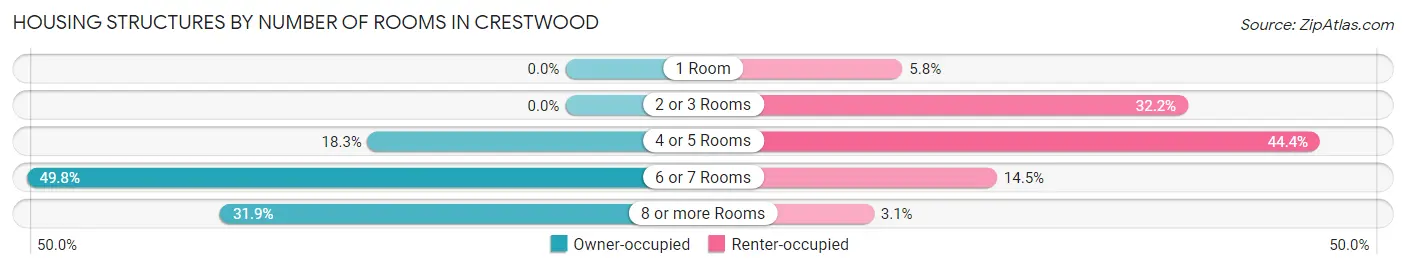
| Number of Rooms | Owner-occupied | Renter-occupied |
| 1 Room | 0 (0.0%) | 35 (5.8%) |
| 2 or 3 Rooms | 0 (0.0%) | 195 (32.2%) |
| 4 or 5 Rooms | 771 (18.3%) | 269 (44.4%) |
| 6 or 7 Rooms | 2,103 (49.8%) | 88 (14.5%) |
| 8 or more Rooms | 1,347 (31.9%) | 19 (3.1%) |
| Total | 4,221 (100.0%) | 606 (100.0%) |
Housing Structure by Heating Type in Crestwood
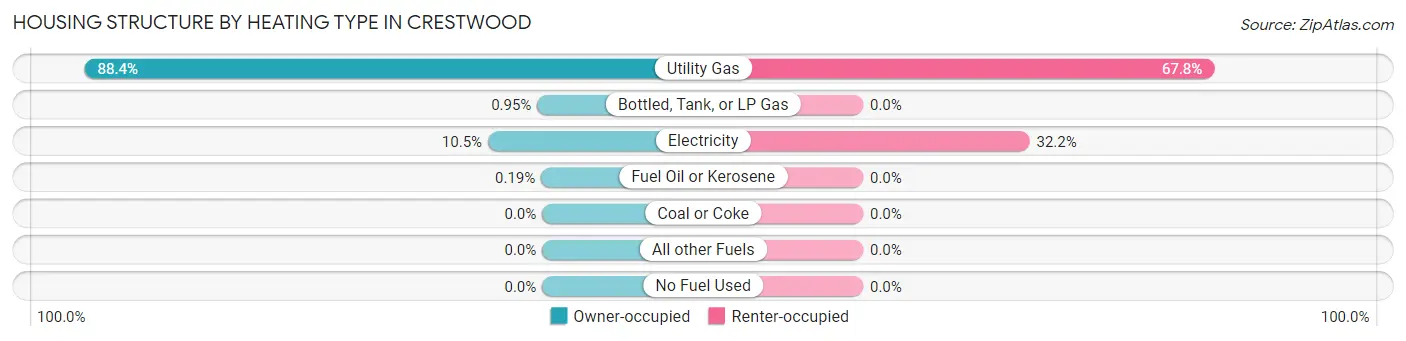
| Heating Type | Owner-occupied | Renter-occupied |
| Utility Gas | 3,731 (88.4%) | 411 (67.8%) |
| Bottled, Tank, or LP Gas | 40 (0.9%) | 0 (0.0%) |
| Electricity | 442 (10.5%) | 195 (32.2%) |
| Fuel Oil or Kerosene | 8 (0.2%) | 0 (0.0%) |
| Coal or Coke | 0 (0.0%) | 0 (0.0%) |
| All other Fuels | 0 (0.0%) | 0 (0.0%) |
| No Fuel Used | 0 (0.0%) | 0 (0.0%) |
| Total | 4,221 (100.0%) | 606 (100.0%) |
Household Vehicle Usage in Crestwood
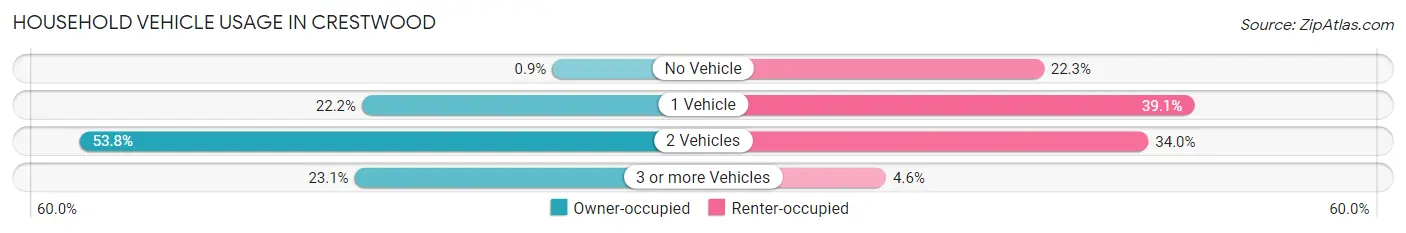
| Vehicles per Household | Owner-occupied | Renter-occupied |
| No Vehicle | 38 (0.9%) | 135 (22.3%) |
| 1 Vehicle | 938 (22.2%) | 237 (39.1%) |
| 2 Vehicles | 2,272 (53.8%) | 206 (34.0%) |
| 3 or more Vehicles | 973 (23.1%) | 28 (4.6%) |
| Total | 4,221 (100.0%) | 606 (100.0%) |
Real Estate & Mortgages in Crestwood
Real Estate and Mortgage Overview in Crestwood
| Characteristic | Without Mortgage | With Mortgage |
| Housing Units | 1,657 | 2,564 |
| Median Property Value | $267,700 | $275,200 |
| Median Household Income | $94,067 | $932 |
| Monthly Housing Costs | $624 | $66 |
| Real Estate Taxes | $3,134 | $0 |
Property Value by Mortgage Status in Crestwood
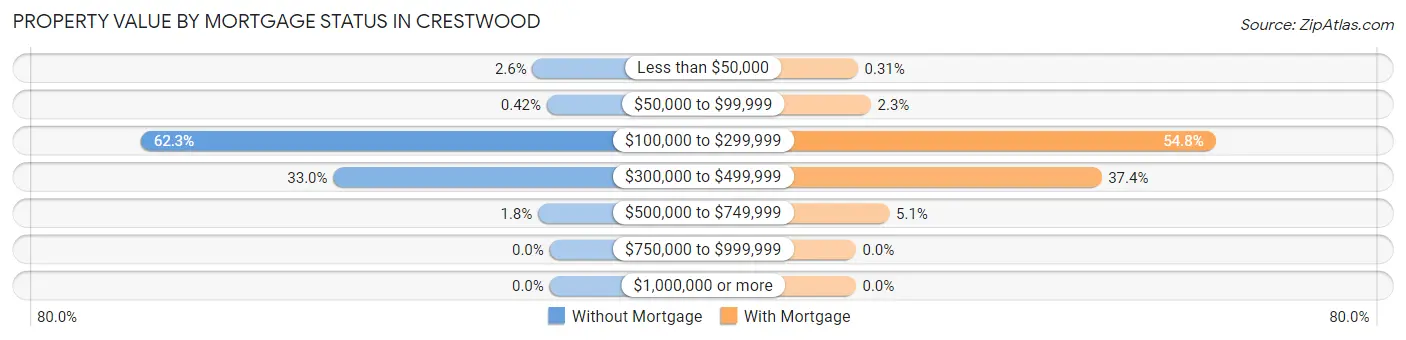
| Property Value | Without Mortgage | With Mortgage |
| Less than $50,000 | 43 (2.6%) | 8 (0.3%) |
| $50,000 to $99,999 | 7 (0.4%) | 59 (2.3%) |
| $100,000 to $299,999 | 1,032 (62.3%) | 1,406 (54.8%) |
| $300,000 to $499,999 | 546 (33.0%) | 960 (37.4%) |
| $500,000 to $749,999 | 29 (1.8%) | 131 (5.1%) |
| $750,000 to $999,999 | 0 (0.0%) | 0 (0.0%) |
| $1,000,000 or more | 0 (0.0%) | 0 (0.0%) |
| Total | 1,657 (100.0%) | 2,564 (100.0%) |
Household Income by Mortgage Status in Crestwood
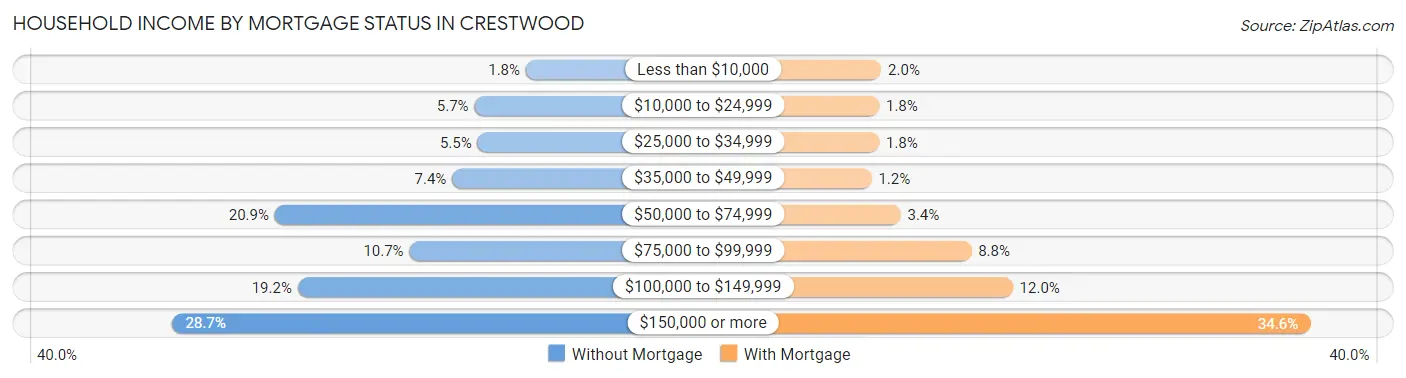
| Household Income | Without Mortgage | With Mortgage |
| Less than $10,000 | 30 (1.8%) | 50 (1.9%) |
| $10,000 to $24,999 | 95 (5.7%) | 46 (1.8%) |
| $25,000 to $34,999 | 91 (5.5%) | 46 (1.8%) |
| $35,000 to $49,999 | 123 (7.4%) | 31 (1.2%) |
| $50,000 to $74,999 | 347 (20.9%) | 88 (3.4%) |
| $75,000 to $99,999 | 177 (10.7%) | 226 (8.8%) |
| $100,000 to $149,999 | 318 (19.2%) | 307 (12.0%) |
| $150,000 or more | 476 (28.7%) | 888 (34.6%) |
| Total | 1,657 (100.0%) | 2,564 (100.0%) |
Property Value to Household Income Ratio in Crestwood
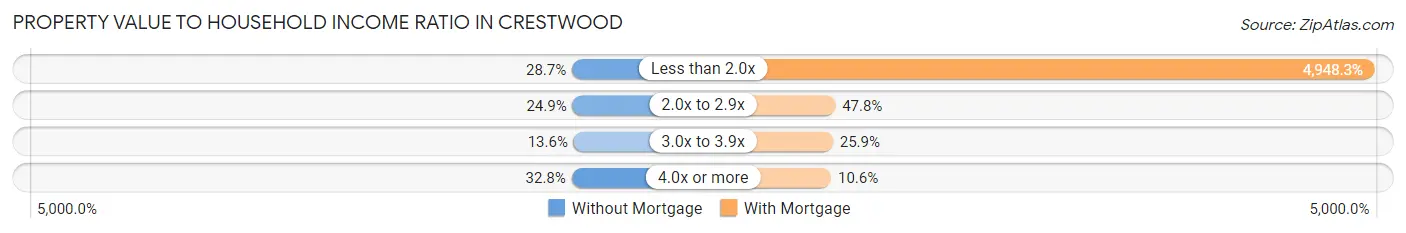
| Value-to-Income Ratio | Without Mortgage | With Mortgage |
| Less than 2.0x | 475 (28.7%) | 126,875 (4,948.3%) |
| 2.0x to 2.9x | 413 (24.9%) | 1,225 (47.8%) |
| 3.0x to 3.9x | 226 (13.6%) | 664 (25.9%) |
| 4.0x or more | 543 (32.8%) | 272 (10.6%) |
| Total | 1,657 (100.0%) | 2,564 (100.0%) |
Real Estate Taxes by Mortgage Status in Crestwood
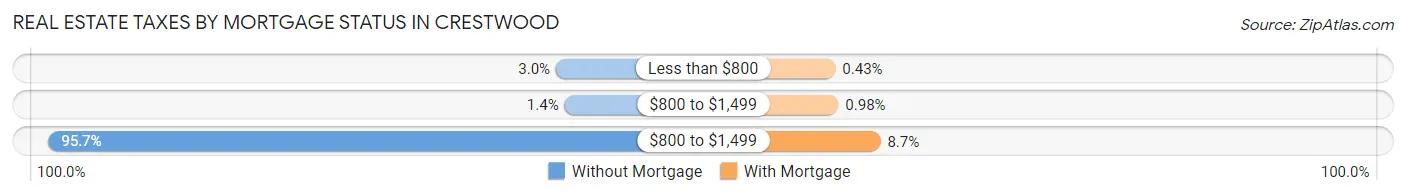
| Property Taxes | Without Mortgage | With Mortgage |
| Less than $800 | 49 (3.0%) | 11 (0.4%) |
| $800 to $1,499 | 23 (1.4%) | 25 (1.0%) |
| $800 to $1,499 | 1,585 (95.7%) | 222 (8.7%) |
| Total | 1,657 (100.0%) | 2,564 (100.0%) |
Health & Disability in Crestwood
Health Insurance Coverage by Age in Crestwood
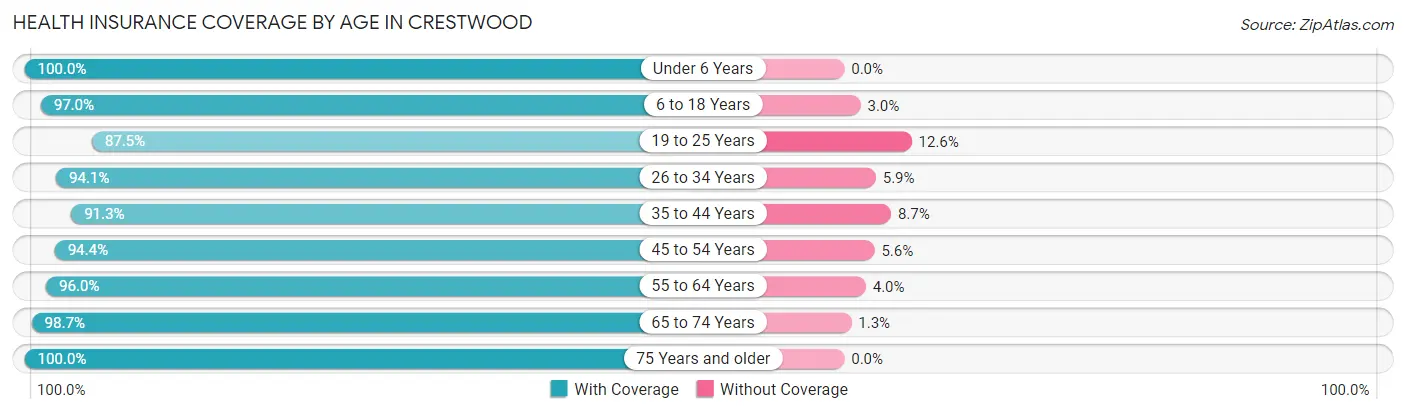
| Age Bracket | With Coverage | Without Coverage |
| Under 6 Years | 871 (100.0%) | 0 (0.0%) |
| 6 to 18 Years | 1,699 (97.0%) | 53 (3.0%) |
| 19 to 25 Years | 411 (87.5%) | 59 (12.6%) |
| 26 to 34 Years | 1,588 (94.1%) | 99 (5.9%) |
| 35 to 44 Years | 1,679 (91.3%) | 160 (8.7%) |
| 45 to 54 Years | 1,206 (94.4%) | 72 (5.6%) |
| 55 to 64 Years | 2,085 (96.0%) | 87 (4.0%) |
| 65 to 74 Years | 1,119 (98.7%) | 15 (1.3%) |
| 75 Years and older | 1,085 (100.0%) | 0 (0.0%) |
| Total | 11,743 (95.6%) | 545 (4.4%) |
Health Insurance Coverage by Citizenship Status in Crestwood
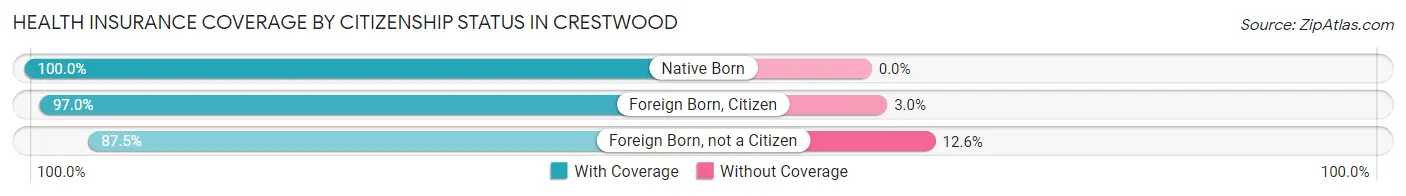
| Citizenship Status | With Coverage | Without Coverage |
| Native Born | 871 (100.0%) | 0 (0.0%) |
| Foreign Born, Citizen | 1,699 (97.0%) | 53 (3.0%) |
| Foreign Born, not a Citizen | 411 (87.5%) | 59 (12.6%) |
Health Insurance Coverage by Household Income in Crestwood
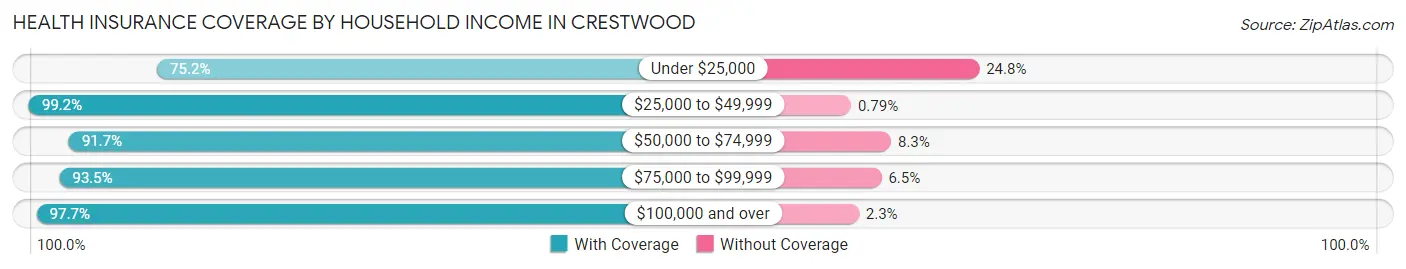
| Household Income | With Coverage | Without Coverage |
| Under $25,000 | 485 (75.2%) | 160 (24.8%) |
| $25,000 to $49,999 | 874 (99.2%) | 7 (0.8%) |
| $50,000 to $74,999 | 1,129 (91.7%) | 102 (8.3%) |
| $75,000 to $99,999 | 1,252 (93.5%) | 87 (6.5%) |
| $100,000 and over | 7,992 (97.7%) | 185 (2.3%) |
Public vs Private Health Insurance Coverage by Age in Crestwood
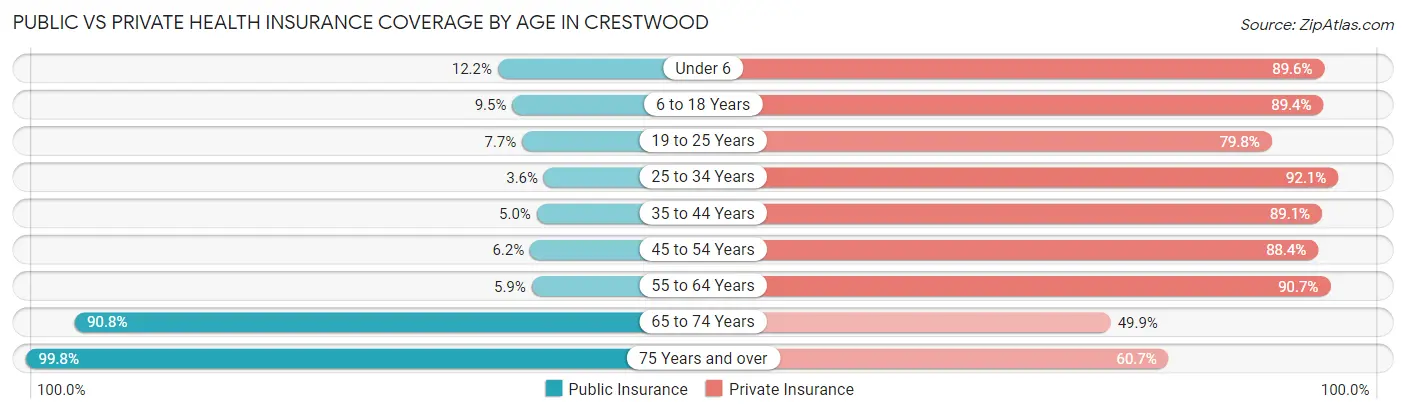
| Age Bracket | Public Insurance | Private Insurance |
| Under 6 | 106 (12.2%) | 780 (89.5%) |
| 6 to 18 Years | 166 (9.5%) | 1,566 (89.4%) |
| 19 to 25 Years | 36 (7.7%) | 375 (79.8%) |
| 25 to 34 Years | 61 (3.6%) | 1,554 (92.1%) |
| 35 to 44 Years | 91 (5.0%) | 1,639 (89.1%) |
| 45 to 54 Years | 79 (6.2%) | 1,130 (88.4%) |
| 55 to 64 Years | 128 (5.9%) | 1,969 (90.6%) |
| 65 to 74 Years | 1,030 (90.8%) | 566 (49.9%) |
| 75 Years and over | 1,083 (99.8%) | 658 (60.7%) |
| Total | 2,780 (22.6%) | 10,237 (83.3%) |
Disability Status by Sex by Age in Crestwood
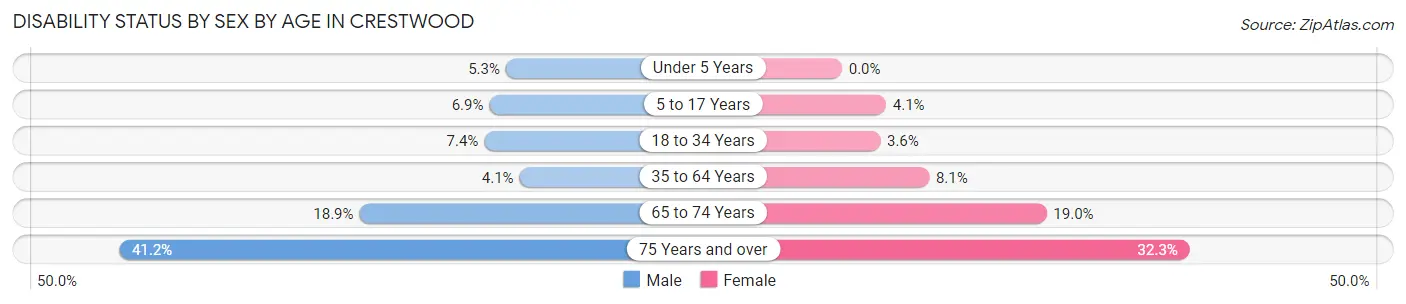
| Age Bracket | Male | Female |
| Under 5 Years | 15 (5.3%) | 0 (0.0%) |
| 5 to 17 Years | 67 (6.9%) | 35 (4.1%) |
| 18 to 34 Years | 85 (7.3%) | 38 (3.5%) |
| 35 to 64 Years | 106 (4.1%) | 218 (8.1%) |
| 65 to 74 Years | 110 (18.9%) | 105 (19.0%) |
| 75 Years and over | 160 (41.2%) | 225 (32.3%) |
Disability Class by Sex by Age in Crestwood
Disability Class: Hearing Difficulty
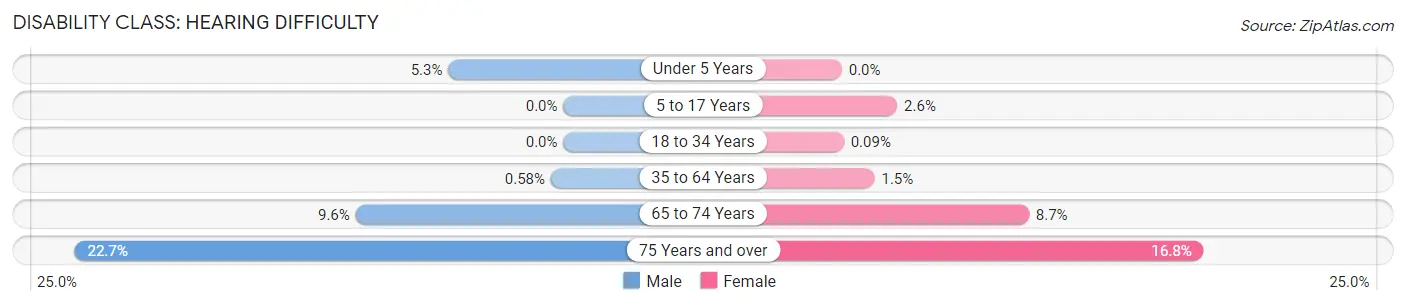
| Age Bracket | Male | Female |
| Under 5 Years | 15 (5.3%) | 0 (0.0%) |
| 5 to 17 Years | 0 (0.0%) | 22 (2.6%) |
| 18 to 34 Years | 0 (0.0%) | 1 (0.1%) |
| 35 to 64 Years | 15 (0.6%) | 41 (1.5%) |
| 65 to 74 Years | 56 (9.6%) | 48 (8.7%) |
| 75 Years and over | 88 (22.7%) | 117 (16.8%) |
Disability Class: Vision Difficulty
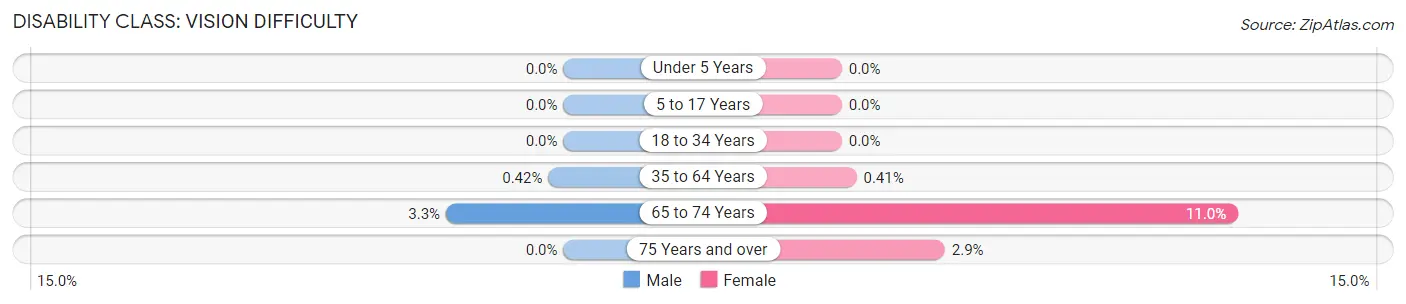
| Age Bracket | Male | Female |
| Under 5 Years | 0 (0.0%) | 0 (0.0%) |
| 5 to 17 Years | 0 (0.0%) | 0 (0.0%) |
| 18 to 34 Years | 0 (0.0%) | 0 (0.0%) |
| 35 to 64 Years | 11 (0.4%) | 11 (0.4%) |
| 65 to 74 Years | 19 (3.3%) | 61 (11.0%) |
| 75 Years and over | 0 (0.0%) | 20 (2.9%) |
Disability Class: Cognitive Difficulty
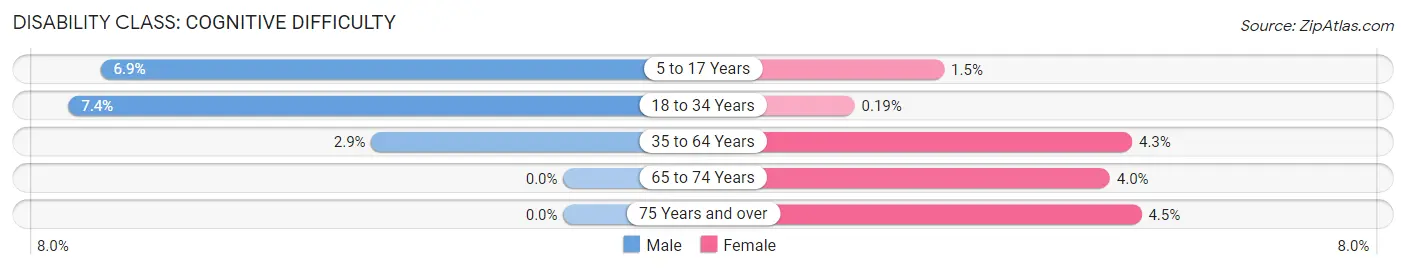
| Age Bracket | Male | Female |
| 5 to 17 Years | 67 (6.9%) | 13 (1.5%) |
| 18 to 34 Years | 85 (7.3%) | 2 (0.2%) |
| 35 to 64 Years | 74 (2.9%) | 116 (4.3%) |
| 65 to 74 Years | 0 (0.0%) | 22 (4.0%) |
| 75 Years and over | 0 (0.0%) | 31 (4.4%) |
Disability Class: Ambulatory Difficulty
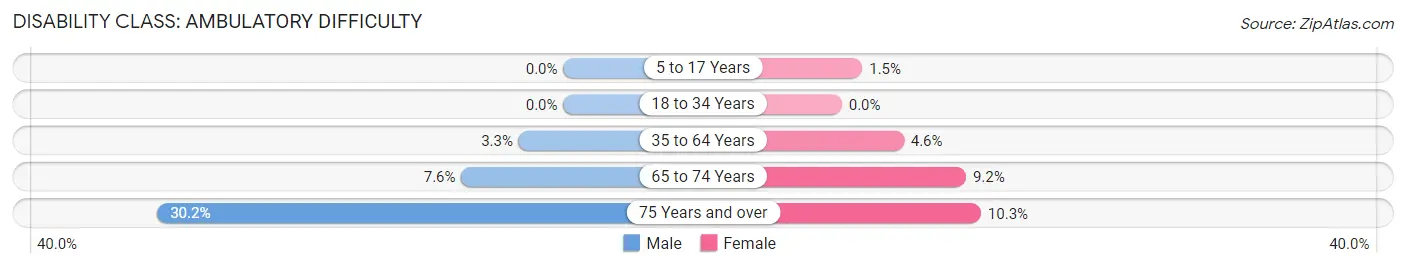
| Age Bracket | Male | Female |
| 5 to 17 Years | 0 (0.0%) | 13 (1.5%) |
| 18 to 34 Years | 0 (0.0%) | 0 (0.0%) |
| 35 to 64 Years | 86 (3.3%) | 124 (4.6%) |
| 65 to 74 Years | 44 (7.6%) | 51 (9.2%) |
| 75 Years and over | 117 (30.1%) | 72 (10.3%) |
Disability Class: Self-Care Difficulty
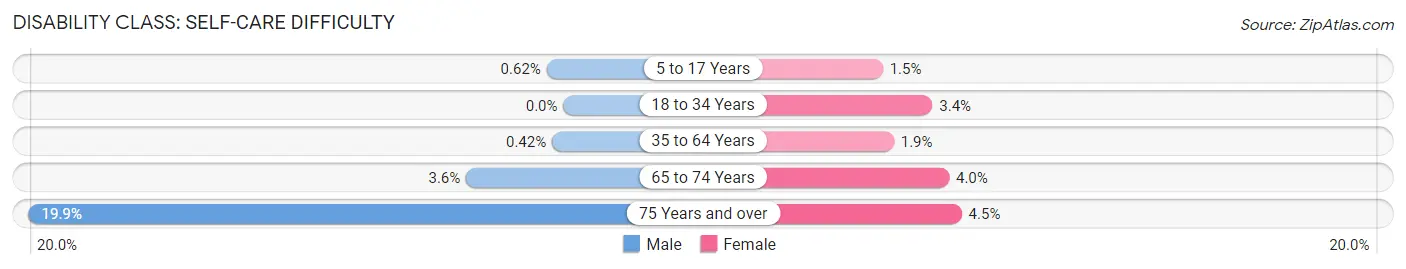
| Age Bracket | Male | Female |
| 5 to 17 Years | 6 (0.6%) | 13 (1.5%) |
| 18 to 34 Years | 0 (0.0%) | 36 (3.4%) |
| 35 to 64 Years | 11 (0.4%) | 52 (1.9%) |
| 65 to 74 Years | 21 (3.6%) | 22 (4.0%) |
| 75 Years and over | 77 (19.9%) | 31 (4.4%) |
Technology Access in Crestwood
Computing Device Access in Crestwood
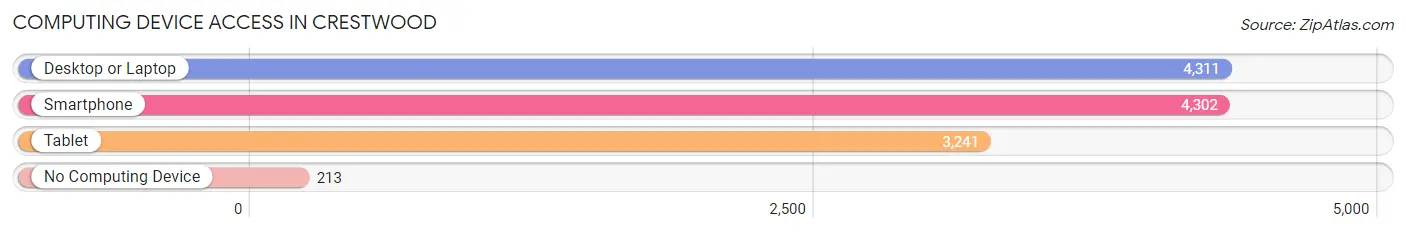
| Device Type | # Households | % Households |
| Desktop or Laptop | 4,311 | 89.3% |
| Smartphone | 4,302 | 89.1% |
| Tablet | 3,241 | 67.1% |
| No Computing Device | 213 | 4.4% |
| Total | 4,827 | 100.0% |
Internet Access in Crestwood
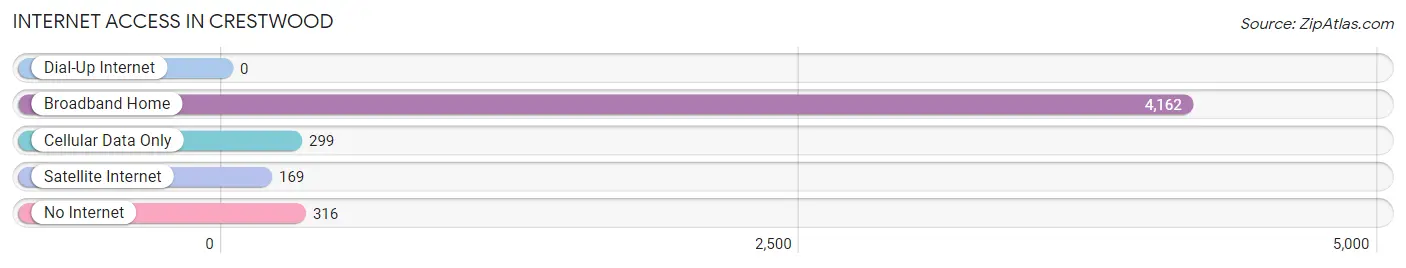
| Internet Type | # Households | % Households |
| Dial-Up Internet | 0 | 0.0% |
| Broadband Home | 4,162 | 86.2% |
| Cellular Data Only | 299 | 6.2% |
| Satellite Internet | 169 | 3.5% |
| No Internet | 316 | 6.6% |
| Total | 4,827 | 100.0% |
Crestwood Summary
Crestwood, Missouri is a small city located in St. Louis County, Missouri. It is situated just south of the city of St. Louis and is part of the Greater St. Louis metropolitan area. The city has a population of 11,912 as of the 2010 census.
History
The area that is now Crestwood was first settled in the early 1800s by German immigrants. The area was originally known as Gildehaus, named after the Gildehaus family who were among the first settlers. The area was later renamed Crestwood in the late 1800s, after the crest of a hill that overlooked the area.
In the early 1900s, the area began to develop as a residential suburb of St. Louis. The city was officially incorporated in 1949.
Geography
Crestwood is located in St. Louis County, Missouri. It is situated just south of the city of St. Louis and is part of the Greater St. Louis metropolitan area. The city has a total area of 4.2 square miles, all of which is land.
The city is located on the western edge of the Missouri River floodplain. The city is bordered by the cities of Kirkwood to the north, Sunset Hills to the east, and Affton to the south.
Economy
Crestwood is primarily a residential community, with most of its residents commuting to jobs in St. Louis or other nearby cities. The city does have some light industry, including a few small manufacturing plants.
The city is also home to a number of retail establishments, including a shopping center, a grocery store, and several restaurants.
Demographics
As of the 2010 census, Crestwood had a population of 11,912. The racial makeup of the city was 87.3% White, 8.2% African American, 0.4% Native American, 1.2% Asian, 0.1% Pacific Islander, 0.7% from other races, and 2.1% from two or more races. Hispanic or Latino of any race were 2.3% of the population.
The median income for a household in the city was $50,945, and the median income for a family was $60,945. The per capita income for the city was $25,945. About 4.3% of families and 5.7% of the population were below the poverty line, including 6.7% of those under age 18 and 4.2% of those age 65 or over.
Common Questions
What is Per Capita Income in Crestwood?
Per Capita income in Crestwood is $48,384.
What is the Median Family Income in Crestwood?
Median Family Income in Crestwood is $124,878.
What is the Median Household income in Crestwood?
Median Household Income in Crestwood is $111,791.
What is Income or Wage Gap in Crestwood?
Income or Wage Gap in Crestwood is 25.0%.
Women in Crestwood earn 75.0 cents for every dollar earned by a man.
What is Inequality or Gini Index in Crestwood?
Inequality or Gini Index in Crestwood is 0.36.
What is the Total Population of Crestwood?
Total Population of Crestwood is 12,315.
What is the Total Male Population of Crestwood?
Total Male Population of Crestwood is 6,004.
What is the Total Female Population of Crestwood?
Total Female Population of Crestwood is 6,311.
What is the Ratio of Males per 100 Females in Crestwood?
There are 95.14 Males per 100 Females in Crestwood.
What is the Ratio of Females per 100 Males in Crestwood?
There are 105.11 Females per 100 Males in Crestwood.
What is the Median Population Age in Crestwood?
Median Population Age in Crestwood is 42.1 Years.
What is the Average Family Size in Crestwood
Average Family Size in Crestwood is 2.9 People.
What is the Average Household Size in Crestwood
Average Household Size in Crestwood is 2.5 People.
How Large is the Labor Force in Crestwood?
There are 6,787 People in the Labor Forcein in Crestwood.
What is the Percentage of People in the Labor Force in Crestwood?
67.9% of People are in the Labor Force in Crestwood.
What is the Unemployment Rate in Crestwood?
Unemployment Rate in Crestwood is 1.4%.