Zip Codes with the Highest Percentage of Families with Income Above $200,000 in Missouri
RELATED REPORTS & OPTIONS
Family Income | $200k+
Missouri
Compare Zip Codes
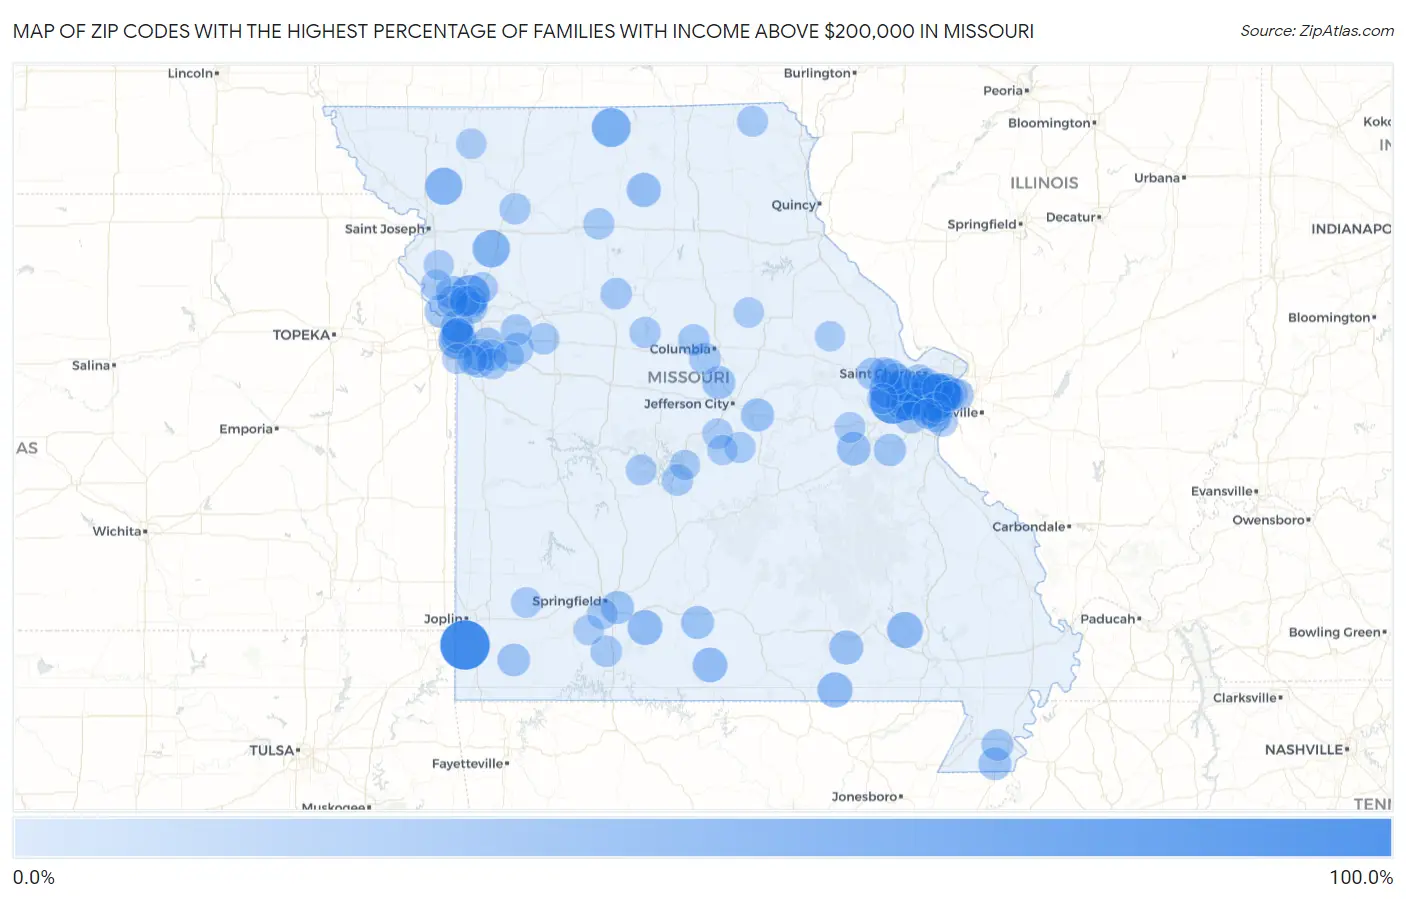
Map of Zip Codes with the Highest Percentage of Families with Income Above $200,000 in Missouri
0.0%
100.0%
Zip Codes with the Highest Percentage of Families with Income Above $200,000 in Missouri
| Zip Code | Families with Income > $200k | vs State | vs National | |
| 1. | 64858 | 100.0% | 10.1%(+89.9)#1 | 14.8%(+85.2)#7 |
| 2. | 63073 | 79.6% | 10.1%(+69.5)#2 | 14.8%(+64.8)#68 |
| 3. | 63124 | 61.8% | 10.1%(+51.7)#3 | 14.8%(+47.0)#249 |
| 4. | 63131 | 57.6% | 10.1%(+47.5)#4 | 14.8%(+42.8)#367 |
| 5. | 64167 | 56.8% | 10.1%(+46.7)#5 | 14.8%(+42.0)#391 |
| 6. | 63005 | 52.5% | 10.1%(+42.4)#6 | 14.8%(+37.7)#551 |
| 7. | 64655 | 52.2% | 10.1%(+42.1)#7 | 14.8%(+37.4)#568 |
| 8. | 64113 | 49.4% | 10.1%(+39.3)#8 | 14.8%(+34.6)#698 |
| 9. | 63105 | 45.8% | 10.1%(+35.7)#9 | 14.8%(+31.0)#883 |
| 10. | 64493 | 45.8% | 10.1%(+35.7)#10 | 14.8%(+31.0)#887 |
| 11. | 64480 | 44.7% | 10.1%(+34.6)#11 | 14.8%(+29.9)#951 |
| 12. | 63017 | 42.9% | 10.1%(+32.8)#12 | 14.8%(+28.1)#1,059 |
| 13. | 63038 | 42.9% | 10.1%(+32.8)#13 | 14.8%(+28.1)#1,062 |
| 14. | 63127 | 41.2% | 10.1%(+31.1)#14 | 14.8%(+26.4)#1,209 |
| 15. | 63141 | 39.9% | 10.1%(+29.8)#15 | 14.8%(+25.1)#1,326 |
| 16. | 63341 | 39.9% | 10.1%(+29.8)#16 | 14.8%(+25.1)#1,330 |
| 17. | 63117 | 39.0% | 10.1%(+28.9)#17 | 14.8%(+24.2)#1,411 |
| 18. | 63952 | 38.9% | 10.1%(+28.8)#18 | 14.8%(+24.1)#1,427 |
| 19. | 65690 | 35.4% | 10.1%(+25.3)#19 | 14.8%(+20.6)#1,795 |
| 20. | 65620 | 35.3% | 10.1%(+25.2)#20 | 14.8%(+20.5)#1,813 |
| 21. | 65618 | 33.9% | 10.1%(+23.8)#21 | 14.8%(+19.1)#1,981 |
| 22. | 63122 | 33.8% | 10.1%(+23.7)#22 | 14.8%(+19.0)#1,984 |
| 23. | 64112 | 33.5% | 10.1%(+23.4)#23 | 14.8%(+18.7)#2,028 |
| 24. | 63566 | 32.0% | 10.1%(+21.9)#24 | 14.8%(+17.2)#2,229 |
| 25. | 63941 | 30.8% | 10.1%(+20.7)#25 | 14.8%(+16.0)#2,412 |
| 26. | 63011 | 30.0% | 10.1%(+19.9)#26 | 14.8%(+15.2)#2,511 |
| 27. | 63130 | 29.0% | 10.1%(+18.9)#27 | 14.8%(+14.2)#2,667 |
| 28. | 63079 | 29.0% | 10.1%(+18.9)#28 | 14.8%(+14.2)#2,681 |
| 29. | 63119 | 28.0% | 10.1%(+17.9)#29 | 14.8%(+13.2)#2,860 |
| 30. | 64164 | 28.0% | 10.1%(+17.9)#30 | 14.8%(+13.2)#2,873 |
| 31. | 63040 | 27.9% | 10.1%(+17.8)#31 | 14.8%(+13.1)#2,877 |
| 32. | 64152 | 27.6% | 10.1%(+17.5)#32 | 14.8%(+12.8)#2,928 |
| 33. | 64105 | 27.5% | 10.1%(+17.4)#33 | 14.8%(+12.7)#2,958 |
| 34. | 65039 | 27.1% | 10.1%(+17.0)#34 | 14.8%(+12.3)#3,037 |
| 35. | 65054 | 27.1% | 10.1%(+17.0)#35 | 14.8%(+12.3)#3,038 |
| 36. | 63144 | 26.8% | 10.1%(+16.7)#36 | 14.8%(+12.0)#3,087 |
| 37. | 65809 | 26.4% | 10.1%(+16.3)#37 | 14.8%(+11.6)#3,166 |
| 38. | 65702 | 26.4% | 10.1%(+16.3)#38 | 14.8%(+11.6)#3,175 |
| 39. | 63108 | 26.3% | 10.1%(+16.2)#39 | 14.8%(+11.5)#3,182 |
| 40. | 63853 | 25.9% | 10.1%(+15.8)#40 | 14.8%(+11.1)#3,280 |
| 41. | 64842 | 25.3% | 10.1%(+15.2)#41 | 14.8%(+10.5)#3,396 |
| 42. | 63367 | 24.9% | 10.1%(+14.8)#42 | 14.8%(+10.1)#3,495 |
| 43. | 64082 | 24.9% | 10.1%(+14.8)#43 | 14.8%(+10.1)#3,499 |
| 44. | 64157 | 24.2% | 10.1%(+14.1)#44 | 14.8%(+9.40)#3,657 |
| 45. | 63101 | 24.2% | 10.1%(+14.1)#45 | 14.8%(+9.40)#3,666 |
| 46. | 64064 | 24.1% | 10.1%(+14.0)#46 | 14.8%(+9.30)#3,680 |
| 47. | 64158 | 23.9% | 10.1%(+13.8)#47 | 14.8%(+9.10)#3,740 |
| 48. | 63304 | 23.3% | 10.1%(+13.2)#48 | 14.8%(+8.50)#3,871 |
| 49. | 63021 | 23.2% | 10.1%(+13.1)#49 | 14.8%(+8.40)#3,885 |
| 50. | 63041 | 22.9% | 10.1%(+12.8)#50 | 14.8%(+8.10)#3,981 |
| 51. | 64081 | 22.7% | 10.1%(+12.6)#51 | 14.8%(+7.90)#4,019 |
| 52. | 63348 | 22.1% | 10.1%(+12.0)#52 | 14.8%(+7.30)#4,189 |
| 53. | 64011 | 22.0% | 10.1%(+11.9)#53 | 14.8%(+7.20)#4,214 |
| 54. | 63826 | 21.9% | 10.1%(+11.8)#54 | 14.8%(+7.10)#4,257 |
| 55. | 64111 | 21.2% | 10.1%(+11.1)#55 | 14.8%(+6.40)#4,446 |
| 56. | 63025 | 21.1% | 10.1%(+11.0)#56 | 14.8%(+6.30)#4,473 |
| 57. | 65203 | 20.8% | 10.1%(+10.7)#57 | 14.8%(+6.00)#4,556 |
| 58. | 65279 | 20.7% | 10.1%(+10.6)#58 | 14.8%(+5.90)#4,611 |
| 59. | 65754 | 20.7% | 10.1%(+10.6)#59 | 14.8%(+5.90)#4,612 |
| 60. | 63128 | 20.4% | 10.1%(+10.3)#60 | 14.8%(+5.60)#4,676 |
| 61. | 63368 | 20.1% | 10.1%(+10.0)#61 | 14.8%(+5.30)#4,776 |
| 62. | 65344 | 20.0% | 10.1%(+9.90)#62 | 14.8%(+5.20)#4,838 |
| 63. | 65052 | 19.7% | 10.1%(+9.60)#63 | 14.8%(+4.90)#4,922 |
| 64. | 63303 | 19.6% | 10.1%(+9.50)#64 | 14.8%(+4.80)#4,932 |
| 65. | 63146 | 19.4% | 10.1%(+9.30)#65 | 14.8%(+4.60)#5,004 |
| 66. | 64071 | 19.4% | 10.1%(+9.30)#66 | 14.8%(+4.60)#5,028 |
| 67. | 64074 | 19.4% | 10.1%(+9.30)#67 | 14.8%(+4.60)#5,029 |
| 68. | 64086 | 19.1% | 10.1%(+9.00)#68 | 14.8%(+4.30)#5,108 |
| 69. | 64620 | 19.1% | 10.1%(+9.00)#69 | 14.8%(+4.30)#5,134 |
| 70. | 65320 | 18.8% | 10.1%(+8.70)#70 | 14.8%(+4.00)#5,267 |
| 71. | 63132 | 18.7% | 10.1%(+8.60)#71 | 14.8%(+3.90)#5,288 |
| 72. | 64154 | 18.7% | 10.1%(+8.60)#72 | 14.8%(+3.90)#5,289 |
| 73. | 64688 | 18.6% | 10.1%(+8.50)#73 | 14.8%(+3.80)#5,342 |
| 74. | 64156 | 18.5% | 10.1%(+8.40)#74 | 14.8%(+3.70)#5,372 |
| 75. | 65058 | 18.2% | 10.1%(+8.10)#75 | 14.8%(+3.40)#5,505 |
| 76. | 63432 | 17.8% | 10.1%(+7.70)#76 | 14.8%(+3.00)#5,667 |
| 77. | 64079 | 17.5% | 10.1%(+7.40)#77 | 14.8%(+2.70)#5,773 |
| 78. | 64034 | 17.4% | 10.1%(+7.30)#78 | 14.8%(+2.60)#5,821 |
| 79. | 65324 | 17.3% | 10.1%(+7.20)#79 | 14.8%(+2.50)#5,879 |
| 80. | 63013 | 16.9% | 10.1%(+6.80)#80 | 14.8%(+2.10)#6,054 |
| 81. | 63129 | 16.6% | 10.1%(+6.50)#81 | 14.8%(+1.80)#6,153 |
| 82. | 65810 | 16.6% | 10.1%(+6.50)#82 | 14.8%(+1.80)#6,171 |
| 83. | 64848 | 16.4% | 10.1%(+6.30)#83 | 14.8%(+1.60)#6,273 |
| 84. | 63385 | 16.3% | 10.1%(+6.20)#84 | 14.8%(+1.50)#6,285 |
| 85. | 64060 | 16.3% | 10.1%(+6.20)#85 | 14.8%(+1.50)#6,297 |
| 86. | 65040 | 16.3% | 10.1%(+6.20)#86 | 14.8%(+1.50)#6,324 |
| 87. | 63332 | 16.1% | 10.1%(+6.00)#87 | 14.8%(+1.30)#6,422 |
| 88. | 64145 | 15.9% | 10.1%(+5.80)#88 | 14.8%(+1.10)#6,507 |
| 89. | 63126 | 15.8% | 10.1%(+5.70)#89 | 14.8%(+1.000)#6,544 |
| 90. | 64070 | 15.8% | 10.1%(+5.70)#90 | 14.8%(+1.000)#6,558 |
| 91. | 65285 | 15.8% | 10.1%(+5.70)#91 | 14.8%(+1.000)#6,571 |
| 92. | 63110 | 15.7% | 10.1%(+5.60)#92 | 14.8%(+0.900)#6,589 |
| 93. | 64149 | 15.6% | 10.1%(+5.50)#93 | 14.8%(+0.800)#6,671 |
| 94. | 64453 | 15.6% | 10.1%(+5.50)#94 | 14.8%(+0.800)#6,674 |
| 95. | 65075 | 15.4% | 10.1%(+5.30)#95 | 14.8%(+0.600)#6,766 |
| 96. | 64439 | 15.3% | 10.1%(+5.20)#96 | 14.8%(+0.500)#6,816 |
| 97. | 65631 | 15.1% | 10.1%(+5.00)#97 | 14.8%(+0.300)#6,942 |
| 98. | 65047 | 15.1% | 10.1%(+5.00)#98 | 14.8%(+0.300)#6,953 |
| 99. | 63333 | 15.1% | 10.1%(+5.00)#99 | 14.8%(+0.300)#6,957 |
| 100. | 63026 | 15.0% | 10.1%(+4.90)#100 | 14.8%(+0.200)#6,975 |
Common Questions
What are the Top 10 Zip Codes with the Highest Percentage of Families with Income Above $200,000 in Missouri?
Top 10 Zip Codes with the Highest Percentage of Families with Income Above $200,000 in Missouri are:
What zip code has the Highest Percentage of Families with Income Above $200,000 in Missouri?
64858 has the Highest Percentage of Families with Income Above $200,000 in Missouri with 100.0%.
What is the Percentage of Families with Income Above $200,000 in the State of Missouri?
Percentage of Families with Income Above $200,000 in Missouri is 10.1%.
What is the Percentage of Families with Income Above $200,000 in the United States?
Percentage of Families with Income Above $200,000 in the United States is 14.8%.