Innsbrook, MO Map & Demographics
Innsbrook Map
Innsbrook Overview
$64,465
PER CAPITA INCOME
$161,875
AVG FAMILY INCOME
$145,156
AVG HOUSEHOLD INCOME
0.38
INEQUALITY / GINI INDEX
877
TOTAL POPULATION
460
MALE POPULATION
417
FEMALE POPULATION
110.31
MALES / 100 FEMALES
90.65
FEMALES / 100 MALES
55.1
MEDIAN AGE
2.8
AVG FAMILY SIZE
2.6
AVG HOUSEHOLD SIZE
298
LABOR FORCE [ PEOPLE ]
36.4%
PERCENT IN LABOR FORCE
9.4%
UNEMPLOYMENT RATE
Innsbrook Area Codes
Income in Innsbrook
Income Overview in Innsbrook
Per Capita Income in Innsbrook is $64,465, while median incomes of families and households are $161,875 and $145,156 respectively.
| Characteristic | Number | Measure |
| Per Capita Income | 877 | $64,465 |
| Median Family Income | 285 | $161,875 |
| Mean Family Income | 285 | $185,725 |
| Median Household Income | 335 | $145,156 |
| Mean Household Income | 335 | $168,616 |
| Income Deficit | 285 | $0 |
| Wage / Income Gap (%) | 877 | 0.00% |
| Wage / Income Gap ($) | 877 | 100.00¢ per $1 |
| Gini / Inequality Index | 877 | 0.38 |
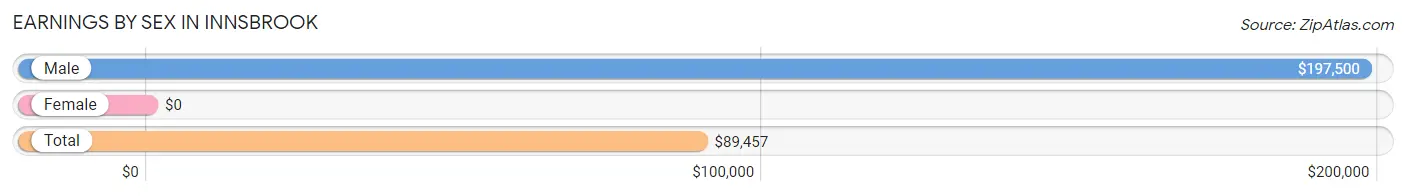
Earnings by Sex in Innsbrook
| Sex | Number | Average Earnings |
| Male | 164 (51.6%) | $197,500 |
| Female | 154 (48.4%) | $0 |
| Total | 318 (100.0%) | $89,457 |
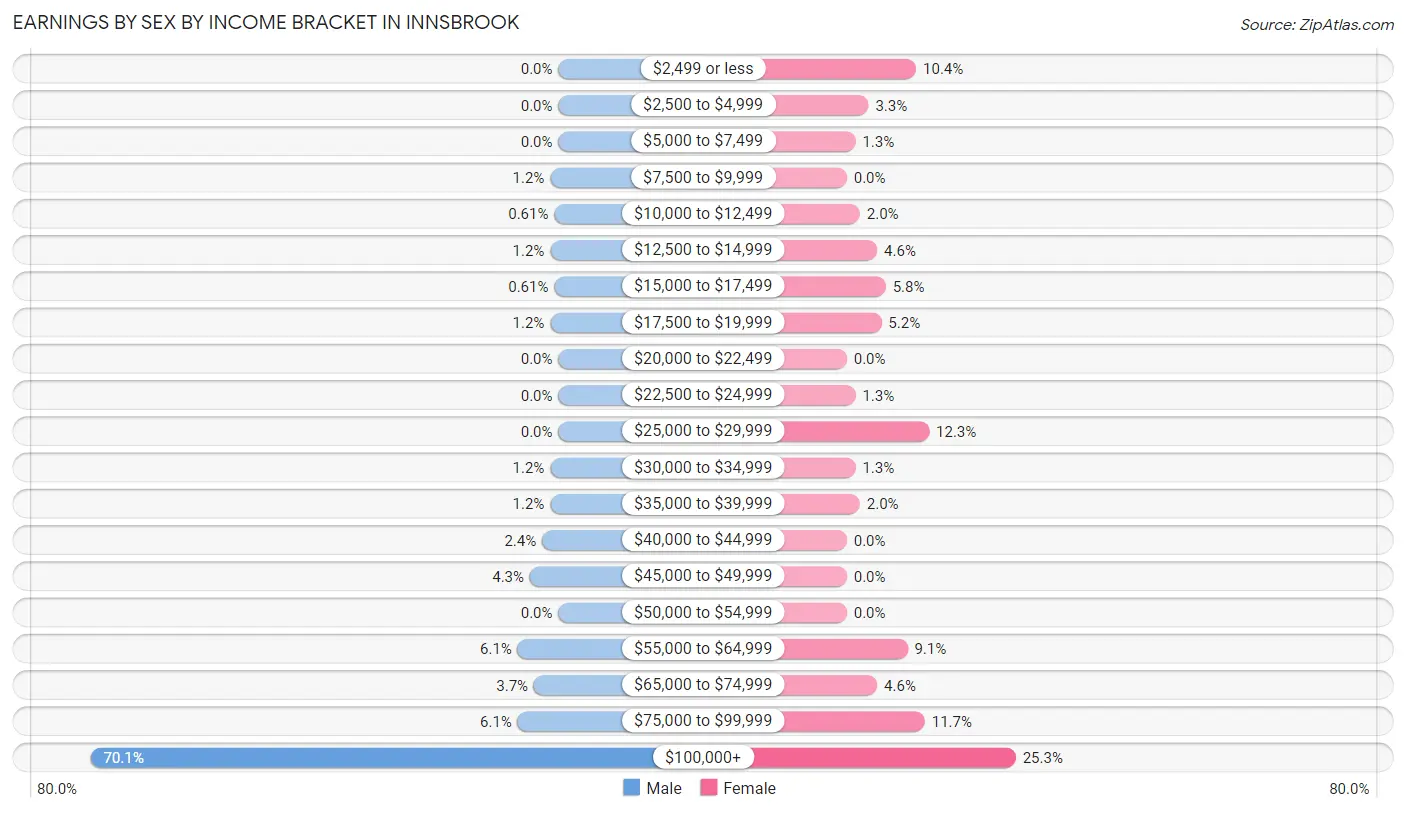
Earnings by Sex by Income Bracket in Innsbrook
The most common earnings brackets in Innsbrook are $100,000+ for men (115 | 70.1%) and $100,000+ for women (39 | 25.3%).
| Income | Male | Female |
| $2,499 or less | 0 (0.0%) | 16 (10.4%) |
| $2,500 to $4,999 | 0 (0.0%) | 5 (3.3%) |
| $5,000 to $7,499 | 0 (0.0%) | 2 (1.3%) |
| $7,500 to $9,999 | 2 (1.2%) | 0 (0.0%) |
| $10,000 to $12,499 | 1 (0.6%) | 3 (1.9%) |
| $12,500 to $14,999 | 2 (1.2%) | 7 (4.5%) |
| $15,000 to $17,499 | 1 (0.6%) | 9 (5.8%) |
| $17,500 to $19,999 | 2 (1.2%) | 8 (5.2%) |
| $20,000 to $22,499 | 0 (0.0%) | 0 (0.0%) |
| $22,500 to $24,999 | 0 (0.0%) | 2 (1.3%) |
| $25,000 to $29,999 | 0 (0.0%) | 19 (12.3%) |
| $30,000 to $34,999 | 2 (1.2%) | 2 (1.3%) |
| $35,000 to $39,999 | 2 (1.2%) | 3 (1.9%) |
| $40,000 to $44,999 | 4 (2.4%) | 0 (0.0%) |
| $45,000 to $49,999 | 7 (4.3%) | 0 (0.0%) |
| $50,000 to $54,999 | 0 (0.0%) | 0 (0.0%) |
| $55,000 to $64,999 | 10 (6.1%) | 14 (9.1%) |
| $65,000 to $74,999 | 6 (3.7%) | 7 (4.5%) |
| $75,000 to $99,999 | 10 (6.1%) | 18 (11.7%) |
| $100,000+ | 115 (70.1%) | 39 (25.3%) |
| Total | 164 (100.0%) | 154 (100.0%) |
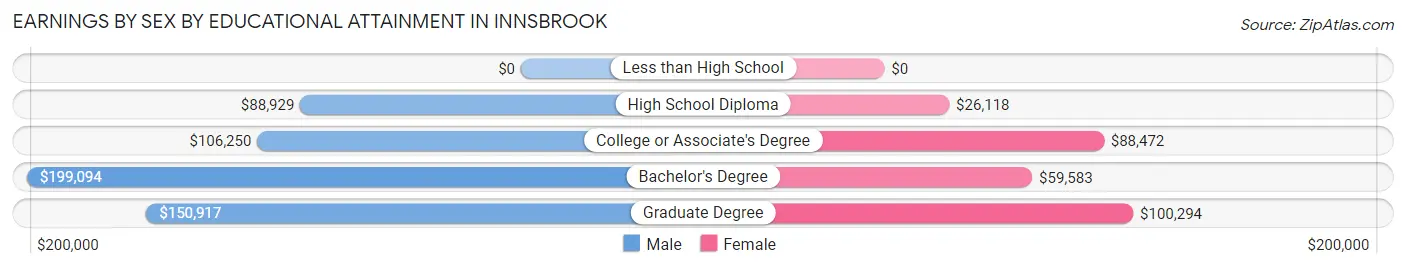
Earnings by Sex by Educational Attainment in Innsbrook
| Educational Attainment | Male Income | Female Income |
| Less than High School | - | - |
| High School Diploma | $88,929 | $26,118 |
| College or Associate's Degree | $106,250 | $88,472 |
| Bachelor's Degree | $199,094 | $59,583 |
| Graduate Degree | $150,917 | $100,294 |
| Total | $197,625 | $0 |
Family Income in Innsbrook
Family Income Brackets in Innsbrook
According to the Innsbrook family income data, there are 76 families falling into the $200,000+ income range, which is the most common income bracket and makes up 26.7% of all families.
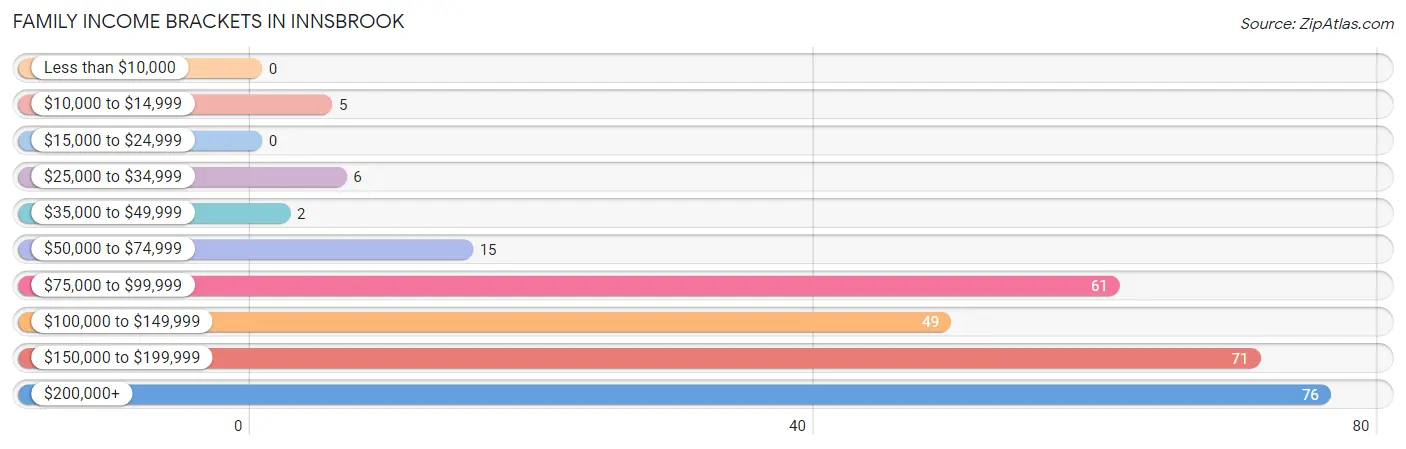
| Income Bracket | # Families | % Families |
| Less than $10,000 | 0 | 0.0% |
| $10,000 to $14,999 | 5 | 1.8% |
| $15,000 to $24,999 | 0 | 0.0% |
| $25,000 to $34,999 | 6 | 2.1% |
| $35,000 to $49,999 | 2 | 0.7% |
| $50,000 to $74,999 | 15 | 5.3% |
| $75,000 to $99,999 | 61 | 21.4% |
| $100,000 to $149,999 | 49 | 17.2% |
| $150,000 to $199,999 | 71 | 24.9% |
| $200,000+ | 76 | 26.7% |
Family Income by Famaliy Size in Innsbrook
3-person families (26 | 9.1%) account for the highest median family income in Innsbrook with $180,000 per family, while 2-person families (199 | 69.8%) have the highest median income of $62,656 per family member.
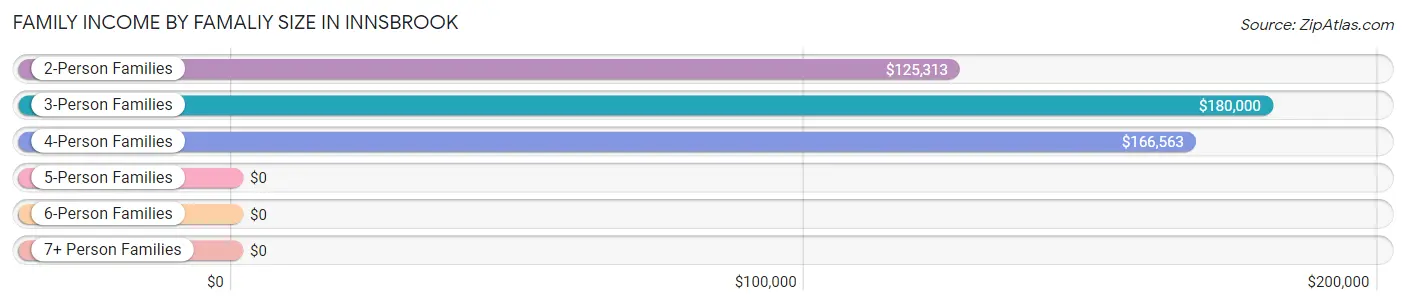
| Income Bracket | # Families | Median Income |
| 2-Person Families | 199 (69.8%) | $125,313 |
| 3-Person Families | 26 (9.1%) | $180,000 |
| 4-Person Families | 15 (5.3%) | $166,563 |
| 5-Person Families | 42 (14.7%) | $0 |
| 6-Person Families | 3 (1.1%) | $0 |
| 7+ Person Families | 0 (0.0%) | $0 |
| Total | 285 (100.0%) | $161,875 |
Family Income by Number of Earners in Innsbrook
The median family income in Innsbrook is $161,875, with families comprising 2 earners (74) having the highest median family income of $250,001, while families with no earners (106) have the lowest median family income of $102,273, accounting for 26.0% and 37.2% of families, respectively.
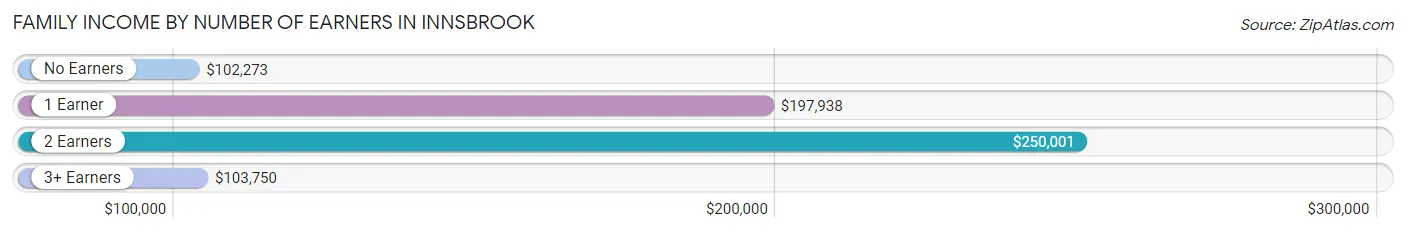
| Number of Earners | # Families | Median Income |
| No Earners | 106 (37.2%) | $102,273 |
| 1 Earner | 96 (33.7%) | $197,938 |
| 2 Earners | 74 (26.0%) | $250,001 |
| 3+ Earners | 9 (3.2%) | $103,750 |
| Total | 285 (100.0%) | $161,875 |
Household Income in Innsbrook
Household Income Brackets in Innsbrook
With 78 households falling in the category, the $200,000+ income range is the most frequent in Innsbrook, accounting for 23.3% of all households. In contrast, only 2 households (0.6%) fall into the less than $10,000 income bracket, making it the least populous group.
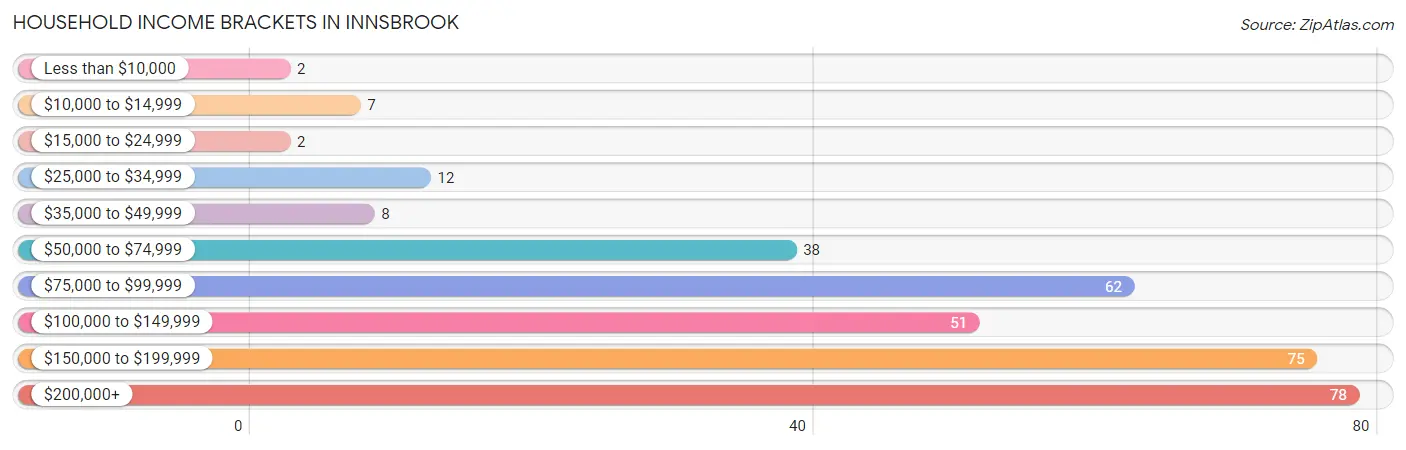
| Income Bracket | # Households | % Households |
| Less than $10,000 | 2 | 0.6% |
| $10,000 to $14,999 | 7 | 2.1% |
| $15,000 to $24,999 | 2 | 0.6% |
| $25,000 to $34,999 | 12 | 3.6% |
| $35,000 to $49,999 | 8 | 2.4% |
| $50,000 to $74,999 | 38 | 11.3% |
| $75,000 to $99,999 | 62 | 18.5% |
| $100,000 to $149,999 | 51 | 15.2% |
| $150,000 to $199,999 | 75 | 22.4% |
| $200,000+ | 78 | 23.3% |
Household Income by Householder Age in Innsbrook
The median household income in Innsbrook is $145,156, with the highest median household income of $198,563 found in the 45 to 64 years age bracket for the primary householder. A total of 134 households (40.0%) fall into this category. Meanwhile, the 15 to 24 years age bracket for the primary householder has the lowest median household income of $0, with 6 households (1.8%) in this group.
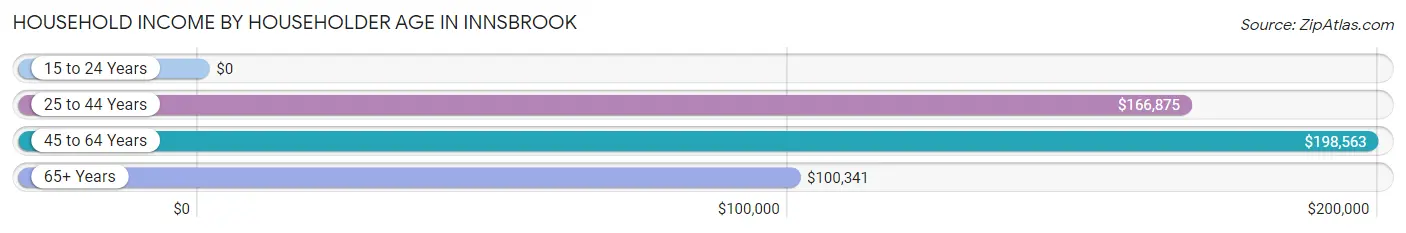
| Income Bracket | # Households | Median Income |
| 15 to 24 Years | 6 (1.8%) | $0 |
| 25 to 44 Years | 14 (4.2%) | $166,875 |
| 45 to 64 Years | 134 (40.0%) | $198,563 |
| 65+ Years | 181 (54.0%) | $100,341 |
| Total | 335 (100.0%) | $145,156 |
Poverty in Innsbrook
Income Below Poverty by Sex and Age in Innsbrook
With 2.8% poverty level for males and 2.9% for females among the residents of Innsbrook, 15 year old males and 18 to 24 year old females are the most vulnerable to poverty, with 8 males (47.1%) and 3 females (14.3%) in their respective age groups living below the poverty level.
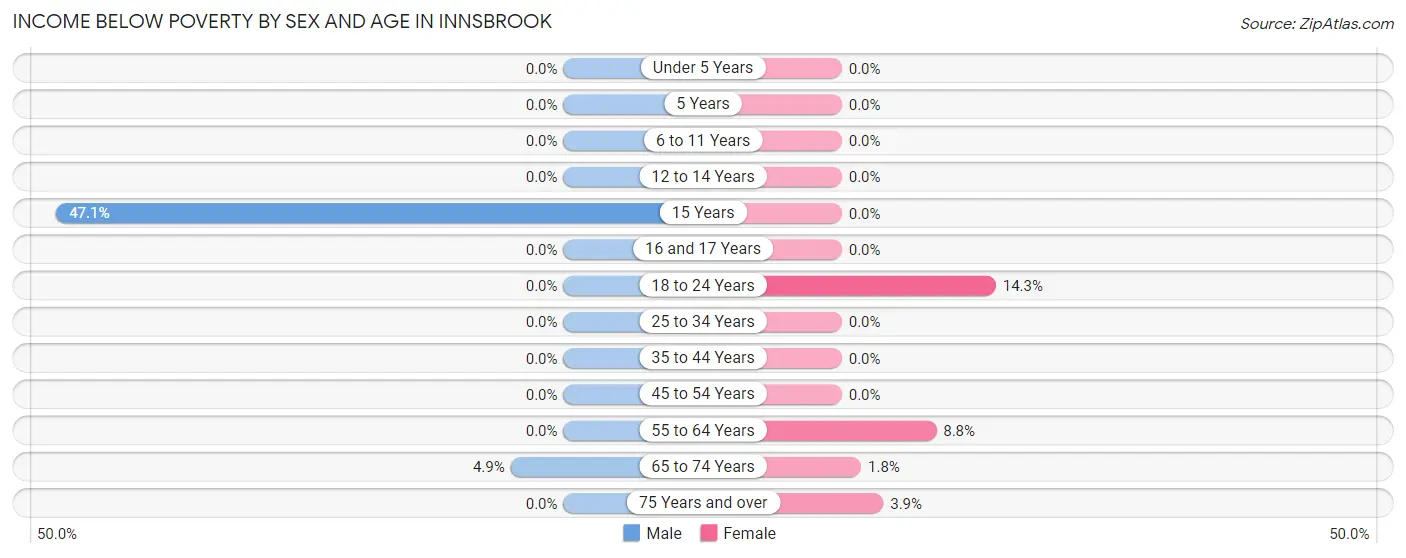
| Age Bracket | Male | Female |
| Under 5 Years | 0 (0.0%) | 0 (0.0%) |
| 5 Years | 0 (0.0%) | 0 (0.0%) |
| 6 to 11 Years | 0 (0.0%) | 0 (0.0%) |
| 12 to 14 Years | 0 (0.0%) | 0 (0.0%) |
| 15 Years | 8 (47.1%) | 0 (0.0%) |
| 16 and 17 Years | 0 (0.0%) | 0 (0.0%) |
| 18 to 24 Years | 0 (0.0%) | 3 (14.3%) |
| 25 to 34 Years | 0 (0.0%) | 0 (0.0%) |
| 35 to 44 Years | 0 (0.0%) | 0 (0.0%) |
| 45 to 54 Years | 0 (0.0%) | 0 (0.0%) |
| 55 to 64 Years | 0 (0.0%) | 5 (8.8%) |
| 65 to 74 Years | 5 (4.9%) | 2 (1.8%) |
| 75 Years and over | 0 (0.0%) | 2 (3.8%) |
| Total | 13 (2.8%) | 12 (2.9%) |
Income Above Poverty by Sex and Age in Innsbrook
According to the poverty statistics in Innsbrook, males aged 6 to 11 years and females aged under 5 years are the age groups that are most secure financially, with 100.0% of males and 100.0% of females in these age groups living above the poverty line.
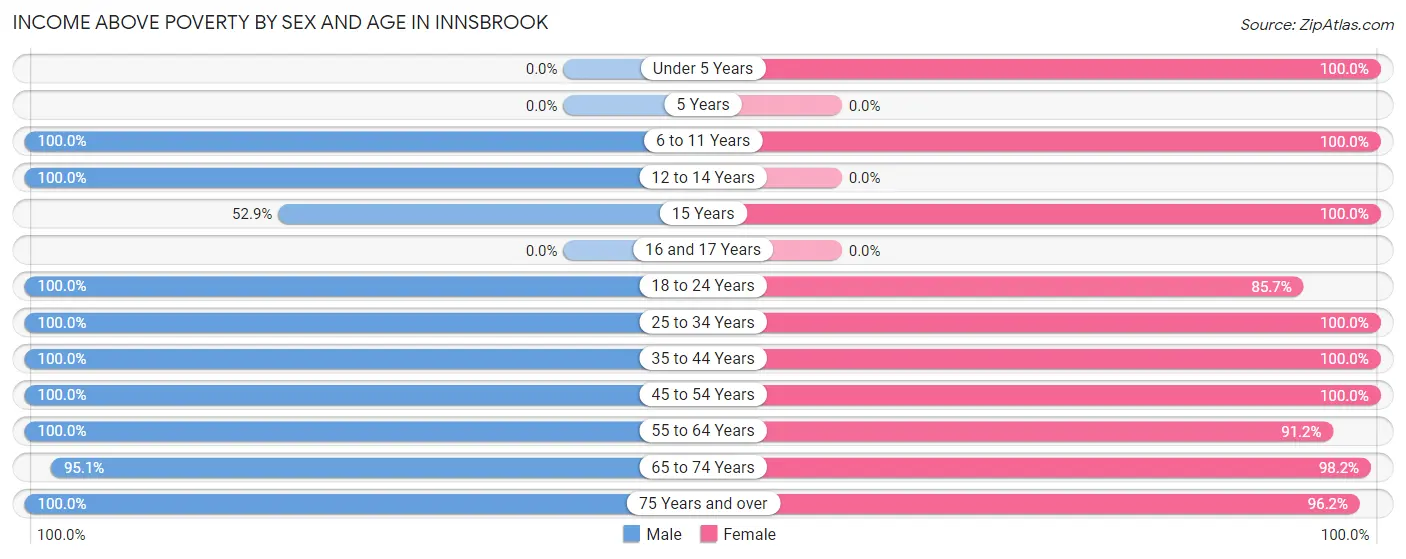
| Age Bracket | Male | Female |
| Under 5 Years | 0 (0.0%) | 8 (100.0%) |
| 5 Years | 0 (0.0%) | 0 (0.0%) |
| 6 to 11 Years | 5 (100.0%) | 12 (100.0%) |
| 12 to 14 Years | 9 (100.0%) | 0 (0.0%) |
| 15 Years | 9 (52.9%) | 8 (100.0%) |
| 16 and 17 Years | 0 (0.0%) | 0 (0.0%) |
| 18 to 24 Years | 142 (100.0%) | 18 (85.7%) |
| 25 to 34 Years | 10 (100.0%) | 28 (100.0%) |
| 35 to 44 Years | 16 (100.0%) | 26 (100.0%) |
| 45 to 54 Years | 36 (100.0%) | 93 (100.0%) |
| 55 to 64 Years | 80 (100.0%) | 52 (91.2%) |
| 65 to 74 Years | 97 (95.1%) | 110 (98.2%) |
| 75 Years and over | 43 (100.0%) | 50 (96.2%) |
| Total | 447 (97.2%) | 405 (97.1%) |
Income Below Poverty Among Married-Couple Families in Innsbrook
The poverty statistics for married-couple families in Innsbrook show that 1.9% or 5 of the total 266 families live below the poverty line. Families with no children have the highest poverty rate of 2.0%, comprising of 5 families. On the other hand, families with 1 or 2 children have the lowest poverty rate of 0.0%, which includes 0 families.
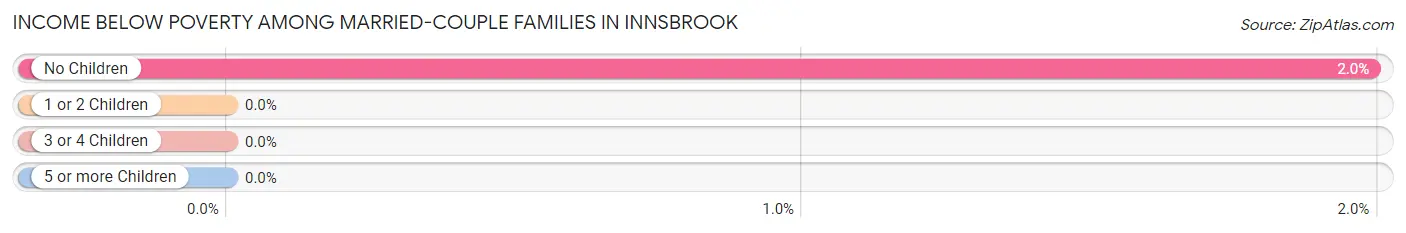
| Children | Above Poverty | Below Poverty |
| No Children | 246 (98.0%) | 5 (2.0%) |
| 1 or 2 Children | 12 (100.0%) | 0 (0.0%) |
| 3 or 4 Children | 3 (100.0%) | 0 (0.0%) |
| 5 or more Children | 0 (0.0%) | 0 (0.0%) |
| Total | 261 (98.1%) | 5 (1.9%) |
Income Below Poverty Among Single-Parent Households in Innsbrook
| Children | Single Father | Single Mother |
| No Children | 0 (0.0%) | 0 (0.0%) |
| 1 or 2 Children | 0 (0.0%) | 0 (0.0%) |
| 3 or 4 Children | 0 (0.0%) | 0 (0.0%) |
| 5 or more Children | 0 (0.0%) | 0 (0.0%) |
| Total | 0 (0.0%) | 0 (0.0%) |
Income Below Poverty Among Married-Couple vs Single-Parent Households in Innsbrook
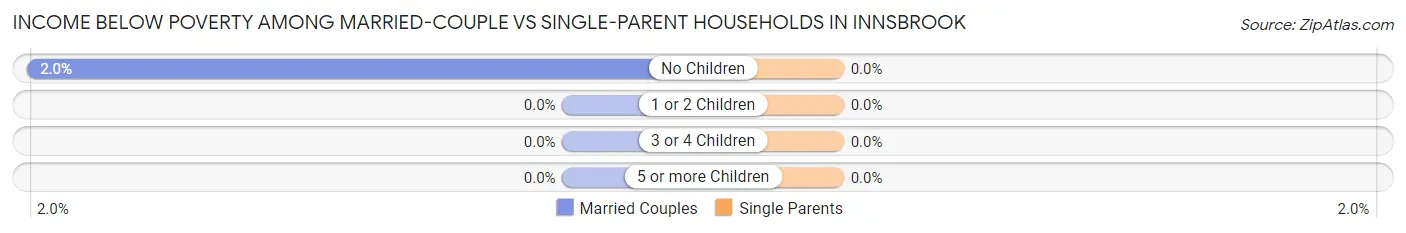
| Children | Married-Couple Families | Single-Parent Households |
| No Children | 5 (2.0%) | 0 (0.0%) |
| 1 or 2 Children | 0 (0.0%) | 0 (0.0%) |
| 3 or 4 Children | 0 (0.0%) | 0 (0.0%) |
| 5 or more Children | 0 (0.0%) | 0 (0.0%) |
| Total | 5 (1.9%) | 0 (0.0%) |
Race in Innsbrook
The most populous races in Innsbrook are White / Caucasian (750 | 85.5%), Two or more Races (127 | 14.5%), and Hispanic or Latino (68 | 7.7%).
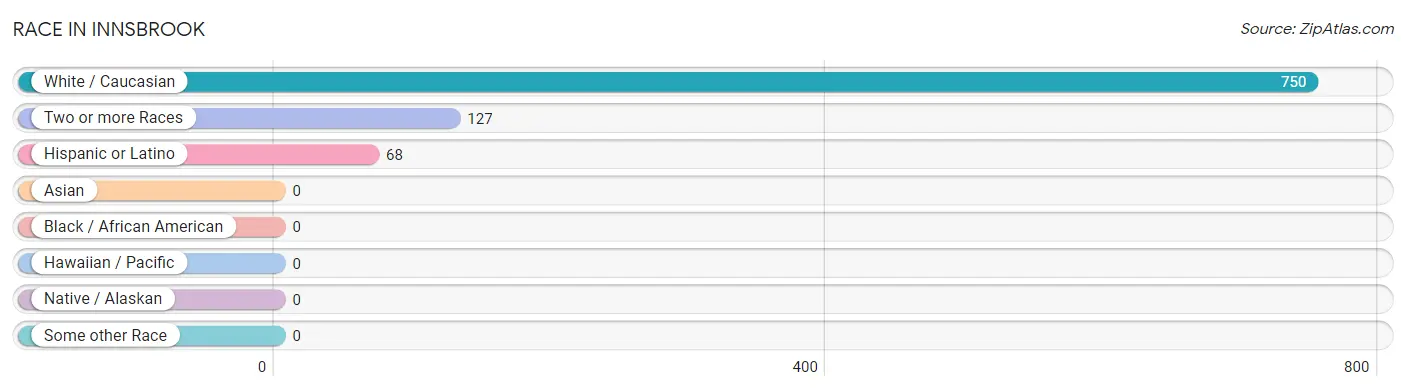
| Race | # Population | % Population |
| Asian | 0 | 0.0% |
| Black / African American | 0 | 0.0% |
| Hawaiian / Pacific | 0 | 0.0% |
| Hispanic or Latino | 68 | 7.7% |
| Native / Alaskan | 0 | 0.0% |
| White / Caucasian | 750 | 85.5% |
| Two or more Races | 127 | 14.5% |
| Some other Race | 0 | 0.0% |
| Total | 877 | 100.0% |
Ancestry in Innsbrook
The most populous ancestries reported in Innsbrook are Italian (254 | 29.0%), German (220 | 25.1%), Irish (116 | 13.2%), English (101 | 11.5%), and Northern European (45 | 5.1%), together accounting for 83.9% of all Innsbrook residents.
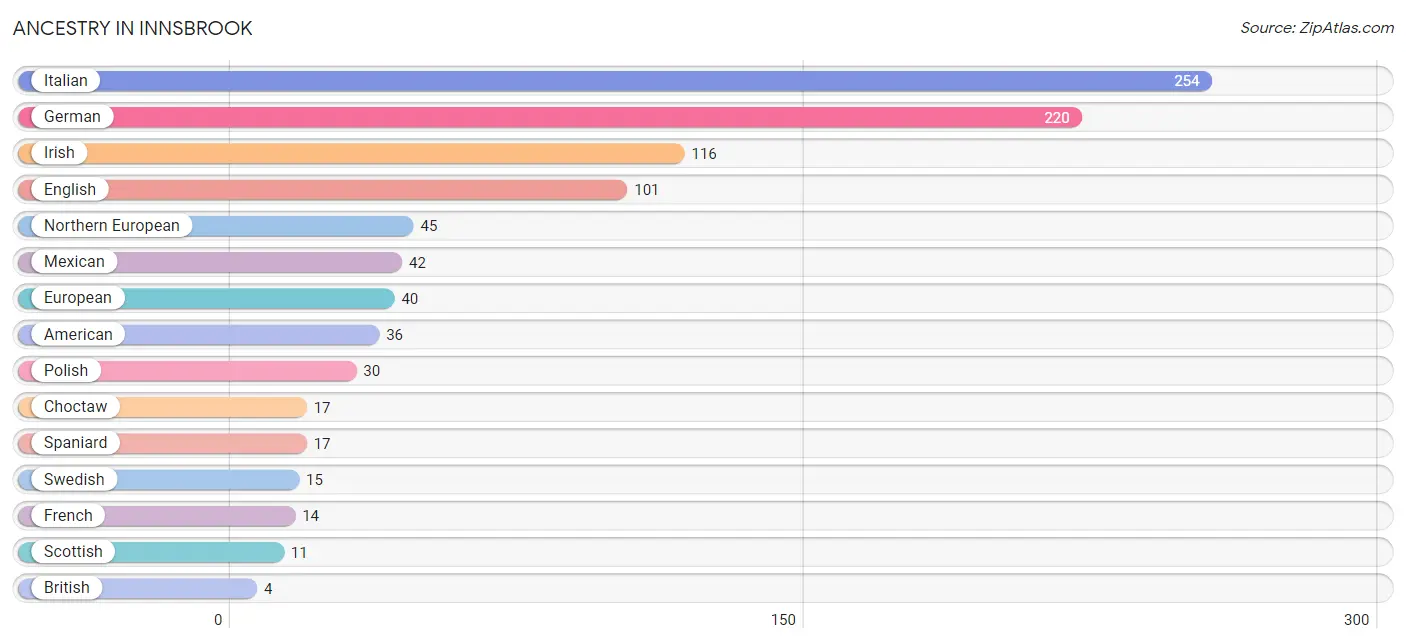
| Ancestry | # Population | % Population |
| American | 36 | 4.1% |
| Belgian | 3 | 0.3% |
| British | 4 | 0.5% |
| Canadian | 2 | 0.2% |
| Celtic | 4 | 0.5% |
| Choctaw | 17 | 1.9% |
| Croatian | 4 | 0.5% |
| Czech | 4 | 0.5% |
| Danish | 1 | 0.1% |
| Dutch | 3 | 0.3% |
| Eastern European | 3 | 0.3% |
| English | 101 | 11.5% |
| European | 40 | 4.6% |
| Finnish | 2 | 0.2% |
| French | 14 | 1.6% |
| German | 220 | 25.1% |
| Hungarian | 3 | 0.3% |
| Irish | 116 | 13.2% |
| Italian | 254 | 29.0% |
| Mexican | 42 | 4.8% |
| Northern European | 45 | 5.1% |
| Norwegian | 3 | 0.3% |
| Polish | 30 | 3.4% |
| Russian | 3 | 0.3% |
| Scandinavian | 4 | 0.5% |
| Scotch-Irish | 3 | 0.3% |
| Scottish | 11 | 1.3% |
| Spaniard | 17 | 1.9% |
| Swedish | 15 | 1.7% |
| Swiss | 4 | 0.5% |
| Welsh | 2 | 0.2% | View All 31 Rows |
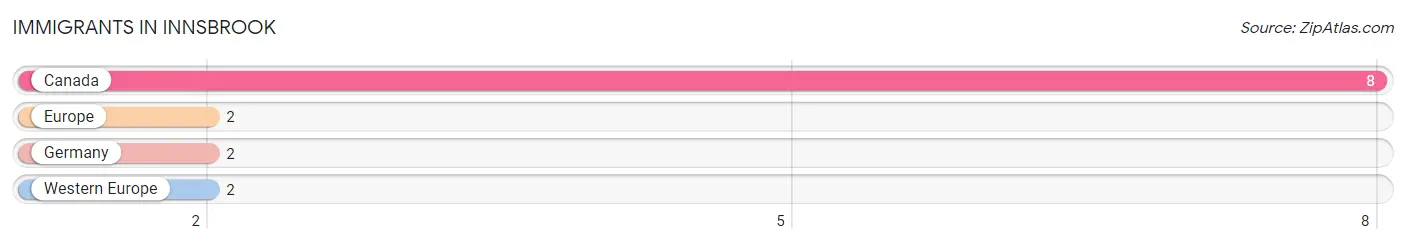
Immigrants in Innsbrook
The most numerous immigrant groups reported in Innsbrook came from Canada (8 | 0.9%), Europe (2 | 0.2%), Germany (2 | 0.2%), and Western Europe (2 | 0.2%), together accounting for 1.6% of all Innsbrook residents.
| Immigration Origin | # Population | % Population |
| Canada | 8 | 0.9% |
| Europe | 2 | 0.2% |
| Germany | 2 | 0.2% |
| Western Europe | 2 | 0.2% | View All 4 Rows |
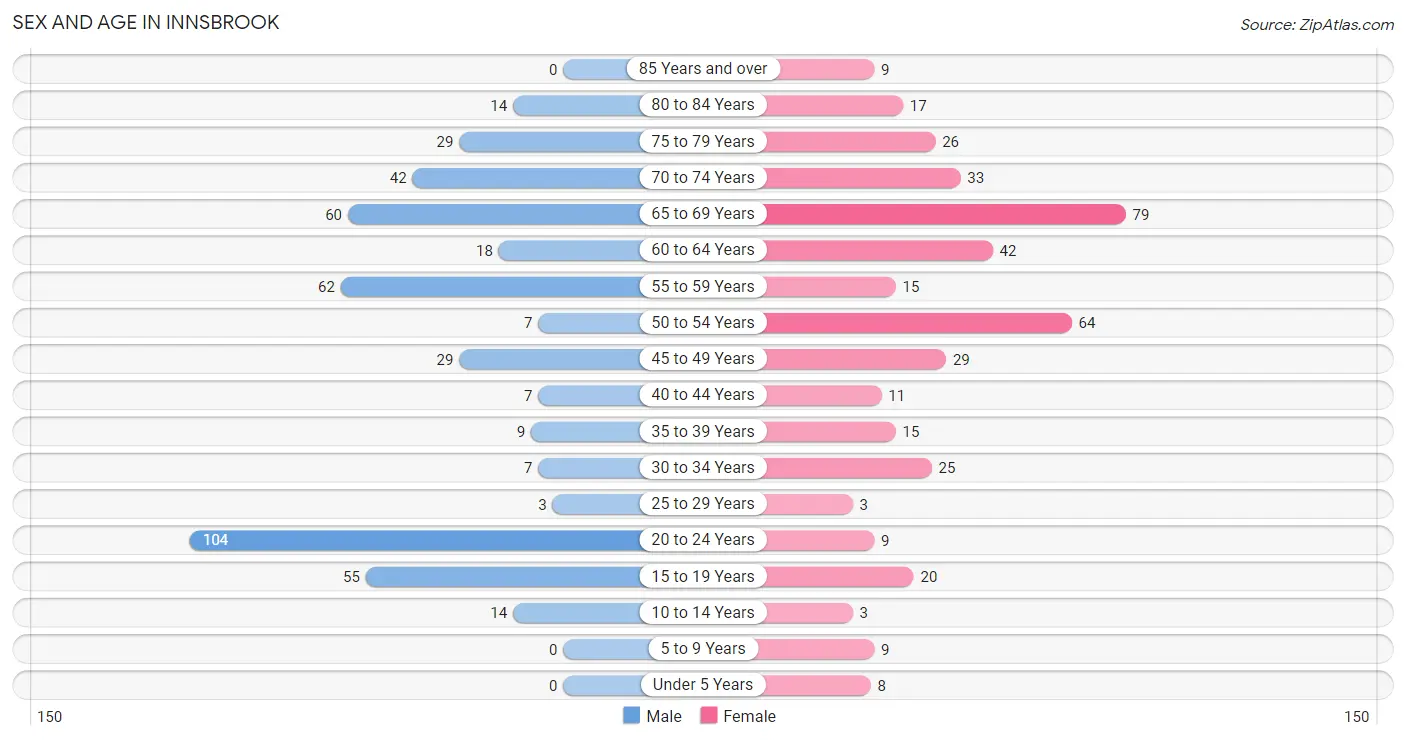
Sex and Age in Innsbrook
Sex and Age in Innsbrook
The most populous age groups in Innsbrook are 20 to 24 Years (104 | 22.6%) for men and 65 to 69 Years (79 | 18.9%) for women.
| Age Bracket | Male | Female |
| Under 5 Years | 0 (0.0%) | 8 (1.9%) |
| 5 to 9 Years | 0 (0.0%) | 9 (2.2%) |
| 10 to 14 Years | 14 (3.0%) | 3 (0.7%) |
| 15 to 19 Years | 55 (12.0%) | 20 (4.8%) |
| 20 to 24 Years | 104 (22.6%) | 9 (2.2%) |
| 25 to 29 Years | 3 (0.6%) | 3 (0.7%) |
| 30 to 34 Years | 7 (1.5%) | 25 (6.0%) |
| 35 to 39 Years | 9 (2.0%) | 15 (3.6%) |
| 40 to 44 Years | 7 (1.5%) | 11 (2.6%) |
| 45 to 49 Years | 29 (6.3%) | 29 (7.0%) |
| 50 to 54 Years | 7 (1.5%) | 64 (15.3%) |
| 55 to 59 Years | 62 (13.5%) | 15 (3.6%) |
| 60 to 64 Years | 18 (3.9%) | 42 (10.1%) |
| 65 to 69 Years | 60 (13.0%) | 79 (18.9%) |
| 70 to 74 Years | 42 (9.1%) | 33 (7.9%) |
| 75 to 79 Years | 29 (6.3%) | 26 (6.2%) |
| 80 to 84 Years | 14 (3.0%) | 17 (4.1%) |
| 85 Years and over | 0 (0.0%) | 9 (2.2%) |
| Total | 460 (100.0%) | 417 (100.0%) |
Families and Households in Innsbrook
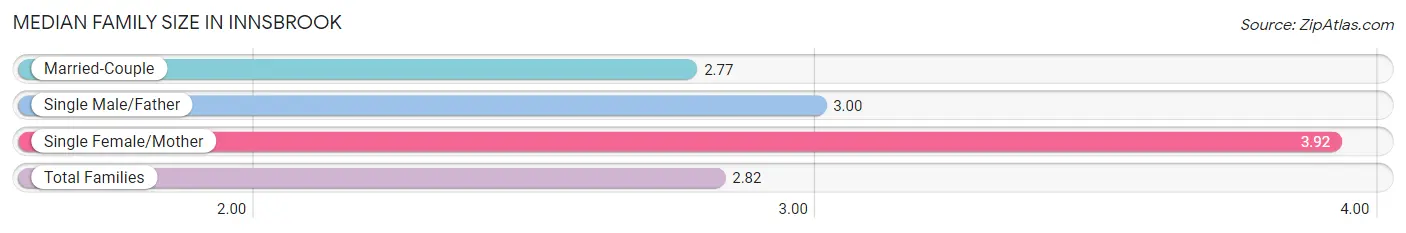
Median Family Size in Innsbrook
The median family size in Innsbrook is 2.82 persons per family, with single female/mother families (13 | 4.6%) accounting for the largest median family size of 3.92 persons per family. On the other hand, married-couple families (266 | 93.3%) represent the smallest median family size with 2.77 persons per family.
| Family Type | # Families | Family Size |
| Married-Couple | 266 (93.3%) | 2.77 |
| Single Male/Father | 6 (2.1%) | 3.00 |
| Single Female/Mother | 13 (4.6%) | 3.92 |
| Total Families | 285 (100.0%) | 2.82 |
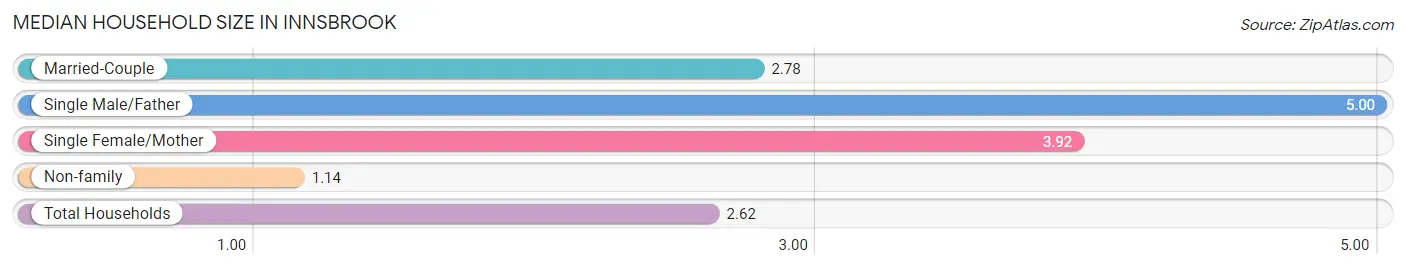
Median Household Size in Innsbrook
The median household size in Innsbrook is 2.62 persons per household, with single male/father households (6 | 1.8%) accounting for the largest median household size of 5 persons per household. non-family households (50 | 14.9%) represent the smallest median household size with 1.14 persons per household.
| Household Type | # Households | Household Size |
| Married-Couple | 266 (79.4%) | 2.78 |
| Single Male/Father | 6 (1.8%) | 5.00 |
| Single Female/Mother | 13 (3.9%) | 3.92 |
| Non-family | 50 (14.9%) | 1.14 |
| Total Households | 335 (100.0%) | 2.62 |
Household Size by Marriage Status in Innsbrook
Out of a total of 335 households in Innsbrook, 285 (85.1%) are family households, while 50 (14.9%) are nonfamily households. The most numerous type of family households are 2-person households, comprising 199, and the most common type of nonfamily households are 1-person households, comprising 41.
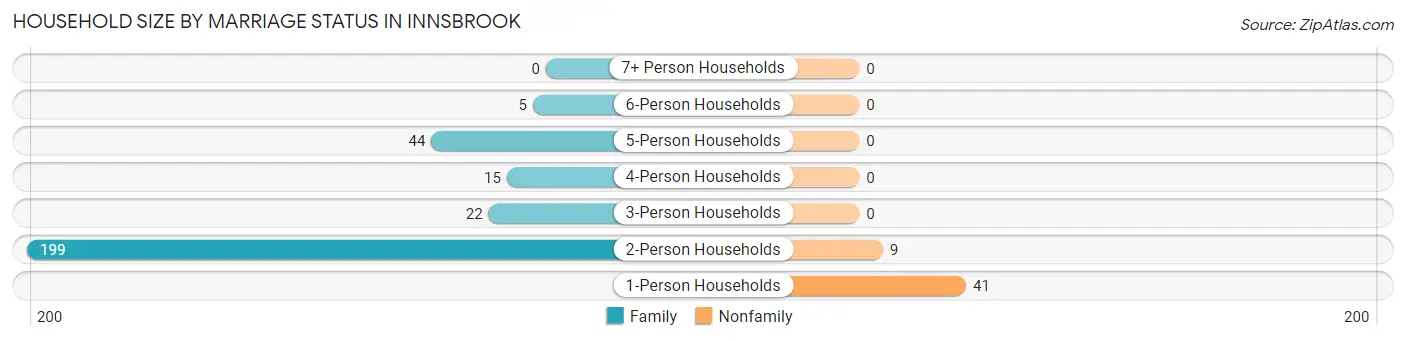
| Household Size | Family Households | Nonfamily Households |
| 1-Person Households | - | 41 (12.2%) |
| 2-Person Households | 199 (59.4%) | 9 (2.7%) |
| 3-Person Households | 22 (6.6%) | 0 (0.0%) |
| 4-Person Households | 15 (4.5%) | 0 (0.0%) |
| 5-Person Households | 44 (13.1%) | 0 (0.0%) |
| 6-Person Households | 5 (1.5%) | 0 (0.0%) |
| 7+ Person Households | 0 (0.0%) | 0 (0.0%) |
| Total | 285 (85.1%) | 50 (14.9%) |
Female Fertility in Innsbrook
Fertility by Age in Innsbrook
Average fertility rate in Innsbrook is 217.0 births per 1,000 women. Women in the age bracket of 20 to 34 years have the highest fertility rate with 676.0 births per 1,000 women. Women in the age bracket of 20 to 34 years acount for 100.0% of all women with births.
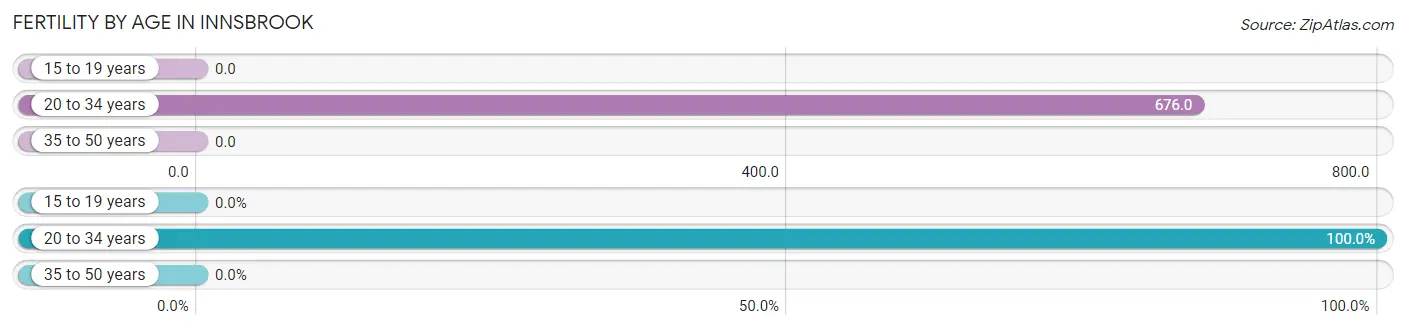
| Age Bracket | Women with Births | Births / 1,000 Women |
| 15 to 19 years | 0 (0.0%) | 0.0 |
| 20 to 34 years | 25 (100.0%) | 676.0 |
| 35 to 50 years | 0 (0.0%) | 0.0 |
| Total | 25 (100.0%) | 217.0 |
Fertility by Age by Marriage Status in Innsbrook
24.0% of women with births (25) in Innsbrook are married. The highest percentage of unmarried women with births falls into 20 to 34 years age bracket with 76.0% of them unmarried at the time of birth, while the lowest percentage of unmarried women with births belong to 20 to 34 years age bracket with 76.0% of them unmarried.
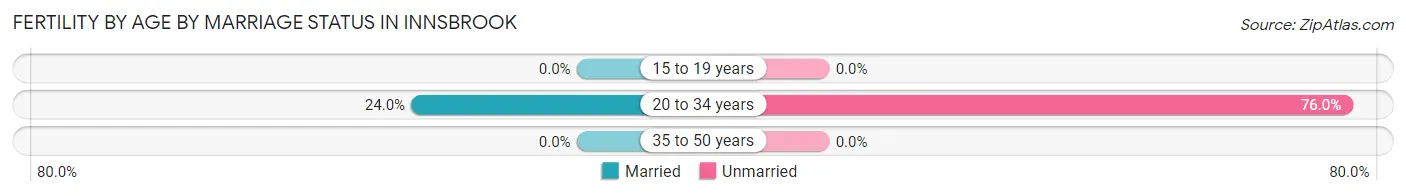
| Age Bracket | Married | Unmarried |
| 15 to 19 years | 0 (0.0%) | 0 (0.0%) |
| 20 to 34 years | 6 (24.0%) | 19 (76.0%) |
| 35 to 50 years | 0 (0.0%) | 0 (0.0%) |
| Total | 6 (24.0%) | 19 (76.0%) |
Fertility by Education in Innsbrook
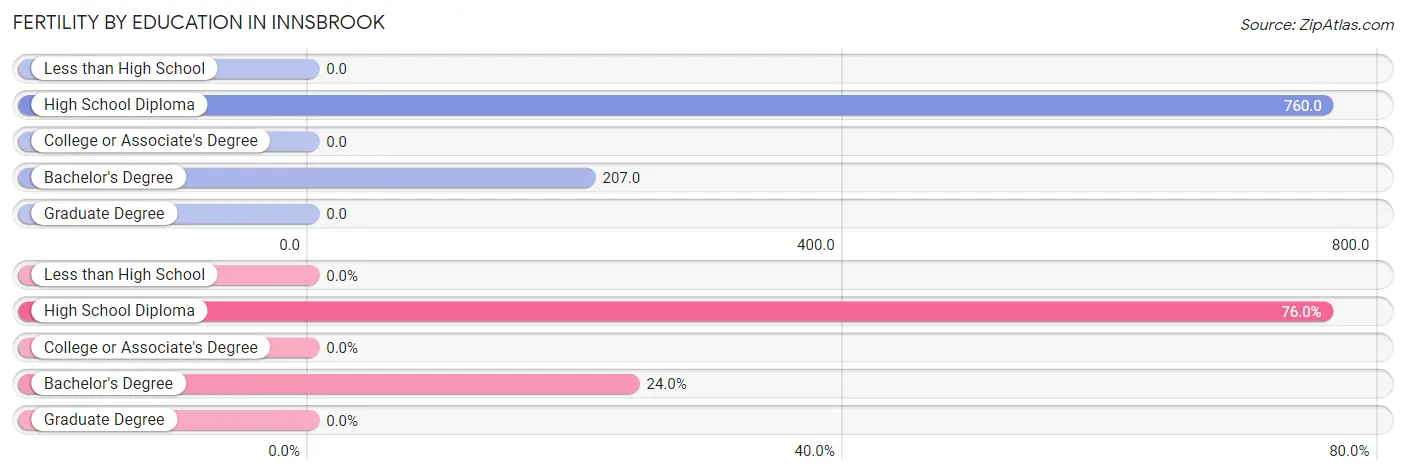
| Educational Attainment | Women with Births | Births / 1,000 Women |
| Less than High School | 0 (0.0%) | 0.0 |
| High School Diploma | 19 (76.0%) | 760.0 |
| College or Associate's Degree | 0 (0.0%) | 0.0 |
| Bachelor's Degree | 6 (24.0%) | 207.0 |
| Graduate Degree | 0 (0.0%) | 0.0 |
| Total | 25 (100.0%) | 217.0 |
Fertility by Education by Marriage Status in Innsbrook
76.0% of women with births in Innsbrook are unmarried. Women with the educational attainment of bachelor's degree are most likely to be married with 100.0% of them married at childbirth, while women with the educational attainment of high school diploma are least likely to be married with 100.0% of them unmarried at childbirth.
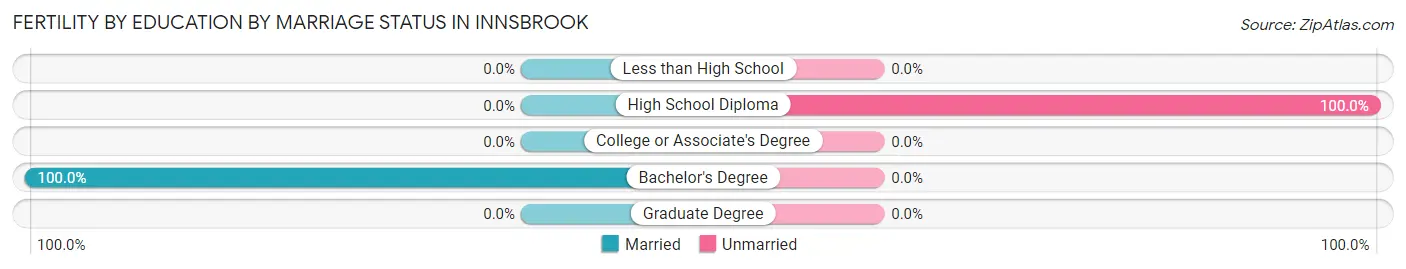
| Educational Attainment | Married | Unmarried |
| Less than High School | 0 (0.0%) | 0 (0.0%) |
| High School Diploma | 0 (0.0%) | 19 (100.0%) |
| College or Associate's Degree | 0 (0.0%) | 0 (0.0%) |
| Bachelor's Degree | 6 (100.0%) | 0 (0.0%) |
| Graduate Degree | 0 (0.0%) | 0 (0.0%) |
| Total | 6 (24.0%) | 19 (76.0%) |
Employment Characteristics in Innsbrook
Employment by Class of Employer in Innsbrook
Among the 263 employed individuals in Innsbrook, private company employees (186 | 70.7%), local government employees (27 | 10.3%), and self-employed (incorporated) (21 | 8.0%) make up the most common classes of employment.
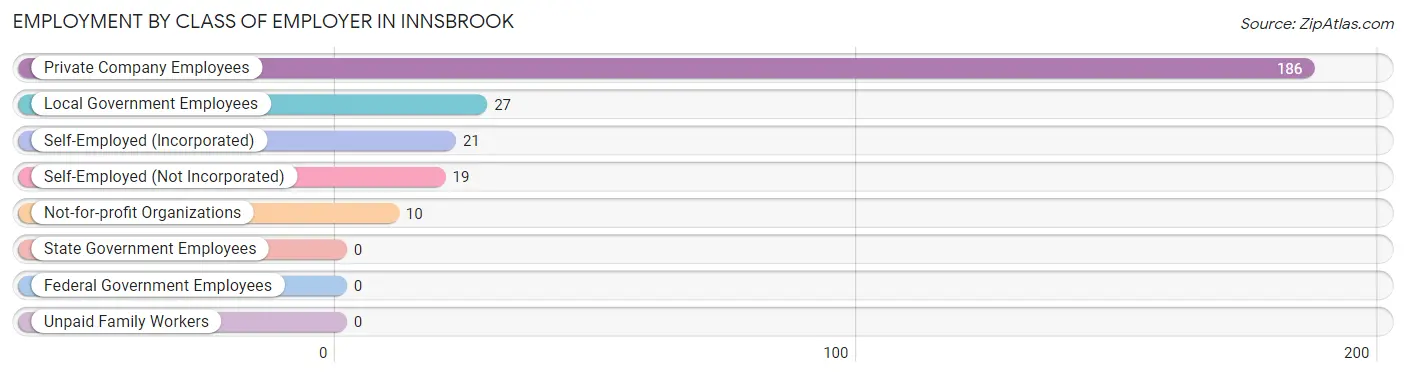
| Employer Class | # Employees | % Employees |
| Private Company Employees | 186 | 70.7% |
| Self-Employed (Incorporated) | 21 | 8.0% |
| Self-Employed (Not Incorporated) | 19 | 7.2% |
| Not-for-profit Organizations | 10 | 3.8% |
| Local Government Employees | 27 | 10.3% |
| State Government Employees | 0 | 0.0% |
| Federal Government Employees | 0 | 0.0% |
| Unpaid Family Workers | 0 | 0.0% |
| Total | 263 | 100.0% |
Employment Status by Age in Innsbrook
According to the labor force statistics for Innsbrook, out of the total population over 16 years of age (818), 36.4% or 298 individuals are in the labor force, with 9.4% or 28 of them unemployed. The age group with the highest labor force participation rate is 25 to 29 years, with 100.0% or 6 individuals in the labor force. Within the labor force, the 45 to 54 years age range has the highest percentage of unemployed individuals, with 30.4% or 24 of them being unemployed.
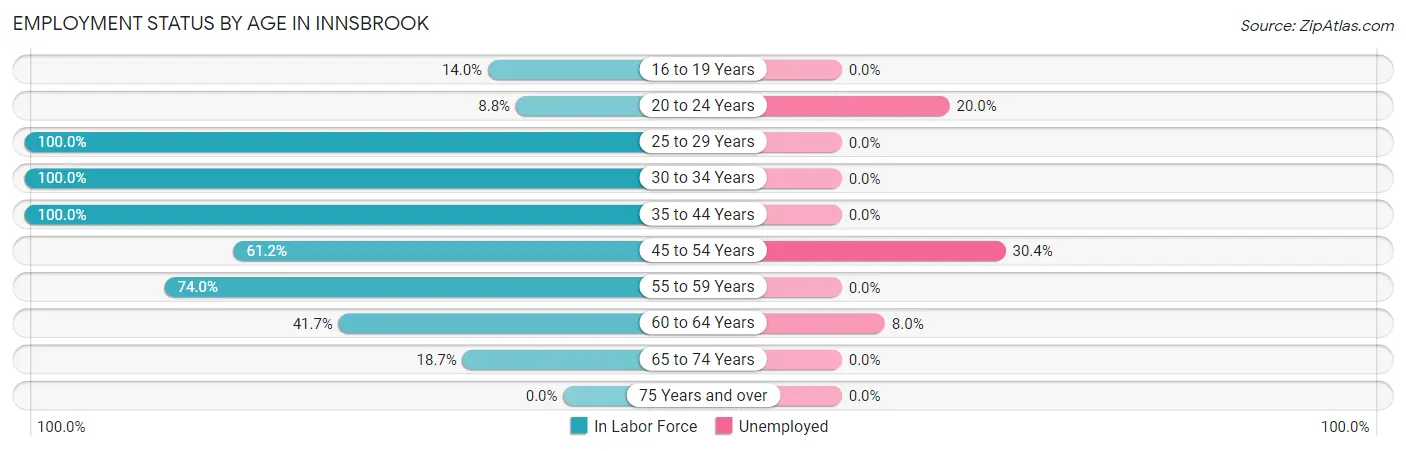
| Age Bracket | In Labor Force | Unemployed |
| 16 to 19 Years | 7 (14.0%) | 0 (0.0%) |
| 20 to 24 Years | 10 (8.8%) | 2 (20.0%) |
| 25 to 29 Years | 6 (100.0%) | 0 (0.0%) |
| 30 to 34 Years | 32 (100.0%) | 0 (0.0%) |
| 35 to 44 Years | 42 (100.0%) | 0 (0.0%) |
| 45 to 54 Years | 79 (61.2%) | 24 (30.4%) |
| 55 to 59 Years | 57 (74.0%) | 0 (0.0%) |
| 60 to 64 Years | 25 (41.7%) | 2 (8.0%) |
| 65 to 74 Years | 40 (18.7%) | 0 (0.0%) |
| 75 Years and over | 0 (0.0%) | 0 (0.0%) |
| Total | 298 (36.4%) | 28 (9.4%) |
Employment Status by Educational Attainment in Innsbrook
According to labor force statistics for Innsbrook, 69.7% of individuals (241) out of the total population between 25 and 64 years of age (346) are in the labor force, with 10.8% or 26 of them being unemployed. The group with the highest labor force participation rate are those with the educational attainment of less than high school, with 100.0% or 11 individuals in the labor force. Within the labor force, individuals with bachelor's degree or higher education have the highest percentage of unemployment, with 14.9% or 24 of them being unemployed.
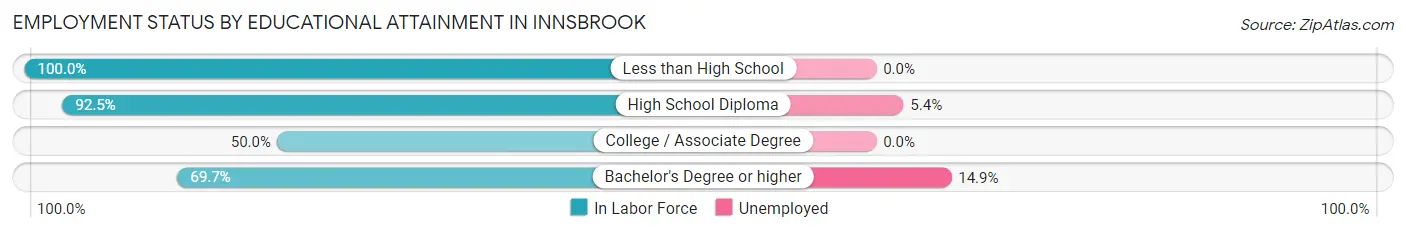
| Educational Attainment | In Labor Force | Unemployed |
| Less than High School | 11 (100.0%) | 0 (0.0%) |
| High School Diploma | 37 (92.5%) | 2 (5.4%) |
| College / Associate Degree | 32 (50.0%) | 0 (0.0%) |
| Bachelor's Degree or higher | 161 (69.7%) | 34 (14.9%) |
| Total | 241 (69.7%) | 37 (10.8%) |
Employment Occupations by Sex in Innsbrook
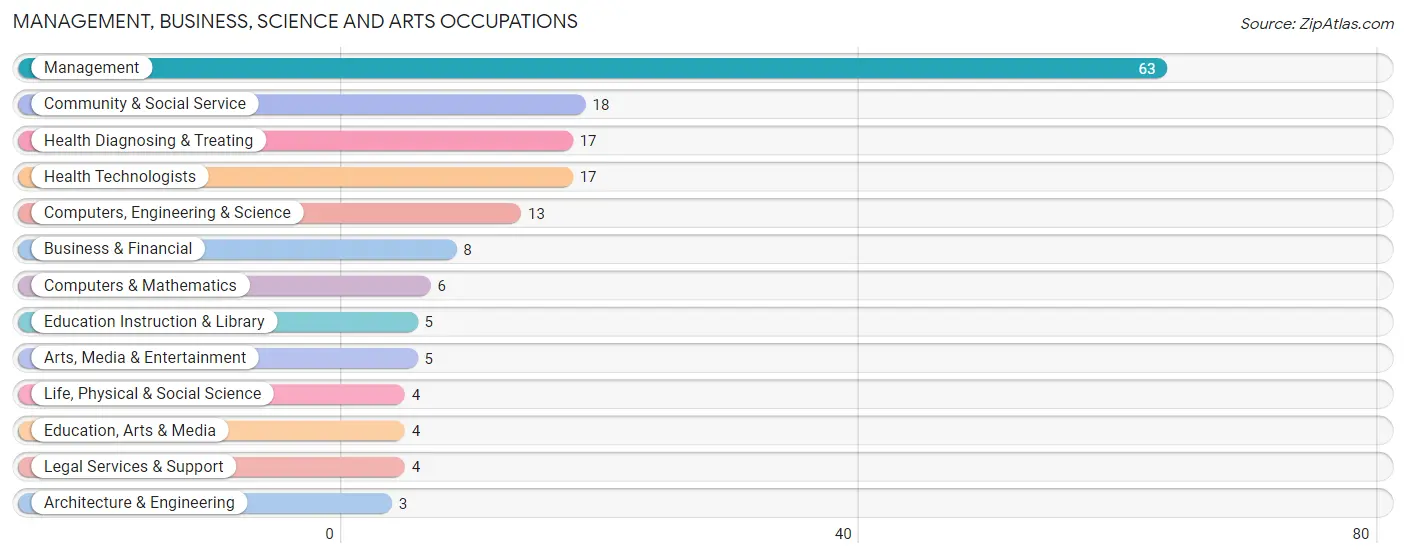
Management, Business, Science and Arts Occupations
The most common Management, Business, Science and Arts occupations in Innsbrook are Management (63 | 23.3%), Community & Social Service (18 | 6.7%), Health Diagnosing & Treating (17 | 6.3%), Health Technologists (17 | 6.3%), and Computers, Engineering & Science (13 | 4.8%).
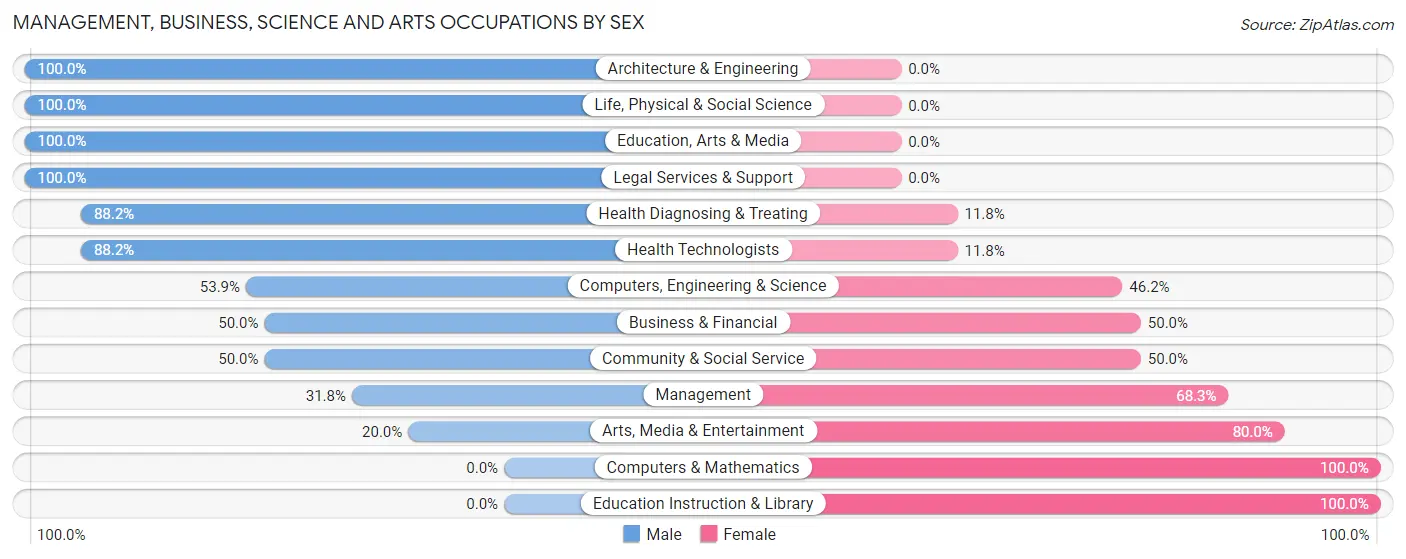
Management, Business, Science and Arts Occupations by Sex
Within the Management, Business, Science and Arts occupations in Innsbrook, the most male-oriented occupations are Architecture & Engineering (100.0%), Life, Physical & Social Science (100.0%), and Education, Arts & Media (100.0%), while the most female-oriented occupations are Computers & Mathematics (100.0%), Education Instruction & Library (100.0%), and Arts, Media & Entertainment (80.0%).
| Occupation | Male | Female |
| Management | 20 (31.8%) | 43 (68.2%) |
| Business & Financial | 4 (50.0%) | 4 (50.0%) |
| Computers, Engineering & Science | 7 (53.8%) | 6 (46.2%) |
| Computers & Mathematics | 0 (0.0%) | 6 (100.0%) |
| Architecture & Engineering | 3 (100.0%) | 0 (0.0%) |
| Life, Physical & Social Science | 4 (100.0%) | 0 (0.0%) |
| Community & Social Service | 9 (50.0%) | 9 (50.0%) |
| Education, Arts & Media | 4 (100.0%) | 0 (0.0%) |
| Legal Services & Support | 4 (100.0%) | 0 (0.0%) |
| Education Instruction & Library | 0 (0.0%) | 5 (100.0%) |
| Arts, Media & Entertainment | 1 (20.0%) | 4 (80.0%) |
| Health Diagnosing & Treating | 15 (88.2%) | 2 (11.8%) |
| Health Technologists | 15 (88.2%) | 2 (11.8%) |
| Total (Category) | 55 (46.2%) | 64 (53.8%) |
| Total (Overall) | 131 (48.5%) | 139 (51.5%) |
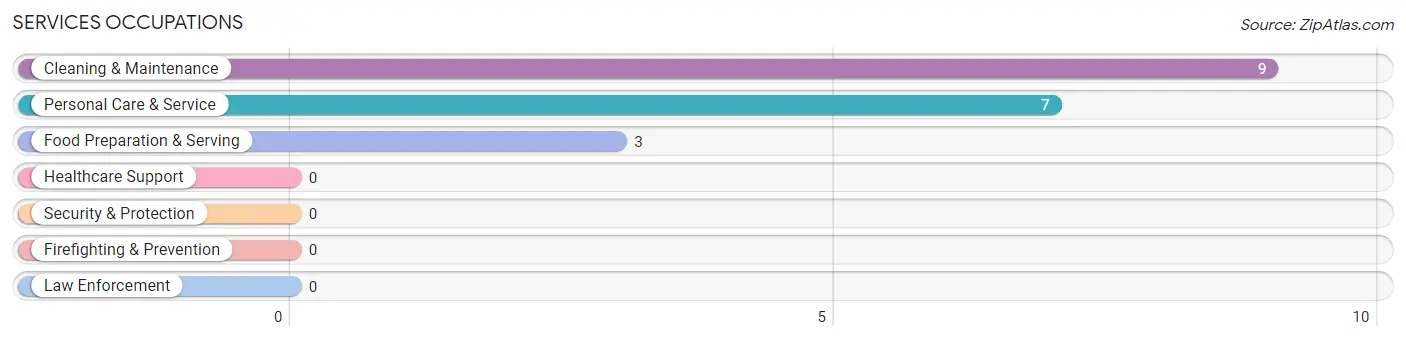
Services Occupations
The most common Services occupations in Innsbrook are Cleaning & Maintenance (9 | 3.3%), Personal Care & Service (7 | 2.6%), and Food Preparation & Serving (3 | 1.1%).
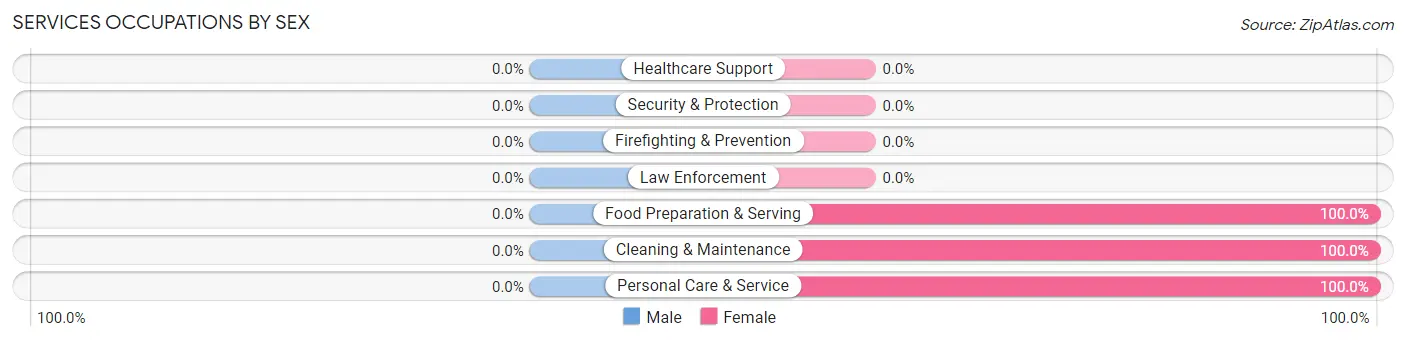
Services Occupations by Sex
| Occupation | Male | Female |
| Healthcare Support | 0 (0.0%) | 0 (0.0%) |
| Security & Protection | 0 (0.0%) | 0 (0.0%) |
| Firefighting & Prevention | 0 (0.0%) | 0 (0.0%) |
| Law Enforcement | 0 (0.0%) | 0 (0.0%) |
| Food Preparation & Serving | 0 (0.0%) | 3 (100.0%) |
| Cleaning & Maintenance | 0 (0.0%) | 9 (100.0%) |
| Personal Care & Service | 0 (0.0%) | 7 (100.0%) |
| Total (Category) | 0 (0.0%) | 19 (100.0%) |
| Total (Overall) | 131 (48.5%) | 139 (51.5%) |
Sales and Office Occupations
The most common Sales and Office occupations in Innsbrook are Sales & Related (98 | 36.3%), and Office & Administration (11 | 4.1%).
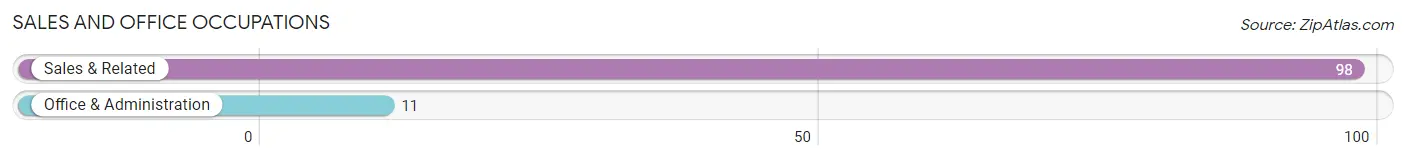
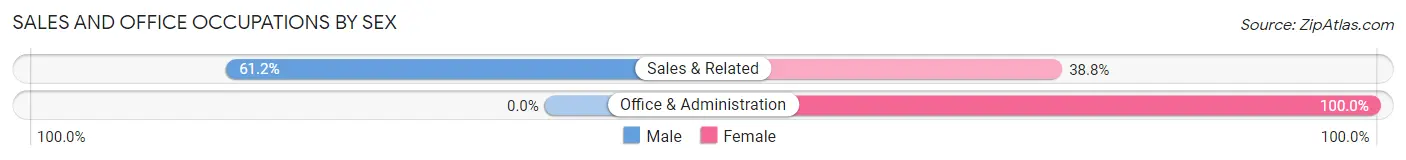
Sales and Office Occupations by Sex
| Occupation | Male | Female |
| Sales & Related | 60 (61.2%) | 38 (38.8%) |
| Office & Administration | 0 (0.0%) | 11 (100.0%) |
| Total (Category) | 60 (55.0%) | 49 (45.0%) |
| Total (Overall) | 131 (48.5%) | 139 (51.5%) |
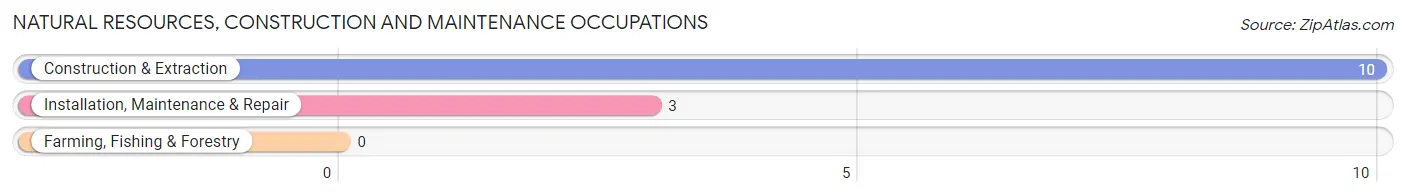
Natural Resources, Construction and Maintenance Occupations
The most common Natural Resources, Construction and Maintenance occupations in Innsbrook are Construction & Extraction (10 | 3.7%), and Installation, Maintenance & Repair (3 | 1.1%).
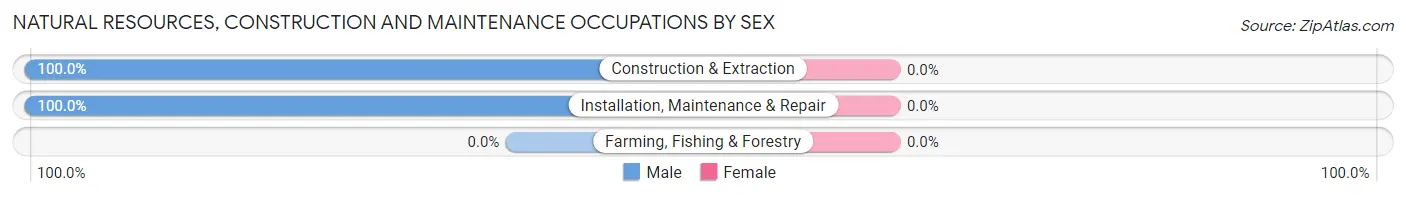
Natural Resources, Construction and Maintenance Occupations by Sex
| Occupation | Male | Female |
| Farming, Fishing & Forestry | 0 (0.0%) | 0 (0.0%) |
| Construction & Extraction | 10 (100.0%) | 0 (0.0%) |
| Installation, Maintenance & Repair | 3 (100.0%) | 0 (0.0%) |
| Total (Category) | 13 (100.0%) | 0 (0.0%) |
| Total (Overall) | 131 (48.5%) | 139 (51.5%) |
Production, Transportation and Moving Occupations
The most common Production, Transportation and Moving occupations in Innsbrook are Production (7 | 2.6%), and Transportation (3 | 1.1%).
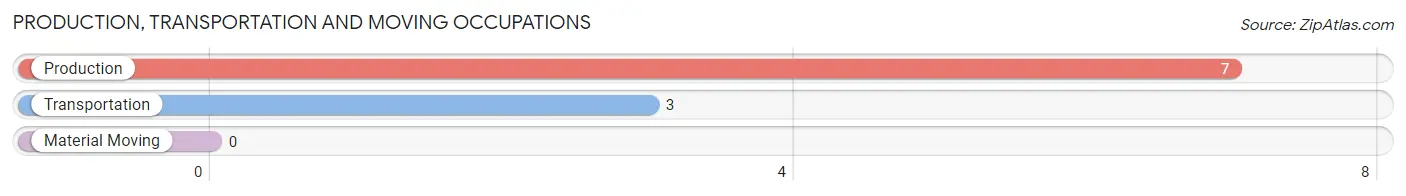
Production, Transportation and Moving Occupations by Sex
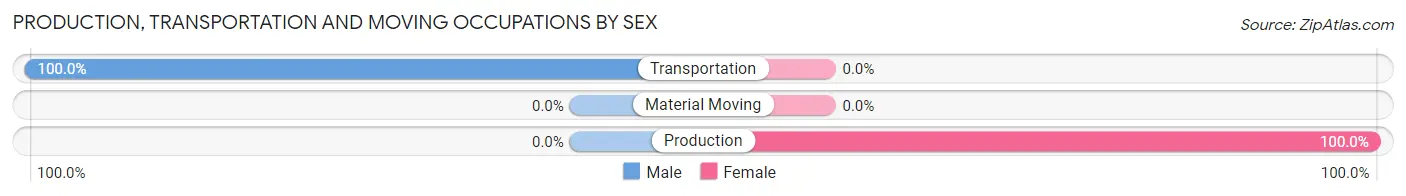
| Occupation | Male | Female |
| Production | 0 (0.0%) | 7 (100.0%) |
| Transportation | 3 (100.0%) | 0 (0.0%) |
| Material Moving | 0 (0.0%) | 0 (0.0%) |
| Total (Category) | 3 (30.0%) | 7 (70.0%) |
| Total (Overall) | 131 (48.5%) | 139 (51.5%) |
Employment Industries by Sex in Innsbrook
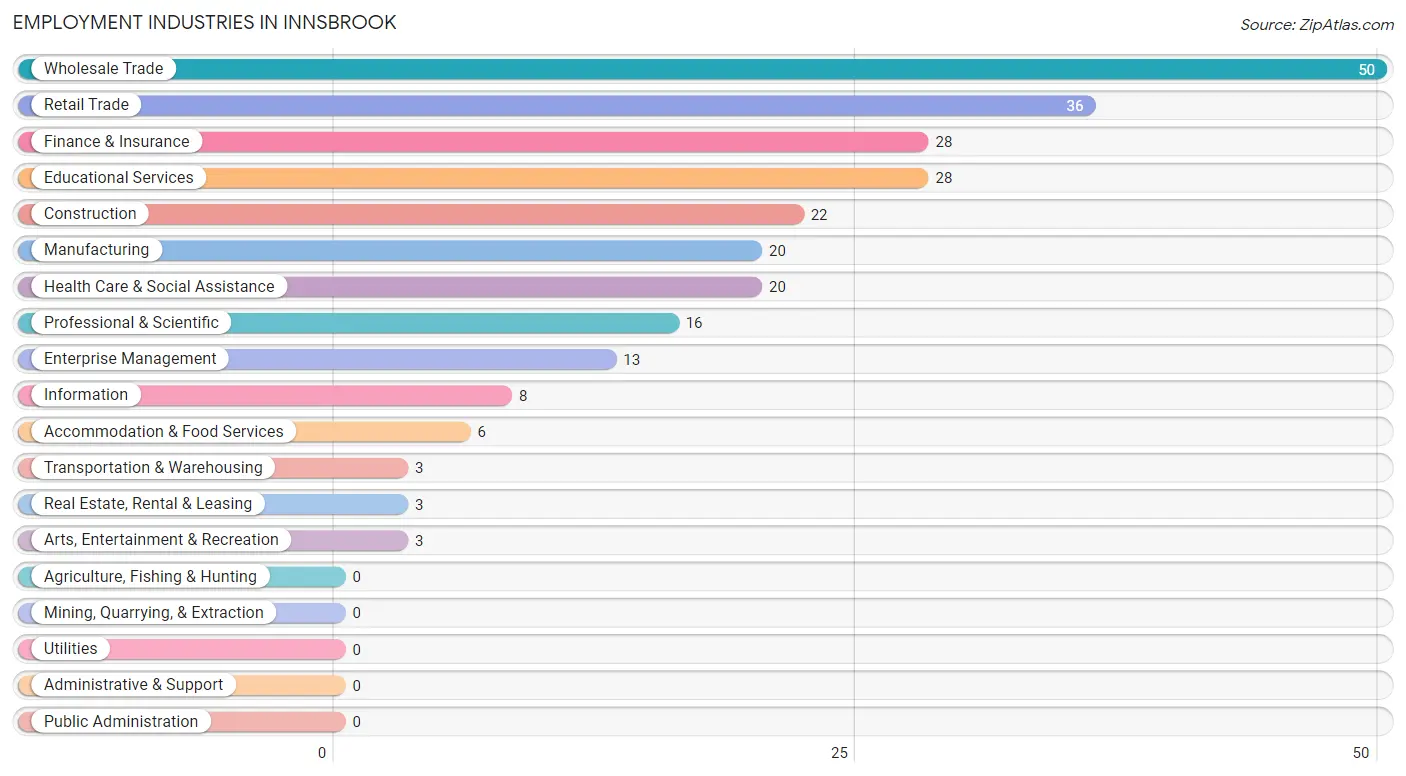
Employment Industries in Innsbrook
The major employment industries in Innsbrook include Wholesale Trade (50 | 18.5%), Retail Trade (36 | 13.3%), Finance & Insurance (28 | 10.4%), Educational Services (28 | 10.4%), and Construction (22 | 8.2%).
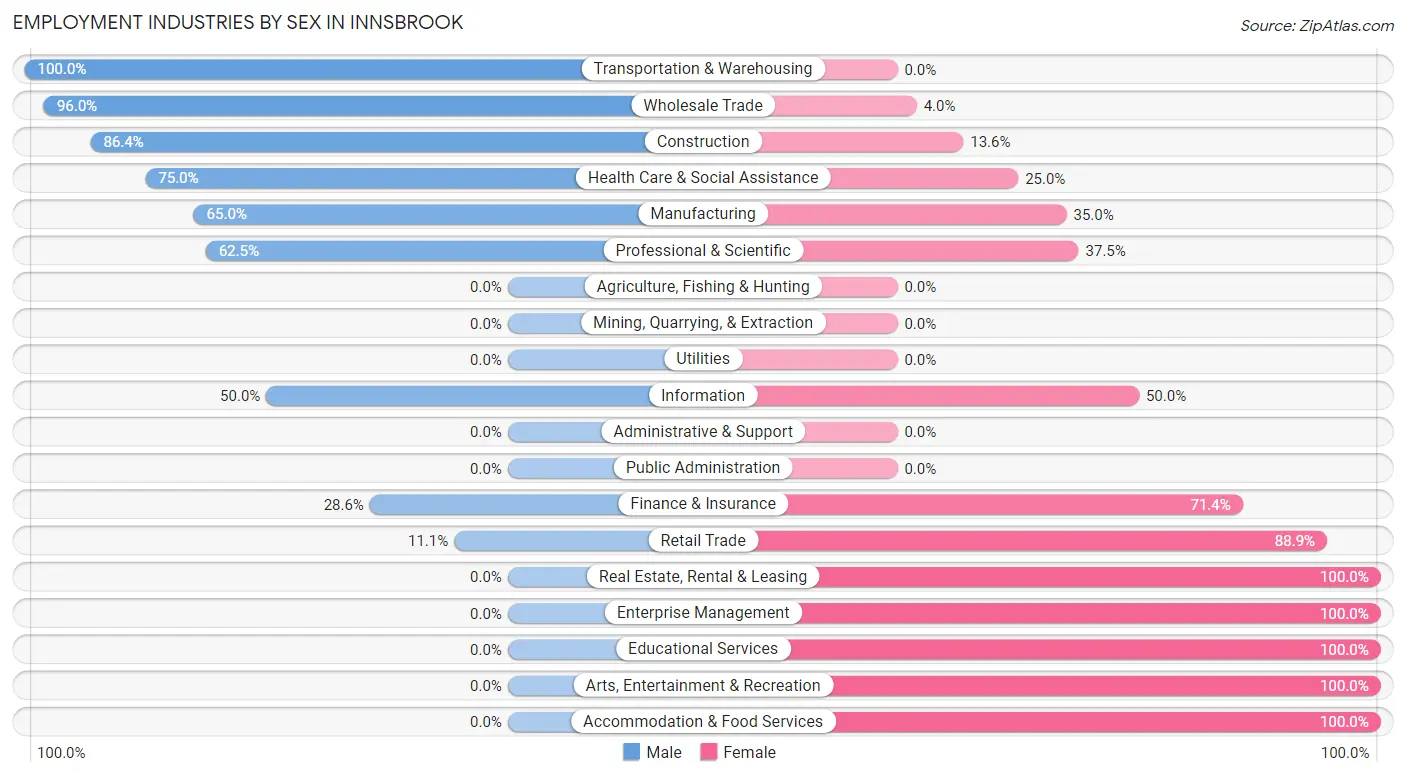
Employment Industries by Sex in Innsbrook
The Innsbrook industries that see more men than women are Transportation & Warehousing (100.0%), Wholesale Trade (96.0%), and Construction (86.4%), whereas the industries that tend to have a higher number of women are Real Estate, Rental & Leasing (100.0%), Enterprise Management (100.0%), and Educational Services (100.0%).
| Industry | Male | Female |
| Agriculture, Fishing & Hunting | 0 (0.0%) | 0 (0.0%) |
| Mining, Quarrying, & Extraction | 0 (0.0%) | 0 (0.0%) |
| Construction | 19 (86.4%) | 3 (13.6%) |
| Manufacturing | 13 (65.0%) | 7 (35.0%) |
| Wholesale Trade | 48 (96.0%) | 2 (4.0%) |
| Retail Trade | 4 (11.1%) | 32 (88.9%) |
| Transportation & Warehousing | 3 (100.0%) | 0 (0.0%) |
| Utilities | 0 (0.0%) | 0 (0.0%) |
| Information | 4 (50.0%) | 4 (50.0%) |
| Finance & Insurance | 8 (28.6%) | 20 (71.4%) |
| Real Estate, Rental & Leasing | 0 (0.0%) | 3 (100.0%) |
| Professional & Scientific | 10 (62.5%) | 6 (37.5%) |
| Enterprise Management | 0 (0.0%) | 13 (100.0%) |
| Administrative & Support | 0 (0.0%) | 0 (0.0%) |
| Educational Services | 0 (0.0%) | 28 (100.0%) |
| Health Care & Social Assistance | 15 (75.0%) | 5 (25.0%) |
| Arts, Entertainment & Recreation | 0 (0.0%) | 3 (100.0%) |
| Accommodation & Food Services | 0 (0.0%) | 6 (100.0%) |
| Public Administration | 0 (0.0%) | 0 (0.0%) |
| Total | 131 (48.5%) | 139 (51.5%) |
Education in Innsbrook
School Enrollment in Innsbrook
The most common levels of schooling among the 200 students in Innsbrook are college / undergraduate (150 | 75.0%), high school (26 | 13.0%), and middle school (21 | 10.5%).
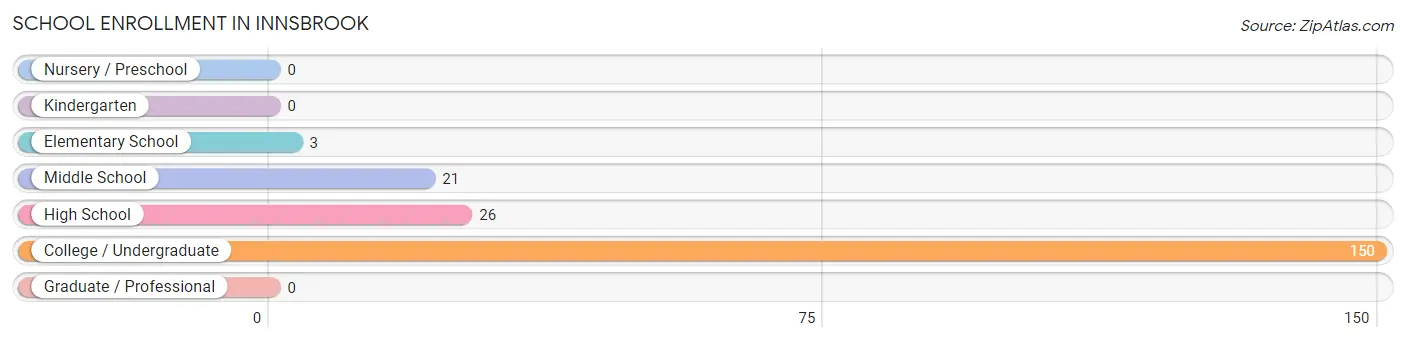
| School Level | # Students | % Students |
| Nursery / Preschool | 0 | 0.0% |
| Kindergarten | 0 | 0.0% |
| Elementary School | 3 | 1.5% |
| Middle School | 21 | 10.5% |
| High School | 26 | 13.0% |
| College / Undergraduate | 150 | 75.0% |
| Graduate / Professional | 0 | 0.0% |
| Total | 200 | 100.0% |
School Enrollment by Age by Funding Source in Innsbrook
Out of a total of 200 students who are enrolled in schools in Innsbrook, 12 (6.0%) attend a private institution, while the remaining 188 (94.0%) are enrolled in public schools. The age group of 25 to 34 year olds has the highest likelihood of being enrolled in private schools, with 3 (100.0% in the age bracket) enrolled. Conversely, the age group of 5 to 9 year old has the lowest likelihood of being enrolled in a private school, with 3 (100.0% in the age bracket) attending a public institution.
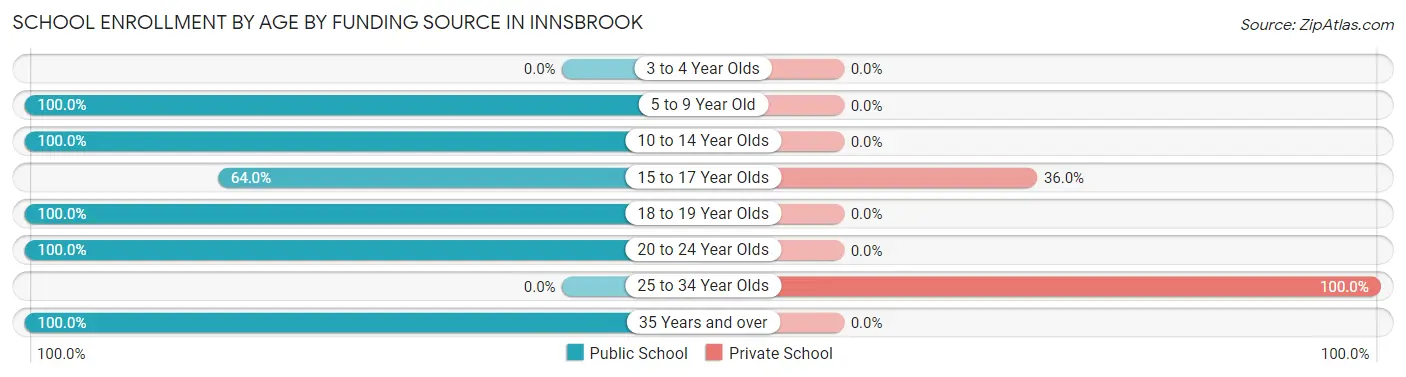
| Age Bracket | Public School | Private School |
| 3 to 4 Year Olds | 0 (0.0%) | 0 (0.0%) |
| 5 to 9 Year Old | 3 (100.0%) | 0 (0.0%) |
| 10 to 14 Year Olds | 17 (100.0%) | 0 (0.0%) |
| 15 to 17 Year Olds | 16 (64.0%) | 9 (36.0%) |
| 18 to 19 Year Olds | 50 (100.0%) | 0 (0.0%) |
| 20 to 24 Year Olds | 100 (100.0%) | 0 (0.0%) |
| 25 to 34 Year Olds | 0 (0.0%) | 3 (100.0%) |
| 35 Years and over | 2 (100.0%) | 0 (0.0%) |
| Total | 188 (94.0%) | 12 (6.0%) |
Educational Attainment by Field of Study in Innsbrook
Business (142 | 33.1%), education (80 | 18.6%), liberal arts & history (56 | 13.1%), science & technology (31 | 7.2%), and bio, nature & agricultural (24 | 5.6%) are the most common fields of study among 429 individuals in Innsbrook who have obtained a bachelor's degree or higher.
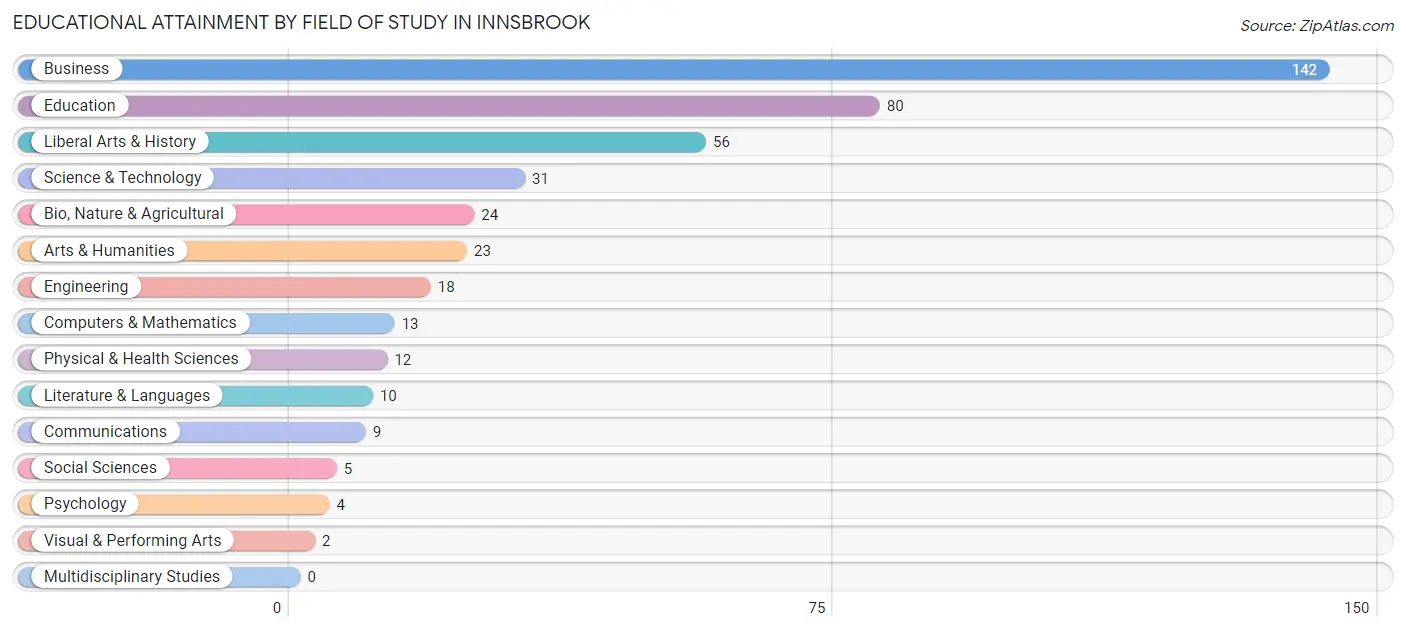
| Field of Study | # Graduates | % Graduates |
| Computers & Mathematics | 13 | 3.0% |
| Bio, Nature & Agricultural | 24 | 5.6% |
| Physical & Health Sciences | 12 | 2.8% |
| Psychology | 4 | 0.9% |
| Social Sciences | 5 | 1.2% |
| Engineering | 18 | 4.2% |
| Multidisciplinary Studies | 0 | 0.0% |
| Science & Technology | 31 | 7.2% |
| Business | 142 | 33.1% |
| Education | 80 | 18.6% |
| Literature & Languages | 10 | 2.3% |
| Liberal Arts & History | 56 | 13.1% |
| Visual & Performing Arts | 2 | 0.5% |
| Communications | 9 | 2.1% |
| Arts & Humanities | 23 | 5.4% |
| Total | 429 | 100.0% |
Transportation & Commute in Innsbrook
Vehicle Availability by Sex in Innsbrook
The most prevalent vehicle ownership categories in Innsbrook are males with 5 or more vehicles (44, accounting for 33.9%) and females with 5 or more vehicles (5, making up 33.1%).
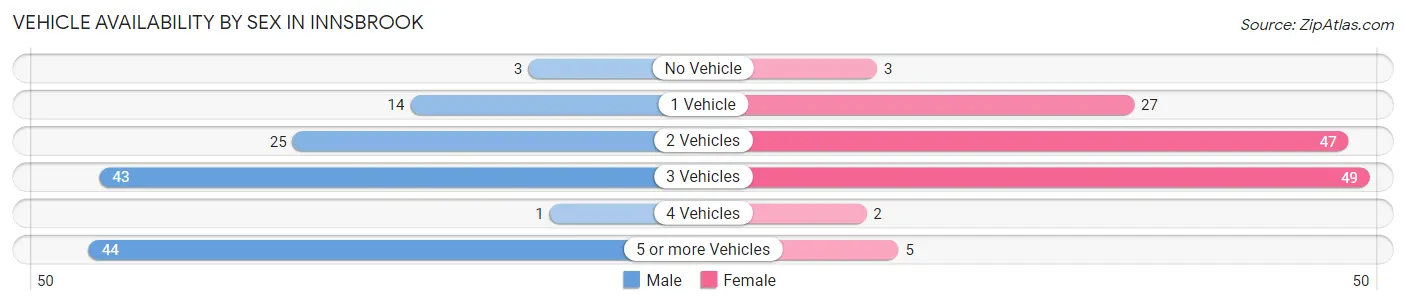
| Vehicles Available | Male | Female |
| No Vehicle | 3 (2.3%) | 3 (2.3%) |
| 1 Vehicle | 14 (10.8%) | 27 (20.3%) |
| 2 Vehicles | 25 (19.2%) | 47 (35.3%) |
| 3 Vehicles | 43 (33.1%) | 49 (36.8%) |
| 4 Vehicles | 1 (0.8%) | 2 (1.5%) |
| 5 or more Vehicles | 44 (33.9%) | 5 (3.8%) |
| Total | 130 (100.0%) | 133 (100.0%) |
Commute Time in Innsbrook
The most frequently occuring commute durations in Innsbrook are 30 to 34 minutes (52 commuters, 22.5%), 15 to 19 minutes (37 commuters, 16.0%), and 45 to 59 minutes (34 commuters, 14.7%).
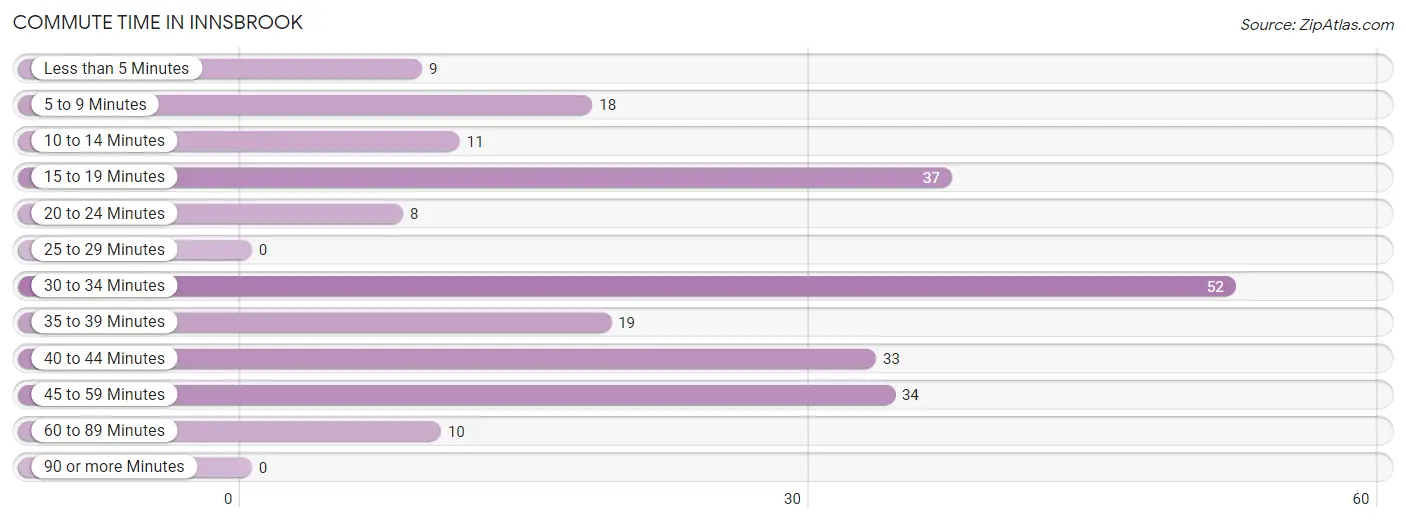
| Commute Time | # Commuters | % Commuters |
| Less than 5 Minutes | 9 | 3.9% |
| 5 to 9 Minutes | 18 | 7.8% |
| 10 to 14 Minutes | 11 | 4.8% |
| 15 to 19 Minutes | 37 | 16.0% |
| 20 to 24 Minutes | 8 | 3.5% |
| 25 to 29 Minutes | 0 | 0.0% |
| 30 to 34 Minutes | 52 | 22.5% |
| 35 to 39 Minutes | 19 | 8.2% |
| 40 to 44 Minutes | 33 | 14.3% |
| 45 to 59 Minutes | 34 | 14.7% |
| 60 to 89 Minutes | 10 | 4.3% |
| 90 or more Minutes | 0 | 0.0% |
Commute Time by Sex in Innsbrook
The most common commute times in Innsbrook are 30 to 34 minutes (45 commuters, 39.8%) for males and 40 to 44 minutes (31 commuters, 26.3%) for females.
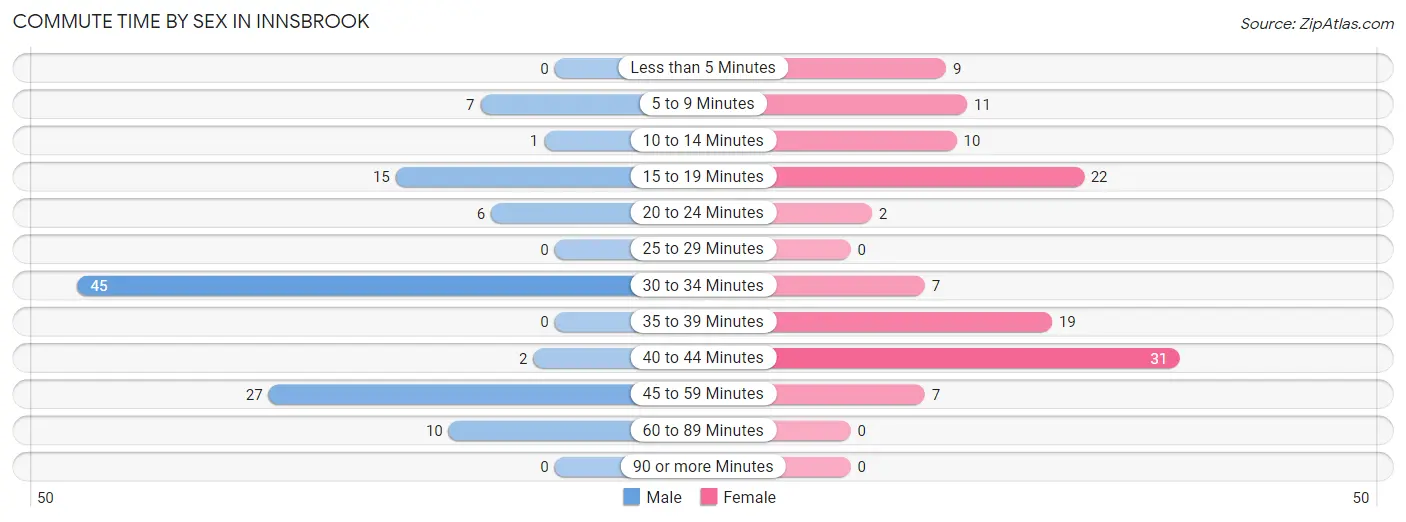
| Commute Time | Male | Female |
| Less than 5 Minutes | 0 (0.0%) | 9 (7.6%) |
| 5 to 9 Minutes | 7 (6.2%) | 11 (9.3%) |
| 10 to 14 Minutes | 1 (0.9%) | 10 (8.5%) |
| 15 to 19 Minutes | 15 (13.3%) | 22 (18.6%) |
| 20 to 24 Minutes | 6 (5.3%) | 2 (1.7%) |
| 25 to 29 Minutes | 0 (0.0%) | 0 (0.0%) |
| 30 to 34 Minutes | 45 (39.8%) | 7 (5.9%) |
| 35 to 39 Minutes | 0 (0.0%) | 19 (16.1%) |
| 40 to 44 Minutes | 2 (1.8%) | 31 (26.3%) |
| 45 to 59 Minutes | 27 (23.9%) | 7 (5.9%) |
| 60 to 89 Minutes | 10 (8.8%) | 0 (0.0%) |
| 90 or more Minutes | 0 (0.0%) | 0 (0.0%) |
Time of Departure to Work by Sex in Innsbrook
The most frequent times of departure to work in Innsbrook are 7:00 AM to 7:29 AM (55, 48.7%) for males and 6:30 AM to 6:59 AM (31, 26.3%) for females.
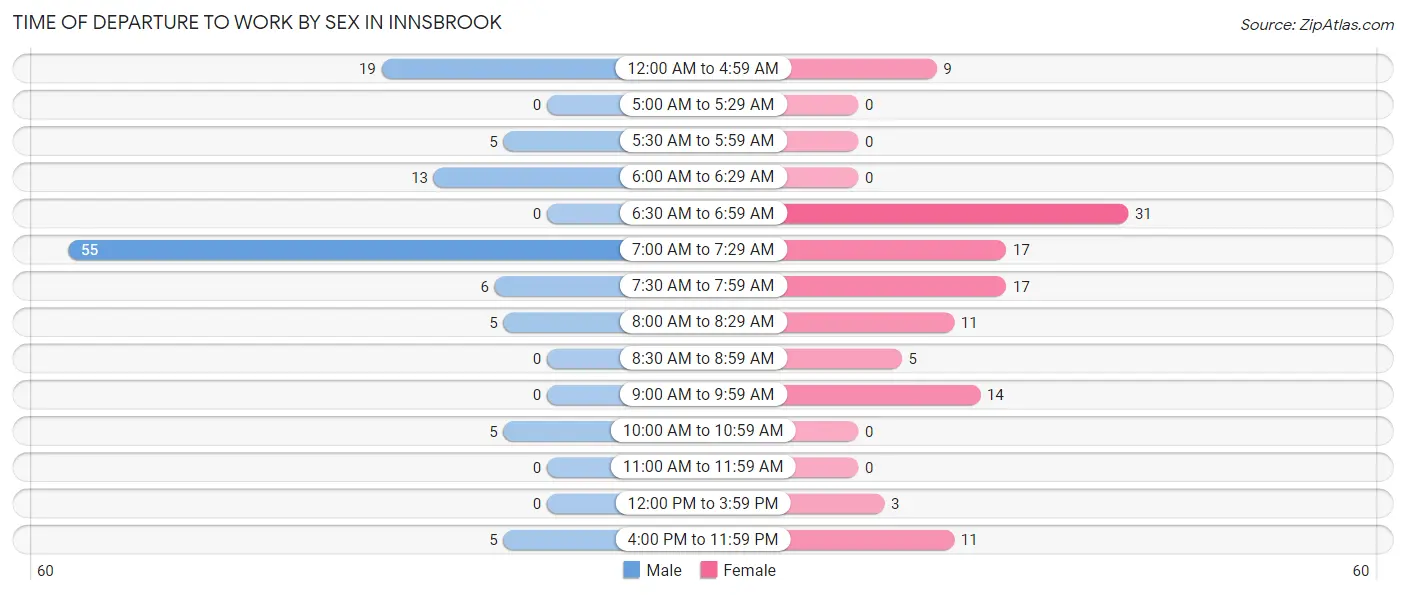
| Time of Departure | Male | Female |
| 12:00 AM to 4:59 AM | 19 (16.8%) | 9 (7.6%) |
| 5:00 AM to 5:29 AM | 0 (0.0%) | 0 (0.0%) |
| 5:30 AM to 5:59 AM | 5 (4.4%) | 0 (0.0%) |
| 6:00 AM to 6:29 AM | 13 (11.5%) | 0 (0.0%) |
| 6:30 AM to 6:59 AM | 0 (0.0%) | 31 (26.3%) |
| 7:00 AM to 7:29 AM | 55 (48.7%) | 17 (14.4%) |
| 7:30 AM to 7:59 AM | 6 (5.3%) | 17 (14.4%) |
| 8:00 AM to 8:29 AM | 5 (4.4%) | 11 (9.3%) |
| 8:30 AM to 8:59 AM | 0 (0.0%) | 5 (4.2%) |
| 9:00 AM to 9:59 AM | 0 (0.0%) | 14 (11.9%) |
| 10:00 AM to 10:59 AM | 5 (4.4%) | 0 (0.0%) |
| 11:00 AM to 11:59 AM | 0 (0.0%) | 0 (0.0%) |
| 12:00 PM to 3:59 PM | 0 (0.0%) | 3 (2.5%) |
| 4:00 PM to 11:59 PM | 5 (4.4%) | 11 (9.3%) |
| Total | 113 (100.0%) | 118 (100.0%) |
Housing Occupancy in Innsbrook
Occupancy by Ownership in Innsbrook
Of the total 335 dwellings in Innsbrook, owner-occupied units account for 329 (98.2%), while renter-occupied units make up 6 (1.8%).
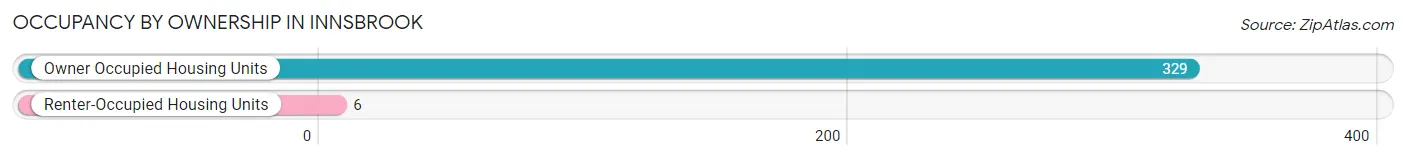
| Occupancy | # Housing Units | % Housing Units |
| Owner Occupied Housing Units | 329 | 98.2% |
| Renter-Occupied Housing Units | 6 | 1.8% |
| Total Occupied Housing Units | 335 | 100.0% |
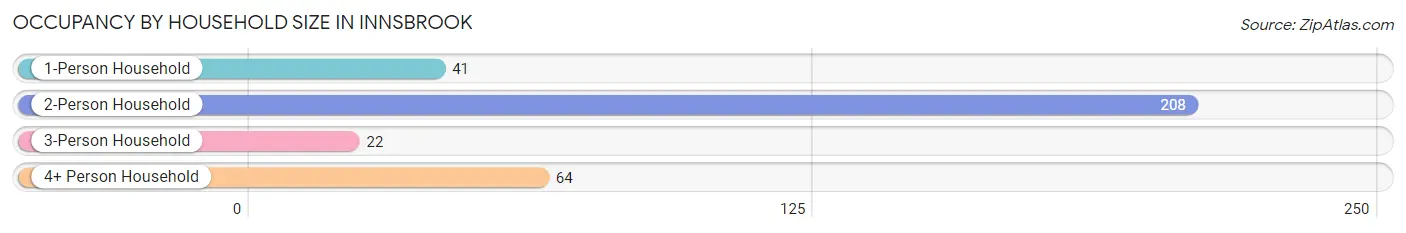
Occupancy by Household Size in Innsbrook
| Household Size | # Housing Units | % Housing Units |
| 1-Person Household | 41 | 12.2% |
| 2-Person Household | 208 | 62.1% |
| 3-Person Household | 22 | 6.6% |
| 4+ Person Household | 64 | 19.1% |
| Total Housing Units | 335 | 100.0% |
Occupancy by Ownership by Household Size in Innsbrook
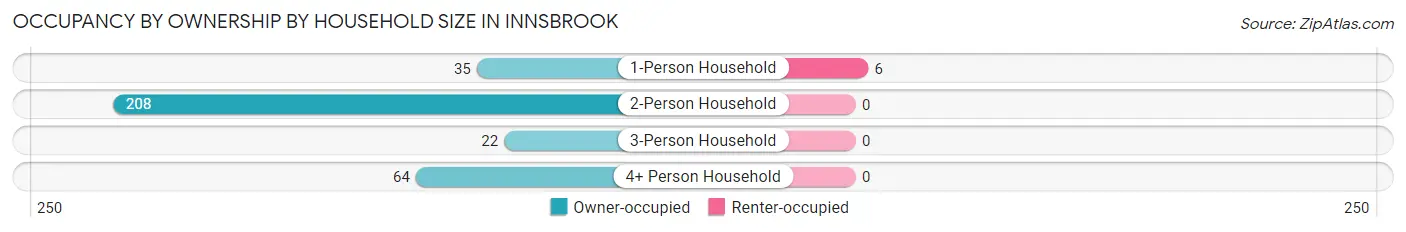
| Household Size | Owner-occupied | Renter-occupied |
| 1-Person Household | 35 (85.4%) | 6 (14.6%) |
| 2-Person Household | 208 (100.0%) | 0 (0.0%) |
| 3-Person Household | 22 (100.0%) | 0 (0.0%) |
| 4+ Person Household | 64 (100.0%) | 0 (0.0%) |
| Total Housing Units | 329 (98.2%) | 6 (1.8%) |
Occupancy by Educational Attainment in Innsbrook
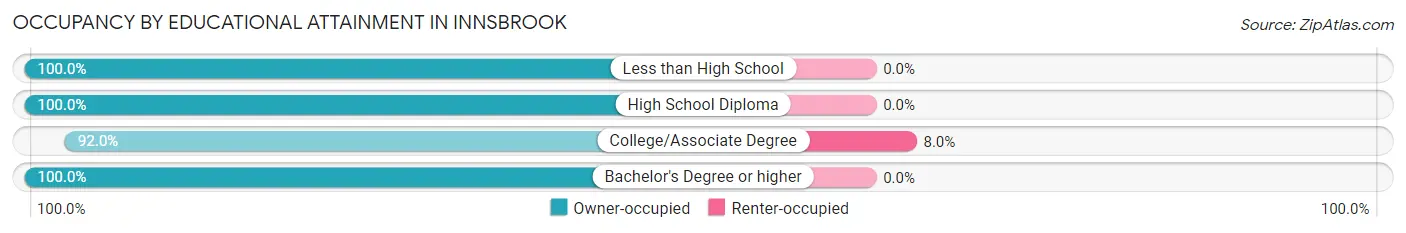
| Household Size | Owner-occupied | Renter-occupied |
| Less than High School | 9 (100.0%) | 0 (0.0%) |
| High School Diploma | 37 (100.0%) | 0 (0.0%) |
| College/Associate Degree | 69 (92.0%) | 6 (8.0%) |
| Bachelor's Degree or higher | 214 (100.0%) | 0 (0.0%) |
Occupancy by Age of Householder in Innsbrook
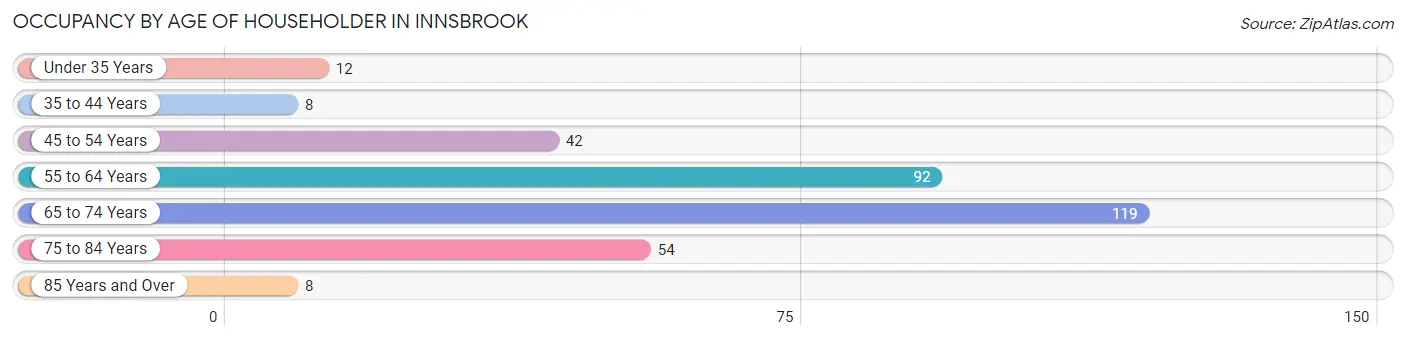
| Age Bracket | # Households | % Households |
| Under 35 Years | 12 | 3.6% |
| 35 to 44 Years | 8 | 2.4% |
| 45 to 54 Years | 42 | 12.5% |
| 55 to 64 Years | 92 | 27.5% |
| 65 to 74 Years | 119 | 35.5% |
| 75 to 84 Years | 54 | 16.1% |
| 85 Years and Over | 8 | 2.4% |
| Total | 335 | 100.0% |
Housing Finances in Innsbrook
Median Income by Occupancy in Innsbrook
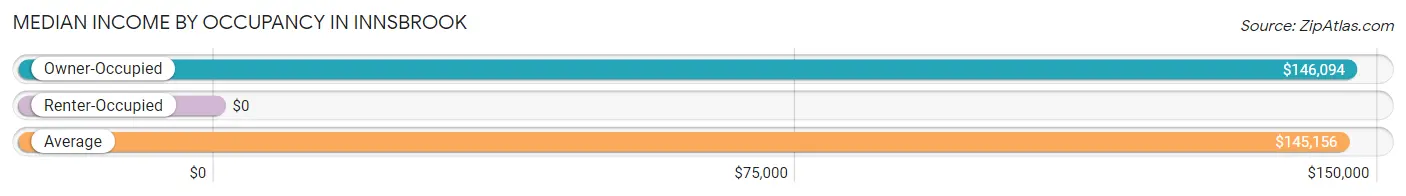
| Occupancy Type | # Households | Median Income |
| Owner-Occupied | 329 (98.2%) | $146,094 |
| Renter-Occupied | 6 (1.8%) | $0 |
| Average | 335 (100.0%) | $145,156 |
Occupancy by Householder Income Bracket in Innsbrook
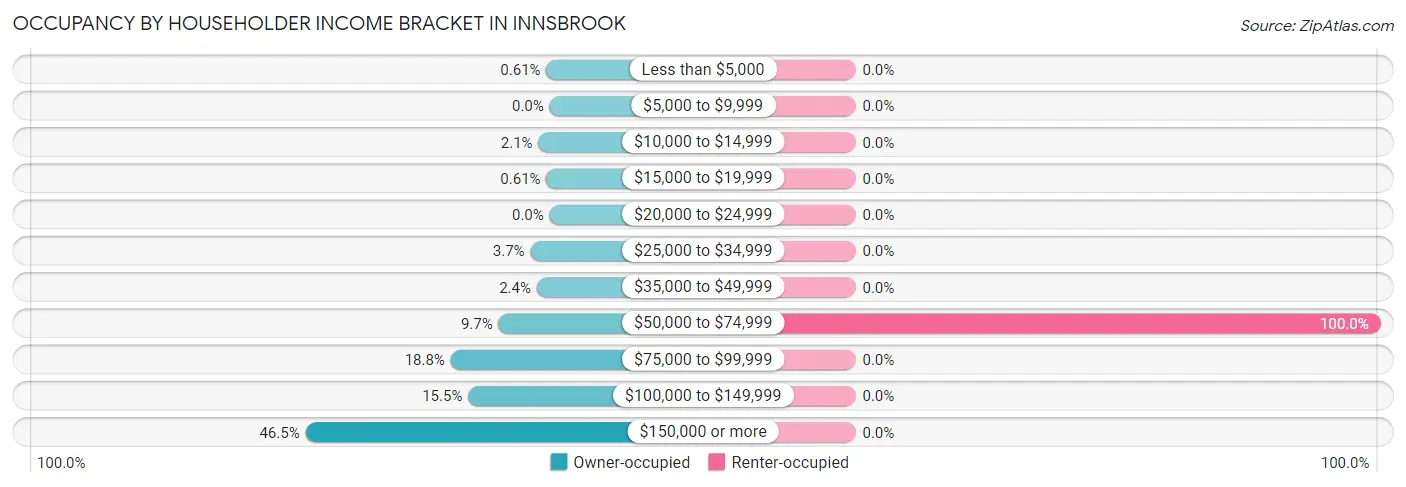
| Income Bracket | Owner-occupied | Renter-occupied |
| Less than $5,000 | 2 (0.6%) | 0 (0.0%) |
| $5,000 to $9,999 | 0 (0.0%) | 0 (0.0%) |
| $10,000 to $14,999 | 7 (2.1%) | 0 (0.0%) |
| $15,000 to $19,999 | 2 (0.6%) | 0 (0.0%) |
| $20,000 to $24,999 | 0 (0.0%) | 0 (0.0%) |
| $25,000 to $34,999 | 12 (3.6%) | 0 (0.0%) |
| $35,000 to $49,999 | 8 (2.4%) | 0 (0.0%) |
| $50,000 to $74,999 | 32 (9.7%) | 6 (100.0%) |
| $75,000 to $99,999 | 62 (18.8%) | 0 (0.0%) |
| $100,000 to $149,999 | 51 (15.5%) | 0 (0.0%) |
| $150,000 or more | 153 (46.5%) | 0 (0.0%) |
| Total | 329 (100.0%) | 6 (100.0%) |
Monthly Housing Cost Tiers in Innsbrook
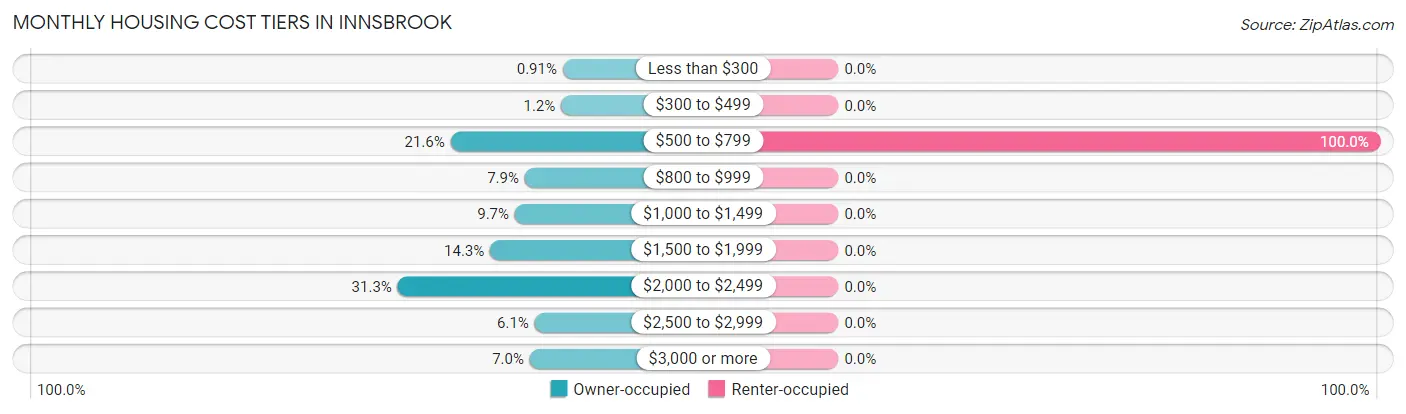
| Monthly Cost | Owner-occupied | Renter-occupied |
| Less than $300 | 3 (0.9%) | 0 (0.0%) |
| $300 to $499 | 4 (1.2%) | 0 (0.0%) |
| $500 to $799 | 71 (21.6%) | 6 (100.0%) |
| $800 to $999 | 26 (7.9%) | 0 (0.0%) |
| $1,000 to $1,499 | 32 (9.7%) | 0 (0.0%) |
| $1,500 to $1,999 | 47 (14.3%) | 0 (0.0%) |
| $2,000 to $2,499 | 103 (31.3%) | 0 (0.0%) |
| $2,500 to $2,999 | 20 (6.1%) | 0 (0.0%) |
| $3,000 or more | 23 (7.0%) | 0 (0.0%) |
| Total | 329 (100.0%) | 6 (100.0%) |
Physical Housing Characteristics in Innsbrook
Housing Structures in Innsbrook
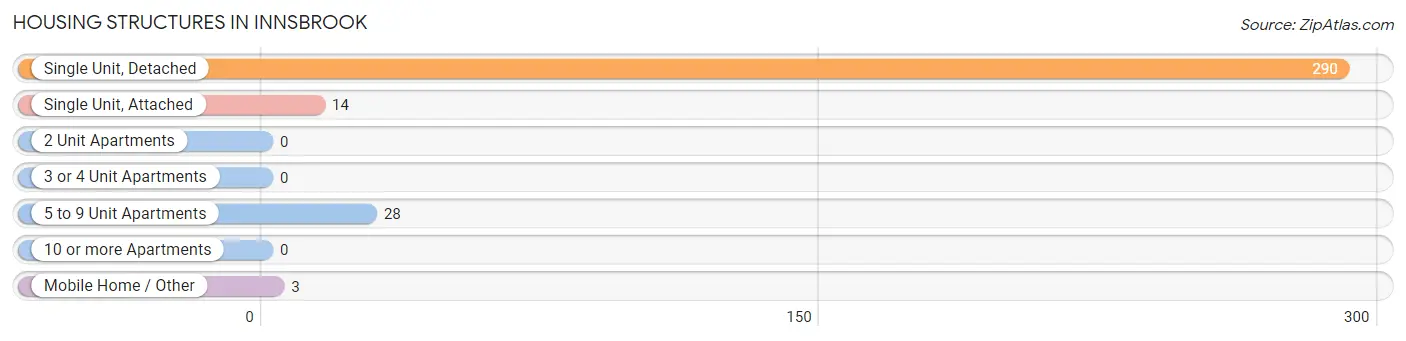
| Structure Type | # Housing Units | % Housing Units |
| Single Unit, Detached | 290 | 86.6% |
| Single Unit, Attached | 14 | 4.2% |
| 2 Unit Apartments | 0 | 0.0% |
| 3 or 4 Unit Apartments | 0 | 0.0% |
| 5 to 9 Unit Apartments | 28 | 8.4% |
| 10 or more Apartments | 0 | 0.0% |
| Mobile Home / Other | 3 | 0.9% |
| Total | 335 | 100.0% |
Housing Structures by Occupancy in Innsbrook
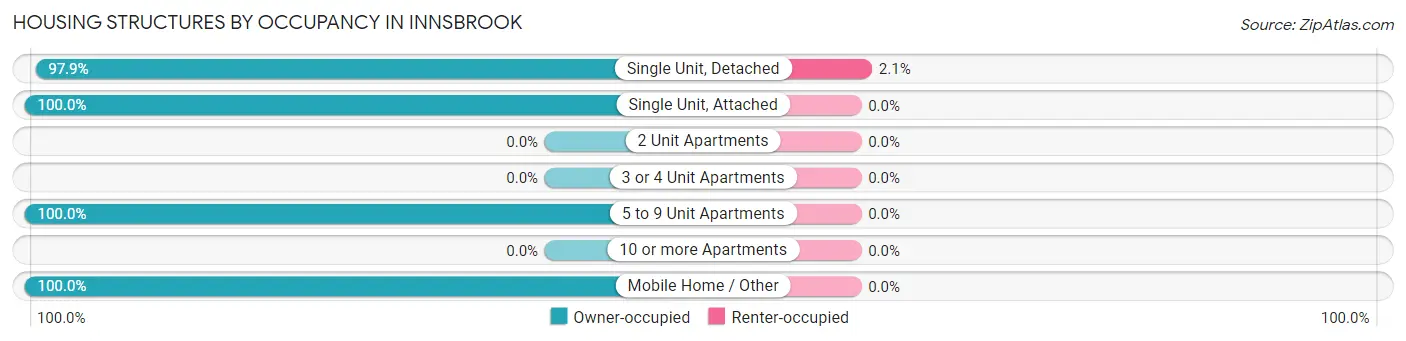
| Structure Type | Owner-occupied | Renter-occupied |
| Single Unit, Detached | 284 (97.9%) | 6 (2.1%) |
| Single Unit, Attached | 14 (100.0%) | 0 (0.0%) |
| 2 Unit Apartments | 0 (0.0%) | 0 (0.0%) |
| 3 or 4 Unit Apartments | 0 (0.0%) | 0 (0.0%) |
| 5 to 9 Unit Apartments | 28 (100.0%) | 0 (0.0%) |
| 10 or more Apartments | 0 (0.0%) | 0 (0.0%) |
| Mobile Home / Other | 3 (100.0%) | 0 (0.0%) |
| Total | 329 (98.2%) | 6 (1.8%) |
Housing Structures by Number of Rooms in Innsbrook
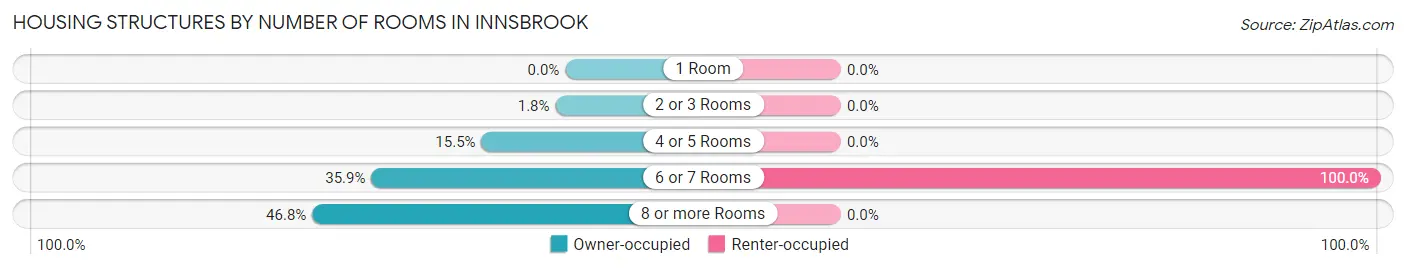
| Number of Rooms | Owner-occupied | Renter-occupied |
| 1 Room | 0 (0.0%) | 0 (0.0%) |
| 2 or 3 Rooms | 6 (1.8%) | 0 (0.0%) |
| 4 or 5 Rooms | 51 (15.5%) | 0 (0.0%) |
| 6 or 7 Rooms | 118 (35.9%) | 6 (100.0%) |
| 8 or more Rooms | 154 (46.8%) | 0 (0.0%) |
| Total | 329 (100.0%) | 6 (100.0%) |
Housing Structure by Heating Type in Innsbrook
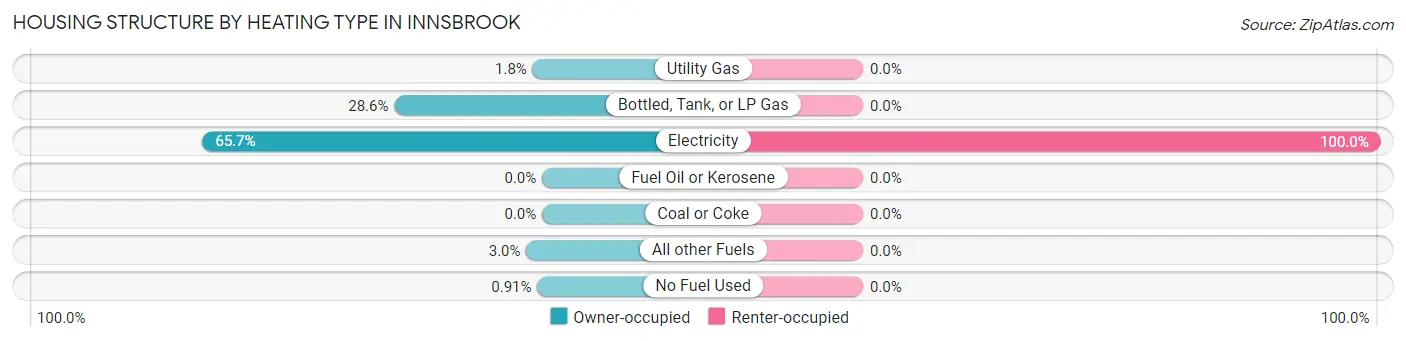
| Heating Type | Owner-occupied | Renter-occupied |
| Utility Gas | 6 (1.8%) | 0 (0.0%) |
| Bottled, Tank, or LP Gas | 94 (28.6%) | 0 (0.0%) |
| Electricity | 216 (65.6%) | 6 (100.0%) |
| Fuel Oil or Kerosene | 0 (0.0%) | 0 (0.0%) |
| Coal or Coke | 0 (0.0%) | 0 (0.0%) |
| All other Fuels | 10 (3.0%) | 0 (0.0%) |
| No Fuel Used | 3 (0.9%) | 0 (0.0%) |
| Total | 329 (100.0%) | 6 (100.0%) |
Household Vehicle Usage in Innsbrook
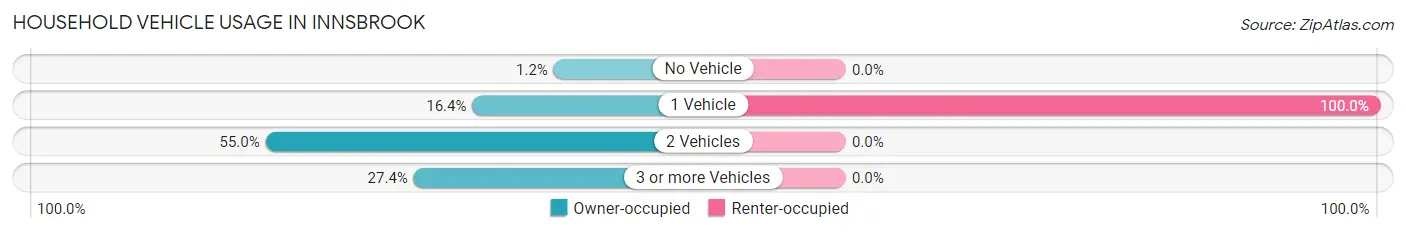
| Vehicles per Household | Owner-occupied | Renter-occupied |
| No Vehicle | 4 (1.2%) | 0 (0.0%) |
| 1 Vehicle | 54 (16.4%) | 6 (100.0%) |
| 2 Vehicles | 181 (55.0%) | 0 (0.0%) |
| 3 or more Vehicles | 90 (27.4%) | 0 (0.0%) |
| Total | 329 (100.0%) | 6 (100.0%) |
Real Estate & Mortgages in Innsbrook
Real Estate and Mortgage Overview in Innsbrook
| Characteristic | Without Mortgage | With Mortgage |
| Housing Units | 115 | 214 |
| Median Property Value | $455,900 | $465,800 |
| Median Household Income | $89,632 | $136 |
| Monthly Housing Costs | $747 | $23 |
| Real Estate Taxes | $3,382 | $0 |
Property Value by Mortgage Status in Innsbrook
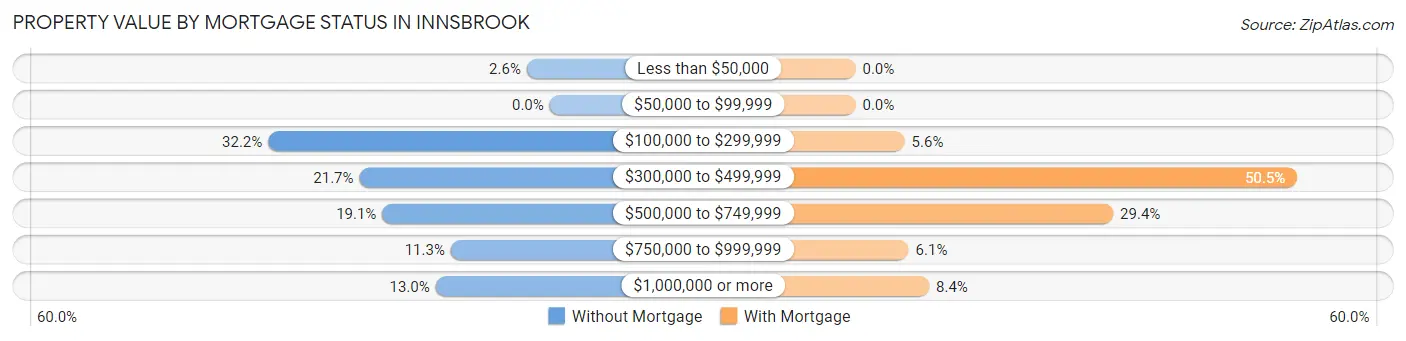
| Property Value | Without Mortgage | With Mortgage |
| Less than $50,000 | 3 (2.6%) | 0 (0.0%) |
| $50,000 to $99,999 | 0 (0.0%) | 0 (0.0%) |
| $100,000 to $299,999 | 37 (32.2%) | 12 (5.6%) |
| $300,000 to $499,999 | 25 (21.7%) | 108 (50.5%) |
| $500,000 to $749,999 | 22 (19.1%) | 63 (29.4%) |
| $750,000 to $999,999 | 13 (11.3%) | 13 (6.1%) |
| $1,000,000 or more | 15 (13.0%) | 18 (8.4%) |
| Total | 115 (100.0%) | 214 (100.0%) |
Household Income by Mortgage Status in Innsbrook
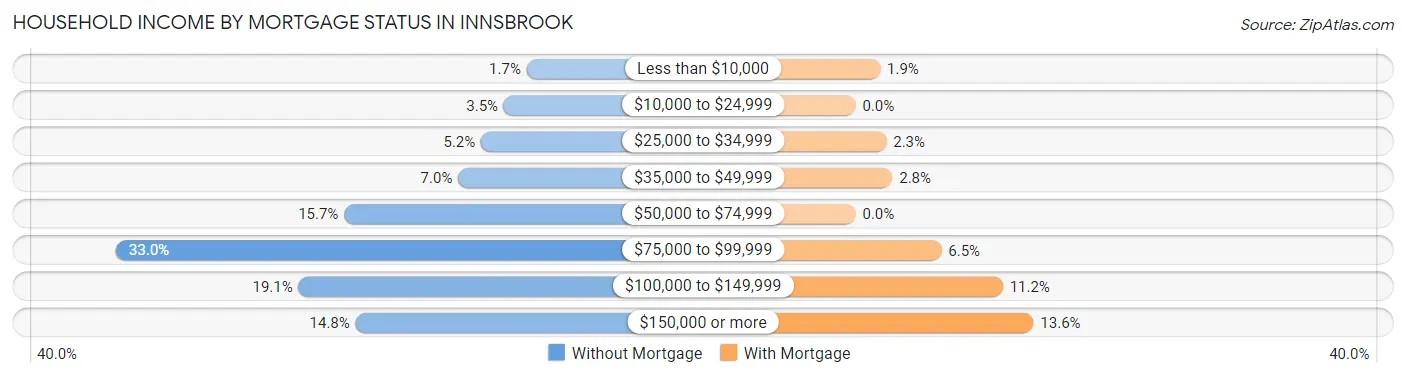
| Household Income | Without Mortgage | With Mortgage |
| Less than $10,000 | 2 (1.7%) | 4 (1.9%) |
| $10,000 to $24,999 | 4 (3.5%) | 0 (0.0%) |
| $25,000 to $34,999 | 6 (5.2%) | 5 (2.3%) |
| $35,000 to $49,999 | 8 (7.0%) | 6 (2.8%) |
| $50,000 to $74,999 | 18 (15.7%) | 0 (0.0%) |
| $75,000 to $99,999 | 38 (33.0%) | 14 (6.5%) |
| $100,000 to $149,999 | 22 (19.1%) | 24 (11.2%) |
| $150,000 or more | 17 (14.8%) | 29 (13.6%) |
| Total | 115 (100.0%) | 214 (100.0%) |
Property Value to Household Income Ratio in Innsbrook
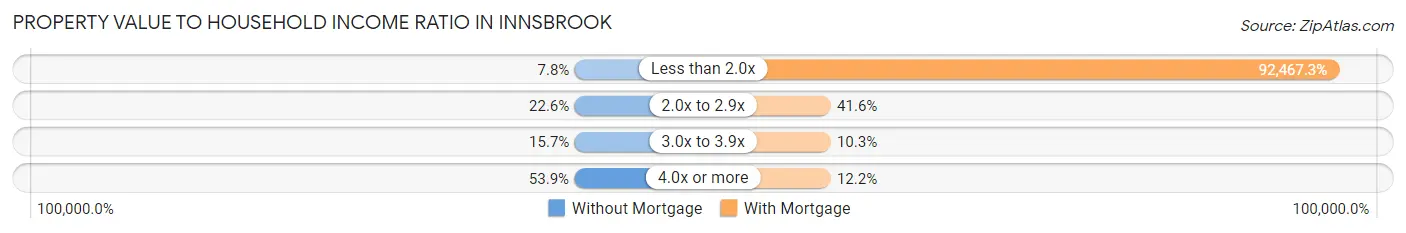
| Value-to-Income Ratio | Without Mortgage | With Mortgage |
| Less than 2.0x | 9 (7.8%) | 197,880 (92,467.3%) |
| 2.0x to 2.9x | 26 (22.6%) | 89 (41.6%) |
| 3.0x to 3.9x | 18 (15.7%) | 22 (10.3%) |
| 4.0x or more | 62 (53.9%) | 26 (12.1%) |
| Total | 115 (100.0%) | 214 (100.0%) |
Real Estate Taxes by Mortgage Status in Innsbrook
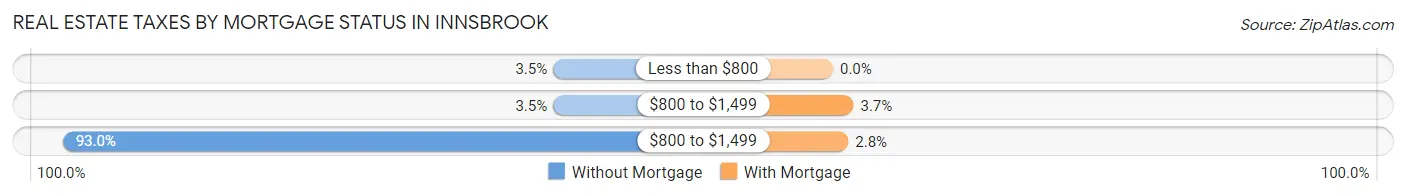
| Property Taxes | Without Mortgage | With Mortgage |
| Less than $800 | 4 (3.5%) | 0 (0.0%) |
| $800 to $1,499 | 4 (3.5%) | 8 (3.7%) |
| $800 to $1,499 | 107 (93.0%) | 6 (2.8%) |
| Total | 115 (100.0%) | 214 (100.0%) |
Health & Disability in Innsbrook
Health Insurance Coverage by Age in Innsbrook
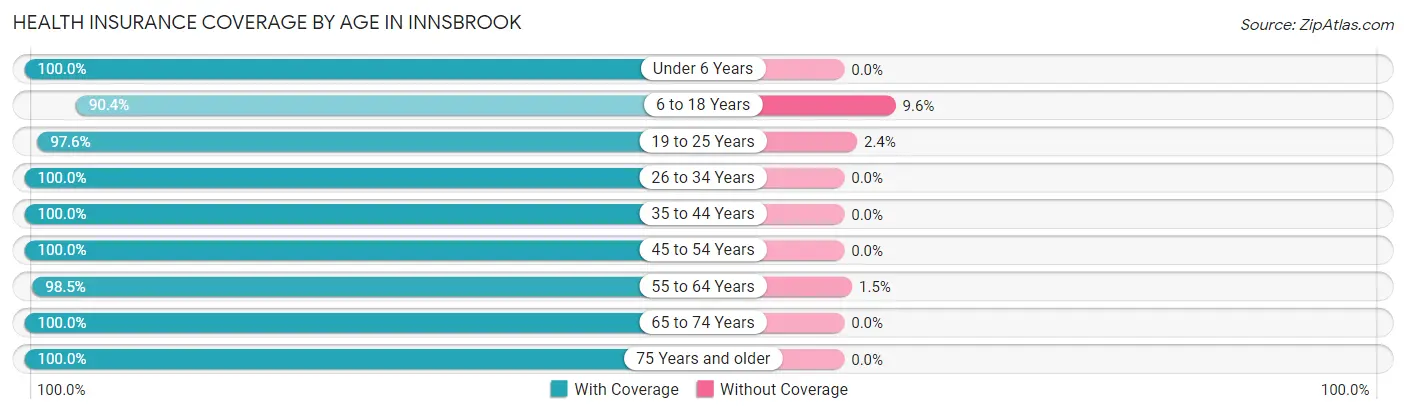
| Age Bracket | With Coverage | Without Coverage |
| Under 6 Years | 8 (100.0%) | 0 (0.0%) |
| 6 to 18 Years | 85 (90.4%) | 9 (9.6%) |
| 19 to 25 Years | 123 (97.6%) | 3 (2.4%) |
| 26 to 34 Years | 32 (100.0%) | 0 (0.0%) |
| 35 to 44 Years | 42 (100.0%) | 0 (0.0%) |
| 45 to 54 Years | 129 (100.0%) | 0 (0.0%) |
| 55 to 64 Years | 135 (98.5%) | 2 (1.5%) |
| 65 to 74 Years | 214 (100.0%) | 0 (0.0%) |
| 75 Years and older | 95 (100.0%) | 0 (0.0%) |
| Total | 863 (98.4%) | 14 (1.6%) |
Health Insurance Coverage by Citizenship Status in Innsbrook
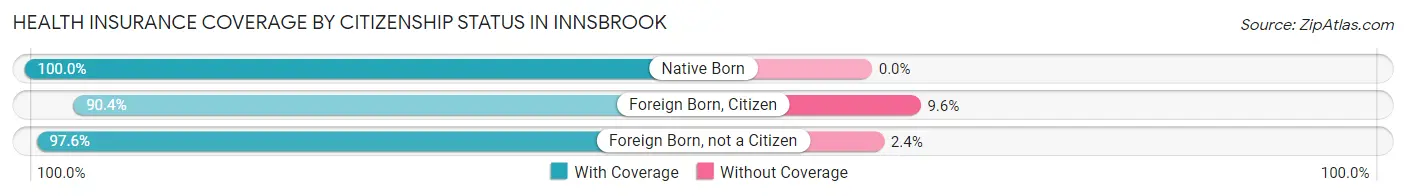
| Citizenship Status | With Coverage | Without Coverage |
| Native Born | 8 (100.0%) | 0 (0.0%) |
| Foreign Born, Citizen | 85 (90.4%) | 9 (9.6%) |
| Foreign Born, not a Citizen | 123 (97.6%) | 3 (2.4%) |
Health Insurance Coverage by Household Income in Innsbrook
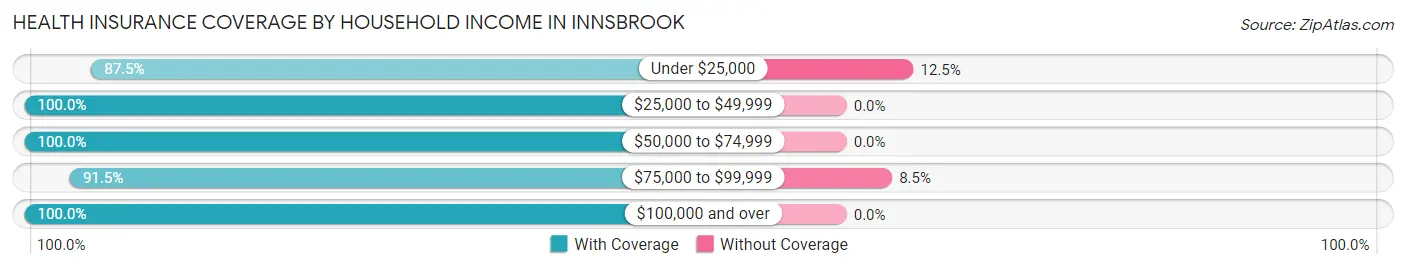
| Household Income | With Coverage | Without Coverage |
| Under $25,000 | 14 (87.5%) | 2 (12.5%) |
| $25,000 to $49,999 | 30 (100.0%) | 0 (0.0%) |
| $50,000 to $74,999 | 59 (100.0%) | 0 (0.0%) |
| $75,000 to $99,999 | 129 (91.5%) | 12 (8.5%) |
| $100,000 and over | 631 (100.0%) | 0 (0.0%) |
Public vs Private Health Insurance Coverage by Age in Innsbrook
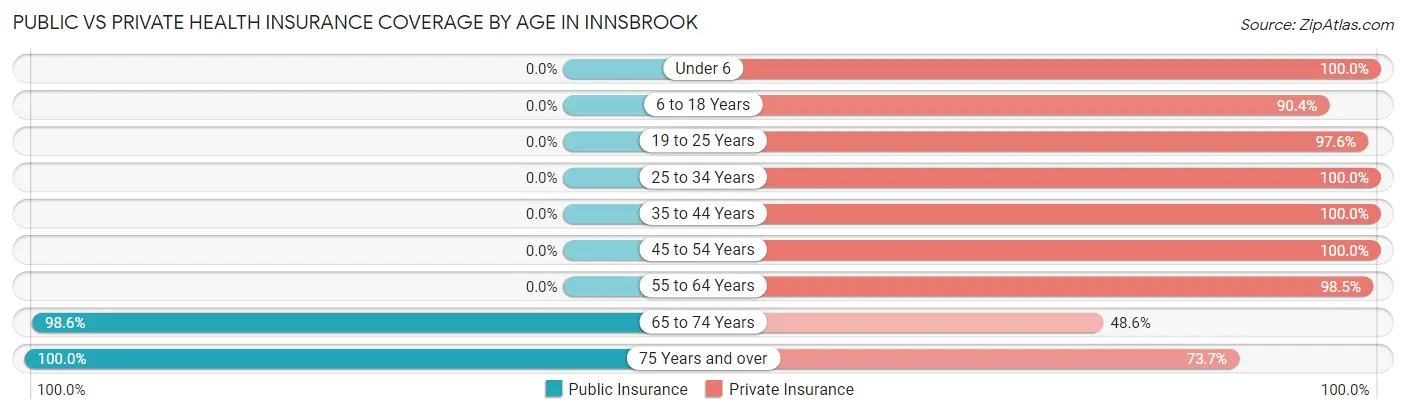
| Age Bracket | Public Insurance | Private Insurance |
| Under 6 | 0 (0.0%) | 8 (100.0%) |
| 6 to 18 Years | 0 (0.0%) | 85 (90.4%) |
| 19 to 25 Years | 0 (0.0%) | 123 (97.6%) |
| 25 to 34 Years | 0 (0.0%) | 32 (100.0%) |
| 35 to 44 Years | 0 (0.0%) | 42 (100.0%) |
| 45 to 54 Years | 0 (0.0%) | 129 (100.0%) |
| 55 to 64 Years | 0 (0.0%) | 135 (98.5%) |
| 65 to 74 Years | 211 (98.6%) | 104 (48.6%) |
| 75 Years and over | 95 (100.0%) | 70 (73.7%) |
| Total | 306 (34.9%) | 728 (83.0%) |
Disability Status by Sex by Age in Innsbrook
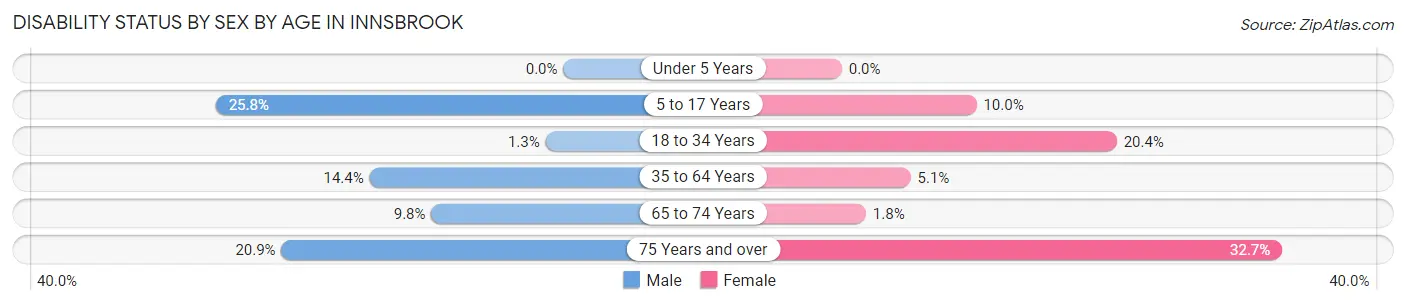
| Age Bracket | Male | Female |
| Under 5 Years | 0 (0.0%) | 0 (0.0%) |
| 5 to 17 Years | 8 (25.8%) | 2 (10.0%) |
| 18 to 34 Years | 2 (1.3%) | 10 (20.4%) |
| 35 to 64 Years | 19 (14.4%) | 9 (5.1%) |
| 65 to 74 Years | 10 (9.8%) | 2 (1.8%) |
| 75 Years and over | 9 (20.9%) | 17 (32.7%) |
Disability Class by Sex by Age in Innsbrook
Disability Class: Hearing Difficulty
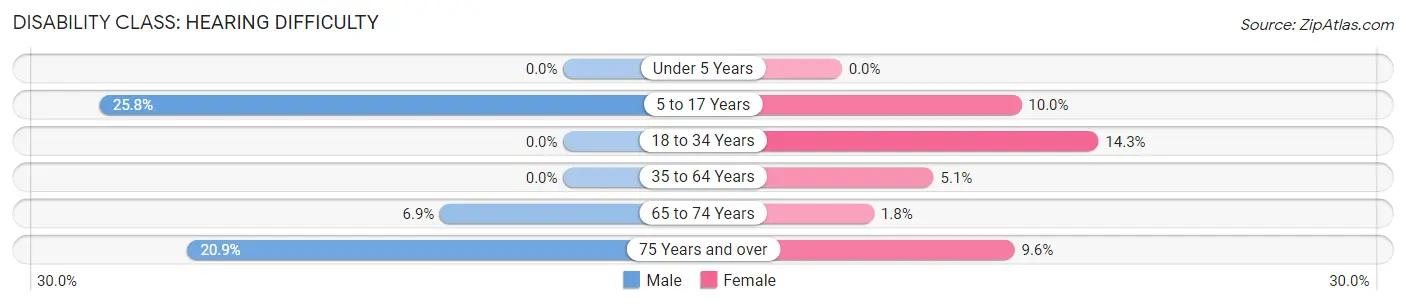
| Age Bracket | Male | Female |
| Under 5 Years | 0 (0.0%) | 0 (0.0%) |
| 5 to 17 Years | 8 (25.8%) | 2 (10.0%) |
| 18 to 34 Years | 0 (0.0%) | 7 (14.3%) |
| 35 to 64 Years | 0 (0.0%) | 9 (5.1%) |
| 65 to 74 Years | 7 (6.9%) | 2 (1.8%) |
| 75 Years and over | 9 (20.9%) | 5 (9.6%) |
Disability Class: Vision Difficulty
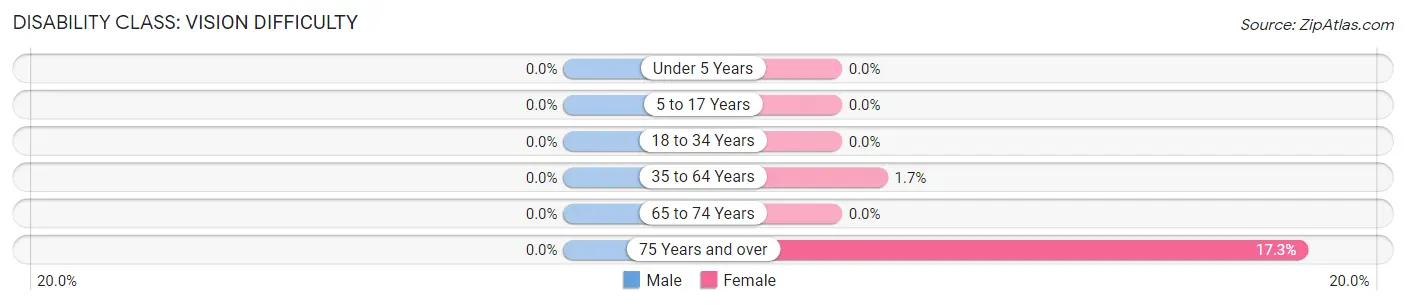
| Age Bracket | Male | Female |
| Under 5 Years | 0 (0.0%) | 0 (0.0%) |
| 5 to 17 Years | 0 (0.0%) | 0 (0.0%) |
| 18 to 34 Years | 0 (0.0%) | 0 (0.0%) |
| 35 to 64 Years | 0 (0.0%) | 3 (1.7%) |
| 65 to 74 Years | 0 (0.0%) | 0 (0.0%) |
| 75 Years and over | 0 (0.0%) | 9 (17.3%) |
Disability Class: Cognitive Difficulty
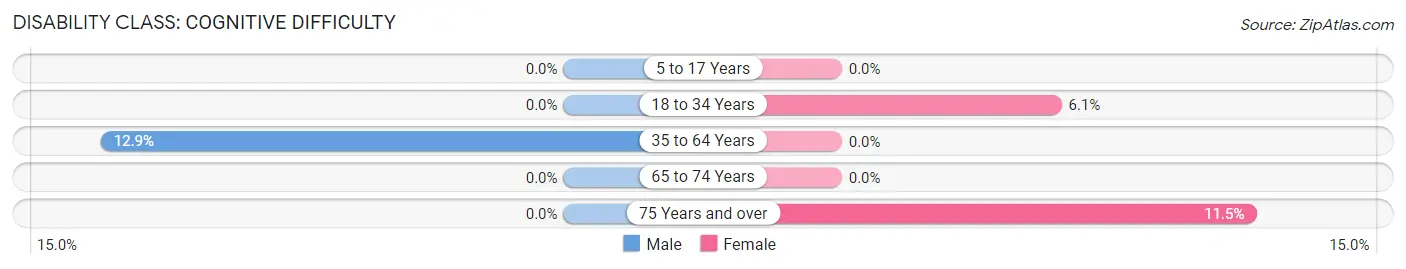
| Age Bracket | Male | Female |
| 5 to 17 Years | 0 (0.0%) | 0 (0.0%) |
| 18 to 34 Years | 0 (0.0%) | 3 (6.1%) |
| 35 to 64 Years | 17 (12.9%) | 0 (0.0%) |
| 65 to 74 Years | 0 (0.0%) | 0 (0.0%) |
| 75 Years and over | 0 (0.0%) | 6 (11.5%) |
Disability Class: Ambulatory Difficulty
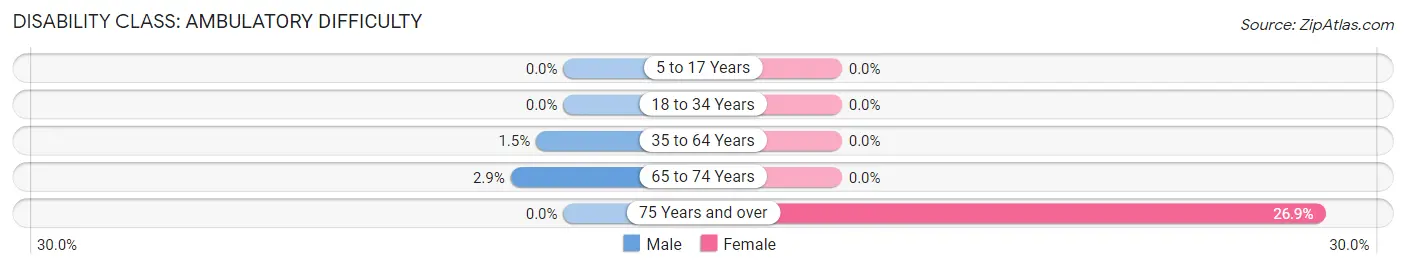
| Age Bracket | Male | Female |
| 5 to 17 Years | 0 (0.0%) | 0 (0.0%) |
| 18 to 34 Years | 0 (0.0%) | 0 (0.0%) |
| 35 to 64 Years | 2 (1.5%) | 0 (0.0%) |
| 65 to 74 Years | 3 (2.9%) | 0 (0.0%) |
| 75 Years and over | 0 (0.0%) | 14 (26.9%) |
Disability Class: Self-Care Difficulty
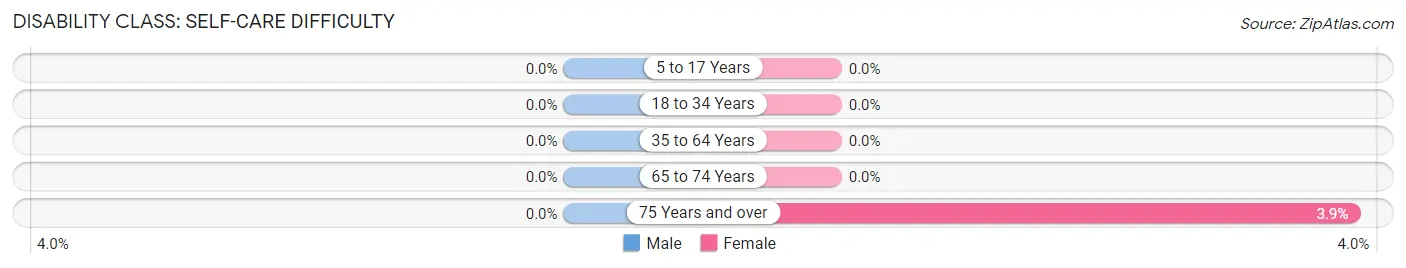
| Age Bracket | Male | Female |
| 5 to 17 Years | 0 (0.0%) | 0 (0.0%) |
| 18 to 34 Years | 0 (0.0%) | 0 (0.0%) |
| 35 to 64 Years | 0 (0.0%) | 0 (0.0%) |
| 65 to 74 Years | 0 (0.0%) | 0 (0.0%) |
| 75 Years and over | 0 (0.0%) | 2 (3.8%) |
Technology Access in Innsbrook
Computing Device Access in Innsbrook
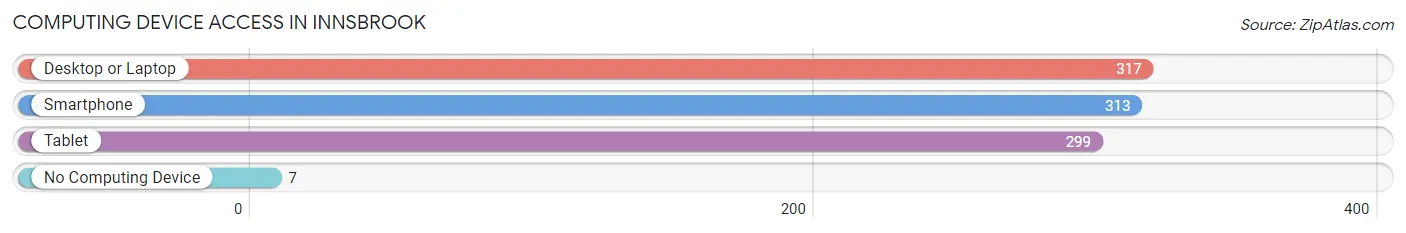
| Device Type | # Households | % Households |
| Desktop or Laptop | 317 | 94.6% |
| Smartphone | 313 | 93.4% |
| Tablet | 299 | 89.2% |
| No Computing Device | 7 | 2.1% |
| Total | 335 | 100.0% |
Internet Access in Innsbrook
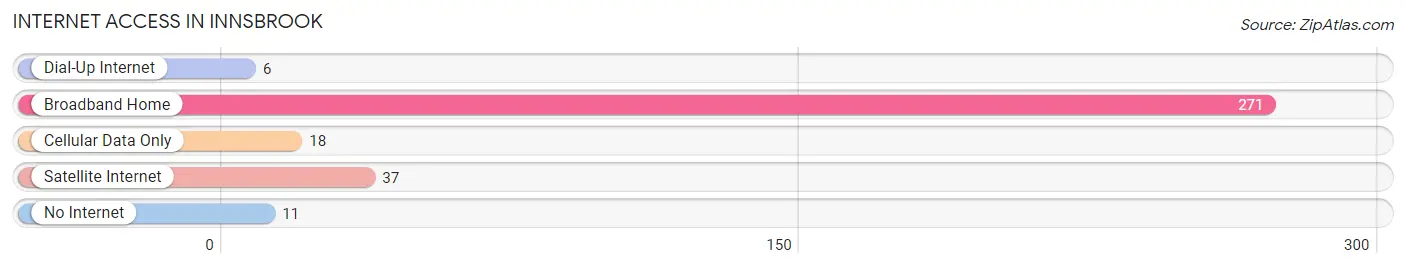
| Internet Type | # Households | % Households |
| Dial-Up Internet | 6 | 1.8% |
| Broadband Home | 271 | 80.9% |
| Cellular Data Only | 18 | 5.4% |
| Satellite Internet | 37 | 11.0% |
| No Internet | 11 | 3.3% |
| Total | 335 | 100.0% |
Innsbrook Summary
Innsbrook, Missouri is a small unincorporated community located in Warren County, Missouri. It is situated approximately 25 miles west of St. Louis and is part of the St. Louis metropolitan area. The population of Innsbrook was estimated to be 1,845 in 2019.
History
Innsbrook was founded in 1837 by German immigrants who were looking for a place to settle and start a new life. The town was named after the nearby Innsbrook Creek, which was named after the German word for “inn”. The town was originally a farming community, but it soon became a popular destination for vacationers and tourists. Innsbrook was known for its beautiful scenery and its many recreational activities, such as fishing, hunting, and camping.
In the late 19th century, Innsbrook began to experience a period of growth and development. The town was incorporated in 1891 and the first post office was established in 1892. Innsbrook was also home to a number of businesses, including a general store, a blacksmith shop, and a hotel.
In the early 20th century, Innsbrook experienced a period of decline. The town’s population decreased and many of the businesses closed. However, in the late 20th century, Innsbrook began to experience a period of revitalization. The town was designated as a historic district in 1989 and many of the historic buildings were restored.
Geography
Innsbrook is located in Warren County, Missouri. It is situated in the western part of the county, approximately 25 miles west of St. Louis. The town is situated on the banks of the Innsbrook Creek, which is a tributary of the Missouri River. The town is surrounded by rolling hills and wooded areas.
The climate in Innsbrook is humid continental, with hot summers and cold winters. The average annual temperature is around 54°F and the average annual precipitation is around 40 inches.
Economy
Innsbrook’s economy is largely based on tourism and recreation. The town is home to a number of recreational activities, such as fishing, hunting, and camping. Innsbrook is also home to a number of businesses, including restaurants, shops, and lodging.
Innsbrook is also home to a number of manufacturing and industrial businesses. The town is home to a number of companies that produce a variety of products, such as furniture, clothing, and automotive parts.
Demographics
Innsbrook’s population was estimated to be 1,845 in 2019. The town is predominantly white, with approximately 95% of the population identifying as white. The median household income in Innsbrook is around $50,000 and the median home value is around $150,000. The town has a low unemployment rate and a high rate of homeownership.
Common Questions
What is Per Capita Income in Innsbrook?
Per Capita income in Innsbrook is $64,465.
What is the Median Family Income in Innsbrook?
Median Family Income in Innsbrook is $161,875.
What is the Median Household income in Innsbrook?
Median Household Income in Innsbrook is $145,156.
What is Inequality or Gini Index in Innsbrook?
Inequality or Gini Index in Innsbrook is 0.38.
What is the Total Population of Innsbrook?
Total Population of Innsbrook is 877.
What is the Total Male Population of Innsbrook?
Total Male Population of Innsbrook is 460.
What is the Total Female Population of Innsbrook?
Total Female Population of Innsbrook is 417.
What is the Ratio of Males per 100 Females in Innsbrook?
There are 110.31 Males per 100 Females in Innsbrook.
What is the Ratio of Females per 100 Males in Innsbrook?
There are 90.65 Females per 100 Males in Innsbrook.
What is the Median Population Age in Innsbrook?
Median Population Age in Innsbrook is 55.1 Years.
What is the Average Family Size in Innsbrook
Average Family Size in Innsbrook is 2.8 People.
What is the Average Household Size in Innsbrook
Average Household Size in Innsbrook is 2.6 People.
How Large is the Labor Force in Innsbrook?
There are 298 People in the Labor Forcein in Innsbrook.
What is the Percentage of People in the Labor Force in Innsbrook?
36.4% of People are in the Labor Force in Innsbrook.
What is the Unemployment Rate in Innsbrook?
Unemployment Rate in Innsbrook is 9.4%.