Olivette, MO Map & Demographics
Olivette Map
Olivette Overview
$57,308
PER CAPITA INCOME
$117,692
AVG FAMILY INCOME
$102,630
AVG HOUSEHOLD INCOME
16.7%
WAGE / INCOME GAP [ % ]
83.3¢/ $1
WAGE / INCOME GAP [ $ ]
0.47
INEQUALITY / GINI INDEX
8,431
TOTAL POPULATION
4,028
MALE POPULATION
4,403
FEMALE POPULATION
91.48
MALES / 100 FEMALES
109.31
FEMALES / 100 MALES
41.1
MEDIAN AGE
3.1
AVG FAMILY SIZE
2.6
AVG HOUSEHOLD SIZE
4,412
LABOR FORCE [ PEOPLE ]
68.4%
PERCENT IN LABOR FORCE
5.1%
UNEMPLOYMENT RATE
Income in Olivette
Income Overview in Olivette
Per Capita Income in Olivette is $57,308, while median incomes of families and households are $117,692 and $102,630 respectively.
| Characteristic | Number | Measure |
| Per Capita Income | 8,431 | $57,308 |
| Median Family Income | 2,372 | $117,692 |
| Mean Family Income | 2,372 | $170,073 |
| Median Household Income | 3,292 | $102,630 |
| Mean Household Income | 3,292 | $145,596 |
| Income Deficit | 2,372 | $0 |
| Wage / Income Gap (%) | 8,431 | 16.74% |
| Wage / Income Gap ($) | 8,431 | 83.26¢ per $1 |
| Gini / Inequality Index | 8,431 | 0.47 |
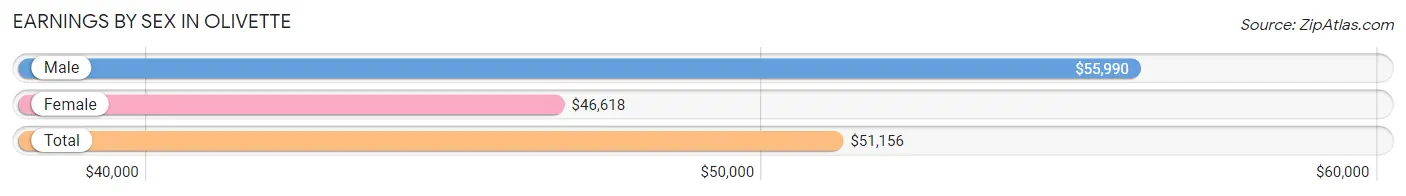
Earnings by Sex in Olivette
Average Earnings in Olivette are $51,156, $55,990 for men and $46,618 for women, a difference of 16.7%.
| Sex | Number | Average Earnings |
| Male | 2,201 (46.4%) | $55,990 |
| Female | 2,546 (53.6%) | $46,618 |
| Total | 4,747 (100.0%) | $51,156 |
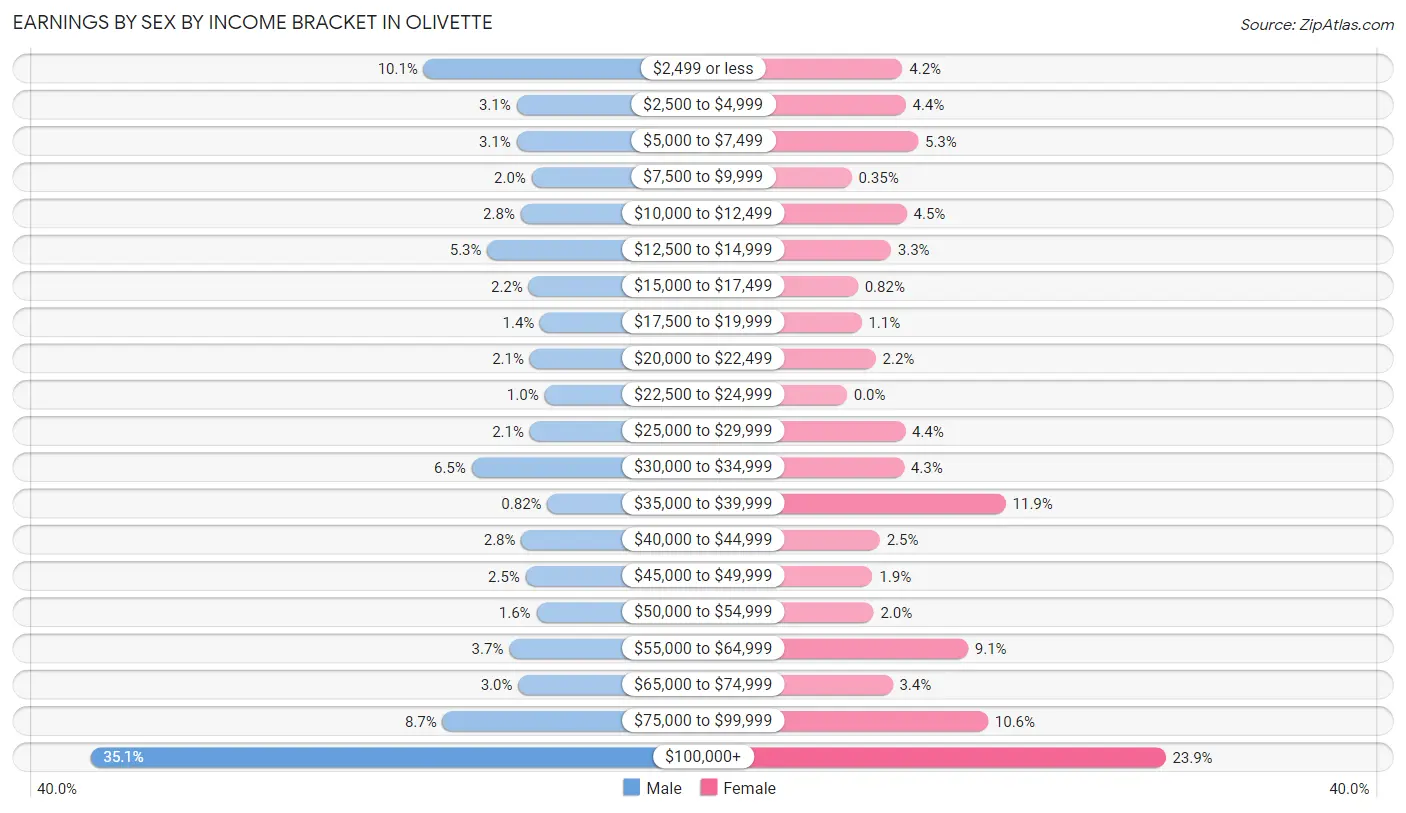
Earnings by Sex by Income Bracket in Olivette
The most common earnings brackets in Olivette are $100,000+ for men (772 | 35.1%) and $100,000+ for women (608 | 23.9%).
| Income | Male | Female |
| $2,499 or less | 222 (10.1%) | 106 (4.2%) |
| $2,500 to $4,999 | 69 (3.1%) | 112 (4.4%) |
| $5,000 to $7,499 | 69 (3.1%) | 136 (5.3%) |
| $7,500 to $9,999 | 44 (2.0%) | 9 (0.4%) |
| $10,000 to $12,499 | 62 (2.8%) | 114 (4.5%) |
| $12,500 to $14,999 | 117 (5.3%) | 84 (3.3%) |
| $15,000 to $17,499 | 49 (2.2%) | 21 (0.8%) |
| $17,500 to $19,999 | 30 (1.4%) | 28 (1.1%) |
| $20,000 to $22,499 | 47 (2.1%) | 55 (2.2%) |
| $22,500 to $24,999 | 23 (1.0%) | 0 (0.0%) |
| $25,000 to $29,999 | 47 (2.1%) | 111 (4.4%) |
| $30,000 to $34,999 | 143 (6.5%) | 109 (4.3%) |
| $35,000 to $39,999 | 18 (0.8%) | 303 (11.9%) |
| $40,000 to $44,999 | 61 (2.8%) | 63 (2.5%) |
| $45,000 to $49,999 | 54 (2.5%) | 49 (1.9%) |
| $50,000 to $54,999 | 36 (1.6%) | 51 (2.0%) |
| $55,000 to $64,999 | 81 (3.7%) | 231 (9.1%) |
| $65,000 to $74,999 | 66 (3.0%) | 87 (3.4%) |
| $75,000 to $99,999 | 191 (8.7%) | 269 (10.6%) |
| $100,000+ | 772 (35.1%) | 608 (23.9%) |
| Total | 2,201 (100.0%) | 2,546 (100.0%) |
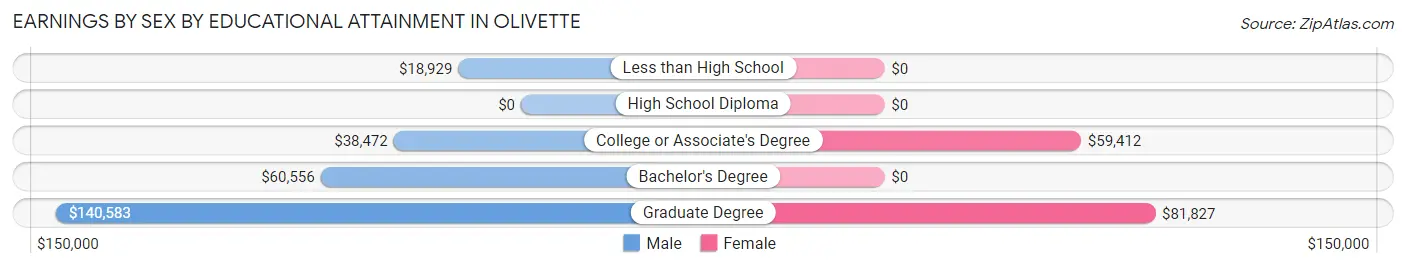
Earnings by Sex by Educational Attainment in Olivette
Average earnings in Olivette are $69,853 for men and $58,196 for women, a difference of 16.7%. Men with an educational attainment of graduate degree enjoy the highest average annual earnings of $140,583, while those with less than high school education earn the least with $18,929. Women with an educational attainment of graduate degree earn the most with the average annual earnings of $81,827, while those with college or associate's degree education have the smallest earnings of $59,412.
| Educational Attainment | Male Income | Female Income |
| Less than High School | $18,929 | $0 |
| High School Diploma | - | - |
| College or Associate's Degree | $38,472 | $59,412 |
| Bachelor's Degree | $60,556 | $0 |
| Graduate Degree | $140,583 | $81,827 |
| Total | $69,853 | $58,196 |
Family Income in Olivette
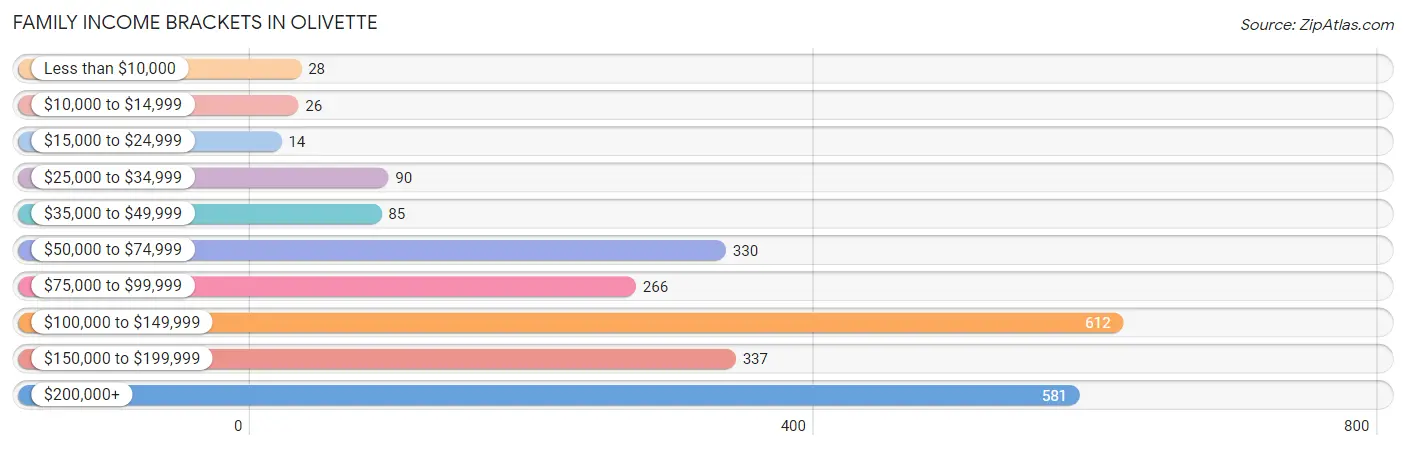
Family Income Brackets in Olivette
According to the Olivette family income data, there are 612 families falling into the $100,000 to $149,999 income range, which is the most common income bracket and makes up 25.8% of all families. Conversely, the $15,000 to $24,999 income bracket is the least frequent group with only 14 families (0.6%) belonging to this category.
| Income Bracket | # Families | % Families |
| Less than $10,000 | 28 | 1.2% |
| $10,000 to $14,999 | 26 | 1.1% |
| $15,000 to $24,999 | 14 | 0.6% |
| $25,000 to $34,999 | 90 | 3.8% |
| $35,000 to $49,999 | 85 | 3.6% |
| $50,000 to $74,999 | 330 | 13.9% |
| $75,000 to $99,999 | 266 | 11.2% |
| $100,000 to $149,999 | 612 | 25.8% |
| $150,000 to $199,999 | 337 | 14.2% |
| $200,000+ | 581 | 24.5% |
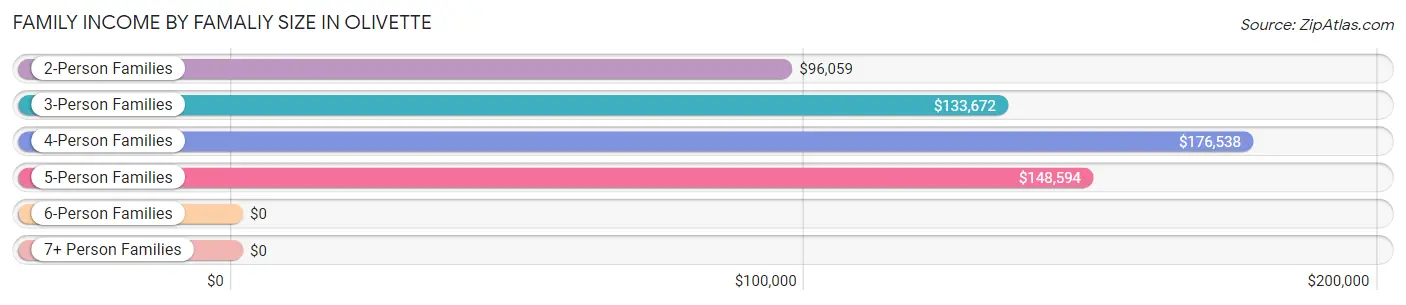
Family Income by Famaliy Size in Olivette
4-person families (540 | 22.8%) account for the highest median family income in Olivette with $176,538 per family, while 2-person families (1,060 | 44.7%) have the highest median income of $48,030 per family member.
| Income Bracket | # Families | Median Income |
| 2-Person Families | 1,060 (44.7%) | $96,059 |
| 3-Person Families | 553 (23.3%) | $133,672 |
| 4-Person Families | 540 (22.8%) | $176,538 |
| 5-Person Families | 191 (8.1%) | $148,594 |
| 6-Person Families | 10 (0.4%) | $0 |
| 7+ Person Families | 18 (0.8%) | $0 |
| Total | 2,372 (100.0%) | $117,692 |
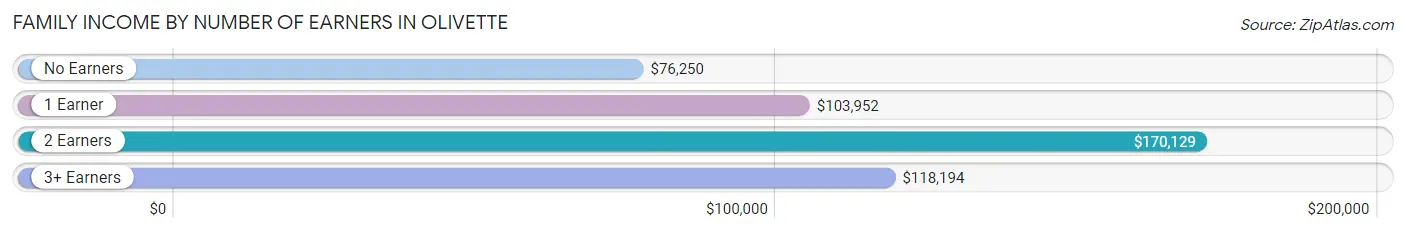
Family Income by Number of Earners in Olivette
The median family income in Olivette is $117,692, with families comprising 2 earners (1,031) having the highest median family income of $170,129, while families with no earners (166) have the lowest median family income of $76,250, accounting for 43.5% and 7.0% of families, respectively.
| Number of Earners | # Families | Median Income |
| No Earners | 166 (7.0%) | $76,250 |
| 1 Earner | 971 (40.9%) | $103,952 |
| 2 Earners | 1,031 (43.5%) | $170,129 |
| 3+ Earners | 204 (8.6%) | $118,194 |
| Total | 2,372 (100.0%) | $117,692 |
Household Income in Olivette
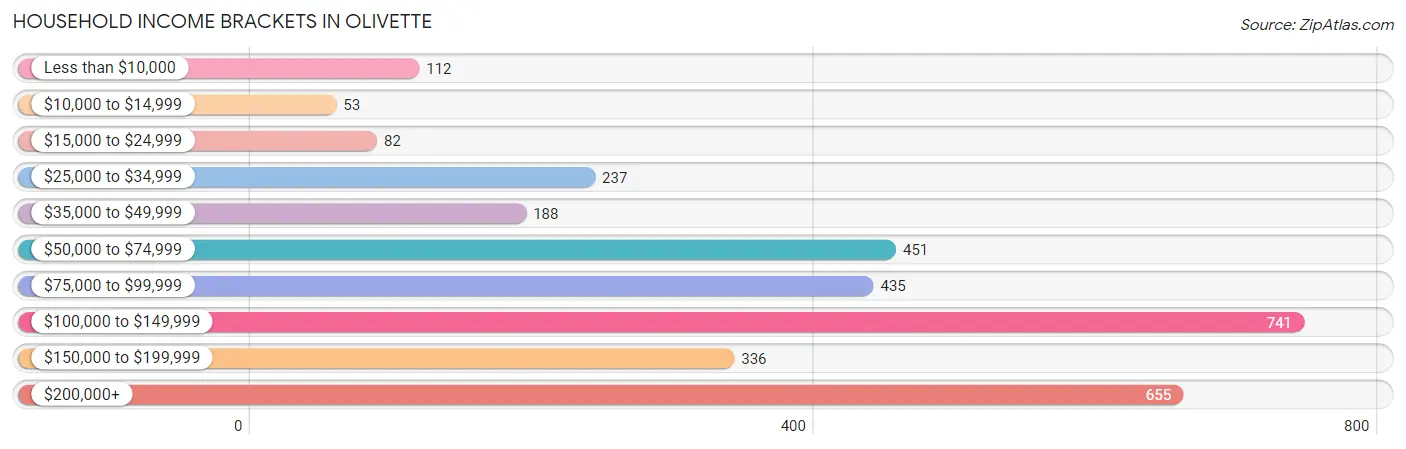
Household Income Brackets in Olivette
With 741 households falling in the category, the $100,000 to $149,999 income range is the most frequent in Olivette, accounting for 22.5% of all households. In contrast, only 53 households (1.6%) fall into the $10,000 to $14,999 income bracket, making it the least populous group.
| Income Bracket | # Households | % Households |
| Less than $10,000 | 112 | 3.4% |
| $10,000 to $14,999 | 53 | 1.6% |
| $15,000 to $24,999 | 82 | 2.5% |
| $25,000 to $34,999 | 237 | 7.2% |
| $35,000 to $49,999 | 188 | 5.7% |
| $50,000 to $74,999 | 451 | 13.7% |
| $75,000 to $99,999 | 435 | 13.2% |
| $100,000 to $149,999 | 741 | 22.5% |
| $150,000 to $199,999 | 336 | 10.2% |
| $200,000+ | 655 | 19.9% |
Household Income by Householder Age in Olivette
The median household income in Olivette is $102,630, with the highest median household income of $107,422 found in the 45 to 64 years age bracket for the primary householder. A total of 1,293 households (39.3%) fall into this category. Meanwhile, the 15 to 24 years age bracket for the primary householder has the lowest median household income of $0, with 82 households (2.5%) in this group.
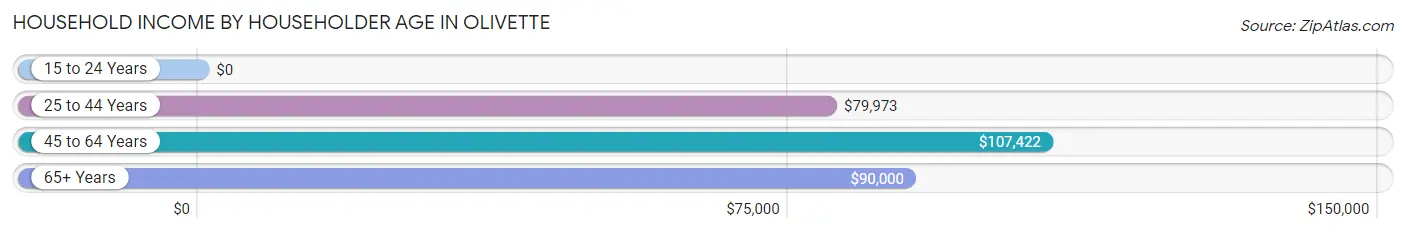
| Income Bracket | # Households | Median Income |
| 15 to 24 Years | 82 (2.5%) | $0 |
| 25 to 44 Years | 1,031 (31.3%) | $79,973 |
| 45 to 64 Years | 1,293 (39.3%) | $107,422 |
| 65+ Years | 886 (26.9%) | $90,000 |
| Total | 3,292 (100.0%) | $102,630 |
Poverty in Olivette
Income Below Poverty by Sex and Age in Olivette
With 3.6% poverty level for males and 5.2% for females among the residents of Olivette, 18 to 24 year old males and 75 year old and over females are the most vulnerable to poverty, with 48 males (15.8%) and 37 females (11.9%) in their respective age groups living below the poverty level.
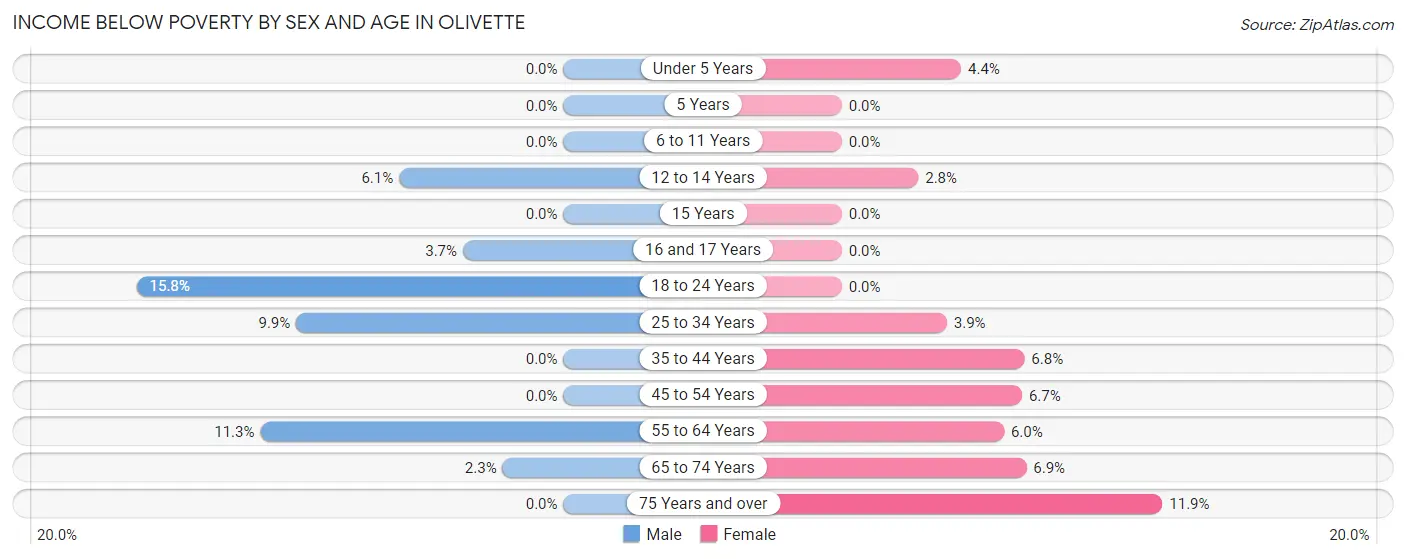
| Age Bracket | Male | Female |
| Under 5 Years | 0 (0.0%) | 9 (4.4%) |
| 5 Years | 0 (0.0%) | 0 (0.0%) |
| 6 to 11 Years | 0 (0.0%) | 0 (0.0%) |
| 12 to 14 Years | 13 (6.1%) | 6 (2.8%) |
| 15 Years | 0 (0.0%) | 0 (0.0%) |
| 16 and 17 Years | 6 (3.7%) | 0 (0.0%) |
| 18 to 24 Years | 48 (15.8%) | 0 (0.0%) |
| 25 to 34 Years | 24 (9.9%) | 18 (3.9%) |
| 35 to 44 Years | 0 (0.0%) | 50 (6.8%) |
| 45 to 54 Years | 0 (0.0%) | 46 (6.7%) |
| 55 to 64 Years | 44 (11.3%) | 29 (6.0%) |
| 65 to 74 Years | 10 (2.3%) | 35 (6.9%) |
| 75 Years and over | 0 (0.0%) | 37 (11.9%) |
| Total | 145 (3.6%) | 230 (5.2%) |
Income Above Poverty by Sex and Age in Olivette
According to the poverty statistics in Olivette, males aged under 5 years and females aged 5 years are the age groups that are most secure financially, with 100.0% of males and 100.0% of females in these age groups living above the poverty line.
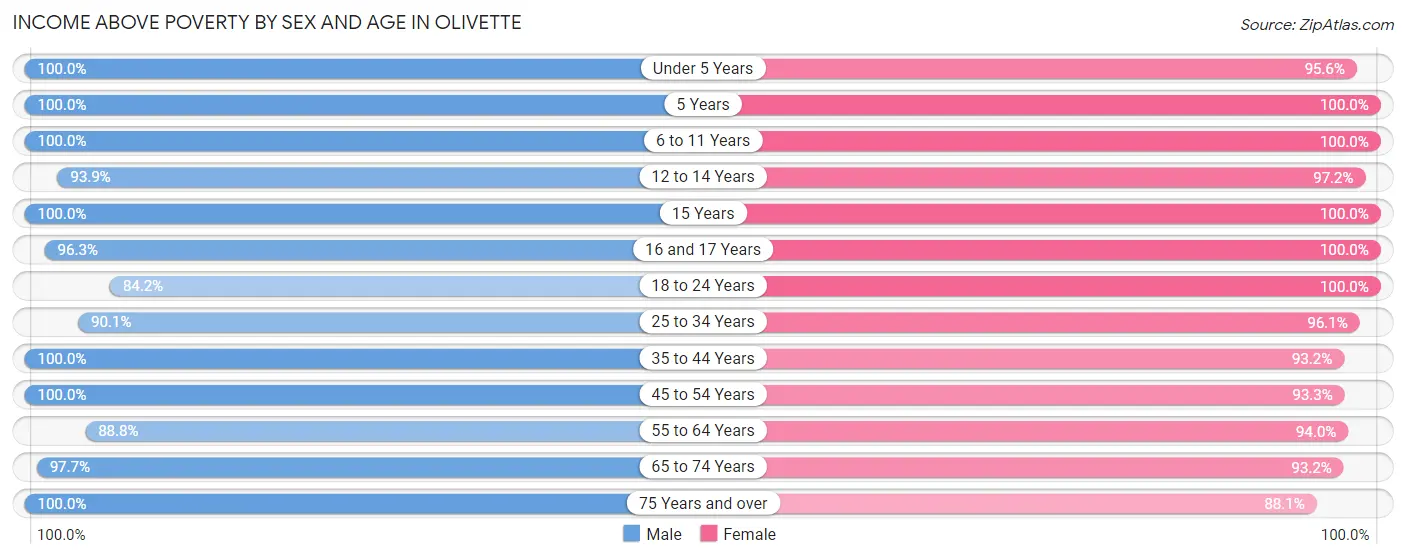
| Age Bracket | Male | Female |
| Under 5 Years | 223 (100.0%) | 194 (95.6%) |
| 5 Years | 12 (100.0%) | 36 (100.0%) |
| 6 to 11 Years | 446 (100.0%) | 288 (100.0%) |
| 12 to 14 Years | 200 (93.9%) | 205 (97.2%) |
| 15 Years | 239 (100.0%) | 110 (100.0%) |
| 16 and 17 Years | 155 (96.3%) | 108 (100.0%) |
| 18 to 24 Years | 255 (84.2%) | 256 (100.0%) |
| 25 to 34 Years | 218 (90.1%) | 443 (96.1%) |
| 35 to 44 Years | 485 (100.0%) | 688 (93.2%) |
| 45 to 54 Years | 634 (100.0%) | 642 (93.3%) |
| 55 to 64 Years | 347 (88.7%) | 453 (94.0%) |
| 65 to 74 Years | 432 (97.7%) | 476 (93.1%) |
| 75 Years and over | 237 (100.0%) | 274 (88.1%) |
| Total | 3,883 (96.4%) | 4,173 (94.8%) |
Income Below Poverty Among Married-Couple Families in Olivette
The poverty statistics for married-couple families in Olivette show that 1.0% or 16 of the total 1,616 families live below the poverty line. Families with no children have the highest poverty rate of 1.9%, comprising of 16 families. On the other hand, families with 1 or 2 children have the lowest poverty rate of 0.0%, which includes 0 families.
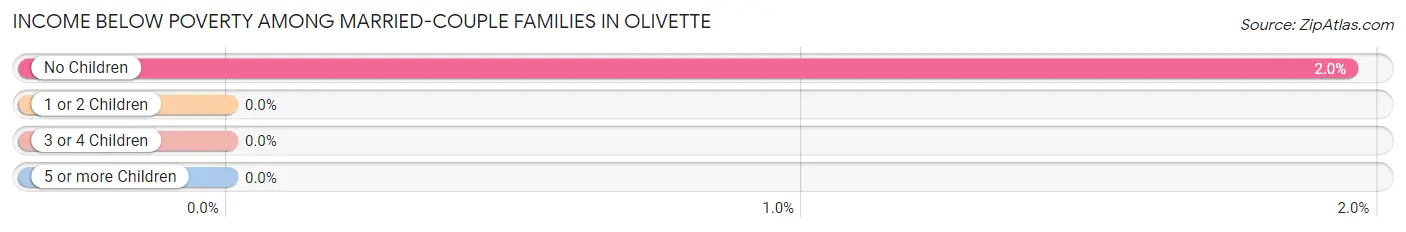
| Children | Above Poverty | Below Poverty |
| No Children | 804 (98.1%) | 16 (1.9%) |
| 1 or 2 Children | 680 (100.0%) | 0 (0.0%) |
| 3 or 4 Children | 98 (100.0%) | 0 (0.0%) |
| 5 or more Children | 18 (100.0%) | 0 (0.0%) |
| Total | 1,600 (99.0%) | 16 (1.0%) |
Income Below Poverty Among Single-Parent Households in Olivette
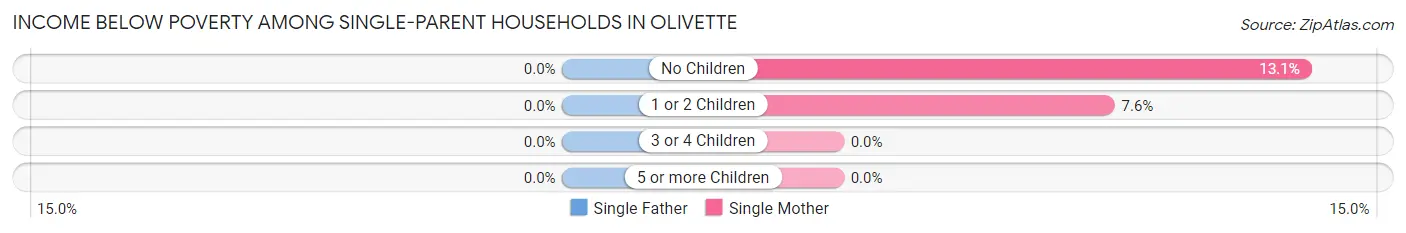
| Children | Single Father | Single Mother |
| No Children | 0 (0.0%) | 26 (13.1%) |
| 1 or 2 Children | 0 (0.0%) | 28 (7.6%) |
| 3 or 4 Children | 0 (0.0%) | 0 (0.0%) |
| 5 or more Children | 0 (0.0%) | 0 (0.0%) |
| Total | 0 (0.0%) | 54 (7.9%) |
Income Below Poverty Among Married-Couple vs Single-Parent Households in Olivette
The poverty data for Olivette shows that 16 of the married-couple family households (1.0%) and 54 of the single-parent households (7.1%) are living below the poverty level. Within the married-couple family households, those with no children have the highest poverty rate, with 16 households (1.9%) falling below the poverty line. Among the single-parent households, those with no children have the highest poverty rate, with 26 household (9.9%) living below poverty.
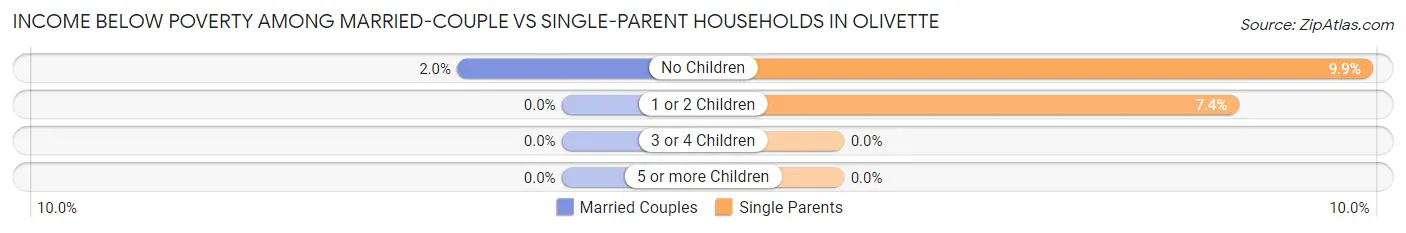
| Children | Married-Couple Families | Single-Parent Households |
| No Children | 16 (1.9%) | 26 (9.9%) |
| 1 or 2 Children | 0 (0.0%) | 28 (7.4%) |
| 3 or 4 Children | 0 (0.0%) | 0 (0.0%) |
| 5 or more Children | 0 (0.0%) | 0 (0.0%) |
| Total | 16 (1.0%) | 54 (7.1%) |
Race in Olivette
The most populous races in Olivette are White / Caucasian (4,473 | 53.0%), Black / African American (1,948 | 23.1%), and Asian (1,572 | 18.6%).
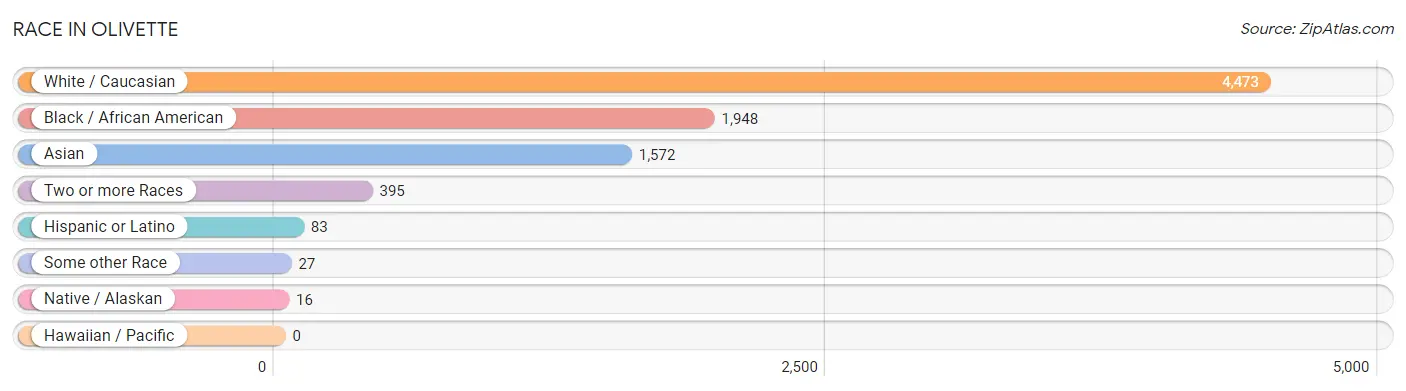
| Race | # Population | % Population |
| Asian | 1,572 | 18.6% |
| Black / African American | 1,948 | 23.1% |
| Hawaiian / Pacific | 0 | 0.0% |
| Hispanic or Latino | 83 | 1.0% |
| Native / Alaskan | 16 | 0.2% |
| White / Caucasian | 4,473 | 53.0% |
| Two or more Races | 395 | 4.7% |
| Some other Race | 27 | 0.3% |
| Total | 8,431 | 100.0% |
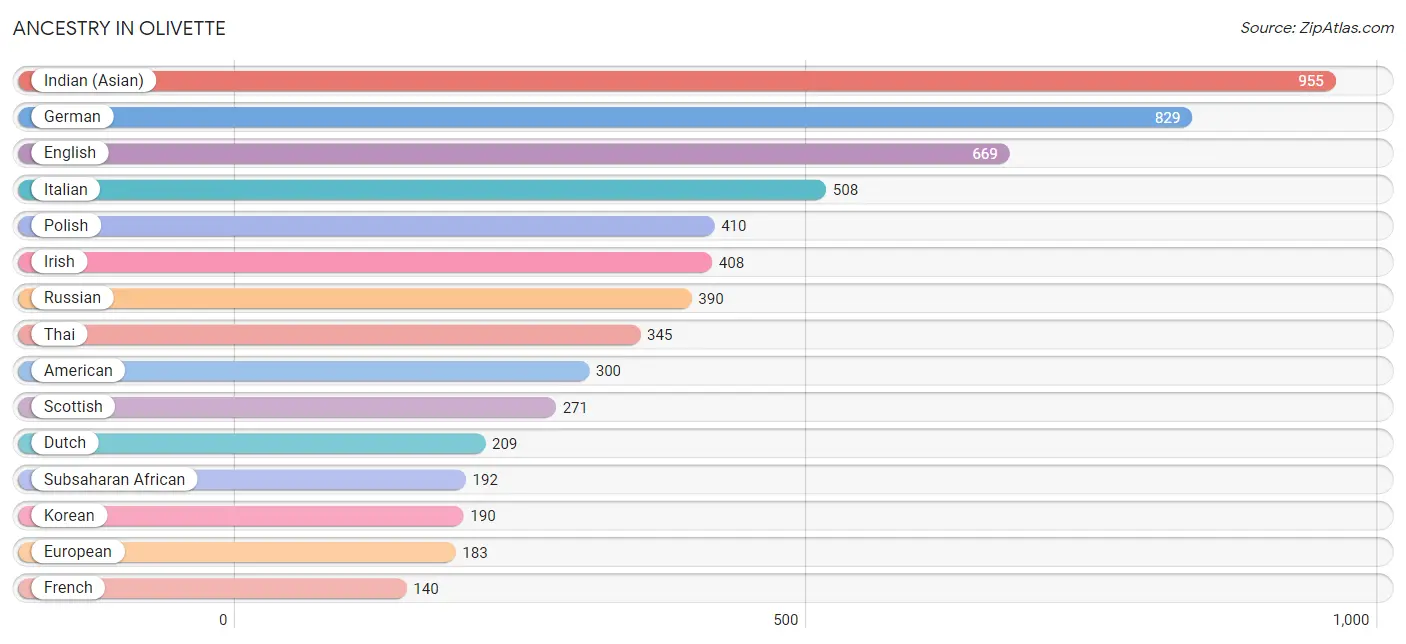
Ancestry in Olivette
The most populous ancestries reported in Olivette are Indian (Asian) (955 | 11.3%), German (829 | 9.8%), English (669 | 7.9%), Italian (508 | 6.0%), and Polish (410 | 4.9%), together accounting for 40.0% of all Olivette residents.
| Ancestry | # Population | % Population |
| African | 115 | 1.4% |
| American | 300 | 3.6% |
| Arab | 17 | 0.2% |
| Argentinean | 6 | 0.1% |
| Australian | 27 | 0.3% |
| Austrian | 42 | 0.5% |
| Bhutanese | 39 | 0.5% |
| Blackfeet | 3 | 0.0% |
| British | 42 | 0.5% |
| Burmese | 10 | 0.1% |
| Canadian | 39 | 0.5% |
| Central American | 15 | 0.2% |
| Central American Indian | 7 | 0.1% |
| Cherokee | 9 | 0.1% |
| Colombian | 24 | 0.3% |
| Czech | 31 | 0.4% |
| Danish | 23 | 0.3% |
| Dutch | 209 | 2.5% |
| Eastern European | 138 | 1.6% |
| English | 669 | 7.9% |
| Ethiopian | 77 | 0.9% |
| European | 183 | 2.2% |
| Filipino | 63 | 0.7% |
| Finnish | 10 | 0.1% |
| French | 140 | 1.7% |
| German | 829 | 9.8% |
| Greek | 33 | 0.4% |
| Guatemalan | 15 | 0.2% |
| Haitian | 27 | 0.3% |
| Hungarian | 38 | 0.4% |
| Indian (Asian) | 955 | 11.3% |
| Irish | 408 | 4.8% |
| Israeli | 16 | 0.2% |
| Italian | 508 | 6.0% |
| Korean | 190 | 2.2% |
| Laotian | 32 | 0.4% |
| Latvian | 7 | 0.1% |
| Lebanese | 17 | 0.2% |
| Lithuanian | 17 | 0.2% |
| Mexican | 21 | 0.3% |
| Mexican American Indian | 2 | 0.0% |
| Mongolian | 23 | 0.3% |
| Native Hawaiian | 7 | 0.1% |
| Northern European | 7 | 0.1% |
| Norwegian | 15 | 0.2% |
| Polish | 410 | 4.9% |
| Romanian | 26 | 0.3% |
| Russian | 390 | 4.6% |
| Scandinavian | 51 | 0.6% |
| Scotch-Irish | 37 | 0.4% |
| Scottish | 271 | 3.2% |
| South American | 47 | 0.6% |
| Sri Lankan | 29 | 0.3% |
| Subsaharan African | 192 | 2.3% |
| Swedish | 38 | 0.4% |
| Swiss | 22 | 0.3% |
| Thai | 345 | 4.1% |
| Ukrainian | 45 | 0.5% |
| Venezuelan | 17 | 0.2% |
| Welsh | 7 | 0.1% | View All 60 Rows |
Immigrants in Olivette
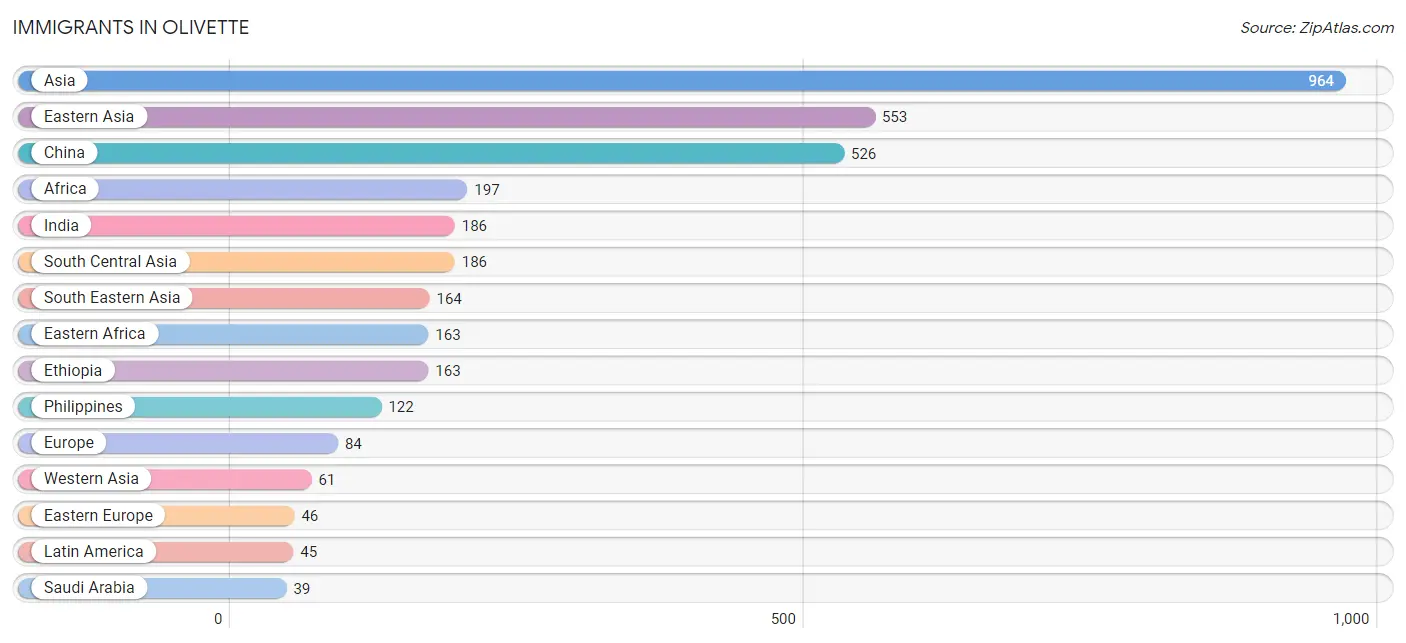
The most numerous immigrant groups reported in Olivette came from Asia (964 | 11.4%), Eastern Asia (553 | 6.6%), China (526 | 6.2%), Africa (197 | 2.3%), and India (186 | 2.2%), together accounting for 28.8% of all Olivette residents.
| Immigration Origin | # Population | % Population |
| Africa | 197 | 2.3% |
| Argentina | 6 | 0.1% |
| Asia | 964 | 11.4% |
| Australia | 9 | 0.1% |
| Belarus | 15 | 0.2% |
| Canada | 8 | 0.1% |
| Caribbean | 11 | 0.1% |
| Central America | 7 | 0.1% |
| China | 526 | 6.2% |
| Colombia | 21 | 0.3% |
| Eastern Africa | 163 | 1.9% |
| Eastern Asia | 553 | 6.6% |
| Eastern Europe | 46 | 0.5% |
| Ethiopia | 163 | 1.9% |
| Europe | 84 | 1.0% |
| France | 8 | 0.1% |
| Germany | 6 | 0.1% |
| Guatemala | 7 | 0.1% |
| Haiti | 11 | 0.1% |
| Hong Kong | 10 | 0.1% |
| India | 186 | 2.2% |
| Indonesia | 16 | 0.2% |
| Japan | 17 | 0.2% |
| Korea | 10 | 0.1% |
| Kuwait | 14 | 0.2% |
| Latin America | 45 | 0.5% |
| Malaysia | 17 | 0.2% |
| Netherlands | 8 | 0.1% |
| Oceania | 9 | 0.1% |
| Philippines | 122 | 1.5% |
| Russia | 22 | 0.3% |
| Saudi Arabia | 39 | 0.5% |
| South Africa | 6 | 0.1% |
| South America | 27 | 0.3% |
| South Central Asia | 186 | 2.2% |
| South Eastern Asia | 164 | 1.9% |
| Syria | 8 | 0.1% |
| Taiwan | 37 | 0.4% |
| Ukraine | 9 | 0.1% |
| Vietnam | 9 | 0.1% |
| Western Asia | 61 | 0.7% |
| Western Europe | 22 | 0.3% | View All 42 Rows |
Sex and Age in Olivette
Sex and Age in Olivette
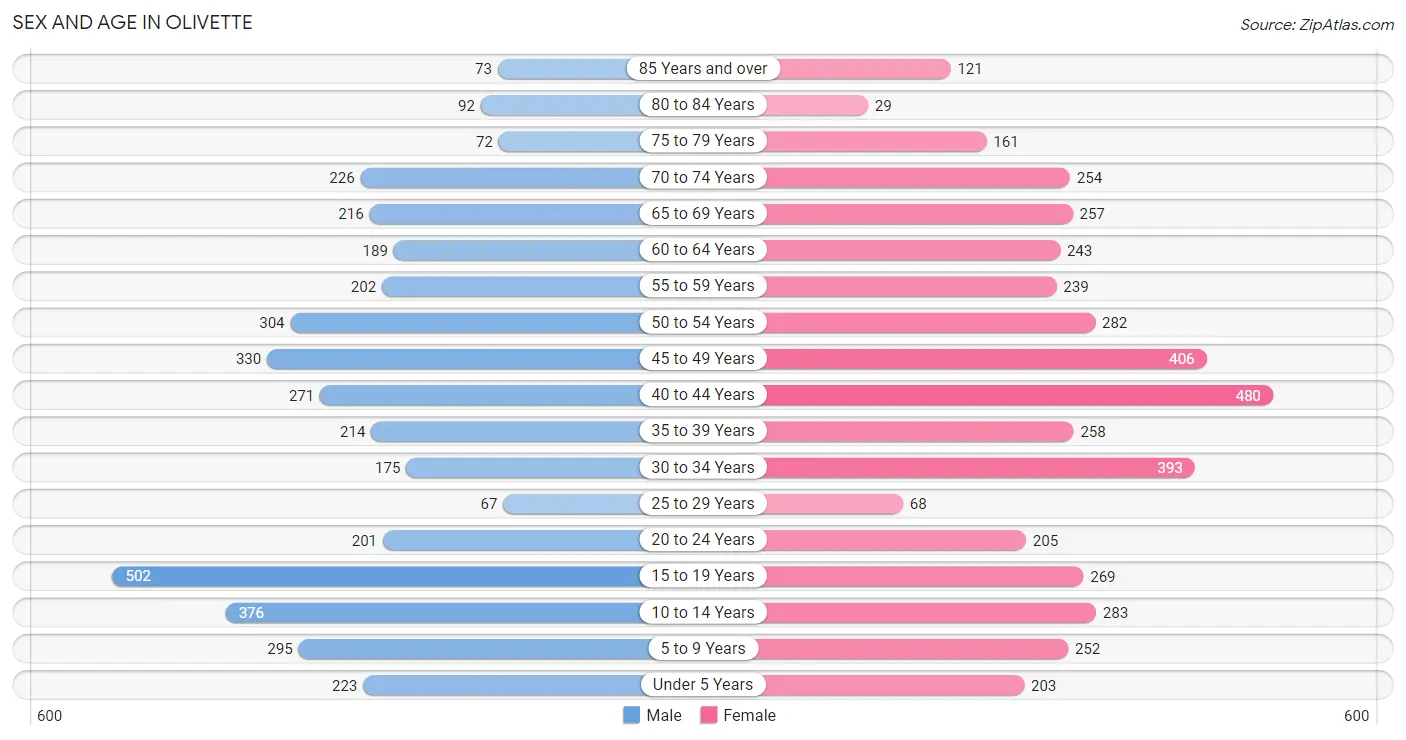
The most populous age groups in Olivette are 15 to 19 Years (502 | 12.5%) for men and 40 to 44 Years (480 | 10.9%) for women.
| Age Bracket | Male | Female |
| Under 5 Years | 223 (5.5%) | 203 (4.6%) |
| 5 to 9 Years | 295 (7.3%) | 252 (5.7%) |
| 10 to 14 Years | 376 (9.3%) | 283 (6.4%) |
| 15 to 19 Years | 502 (12.5%) | 269 (6.1%) |
| 20 to 24 Years | 201 (5.0%) | 205 (4.7%) |
| 25 to 29 Years | 67 (1.7%) | 68 (1.5%) |
| 30 to 34 Years | 175 (4.3%) | 393 (8.9%) |
| 35 to 39 Years | 214 (5.3%) | 258 (5.9%) |
| 40 to 44 Years | 271 (6.7%) | 480 (10.9%) |
| 45 to 49 Years | 330 (8.2%) | 406 (9.2%) |
| 50 to 54 Years | 304 (7.5%) | 282 (6.4%) |
| 55 to 59 Years | 202 (5.0%) | 239 (5.4%) |
| 60 to 64 Years | 189 (4.7%) | 243 (5.5%) |
| 65 to 69 Years | 216 (5.4%) | 257 (5.8%) |
| 70 to 74 Years | 226 (5.6%) | 254 (5.8%) |
| 75 to 79 Years | 72 (1.8%) | 161 (3.7%) |
| 80 to 84 Years | 92 (2.3%) | 29 (0.7%) |
| 85 Years and over | 73 (1.8%) | 121 (2.8%) |
| Total | 4,028 (100.0%) | 4,403 (100.0%) |
Families and Households in Olivette
Median Family Size in Olivette
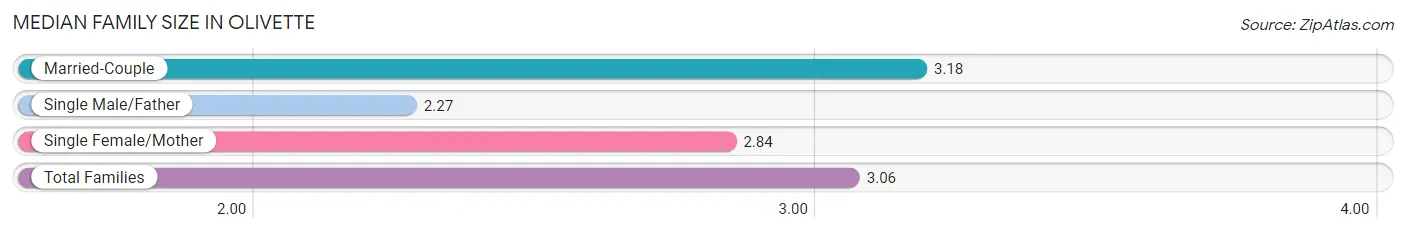
The median family size in Olivette is 3.06 persons per family, with married-couple families (1,616 | 68.1%) accounting for the largest median family size of 3.18 persons per family. On the other hand, single male/father families (75 | 3.2%) represent the smallest median family size with 2.27 persons per family.
| Family Type | # Families | Family Size |
| Married-Couple | 1,616 (68.1%) | 3.18 |
| Single Male/Father | 75 (3.2%) | 2.27 |
| Single Female/Mother | 681 (28.7%) | 2.84 |
| Total Families | 2,372 (100.0%) | 3.06 |
Median Household Size in Olivette
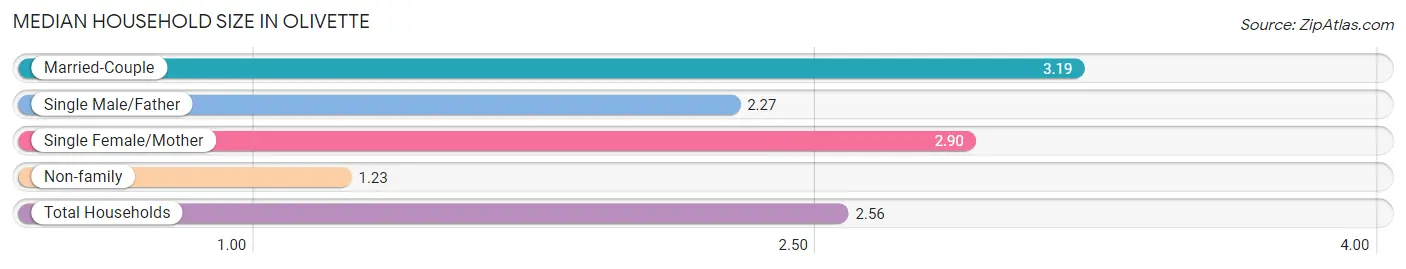
The median household size in Olivette is 2.56 persons per household, with married-couple households (1,616 | 49.1%) accounting for the largest median household size of 3.19 persons per household. non-family households (920 | 28.0%) represent the smallest median household size with 1.23 persons per household.
| Household Type | # Households | Household Size |
| Married-Couple | 1,616 (49.1%) | 3.19 |
| Single Male/Father | 75 (2.3%) | 2.27 |
| Single Female/Mother | 681 (20.7%) | 2.90 |
| Non-family | 920 (28.0%) | 1.23 |
| Total Households | 3,292 (100.0%) | 2.56 |
Household Size by Marriage Status in Olivette
Out of a total of 3,292 households in Olivette, 2,372 (72.1%) are family households, while 920 (28.0%) are nonfamily households. The most numerous type of family households are 2-person households, comprising 1,054, and the most common type of nonfamily households are 1-person households, comprising 691.
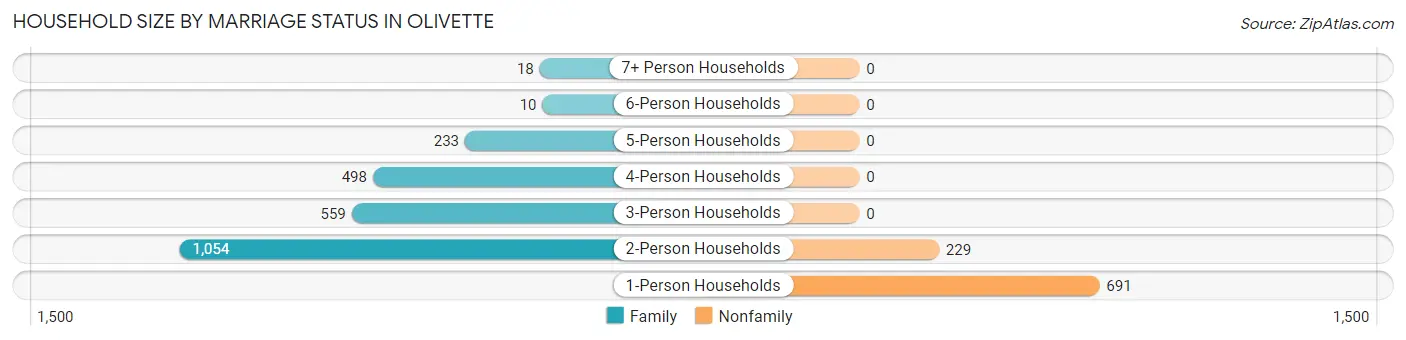
| Household Size | Family Households | Nonfamily Households |
| 1-Person Households | - | 691 (21.0%) |
| 2-Person Households | 1,054 (32.0%) | 229 (7.0%) |
| 3-Person Households | 559 (17.0%) | 0 (0.0%) |
| 4-Person Households | 498 (15.1%) | 0 (0.0%) |
| 5-Person Households | 233 (7.1%) | 0 (0.0%) |
| 6-Person Households | 10 (0.3%) | 0 (0.0%) |
| 7+ Person Households | 18 (0.5%) | 0 (0.0%) |
| Total | 2,372 (72.1%) | 920 (28.0%) |
Female Fertility in Olivette
Fertility by Age in Olivette
Average fertility rate in Olivette is 30.0 births per 1,000 women. Women in the age bracket of 20 to 34 years have the highest fertility rate with 39.0 births per 1,000 women. Women in the age bracket of 35 to 50 years acount for 60.0% of all women with births.
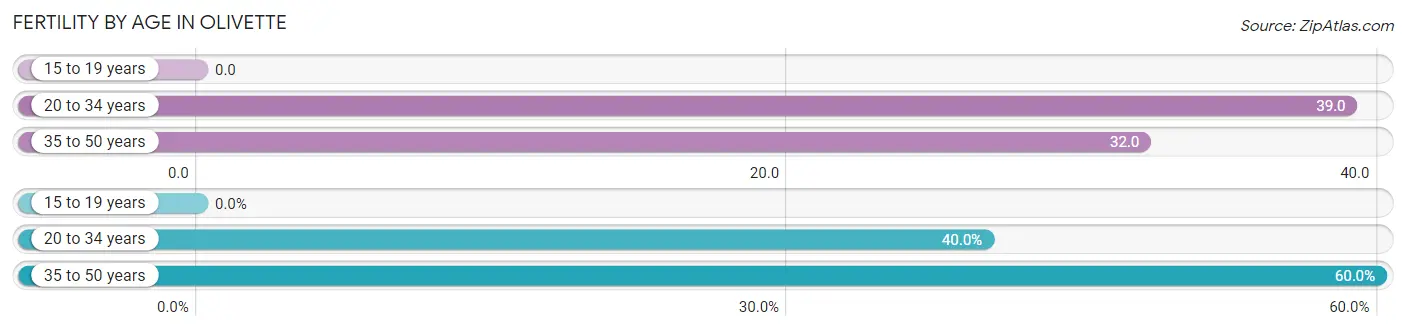
| Age Bracket | Women with Births | Births / 1,000 Women |
| 15 to 19 years | 0 (0.0%) | 0.0 |
| 20 to 34 years | 26 (40.0%) | 39.0 |
| 35 to 50 years | 39 (60.0%) | 32.0 |
| Total | 65 (100.0%) | 30.0 |
Fertility by Age by Marriage Status in Olivette
72.3% of women with births (65) in Olivette are married. The highest percentage of unmarried women with births falls into 35 to 50 years age bracket with 46.2% of them unmarried at the time of birth, while the lowest percentage of unmarried women with births belong to 20 to 34 years age bracket with 0.0% of them unmarried.
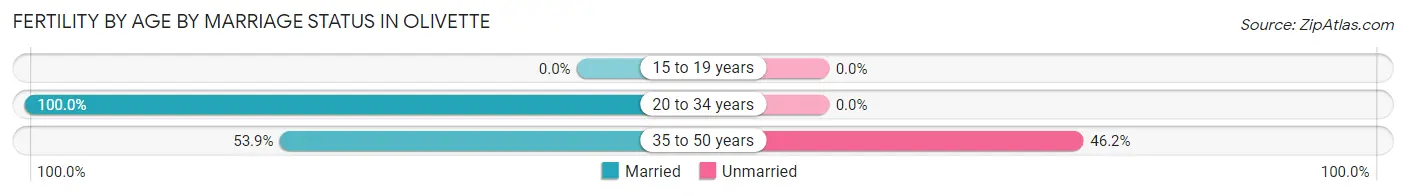
| Age Bracket | Married | Unmarried |
| 15 to 19 years | 0 (0.0%) | 0 (0.0%) |
| 20 to 34 years | 26 (100.0%) | 0 (0.0%) |
| 35 to 50 years | 21 (53.8%) | 18 (46.2%) |
| Total | 47 (72.3%) | 18 (27.7%) |
Fertility by Education in Olivette
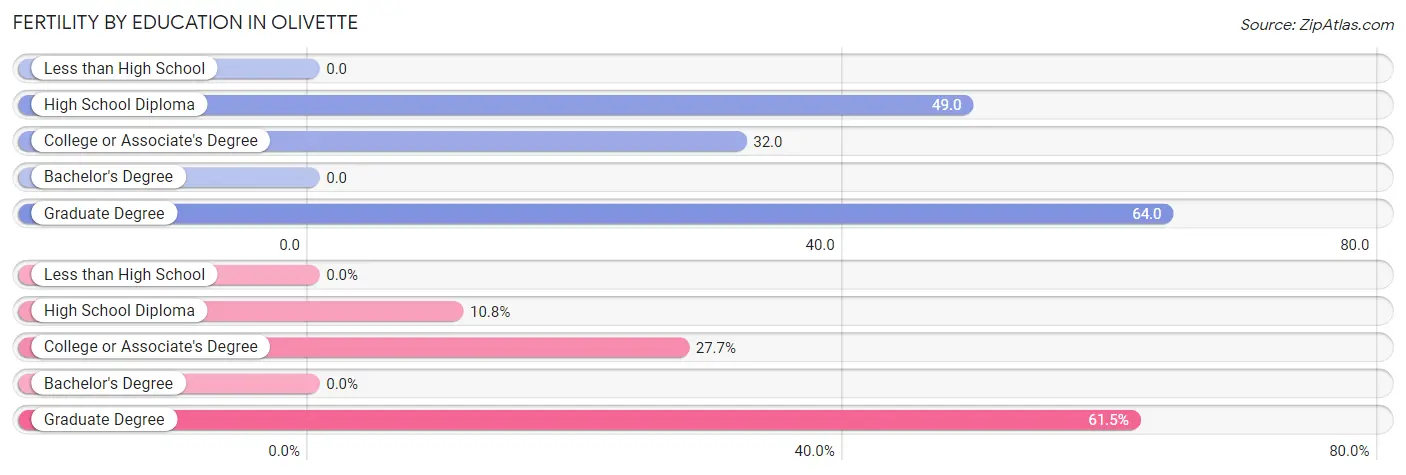
| Educational Attainment | Women with Births | Births / 1,000 Women |
| Less than High School | 0 (0.0%) | 0.0 |
| High School Diploma | 7 (10.8%) | 49.0 |
| College or Associate's Degree | 18 (27.7%) | 32.0 |
| Bachelor's Degree | 0 (0.0%) | 0.0 |
| Graduate Degree | 40 (61.5%) | 64.0 |
| Total | 65 (100.0%) | 30.0 |
Fertility by Education by Marriage Status in Olivette
27.7% of women with births in Olivette are unmarried. Women with the educational attainment of high school diploma are most likely to be married with 100.0% of them married at childbirth, while women with the educational attainment of college or associate's degree are least likely to be married with 100.0% of them unmarried at childbirth.
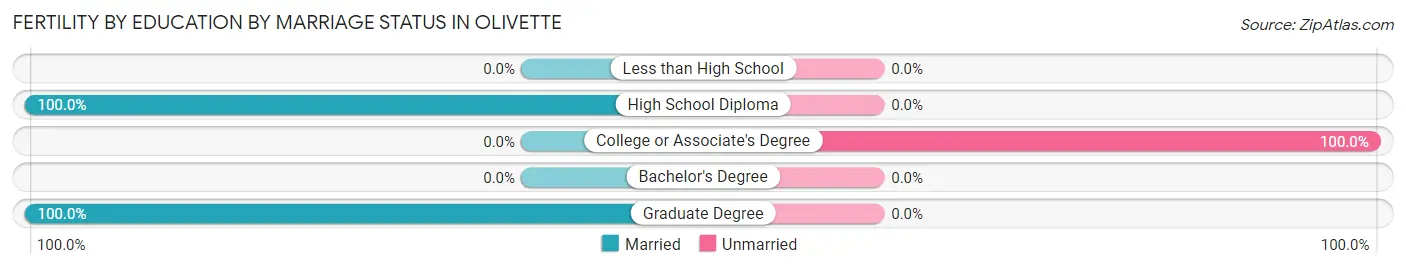
| Educational Attainment | Married | Unmarried |
| Less than High School | 0 (0.0%) | 0 (0.0%) |
| High School Diploma | 7 (100.0%) | 0 (0.0%) |
| College or Associate's Degree | 0 (0.0%) | 18 (100.0%) |
| Bachelor's Degree | 0 (0.0%) | 0 (0.0%) |
| Graduate Degree | 40 (100.0%) | 0 (0.0%) |
| Total | 47 (72.3%) | 18 (27.7%) |
Employment Characteristics in Olivette
Employment by Class of Employer in Olivette
Among the 4,129 employed individuals in Olivette, private company employees (2,646 | 64.1%), not-for-profit organizations (752 | 18.2%), and self-employed (not incorporated) (252 | 6.1%) make up the most common classes of employment.
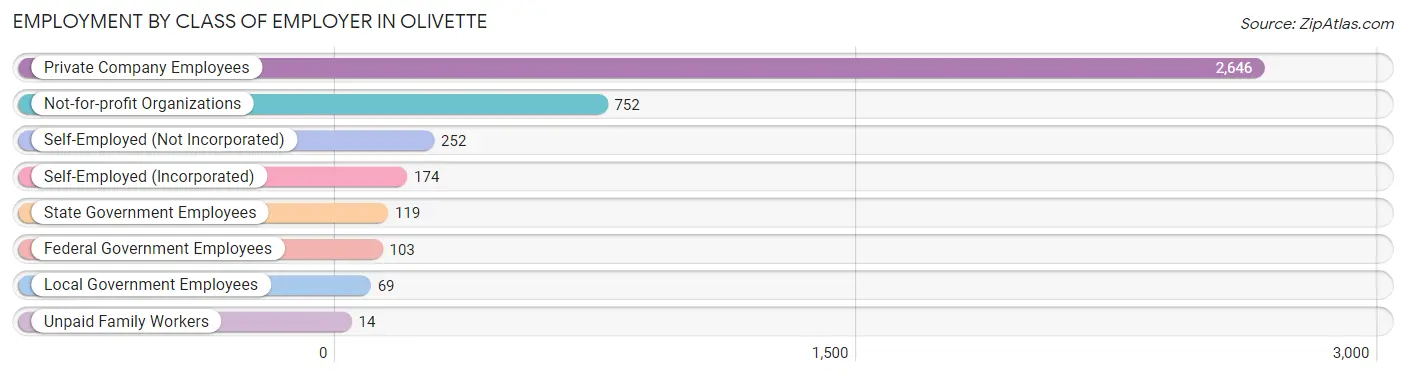
| Employer Class | # Employees | % Employees |
| Private Company Employees | 2,646 | 64.1% |
| Self-Employed (Incorporated) | 174 | 4.2% |
| Self-Employed (Not Incorporated) | 252 | 6.1% |
| Not-for-profit Organizations | 752 | 18.2% |
| Local Government Employees | 69 | 1.7% |
| State Government Employees | 119 | 2.9% |
| Federal Government Employees | 103 | 2.5% |
| Unpaid Family Workers | 14 | 0.3% |
| Total | 4,129 | 100.0% |
Employment Status by Age in Olivette
According to the labor force statistics for Olivette, out of the total population over 16 years of age (6,450), 68.4% or 4,412 individuals are in the labor force, with 5.1% or 225 of them unemployed. The age group with the highest labor force participation rate is 30 to 34 years, with 94.2% or 535 individuals in the labor force. Within the labor force, the 75 years and over age range has the highest percentage of unemployed individuals, with 25.9% or 7 of them being unemployed.
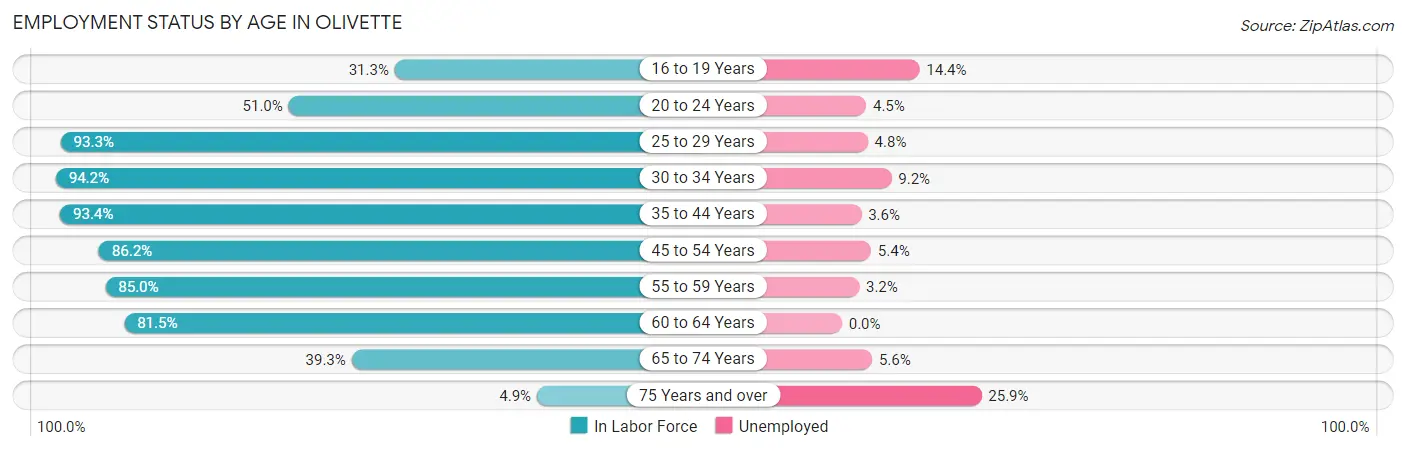
| Age Bracket | In Labor Force | Unemployed |
| 16 to 19 Years | 132 (31.3%) | 19 (14.4%) |
| 20 to 24 Years | 207 (51.0%) | 9 (4.5%) |
| 25 to 29 Years | 126 (93.3%) | 6 (4.8%) |
| 30 to 34 Years | 535 (94.2%) | 49 (9.2%) |
| 35 to 44 Years | 1,142 (93.4%) | 41 (3.6%) |
| 45 to 54 Years | 1,140 (86.2%) | 62 (5.4%) |
| 55 to 59 Years | 375 (85.0%) | 12 (3.2%) |
| 60 to 64 Years | 352 (81.5%) | 0 (0.0%) |
| 65 to 74 Years | 375 (39.3%) | 21 (5.6%) |
| 75 Years and over | 27 (4.9%) | 7 (25.9%) |
| Total | 4,412 (68.4%) | 225 (5.1%) |
Employment Status by Educational Attainment in Olivette
According to labor force statistics for Olivette, 89.1% of individuals (3,672) out of the total population between 25 and 64 years of age (4,121) are in the labor force, with 4.6% or 169 of them being unemployed. The group with the highest labor force participation rate are those with the educational attainment of college / associate degree, with 93.3% or 762 individuals in the labor force. Within the labor force, individuals with high school diploma education have the highest percentage of unemployment, with 14.2% or 45 of them being unemployed.
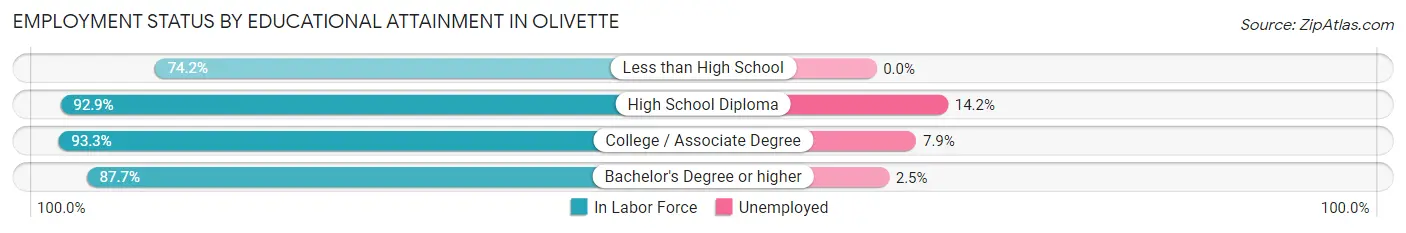
| Educational Attainment | In Labor Force | Unemployed |
| Less than High School | 46 (74.2%) | 0 (0.0%) |
| High School Diploma | 316 (92.9%) | 48 (14.2%) |
| College / Associate Degree | 762 (93.3%) | 65 (7.9%) |
| Bachelor's Degree or higher | 2,545 (87.7%) | 73 (2.5%) |
| Total | 3,672 (89.1%) | 190 (4.6%) |
Employment Occupations by Sex in Olivette
Management, Business, Science and Arts Occupations
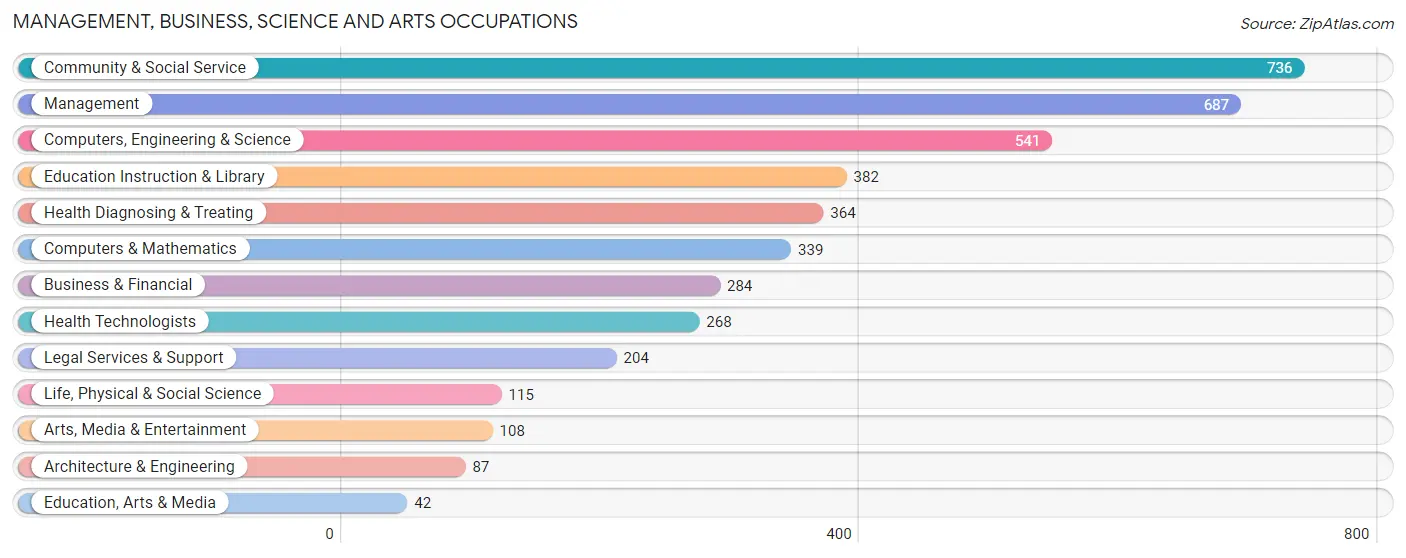
The most common Management, Business, Science and Arts occupations in Olivette are Community & Social Service (736 | 17.6%), Management (687 | 16.4%), Computers, Engineering & Science (541 | 12.9%), Education Instruction & Library (382 | 9.1%), and Health Diagnosing & Treating (364 | 8.7%).
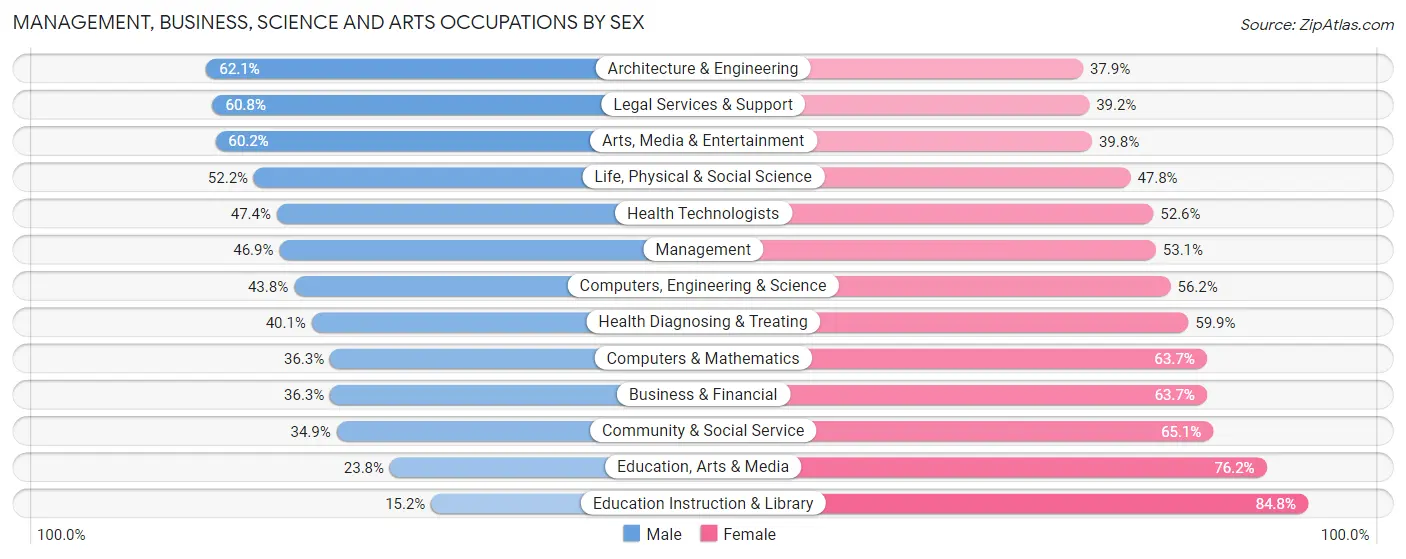
Management, Business, Science and Arts Occupations by Sex
Within the Management, Business, Science and Arts occupations in Olivette, the most male-oriented occupations are Architecture & Engineering (62.1%), Legal Services & Support (60.8%), and Arts, Media & Entertainment (60.2%), while the most female-oriented occupations are Education Instruction & Library (84.8%), Education, Arts & Media (76.2%), and Community & Social Service (65.1%).
| Occupation | Male | Female |
| Management | 322 (46.9%) | 365 (53.1%) |
| Business & Financial | 103 (36.3%) | 181 (63.7%) |
| Computers, Engineering & Science | 237 (43.8%) | 304 (56.2%) |
| Computers & Mathematics | 123 (36.3%) | 216 (63.7%) |
| Architecture & Engineering | 54 (62.1%) | 33 (37.9%) |
| Life, Physical & Social Science | 60 (52.2%) | 55 (47.8%) |
| Community & Social Service | 257 (34.9%) | 479 (65.1%) |
| Education, Arts & Media | 10 (23.8%) | 32 (76.2%) |
| Legal Services & Support | 124 (60.8%) | 80 (39.2%) |
| Education Instruction & Library | 58 (15.2%) | 324 (84.8%) |
| Arts, Media & Entertainment | 65 (60.2%) | 43 (39.8%) |
| Health Diagnosing & Treating | 146 (40.1%) | 218 (59.9%) |
| Health Technologists | 127 (47.4%) | 141 (52.6%) |
| Total (Category) | 1,065 (40.8%) | 1,547 (59.2%) |
| Total (Overall) | 1,816 (43.4%) | 2,364 (56.6%) |
Services Occupations
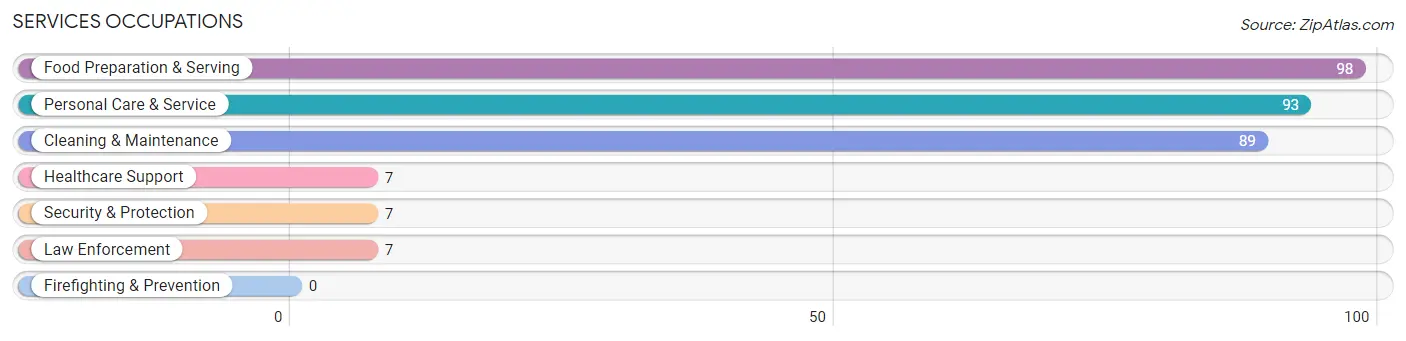
The most common Services occupations in Olivette are Food Preparation & Serving (98 | 2.3%), Personal Care & Service (93 | 2.2%), Cleaning & Maintenance (89 | 2.1%), Healthcare Support (7 | 0.2%), and Security & Protection (7 | 0.2%).
Services Occupations by Sex
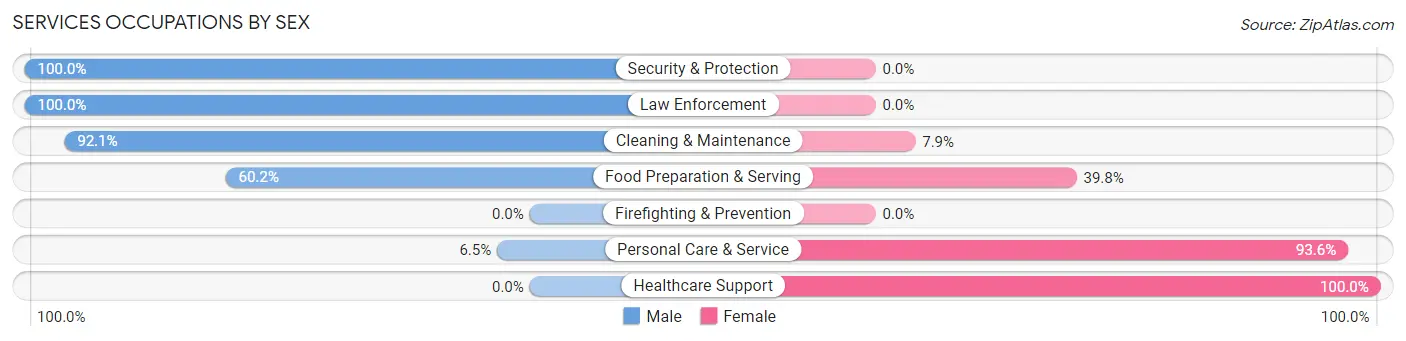
Within the Services occupations in Olivette, the most male-oriented occupations are Security & Protection (100.0%), Law Enforcement (100.0%), and Cleaning & Maintenance (92.1%), while the most female-oriented occupations are Healthcare Support (100.0%), Personal Care & Service (93.5%), and Food Preparation & Serving (39.8%).
| Occupation | Male | Female |
| Healthcare Support | 0 (0.0%) | 7 (100.0%) |
| Security & Protection | 7 (100.0%) | 0 (0.0%) |
| Firefighting & Prevention | 0 (0.0%) | 0 (0.0%) |
| Law Enforcement | 7 (100.0%) | 0 (0.0%) |
| Food Preparation & Serving | 59 (60.2%) | 39 (39.8%) |
| Cleaning & Maintenance | 82 (92.1%) | 7 (7.9%) |
| Personal Care & Service | 6 (6.5%) | 87 (93.5%) |
| Total (Category) | 154 (52.4%) | 140 (47.6%) |
| Total (Overall) | 1,816 (43.4%) | 2,364 (56.6%) |
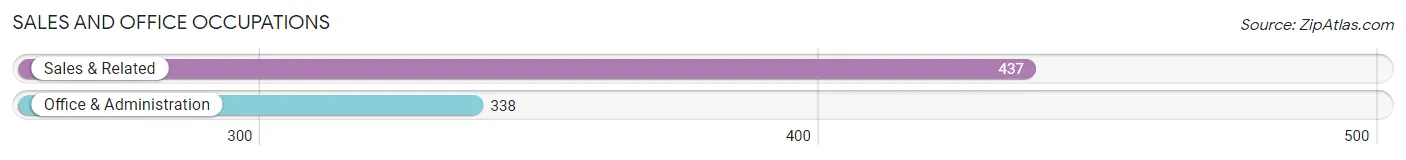
Sales and Office Occupations
The most common Sales and Office occupations in Olivette are Sales & Related (437 | 10.4%), and Office & Administration (338 | 8.1%).
Sales and Office Occupations by Sex
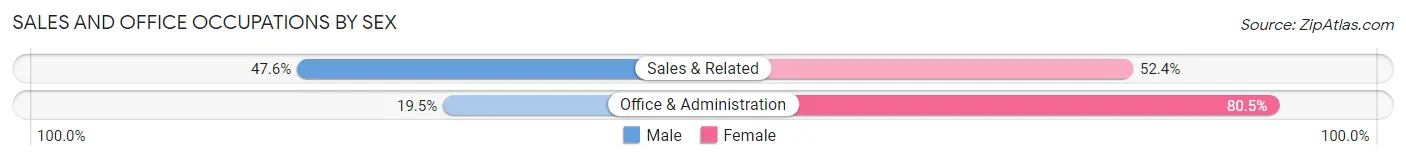
| Occupation | Male | Female |
| Sales & Related | 208 (47.6%) | 229 (52.4%) |
| Office & Administration | 66 (19.5%) | 272 (80.5%) |
| Total (Category) | 274 (35.3%) | 501 (64.6%) |
| Total (Overall) | 1,816 (43.4%) | 2,364 (56.6%) |
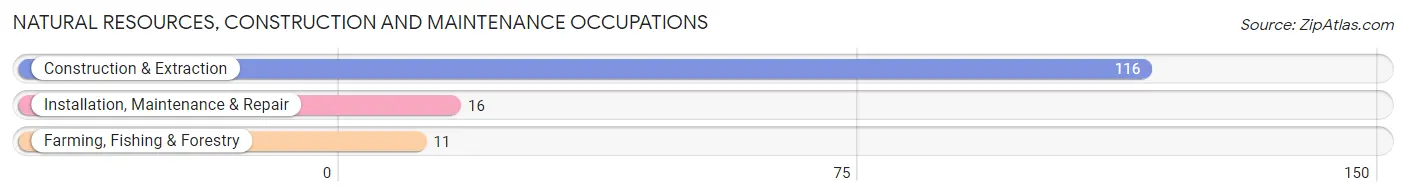
Natural Resources, Construction and Maintenance Occupations
The most common Natural Resources, Construction and Maintenance occupations in Olivette are Construction & Extraction (116 | 2.8%), Installation, Maintenance & Repair (16 | 0.4%), and Farming, Fishing & Forestry (11 | 0.3%).
Natural Resources, Construction and Maintenance Occupations by Sex

| Occupation | Male | Female |
| Farming, Fishing & Forestry | 11 (100.0%) | 0 (0.0%) |
| Construction & Extraction | 116 (100.0%) | 0 (0.0%) |
| Installation, Maintenance & Repair | 16 (100.0%) | 0 (0.0%) |
| Total (Category) | 143 (100.0%) | 0 (0.0%) |
| Total (Overall) | 1,816 (43.4%) | 2,364 (56.6%) |
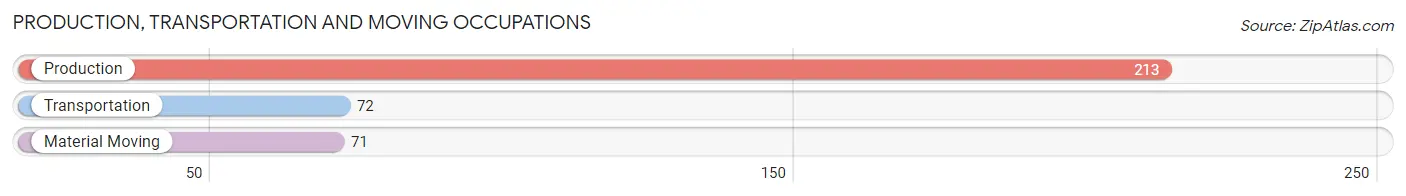
Production, Transportation and Moving Occupations
The most common Production, Transportation and Moving occupations in Olivette are Production (213 | 5.1%), Transportation (72 | 1.7%), and Material Moving (71 | 1.7%).
Production, Transportation and Moving Occupations by Sex
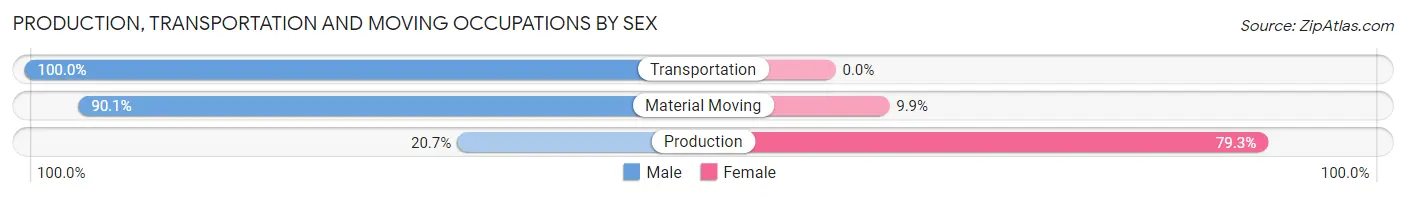
| Occupation | Male | Female |
| Production | 44 (20.7%) | 169 (79.3%) |
| Transportation | 72 (100.0%) | 0 (0.0%) |
| Material Moving | 64 (90.1%) | 7 (9.9%) |
| Total (Category) | 180 (50.6%) | 176 (49.4%) |
| Total (Overall) | 1,816 (43.4%) | 2,364 (56.6%) |
Employment Industries by Sex in Olivette
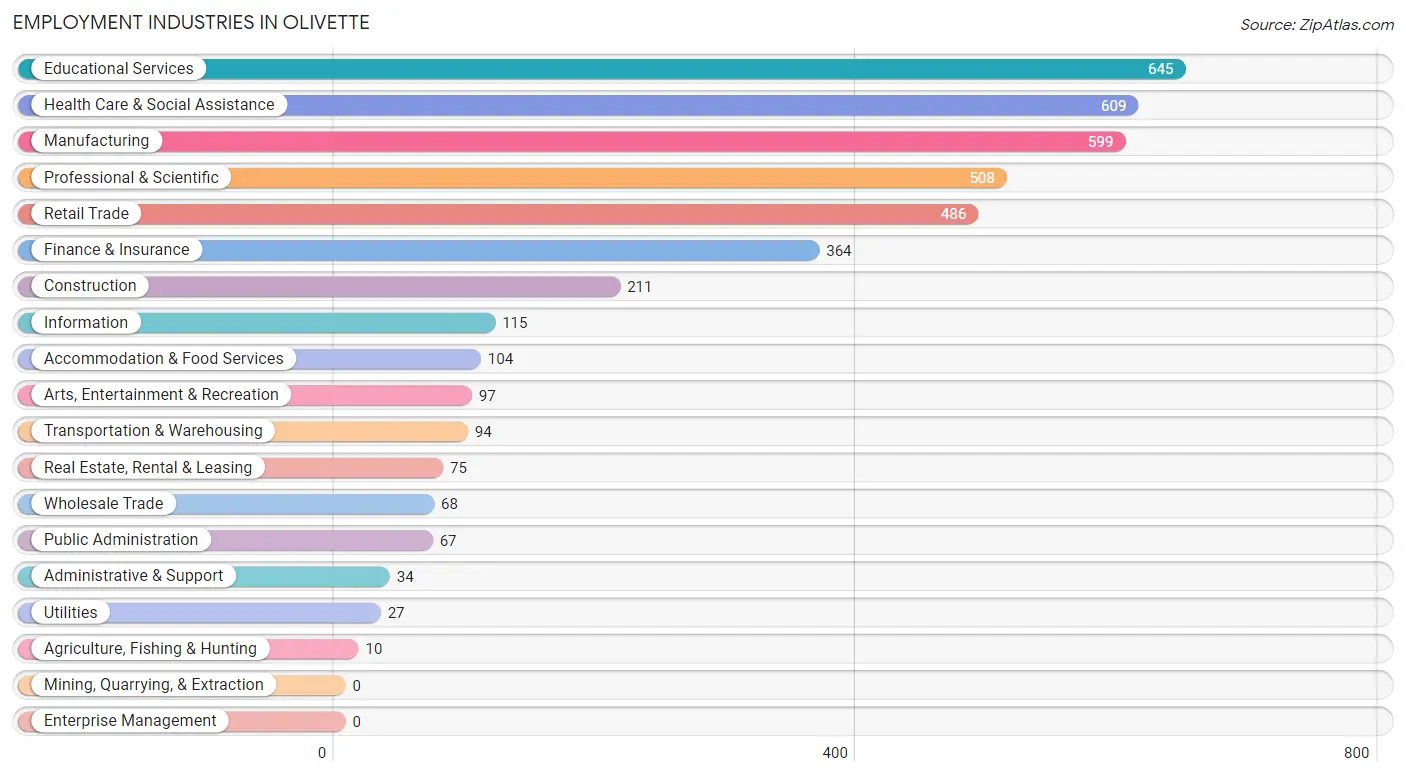
Employment Industries in Olivette
The major employment industries in Olivette include Educational Services (645 | 15.4%), Health Care & Social Assistance (609 | 14.6%), Manufacturing (599 | 14.3%), Professional & Scientific (508 | 12.1%), and Retail Trade (486 | 11.6%).
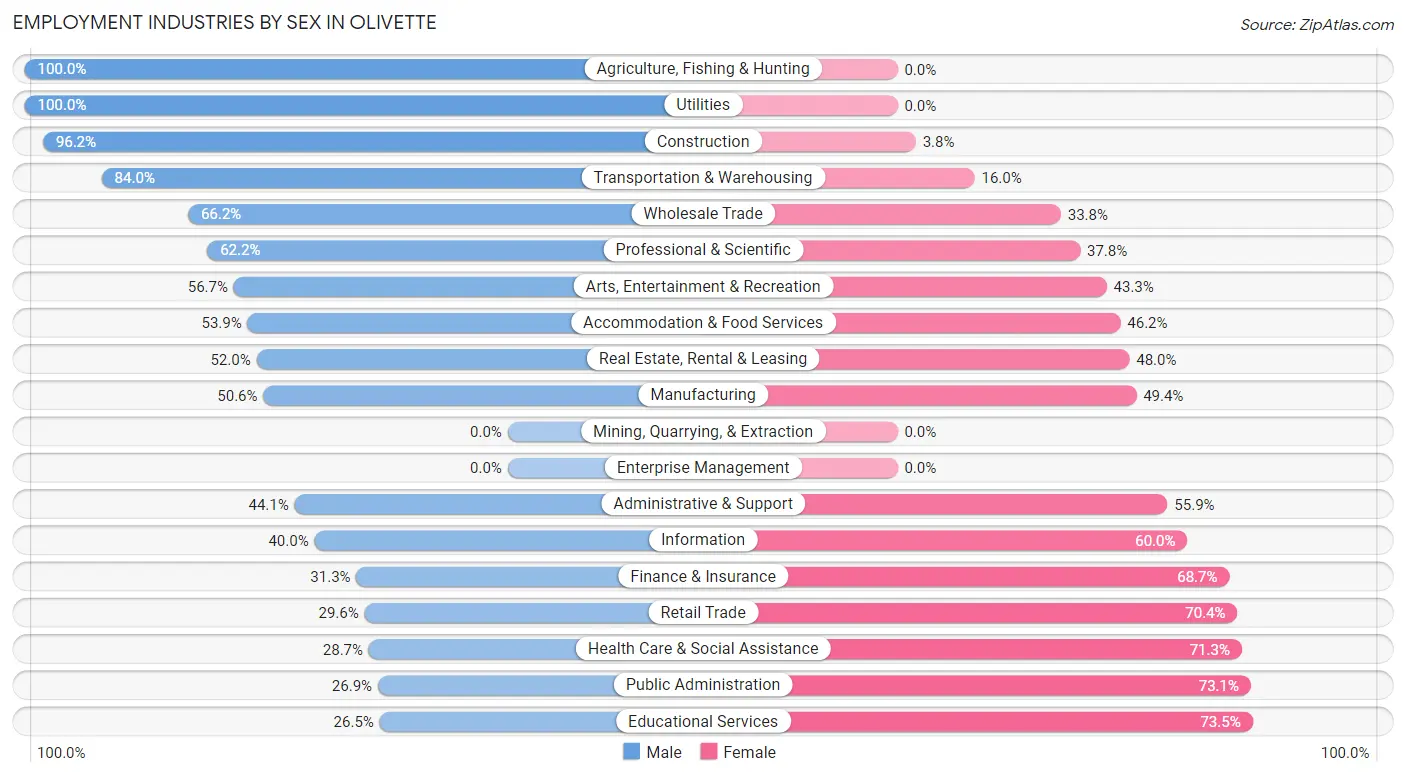
Employment Industries by Sex in Olivette
The Olivette industries that see more men than women are Agriculture, Fishing & Hunting (100.0%), Utilities (100.0%), and Construction (96.2%), whereas the industries that tend to have a higher number of women are Educational Services (73.5%), Public Administration (73.1%), and Health Care & Social Assistance (71.3%).
| Industry | Male | Female |
| Agriculture, Fishing & Hunting | 10 (100.0%) | 0 (0.0%) |
| Mining, Quarrying, & Extraction | 0 (0.0%) | 0 (0.0%) |
| Construction | 203 (96.2%) | 8 (3.8%) |
| Manufacturing | 303 (50.6%) | 296 (49.4%) |
| Wholesale Trade | 45 (66.2%) | 23 (33.8%) |
| Retail Trade | 144 (29.6%) | 342 (70.4%) |
| Transportation & Warehousing | 79 (84.0%) | 15 (16.0%) |
| Utilities | 27 (100.0%) | 0 (0.0%) |
| Information | 46 (40.0%) | 69 (60.0%) |
| Finance & Insurance | 114 (31.3%) | 250 (68.7%) |
| Real Estate, Rental & Leasing | 39 (52.0%) | 36 (48.0%) |
| Professional & Scientific | 316 (62.2%) | 192 (37.8%) |
| Enterprise Management | 0 (0.0%) | 0 (0.0%) |
| Administrative & Support | 15 (44.1%) | 19 (55.9%) |
| Educational Services | 171 (26.5%) | 474 (73.5%) |
| Health Care & Social Assistance | 175 (28.7%) | 434 (71.3%) |
| Arts, Entertainment & Recreation | 55 (56.7%) | 42 (43.3%) |
| Accommodation & Food Services | 56 (53.8%) | 48 (46.2%) |
| Public Administration | 18 (26.9%) | 49 (73.1%) |
| Total | 1,816 (43.4%) | 2,364 (56.6%) |
Education in Olivette
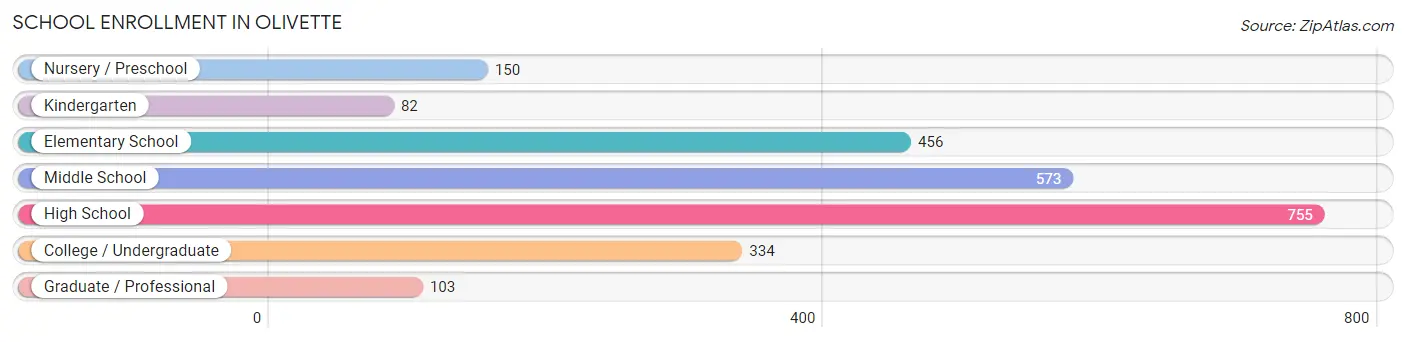
School Enrollment in Olivette
The most common levels of schooling among the 2,453 students in Olivette are high school (755 | 30.8%), middle school (573 | 23.4%), and elementary school (456 | 18.6%).
| School Level | # Students | % Students |
| Nursery / Preschool | 150 | 6.1% |
| Kindergarten | 82 | 3.3% |
| Elementary School | 456 | 18.6% |
| Middle School | 573 | 23.4% |
| High School | 755 | 30.8% |
| College / Undergraduate | 334 | 13.6% |
| Graduate / Professional | 103 | 4.2% |
| Total | 2,453 | 100.0% |
School Enrollment by Age by Funding Source in Olivette
Out of a total of 2,453 students who are enrolled in schools in Olivette, 662 (27.0%) attend a private institution, while the remaining 1,791 (73.0%) are enrolled in public schools. The age group of 20 to 24 year olds has the highest likelihood of being enrolled in private schools, with 163 (69.4% in the age bracket) enrolled. Conversely, the age group of 10 to 14 year olds has the lowest likelihood of being enrolled in a private school, with 599 (92.7% in the age bracket) attending a public institution.
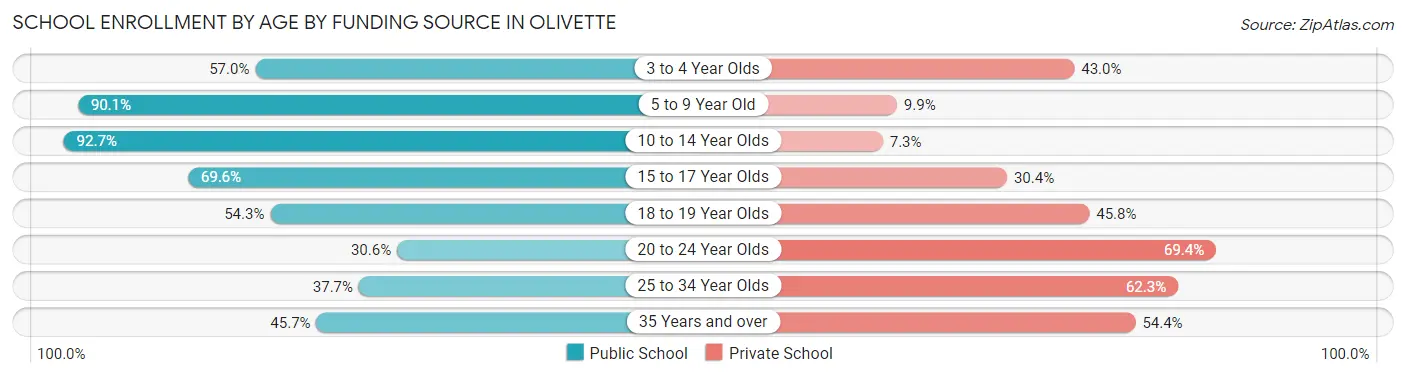
| Age Bracket | Public School | Private School |
| 3 to 4 Year Olds | 81 (57.0%) | 61 (43.0%) |
| 5 to 9 Year Old | 463 (90.1%) | 51 (9.9%) |
| 10 to 14 Year Olds | 599 (92.7%) | 47 (7.3%) |
| 15 to 17 Year Olds | 430 (69.6%) | 188 (30.4%) |
| 18 to 19 Year Olds | 83 (54.2%) | 70 (45.8%) |
| 20 to 24 Year Olds | 72 (30.6%) | 163 (69.4%) |
| 25 to 34 Year Olds | 20 (37.7%) | 33 (62.3%) |
| 35 Years and over | 42 (45.7%) | 50 (54.3%) |
| Total | 1,791 (73.0%) | 662 (27.0%) |
Educational Attainment by Field of Study in Olivette
Business (630 | 15.0%), science & technology (504 | 12.0%), education (484 | 11.5%), social sciences (431 | 10.3%), and arts & humanities (319 | 7.6%) are the most common fields of study among 4,197 individuals in Olivette who have obtained a bachelor's degree or higher.
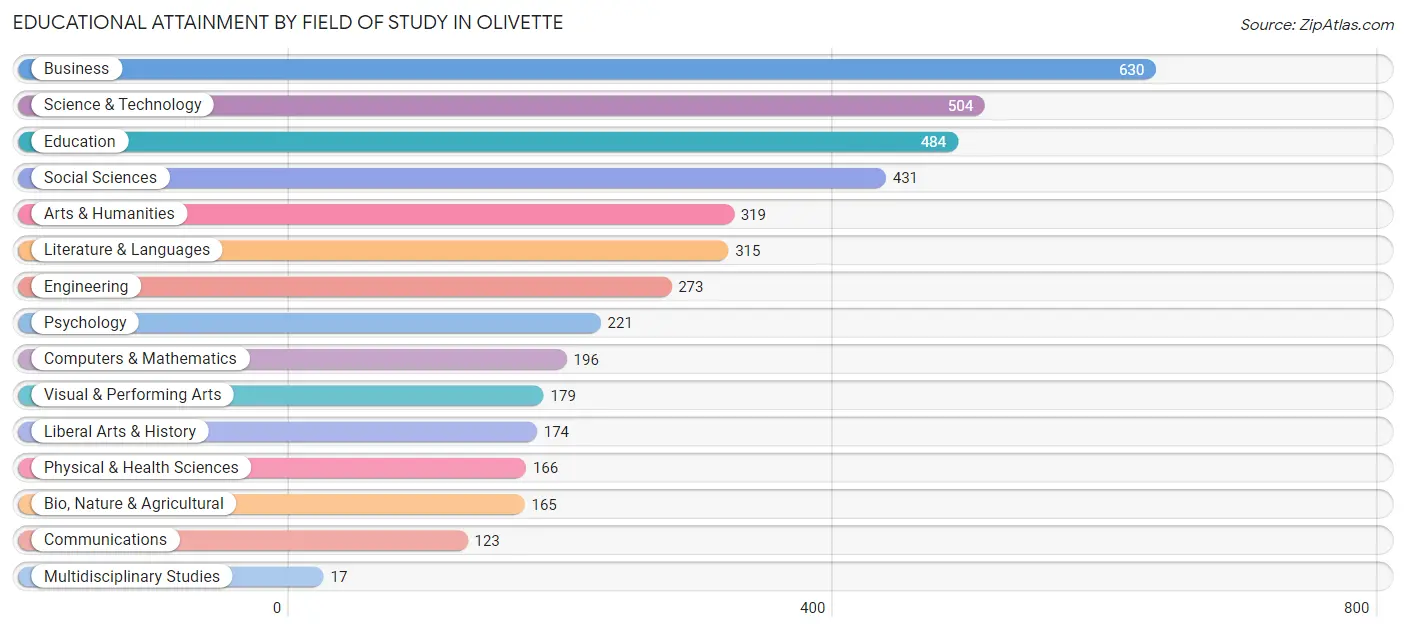
| Field of Study | # Graduates | % Graduates |
| Computers & Mathematics | 196 | 4.7% |
| Bio, Nature & Agricultural | 165 | 3.9% |
| Physical & Health Sciences | 166 | 4.0% |
| Psychology | 221 | 5.3% |
| Social Sciences | 431 | 10.3% |
| Engineering | 273 | 6.5% |
| Multidisciplinary Studies | 17 | 0.4% |
| Science & Technology | 504 | 12.0% |
| Business | 630 | 15.0% |
| Education | 484 | 11.5% |
| Literature & Languages | 315 | 7.5% |
| Liberal Arts & History | 174 | 4.2% |
| Visual & Performing Arts | 179 | 4.3% |
| Communications | 123 | 2.9% |
| Arts & Humanities | 319 | 7.6% |
| Total | 4,197 | 100.0% |
Transportation & Commute in Olivette
Vehicle Availability by Sex in Olivette
The most prevalent vehicle ownership categories in Olivette are males with 2 vehicles (980, accounting for 54.0%) and females with 2 vehicles (1,069, making up 42.3%).
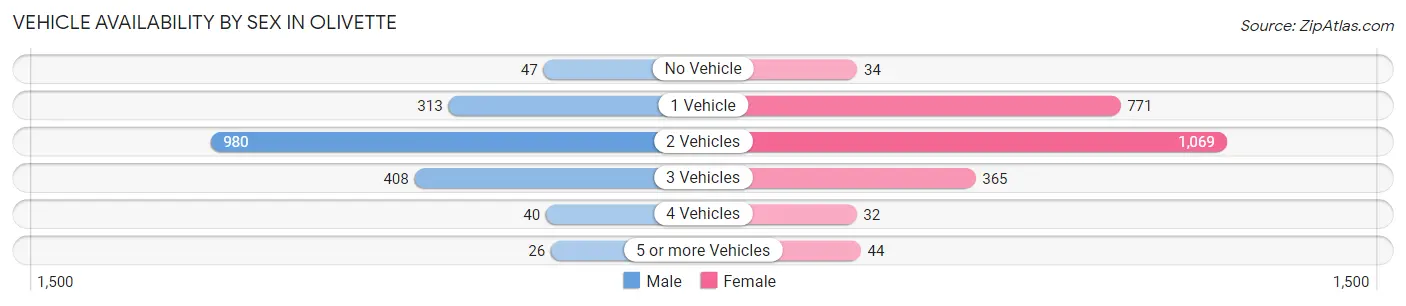
| Vehicles Available | Male | Female |
| No Vehicle | 47 (2.6%) | 34 (1.5%) |
| 1 Vehicle | 313 (17.2%) | 771 (33.3%) |
| 2 Vehicles | 980 (54.0%) | 1,069 (46.2%) |
| 3 Vehicles | 408 (22.5%) | 365 (15.8%) |
| 4 Vehicles | 40 (2.2%) | 32 (1.4%) |
| 5 or more Vehicles | 26 (1.4%) | 44 (1.9%) |
| Total | 1,814 (100.0%) | 2,315 (100.0%) |
Commute Time in Olivette
The most frequently occuring commute durations in Olivette are 15 to 19 minutes (868 commuters, 27.5%), 20 to 24 minutes (739 commuters, 23.4%), and 10 to 14 minutes (540 commuters, 17.1%).
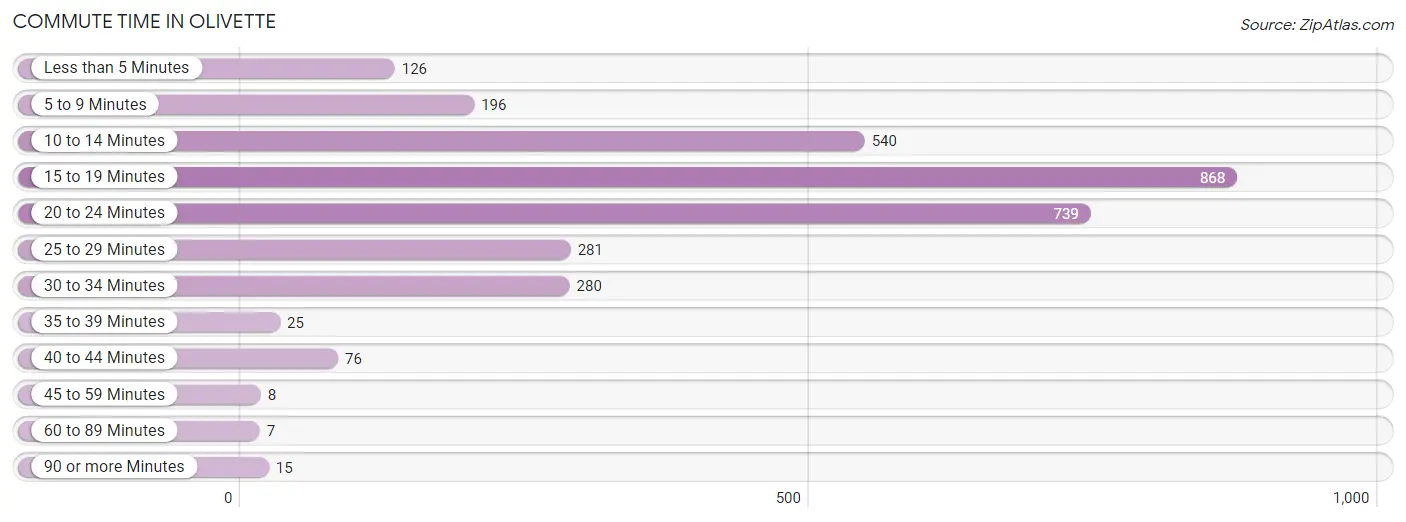
| Commute Time | # Commuters | % Commuters |
| Less than 5 Minutes | 126 | 4.0% |
| 5 to 9 Minutes | 196 | 6.2% |
| 10 to 14 Minutes | 540 | 17.1% |
| 15 to 19 Minutes | 868 | 27.5% |
| 20 to 24 Minutes | 739 | 23.4% |
| 25 to 29 Minutes | 281 | 8.9% |
| 30 to 34 Minutes | 280 | 8.9% |
| 35 to 39 Minutes | 25 | 0.8% |
| 40 to 44 Minutes | 76 | 2.4% |
| 45 to 59 Minutes | 8 | 0.3% |
| 60 to 89 Minutes | 7 | 0.2% |
| 90 or more Minutes | 15 | 0.5% |
Commute Time by Sex in Olivette
The most common commute times in Olivette are 15 to 19 minutes (421 commuters, 26.9%) for males and 15 to 19 minutes (447 commuters, 28.0%) for females.
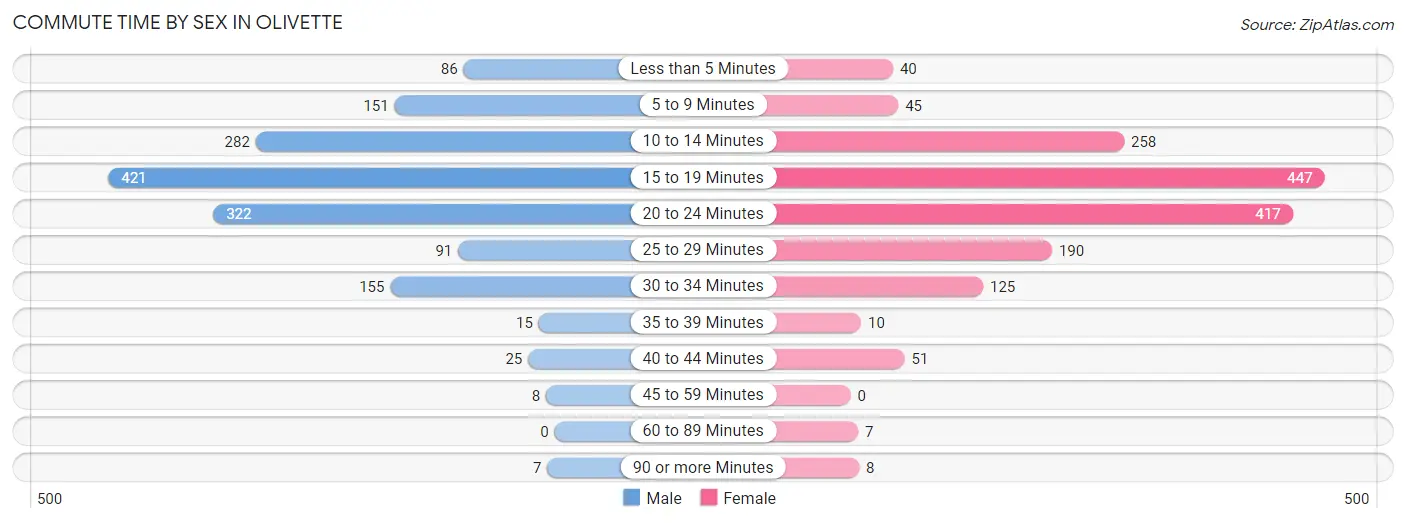
| Commute Time | Male | Female |
| Less than 5 Minutes | 86 (5.5%) | 40 (2.5%) |
| 5 to 9 Minutes | 151 (9.7%) | 45 (2.8%) |
| 10 to 14 Minutes | 282 (18.0%) | 258 (16.2%) |
| 15 to 19 Minutes | 421 (26.9%) | 447 (28.0%) |
| 20 to 24 Minutes | 322 (20.6%) | 417 (26.1%) |
| 25 to 29 Minutes | 91 (5.8%) | 190 (11.9%) |
| 30 to 34 Minutes | 155 (9.9%) | 125 (7.8%) |
| 35 to 39 Minutes | 15 (1.0%) | 10 (0.6%) |
| 40 to 44 Minutes | 25 (1.6%) | 51 (3.2%) |
| 45 to 59 Minutes | 8 (0.5%) | 0 (0.0%) |
| 60 to 89 Minutes | 0 (0.0%) | 7 (0.4%) |
| 90 or more Minutes | 7 (0.4%) | 8 (0.5%) |
Time of Departure to Work by Sex in Olivette
The most frequent times of departure to work in Olivette are 7:30 AM to 7:59 AM (371, 23.7%) for males and 8:00 AM to 8:29 AM (480, 30.0%) for females.
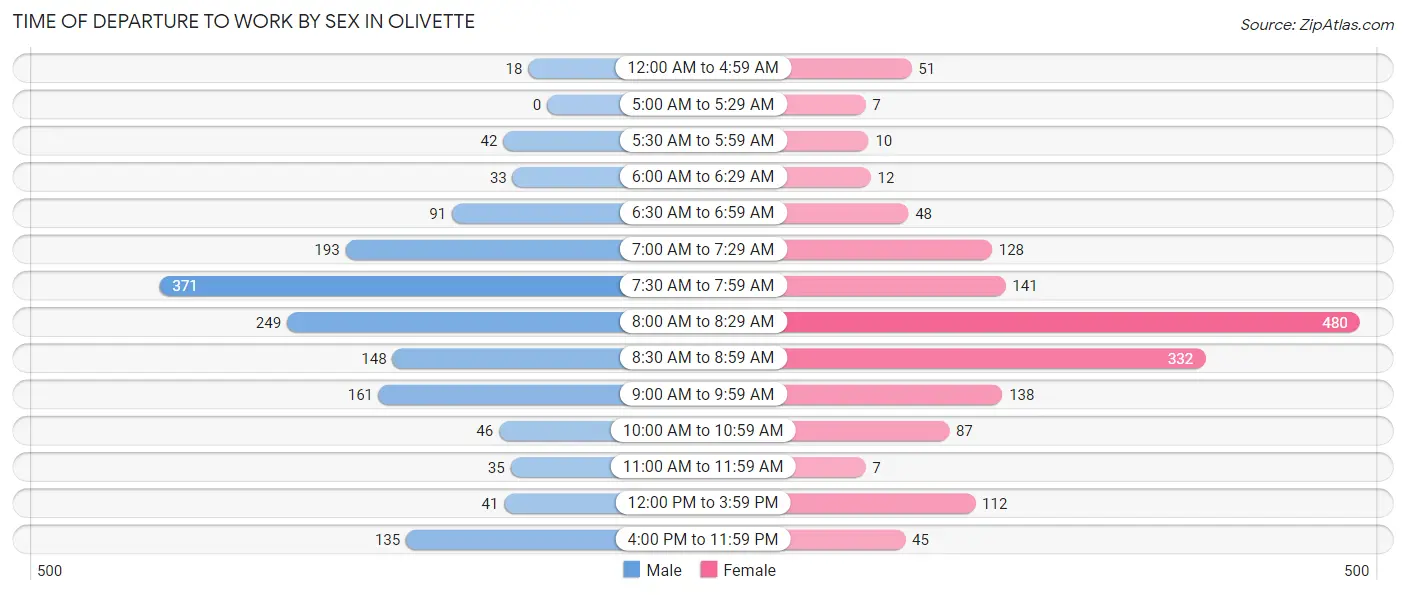
| Time of Departure | Male | Female |
| 12:00 AM to 4:59 AM | 18 (1.1%) | 51 (3.2%) |
| 5:00 AM to 5:29 AM | 0 (0.0%) | 7 (0.4%) |
| 5:30 AM to 5:59 AM | 42 (2.7%) | 10 (0.6%) |
| 6:00 AM to 6:29 AM | 33 (2.1%) | 12 (0.7%) |
| 6:30 AM to 6:59 AM | 91 (5.8%) | 48 (3.0%) |
| 7:00 AM to 7:29 AM | 193 (12.3%) | 128 (8.0%) |
| 7:30 AM to 7:59 AM | 371 (23.7%) | 141 (8.8%) |
| 8:00 AM to 8:29 AM | 249 (15.9%) | 480 (30.0%) |
| 8:30 AM to 8:59 AM | 148 (9.5%) | 332 (20.8%) |
| 9:00 AM to 9:59 AM | 161 (10.3%) | 138 (8.6%) |
| 10:00 AM to 10:59 AM | 46 (2.9%) | 87 (5.4%) |
| 11:00 AM to 11:59 AM | 35 (2.2%) | 7 (0.4%) |
| 12:00 PM to 3:59 PM | 41 (2.6%) | 112 (7.0%) |
| 4:00 PM to 11:59 PM | 135 (8.6%) | 45 (2.8%) |
| Total | 1,563 (100.0%) | 1,598 (100.0%) |
Housing Occupancy in Olivette
Occupancy by Ownership in Olivette
Of the total 3,292 dwellings in Olivette, owner-occupied units account for 2,360 (71.7%), while renter-occupied units make up 932 (28.3%).
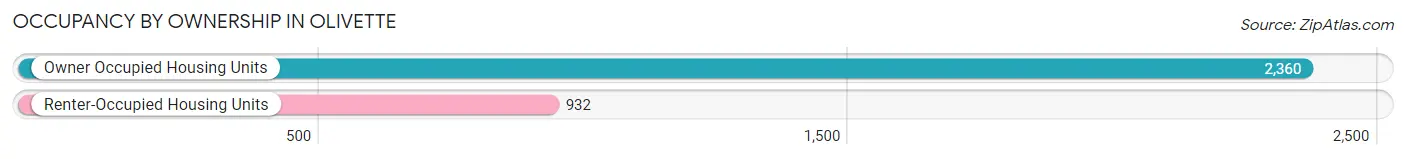
| Occupancy | # Housing Units | % Housing Units |
| Owner Occupied Housing Units | 2,360 | 71.7% |
| Renter-Occupied Housing Units | 932 | 28.3% |
| Total Occupied Housing Units | 3,292 | 100.0% |
Occupancy by Household Size in Olivette
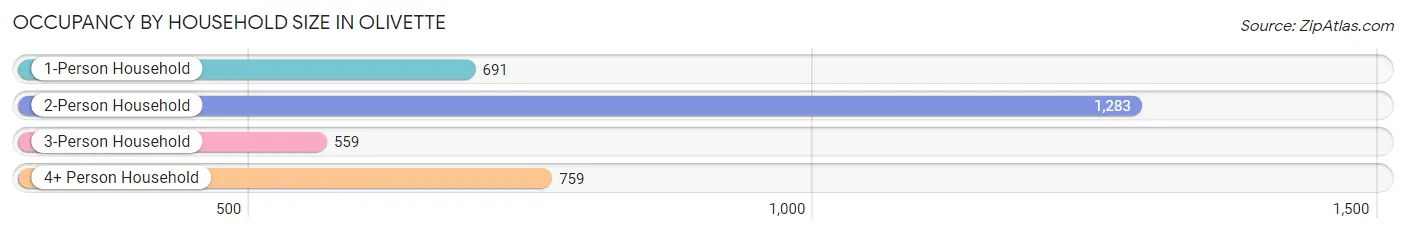
| Household Size | # Housing Units | % Housing Units |
| 1-Person Household | 691 | 21.0% |
| 2-Person Household | 1,283 | 39.0% |
| 3-Person Household | 559 | 17.0% |
| 4+ Person Household | 759 | 23.1% |
| Total Housing Units | 3,292 | 100.0% |
Occupancy by Ownership by Household Size in Olivette
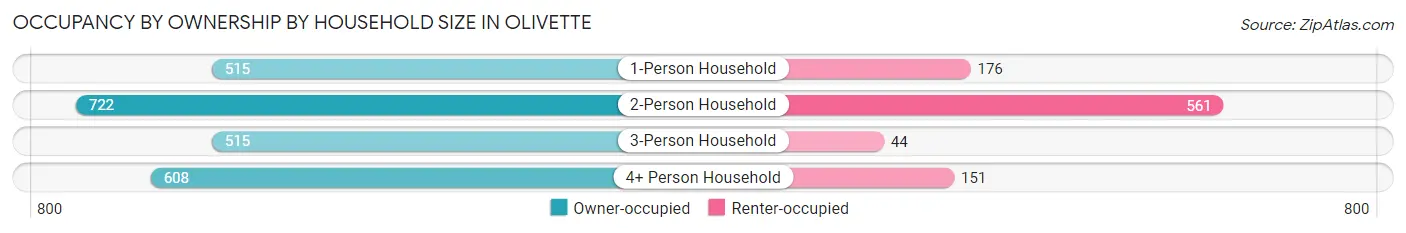
| Household Size | Owner-occupied | Renter-occupied |
| 1-Person Household | 515 (74.5%) | 176 (25.5%) |
| 2-Person Household | 722 (56.3%) | 561 (43.7%) |
| 3-Person Household | 515 (92.1%) | 44 (7.9%) |
| 4+ Person Household | 608 (80.1%) | 151 (19.9%) |
| Total Housing Units | 2,360 (71.7%) | 932 (28.3%) |
Occupancy by Educational Attainment in Olivette
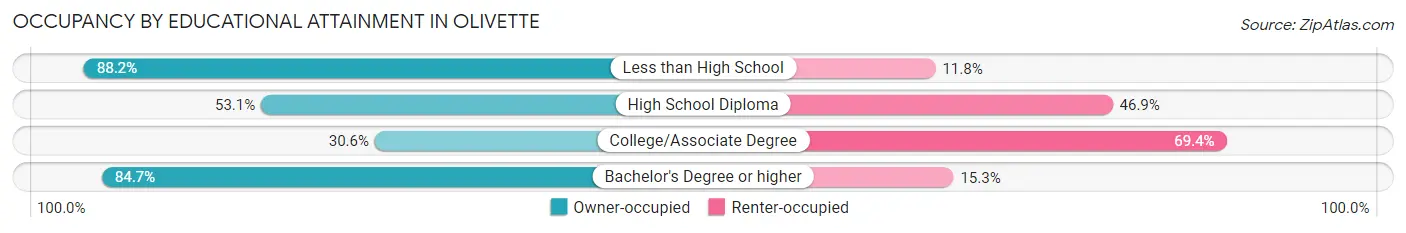
| Household Size | Owner-occupied | Renter-occupied |
| Less than High School | 60 (88.2%) | 8 (11.8%) |
| High School Diploma | 119 (53.1%) | 105 (46.9%) |
| College/Associate Degree | 203 (30.6%) | 461 (69.4%) |
| Bachelor's Degree or higher | 1,978 (84.7%) | 358 (15.3%) |
Occupancy by Age of Householder in Olivette
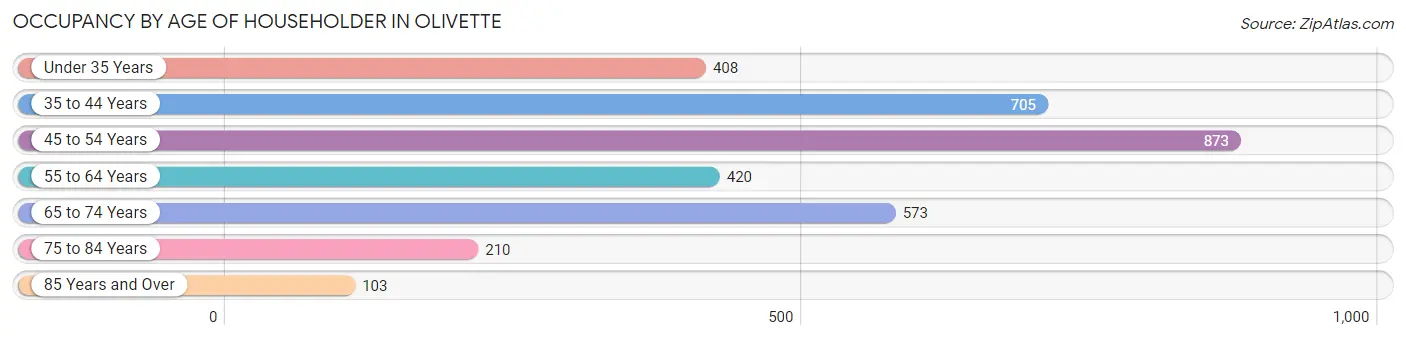
| Age Bracket | # Households | % Households |
| Under 35 Years | 408 | 12.4% |
| 35 to 44 Years | 705 | 21.4% |
| 45 to 54 Years | 873 | 26.5% |
| 55 to 64 Years | 420 | 12.8% |
| 65 to 74 Years | 573 | 17.4% |
| 75 to 84 Years | 210 | 6.4% |
| 85 Years and Over | 103 | 3.1% |
| Total | 3,292 | 100.0% |
Housing Finances in Olivette
Median Income by Occupancy in Olivette
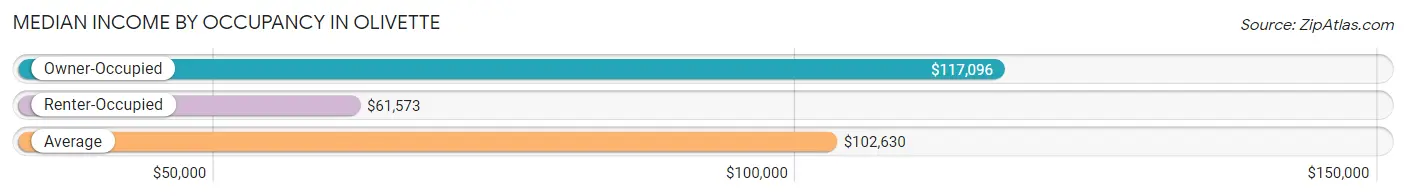
| Occupancy Type | # Households | Median Income |
| Owner-Occupied | 2,360 (71.7%) | $117,096 |
| Renter-Occupied | 932 (28.3%) | $61,573 |
| Average | 3,292 (100.0%) | $102,630 |
Occupancy by Householder Income Bracket in Olivette
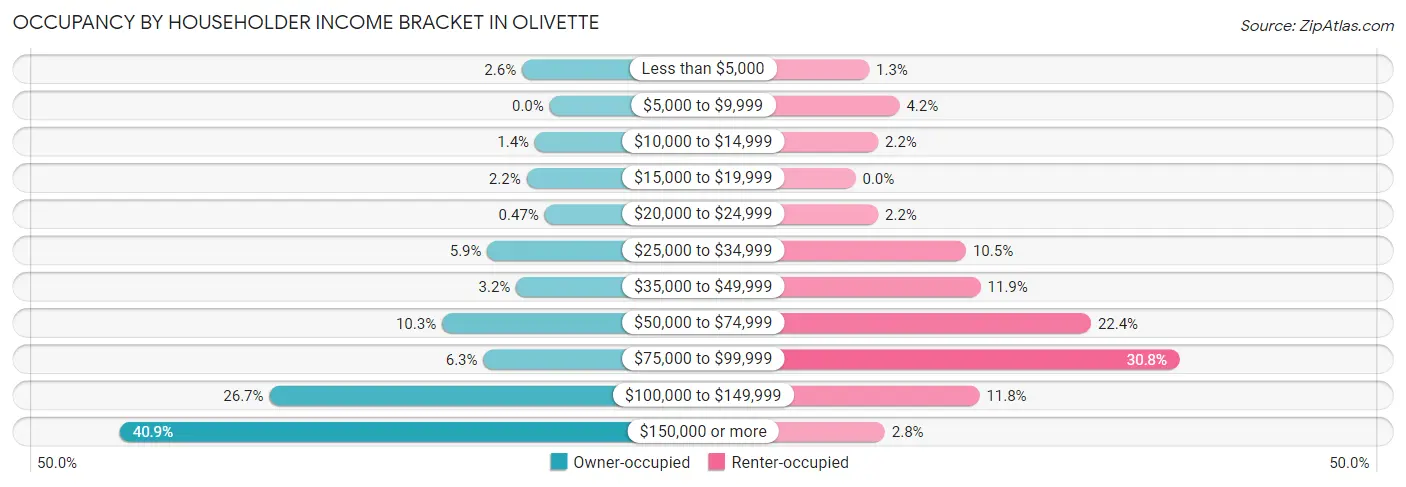
| Income Bracket | Owner-occupied | Renter-occupied |
| Less than $5,000 | 62 (2.6%) | 12 (1.3%) |
| $5,000 to $9,999 | 0 (0.0%) | 39 (4.2%) |
| $10,000 to $14,999 | 33 (1.4%) | 20 (2.1%) |
| $15,000 to $19,999 | 52 (2.2%) | 0 (0.0%) |
| $20,000 to $24,999 | 11 (0.5%) | 20 (2.1%) |
| $25,000 to $34,999 | 140 (5.9%) | 98 (10.5%) |
| $35,000 to $49,999 | 75 (3.2%) | 111 (11.9%) |
| $50,000 to $74,999 | 242 (10.2%) | 209 (22.4%) |
| $75,000 to $99,999 | 149 (6.3%) | 287 (30.8%) |
| $100,000 to $149,999 | 630 (26.7%) | 110 (11.8%) |
| $150,000 or more | 966 (40.9%) | 26 (2.8%) |
| Total | 2,360 (100.0%) | 932 (100.0%) |
Monthly Housing Cost Tiers in Olivette
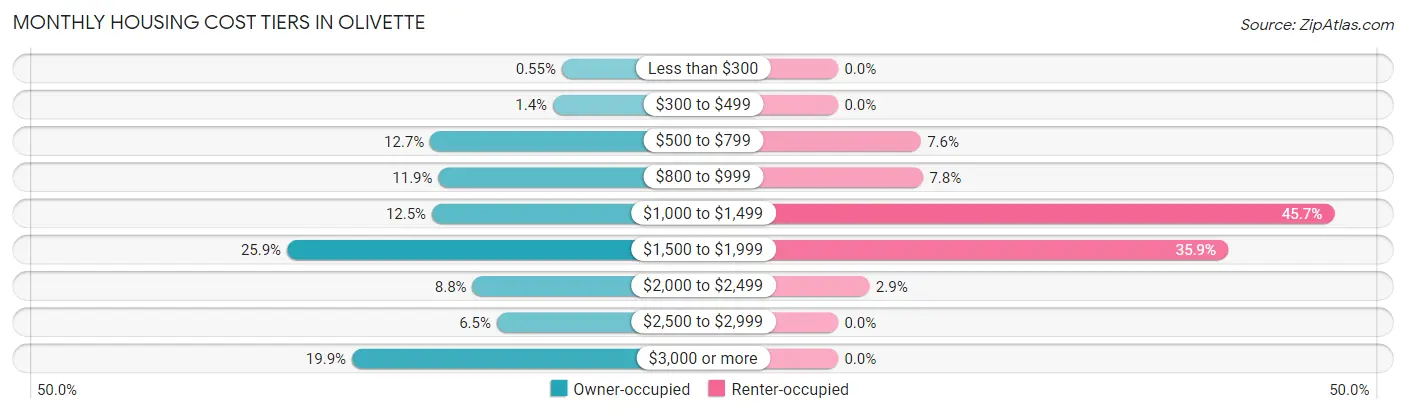
| Monthly Cost | Owner-occupied | Renter-occupied |
| Less than $300 | 13 (0.5%) | 0 (0.0%) |
| $300 to $499 | 32 (1.4%) | 0 (0.0%) |
| $500 to $799 | 299 (12.7%) | 71 (7.6%) |
| $800 to $999 | 281 (11.9%) | 73 (7.8%) |
| $1,000 to $1,499 | 295 (12.5%) | 426 (45.7%) |
| $1,500 to $1,999 | 610 (25.9%) | 335 (35.9%) |
| $2,000 to $2,499 | 207 (8.8%) | 27 (2.9%) |
| $2,500 to $2,999 | 154 (6.5%) | 0 (0.0%) |
| $3,000 or more | 469 (19.9%) | 0 (0.0%) |
| Total | 2,360 (100.0%) | 932 (100.0%) |
Physical Housing Characteristics in Olivette
Housing Structures in Olivette
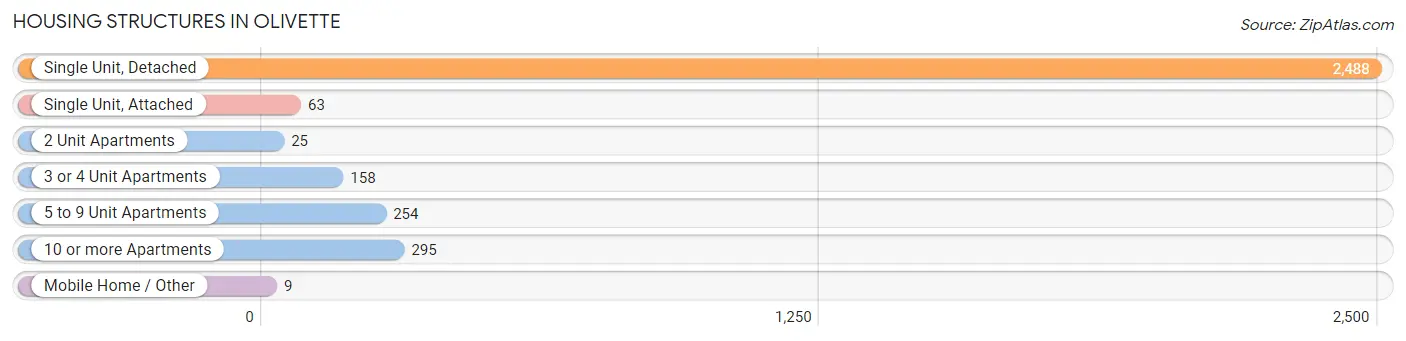
| Structure Type | # Housing Units | % Housing Units |
| Single Unit, Detached | 2,488 | 75.6% |
| Single Unit, Attached | 63 | 1.9% |
| 2 Unit Apartments | 25 | 0.8% |
| 3 or 4 Unit Apartments | 158 | 4.8% |
| 5 to 9 Unit Apartments | 254 | 7.7% |
| 10 or more Apartments | 295 | 9.0% |
| Mobile Home / Other | 9 | 0.3% |
| Total | 3,292 | 100.0% |
Housing Structures by Occupancy in Olivette
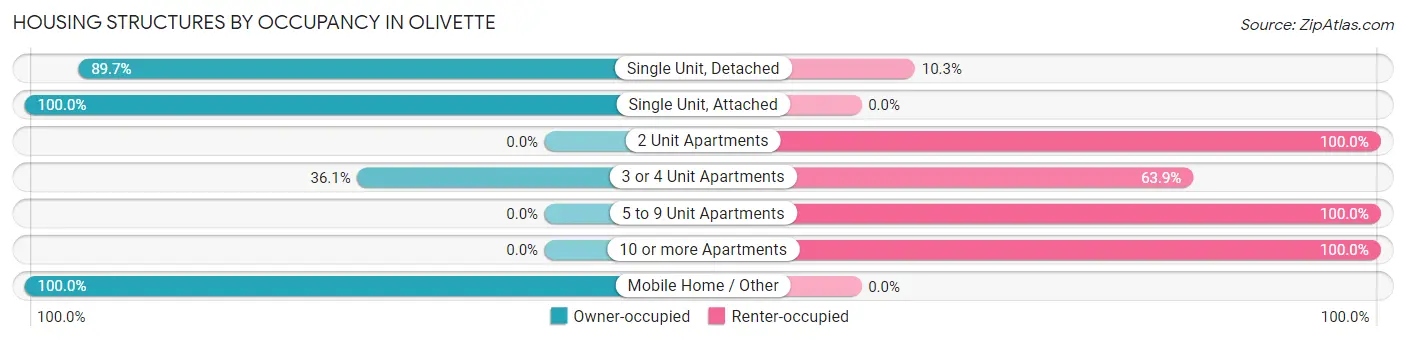
| Structure Type | Owner-occupied | Renter-occupied |
| Single Unit, Detached | 2,231 (89.7%) | 257 (10.3%) |
| Single Unit, Attached | 63 (100.0%) | 0 (0.0%) |
| 2 Unit Apartments | 0 (0.0%) | 25 (100.0%) |
| 3 or 4 Unit Apartments | 57 (36.1%) | 101 (63.9%) |
| 5 to 9 Unit Apartments | 0 (0.0%) | 254 (100.0%) |
| 10 or more Apartments | 0 (0.0%) | 295 (100.0%) |
| Mobile Home / Other | 9 (100.0%) | 0 (0.0%) |
| Total | 2,360 (71.7%) | 932 (28.3%) |
Housing Structures by Number of Rooms in Olivette
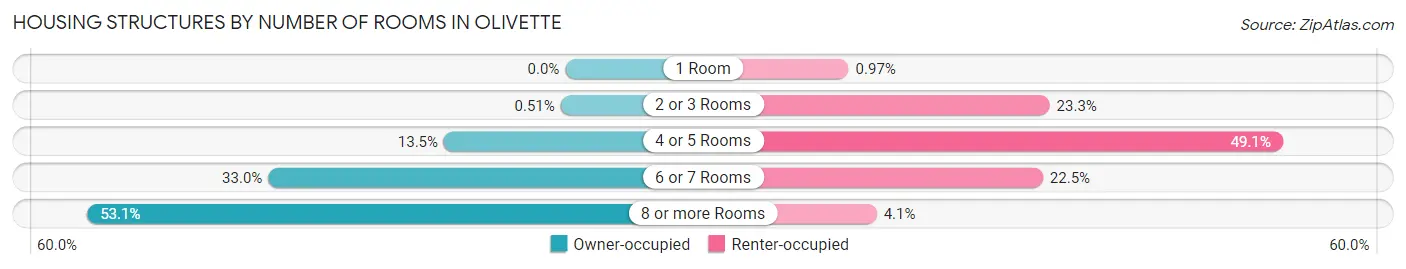
| Number of Rooms | Owner-occupied | Renter-occupied |
| 1 Room | 0 (0.0%) | 9 (1.0%) |
| 2 or 3 Rooms | 12 (0.5%) | 217 (23.3%) |
| 4 or 5 Rooms | 318 (13.5%) | 458 (49.1%) |
| 6 or 7 Rooms | 778 (33.0%) | 210 (22.5%) |
| 8 or more Rooms | 1,252 (53.0%) | 38 (4.1%) |
| Total | 2,360 (100.0%) | 932 (100.0%) |
Housing Structure by Heating Type in Olivette
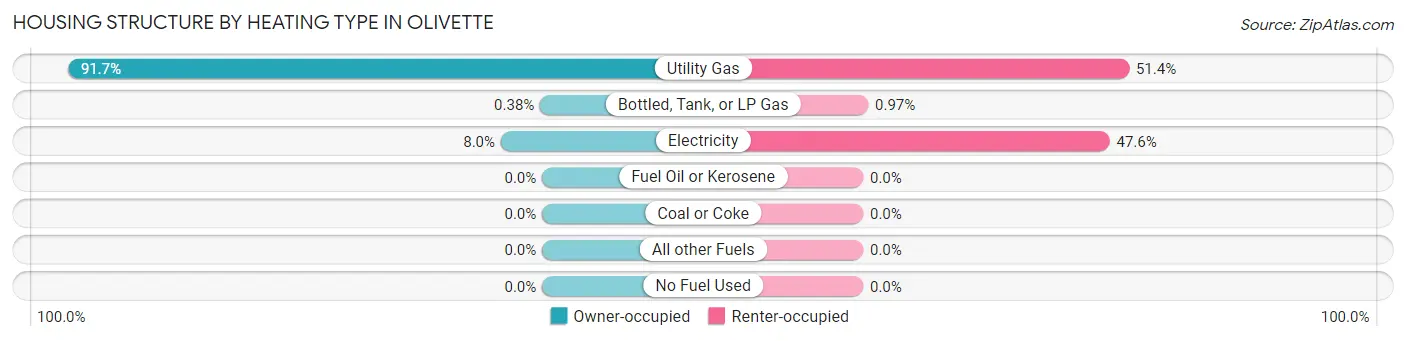
| Heating Type | Owner-occupied | Renter-occupied |
| Utility Gas | 2,163 (91.6%) | 479 (51.4%) |
| Bottled, Tank, or LP Gas | 9 (0.4%) | 9 (1.0%) |
| Electricity | 188 (8.0%) | 444 (47.6%) |
| Fuel Oil or Kerosene | 0 (0.0%) | 0 (0.0%) |
| Coal or Coke | 0 (0.0%) | 0 (0.0%) |
| All other Fuels | 0 (0.0%) | 0 (0.0%) |
| No Fuel Used | 0 (0.0%) | 0 (0.0%) |
| Total | 2,360 (100.0%) | 932 (100.0%) |
Household Vehicle Usage in Olivette
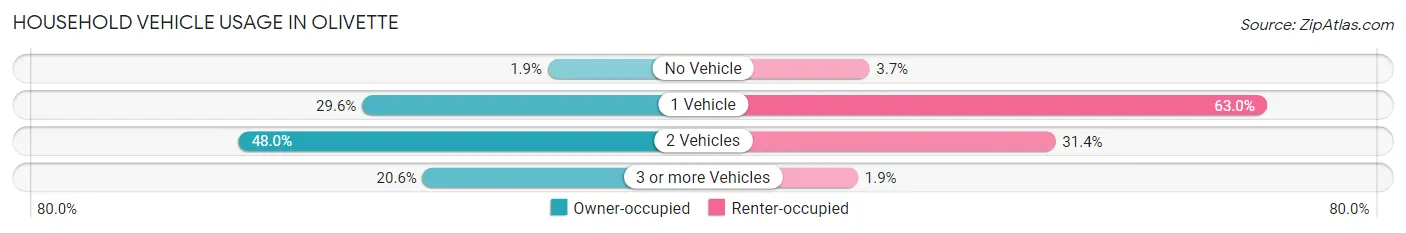
| Vehicles per Household | Owner-occupied | Renter-occupied |
| No Vehicle | 44 (1.9%) | 34 (3.6%) |
| 1 Vehicle | 698 (29.6%) | 587 (63.0%) |
| 2 Vehicles | 1,133 (48.0%) | 293 (31.4%) |
| 3 or more Vehicles | 485 (20.5%) | 18 (1.9%) |
| Total | 2,360 (100.0%) | 932 (100.0%) |
Real Estate & Mortgages in Olivette
Real Estate and Mortgage Overview in Olivette
| Characteristic | Without Mortgage | With Mortgage |
| Housing Units | 834 | 1,526 |
| Median Property Value | $447,600 | $466,500 |
| Median Household Income | $103,426 | $744 |
| Monthly Housing Costs | $853 | $469 |
| Real Estate Taxes | $5,212 | $0 |
Property Value by Mortgage Status in Olivette
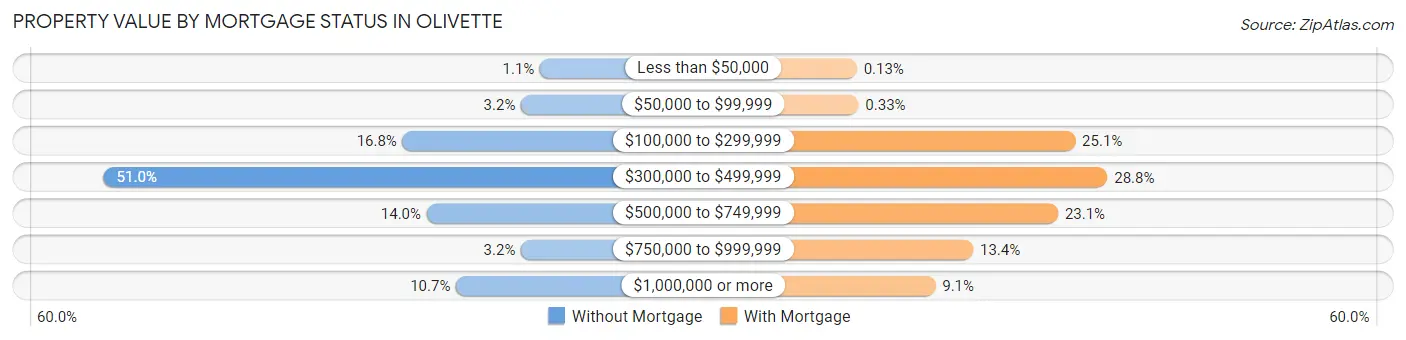
| Property Value | Without Mortgage | With Mortgage |
| Less than $50,000 | 9 (1.1%) | 2 (0.1%) |
| $50,000 to $99,999 | 27 (3.2%) | 5 (0.3%) |
| $100,000 to $299,999 | 140 (16.8%) | 383 (25.1%) |
| $300,000 to $499,999 | 425 (51.0%) | 439 (28.8%) |
| $500,000 to $749,999 | 117 (14.0%) | 353 (23.1%) |
| $750,000 to $999,999 | 27 (3.2%) | 205 (13.4%) |
| $1,000,000 or more | 89 (10.7%) | 139 (9.1%) |
| Total | 834 (100.0%) | 1,526 (100.0%) |
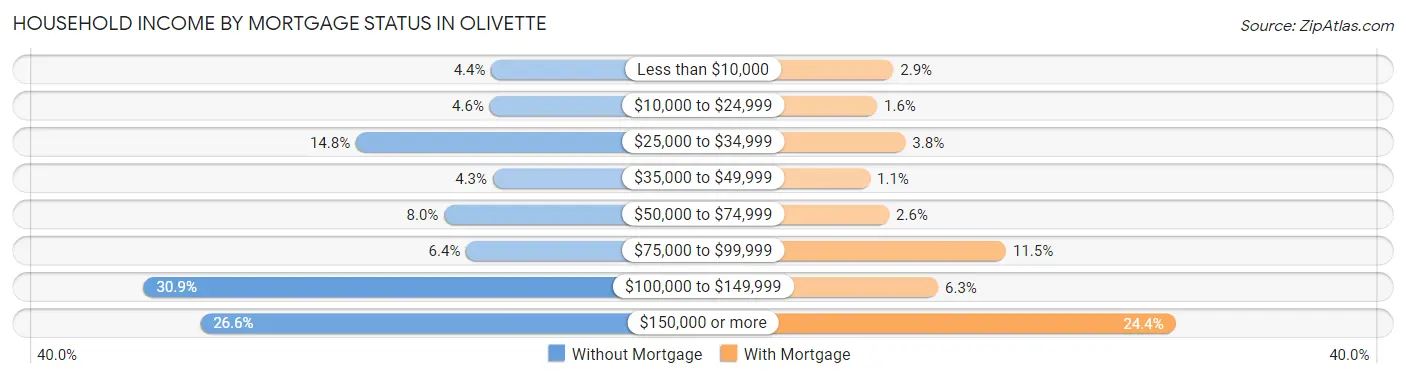
Household Income by Mortgage Status in Olivette
| Household Income | Without Mortgage | With Mortgage |
| Less than $10,000 | 37 (4.4%) | 44 (2.9%) |
| $10,000 to $24,999 | 38 (4.6%) | 25 (1.6%) |
| $25,000 to $34,999 | 123 (14.7%) | 58 (3.8%) |
| $35,000 to $49,999 | 36 (4.3%) | 17 (1.1%) |
| $50,000 to $74,999 | 67 (8.0%) | 39 (2.6%) |
| $75,000 to $99,999 | 53 (6.4%) | 175 (11.5%) |
| $100,000 to $149,999 | 258 (30.9%) | 96 (6.3%) |
| $150,000 or more | 222 (26.6%) | 372 (24.4%) |
| Total | 834 (100.0%) | 1,526 (100.0%) |
Property Value to Household Income Ratio in Olivette
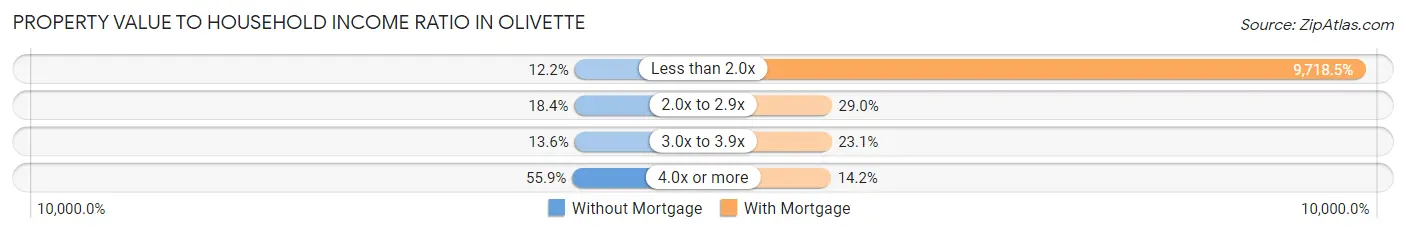
| Value-to-Income Ratio | Without Mortgage | With Mortgage |
| Less than 2.0x | 102 (12.2%) | 148,304 (9,718.5%) |
| 2.0x to 2.9x | 153 (18.3%) | 443 (29.0%) |
| 3.0x to 3.9x | 113 (13.6%) | 353 (23.1%) |
| 4.0x or more | 466 (55.9%) | 216 (14.1%) |
| Total | 834 (100.0%) | 1,526 (100.0%) |
Real Estate Taxes by Mortgage Status in Olivette
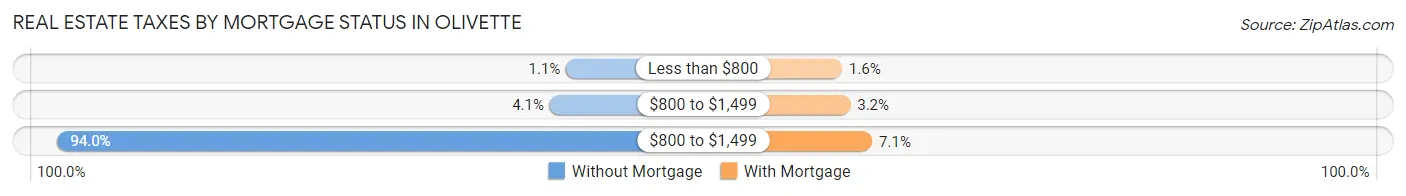
| Property Taxes | Without Mortgage | With Mortgage |
| Less than $800 | 9 (1.1%) | 25 (1.6%) |
| $800 to $1,499 | 34 (4.1%) | 48 (3.2%) |
| $800 to $1,499 | 784 (94.0%) | 109 (7.1%) |
| Total | 834 (100.0%) | 1,526 (100.0%) |
Health & Disability in Olivette
Health Insurance Coverage by Age in Olivette
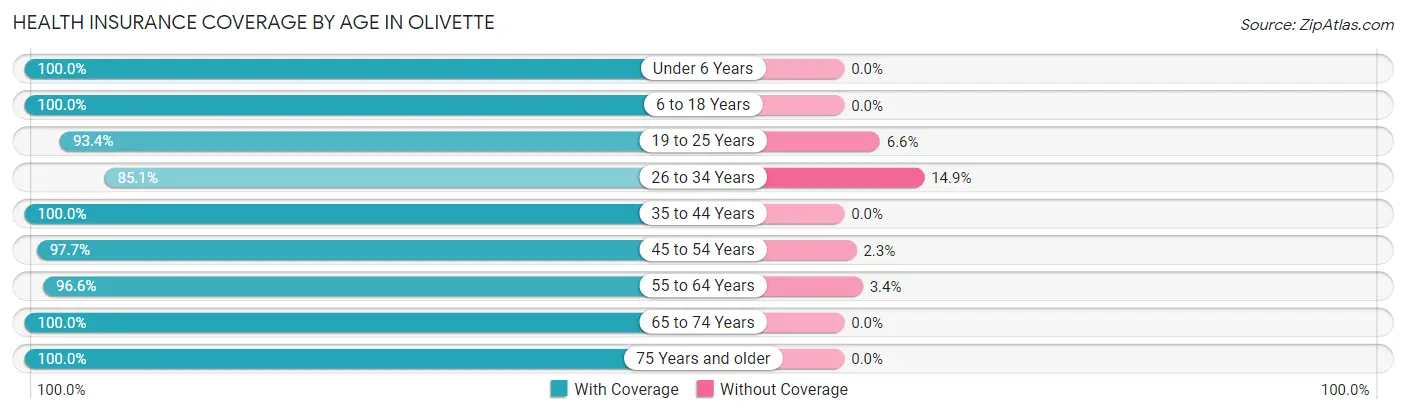
| Age Bracket | With Coverage | Without Coverage |
| Under 6 Years | 474 (100.0%) | 0 (0.0%) |
| 6 to 18 Years | 1,895 (100.0%) | 0 (0.0%) |
| 19 to 25 Years | 423 (93.4%) | 30 (6.6%) |
| 26 to 34 Years | 582 (85.1%) | 102 (14.9%) |
| 35 to 44 Years | 1,223 (100.0%) | 0 (0.0%) |
| 45 to 54 Years | 1,292 (97.7%) | 30 (2.3%) |
| 55 to 64 Years | 843 (96.6%) | 30 (3.4%) |
| 65 to 74 Years | 953 (100.0%) | 0 (0.0%) |
| 75 Years and older | 548 (100.0%) | 0 (0.0%) |
| Total | 8,233 (97.7%) | 192 (2.3%) |
Health Insurance Coverage by Citizenship Status in Olivette
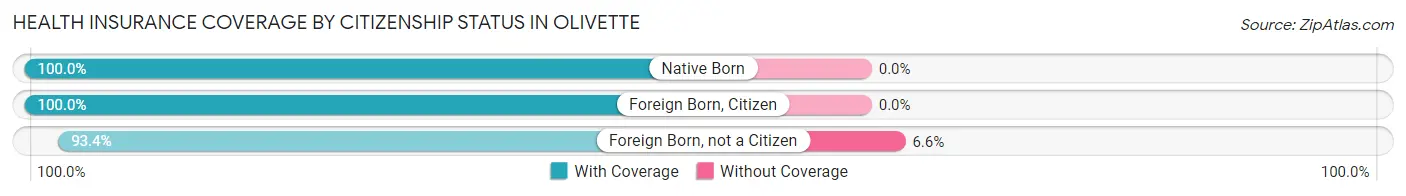
| Citizenship Status | With Coverage | Without Coverage |
| Native Born | 474 (100.0%) | 0 (0.0%) |
| Foreign Born, Citizen | 1,895 (100.0%) | 0 (0.0%) |
| Foreign Born, not a Citizen | 423 (93.4%) | 30 (6.6%) |
Health Insurance Coverage by Household Income in Olivette
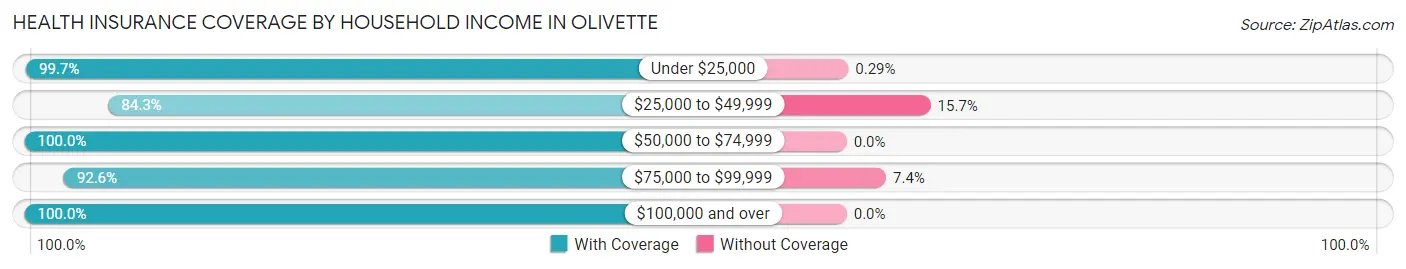
| Household Income | With Coverage | Without Coverage |
| Under $25,000 | 343 (99.7%) | 1 (0.3%) |
| $25,000 to $49,999 | 649 (84.3%) | 121 (15.7%) |
| $50,000 to $74,999 | 1,131 (100.0%) | 0 (0.0%) |
| $75,000 to $99,999 | 881 (92.6%) | 70 (7.4%) |
| $100,000 and over | 5,229 (100.0%) | 0 (0.0%) |
Public vs Private Health Insurance Coverage by Age in Olivette
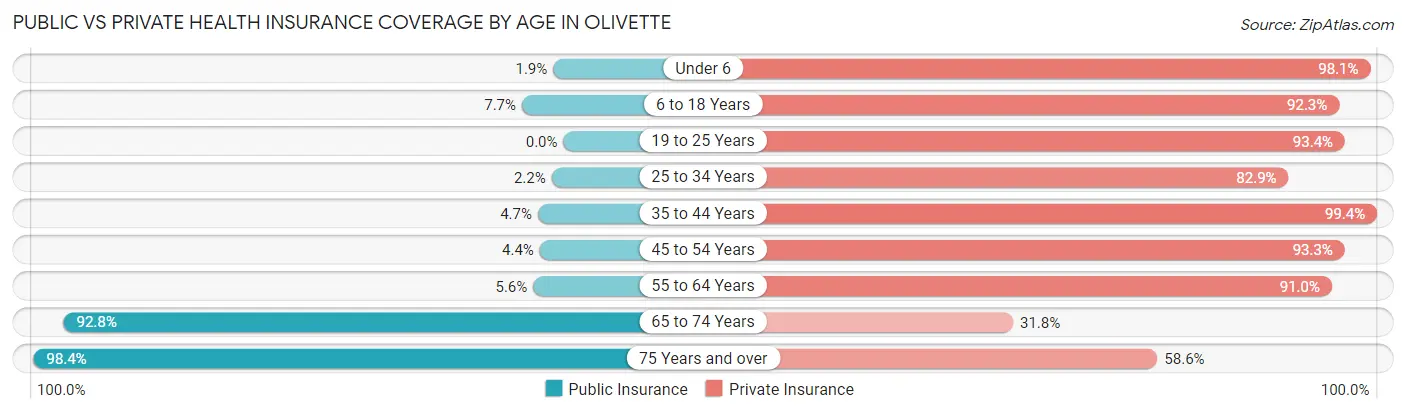
| Age Bracket | Public Insurance | Private Insurance |
| Under 6 | 9 (1.9%) | 465 (98.1%) |
| 6 to 18 Years | 146 (7.7%) | 1,749 (92.3%) |
| 19 to 25 Years | 0 (0.0%) | 423 (93.4%) |
| 25 to 34 Years | 15 (2.2%) | 567 (82.9%) |
| 35 to 44 Years | 58 (4.7%) | 1,215 (99.4%) |
| 45 to 54 Years | 58 (4.4%) | 1,234 (93.3%) |
| 55 to 64 Years | 49 (5.6%) | 794 (90.9%) |
| 65 to 74 Years | 884 (92.8%) | 303 (31.8%) |
| 75 Years and over | 539 (98.4%) | 321 (58.6%) |
| Total | 1,758 (20.9%) | 7,071 (83.9%) |
Disability Status by Sex by Age in Olivette
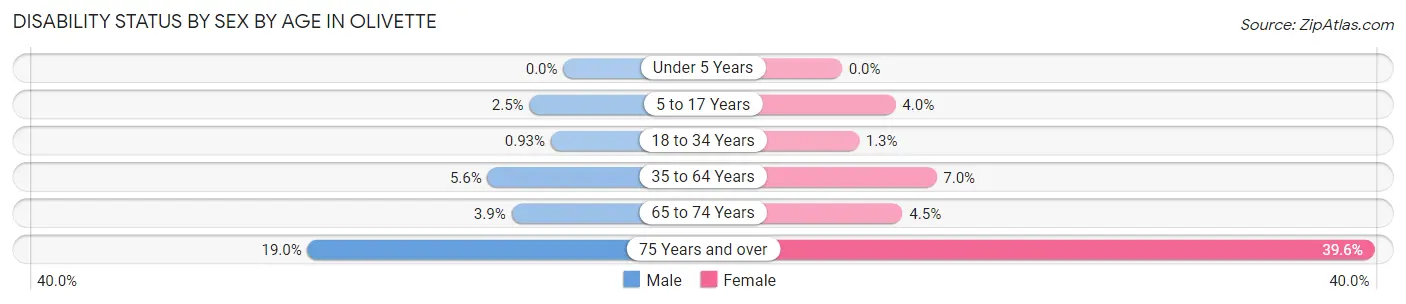
| Age Bracket | Male | Female |
| Under 5 Years | 0 (0.0%) | 0 (0.0%) |
| 5 to 17 Years | 27 (2.5%) | 30 (4.0%) |
| 18 to 34 Years | 5 (0.9%) | 9 (1.3%) |
| 35 to 64 Years | 85 (5.6%) | 134 (7.0%) |
| 65 to 74 Years | 17 (3.8%) | 23 (4.5%) |
| 75 Years and over | 45 (19.0%) | 123 (39.6%) |
Disability Class by Sex by Age in Olivette
Disability Class: Hearing Difficulty
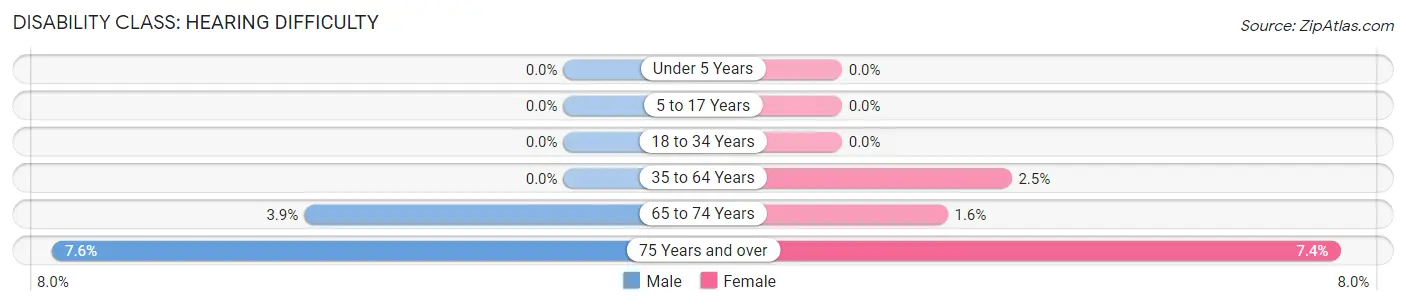
| Age Bracket | Male | Female |
| Under 5 Years | 0 (0.0%) | 0 (0.0%) |
| 5 to 17 Years | 0 (0.0%) | 0 (0.0%) |
| 18 to 34 Years | 0 (0.0%) | 0 (0.0%) |
| 35 to 64 Years | 0 (0.0%) | 48 (2.5%) |
| 65 to 74 Years | 17 (3.8%) | 8 (1.6%) |
| 75 Years and over | 18 (7.6%) | 23 (7.4%) |
Disability Class: Vision Difficulty
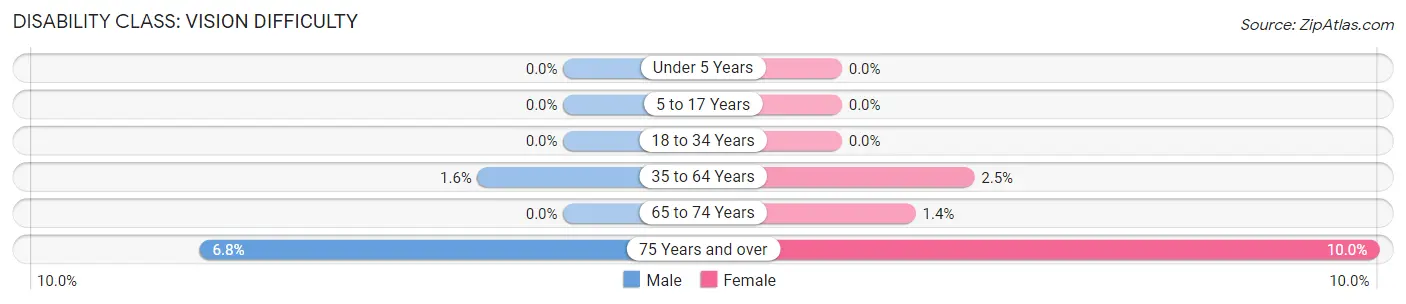
| Age Bracket | Male | Female |
| Under 5 Years | 0 (0.0%) | 0 (0.0%) |
| 5 to 17 Years | 0 (0.0%) | 0 (0.0%) |
| 18 to 34 Years | 0 (0.0%) | 0 (0.0%) |
| 35 to 64 Years | 24 (1.6%) | 47 (2.5%) |
| 65 to 74 Years | 0 (0.0%) | 7 (1.4%) |
| 75 Years and over | 16 (6.8%) | 31 (10.0%) |
Disability Class: Cognitive Difficulty
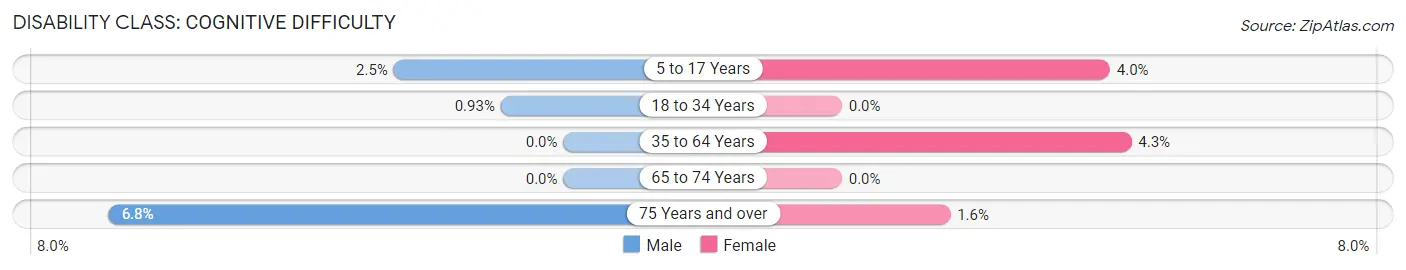
| Age Bracket | Male | Female |
| 5 to 17 Years | 27 (2.5%) | 30 (4.0%) |
| 18 to 34 Years | 5 (0.9%) | 0 (0.0%) |
| 35 to 64 Years | 0 (0.0%) | 82 (4.3%) |
| 65 to 74 Years | 0 (0.0%) | 0 (0.0%) |
| 75 Years and over | 16 (6.8%) | 5 (1.6%) |
Disability Class: Ambulatory Difficulty
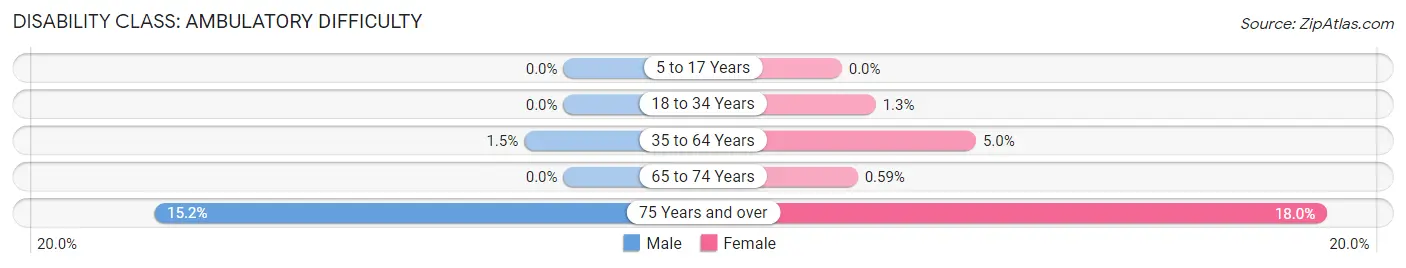
| Age Bracket | Male | Female |
| 5 to 17 Years | 0 (0.0%) | 0 (0.0%) |
| 18 to 34 Years | 0 (0.0%) | 9 (1.3%) |
| 35 to 64 Years | 22 (1.5%) | 95 (5.0%) |
| 65 to 74 Years | 0 (0.0%) | 3 (0.6%) |
| 75 Years and over | 36 (15.2%) | 56 (18.0%) |
Disability Class: Self-Care Difficulty
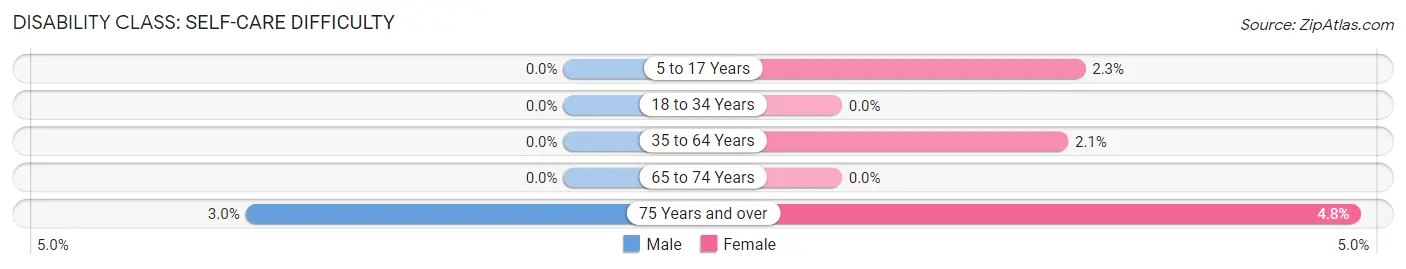
| Age Bracket | Male | Female |
| 5 to 17 Years | 0 (0.0%) | 17 (2.3%) |
| 18 to 34 Years | 0 (0.0%) | 0 (0.0%) |
| 35 to 64 Years | 0 (0.0%) | 40 (2.1%) |
| 65 to 74 Years | 0 (0.0%) | 0 (0.0%) |
| 75 Years and over | 7 (2.9%) | 15 (4.8%) |
Technology Access in Olivette
Computing Device Access in Olivette
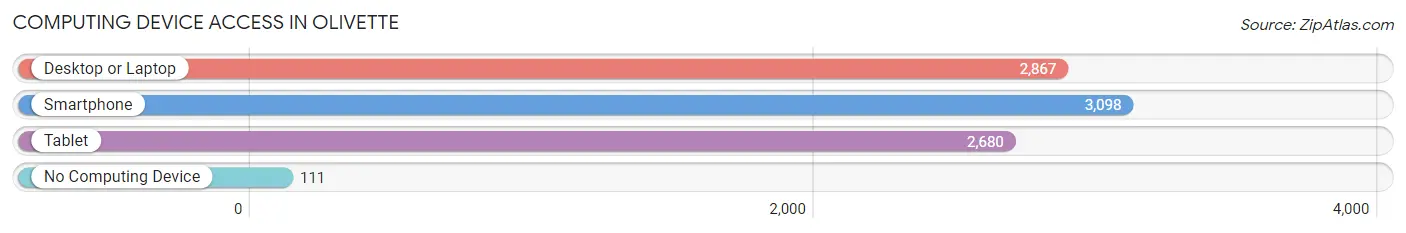
| Device Type | # Households | % Households |
| Desktop or Laptop | 2,867 | 87.1% |
| Smartphone | 3,098 | 94.1% |
| Tablet | 2,680 | 81.4% |
| No Computing Device | 111 | 3.4% |
| Total | 3,292 | 100.0% |
Internet Access in Olivette
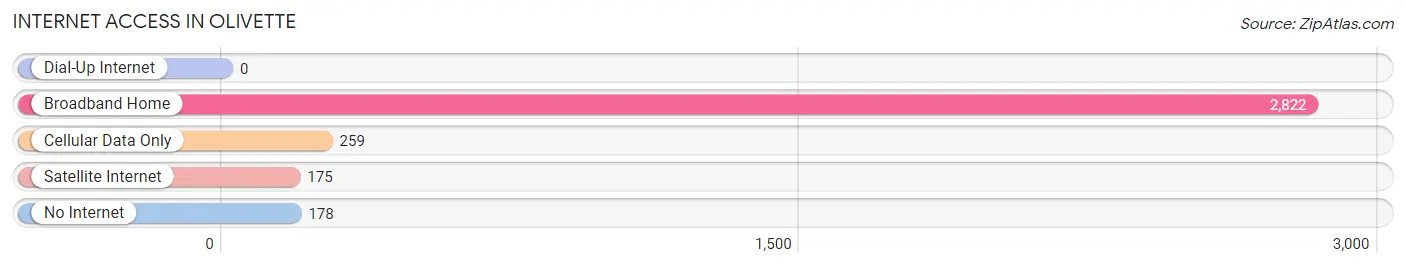
| Internet Type | # Households | % Households |
| Dial-Up Internet | 0 | 0.0% |
| Broadband Home | 2,822 | 85.7% |
| Cellular Data Only | 259 | 7.9% |
| Satellite Internet | 175 | 5.3% |
| No Internet | 178 | 5.4% |
| Total | 3,292 | 100.0% |
Olivette Summary
Olivette, Missouri is a small city located in St. Louis County, Missouri. It is situated just west of the city of St. Louis and is part of the Greater St. Louis metropolitan area. The city has a population of 7,737 as of the 2010 census, making it the smallest city in St. Louis County.
History
Olivette was founded in 1894 by a group of German immigrants who had recently arrived in the United States. The city was named after the olive trees that were planted in the area by the settlers. The city was incorporated in 1925 and has since grown to become a thriving community.
Geography
Olivette is located at 38°40'25" North, 90°22'45" West (38.673611, -90.379167). The city has a total area of 2.2 square miles, all of which is land. The city is bordered by the cities of St. Louis, University City, and Ladue.
Economy
Olivette is home to a variety of businesses, including retail stores, restaurants, and professional services. The city is also home to several corporate headquarters, including the headquarters of the St. Louis-based company, Express Scripts. The city also has a number of industrial and manufacturing businesses, including the manufacturing plant of the company, Emerson Electric.
Demographics
As of the 2010 census, the population of Olivette was 7,737. The racial makeup of the city was 79.2% White, 11.2% African American, 0.3% Native American, 4.2% Asian, 0.1% Pacific Islander, 1.7% from other races, and 3.3% from two or more races. Hispanic or Latino of any race were 4.2% of the population.
The median income for a household in the city was $60,945, and the median income for a family was $76,945. The per capita income for the city was $32,945. About 4.2% of families and 5.7% of the population were below the poverty line, including 6.2% of those under age 18 and 4.2% of those age 65 or over.
Conclusion
Olivette, Missouri is a small city located in St. Louis County, Missouri. It is situated just west of the city of St. Louis and is part of the Greater St. Louis metropolitan area. The city has a population of 7,737 as of the 2010 census, making it the smallest city in St. Louis County. Olivette was founded in 1894 by a group of German immigrants and has since grown to become a thriving community. The city is home to a variety of businesses, including retail stores, restaurants, and professional services. The city also has a number of industrial and manufacturing businesses. The population of Olivette is 79.2% White, 11.2% African American, 0.3% Native American, 4.2% Asian, 0.1% Pacific Islander, 1.7% from other races, and 3.3% from two or more races. The median income for a household in the city was $60,945, and the median income for a family was $76,945. Olivette is a vibrant and diverse city that offers a variety of opportunities for its residents.
Common Questions
What is Per Capita Income in Olivette?
Per Capita income in Olivette is $57,308.
What is the Median Family Income in Olivette?
Median Family Income in Olivette is $117,692.
What is the Median Household income in Olivette?
Median Household Income in Olivette is $102,630.
What is Income or Wage Gap in Olivette?
Income or Wage Gap in Olivette is 16.7%.
Women in Olivette earn 83.3 cents for every dollar earned by a man.
What is Inequality or Gini Index in Olivette?
Inequality or Gini Index in Olivette is 0.47.
What is the Total Population of Olivette?
Total Population of Olivette is 8,431.
What is the Total Male Population of Olivette?
Total Male Population of Olivette is 4,028.
What is the Total Female Population of Olivette?
Total Female Population of Olivette is 4,403.
What is the Ratio of Males per 100 Females in Olivette?
There are 91.48 Males per 100 Females in Olivette.
What is the Ratio of Females per 100 Males in Olivette?
There are 109.31 Females per 100 Males in Olivette.
What is the Median Population Age in Olivette?
Median Population Age in Olivette is 41.1 Years.
What is the Average Family Size in Olivette
Average Family Size in Olivette is 3.1 People.
What is the Average Household Size in Olivette
Average Household Size in Olivette is 2.6 People.
How Large is the Labor Force in Olivette?
There are 4,412 People in the Labor Forcein in Olivette.
What is the Percentage of People in the Labor Force in Olivette?
68.4% of People are in the Labor Force in Olivette.
What is the Unemployment Rate in Olivette?
Unemployment Rate in Olivette is 5.1%.