Crystal Lake Park, MO Map & Demographics
Crystal Lake Park Map
Crystal Lake Park Overview
$86,381
PER CAPITA INCOME
$155,750
AVG FAMILY INCOME
$144,583
AVG HOUSEHOLD INCOME
40.2%
WAGE / INCOME GAP [ % ]
59.8¢/ $1
WAGE / INCOME GAP [ $ ]
0.47
INEQUALITY / GINI INDEX
460
TOTAL POPULATION
200
MALE POPULATION
260
FEMALE POPULATION
76.92
MALES / 100 FEMALES
130.00
FEMALES / 100 MALES
52.7
MEDIAN AGE
3.0
AVG FAMILY SIZE
2.3
AVG HOUSEHOLD SIZE
193
LABOR FORCE [ PEOPLE ]
52.4%
PERCENT IN LABOR FORCE
1.6%
UNEMPLOYMENT RATE
Income in Crystal Lake Park
Income Overview in Crystal Lake Park
Per Capita Income in Crystal Lake Park is $86,381, while median incomes of families and households are $155,750 and $144,583 respectively.
| Characteristic | Number | Measure |
| Per Capita Income | 460 | $86,381 |
| Median Family Income | 129 | $155,750 |
| Mean Family Income | 129 | $224,558 |
| Median Household Income | 200 | $144,583 |
| Mean Household Income | 200 | $198,048 |
| Income Deficit | 129 | $0 |
| Wage / Income Gap (%) | 460 | 40.23% |
| Wage / Income Gap ($) | 460 | 59.77¢ per $1 |
| Gini / Inequality Index | 460 | 0.47 |
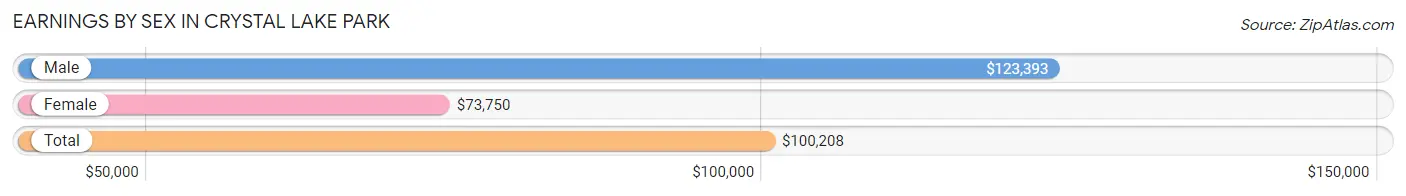
Earnings by Sex in Crystal Lake Park
Average Earnings in Crystal Lake Park are $100,208, $123,393 for men and $73,750 for women, a difference of 40.2%.
| Sex | Number | Average Earnings |
| Male | 97 (46.9%) | $123,393 |
| Female | 110 (53.1%) | $73,750 |
| Total | 207 (100.0%) | $100,208 |
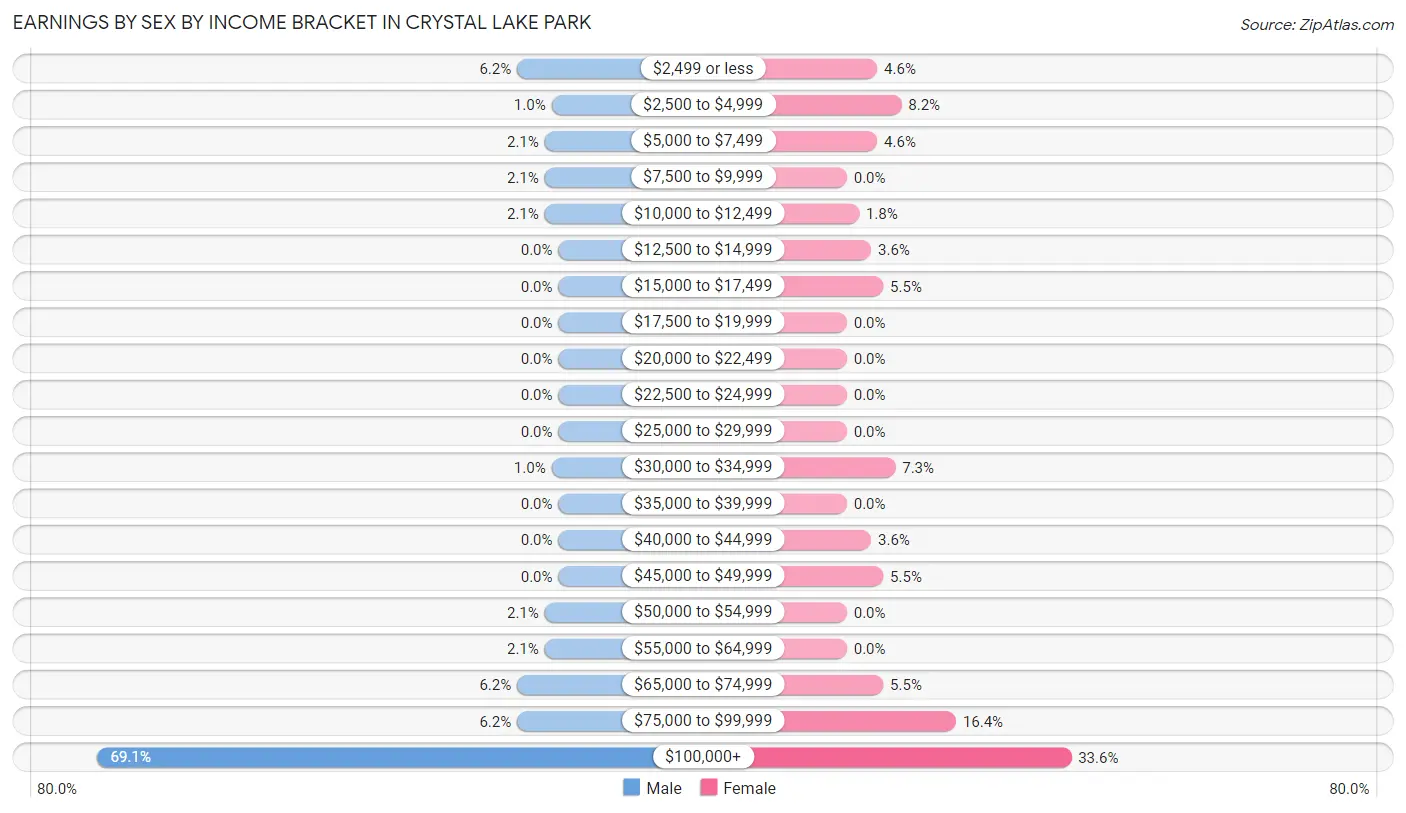
Earnings by Sex by Income Bracket in Crystal Lake Park
The most common earnings brackets in Crystal Lake Park are $100,000+ for men (67 | 69.1%) and $100,000+ for women (37 | 33.6%).
| Income | Male | Female |
| $2,499 or less | 6 (6.2%) | 5 (4.5%) |
| $2,500 to $4,999 | 1 (1.0%) | 9 (8.2%) |
| $5,000 to $7,499 | 2 (2.1%) | 5 (4.5%) |
| $7,500 to $9,999 | 2 (2.1%) | 0 (0.0%) |
| $10,000 to $12,499 | 2 (2.1%) | 2 (1.8%) |
| $12,500 to $14,999 | 0 (0.0%) | 4 (3.6%) |
| $15,000 to $17,499 | 0 (0.0%) | 6 (5.4%) |
| $17,500 to $19,999 | 0 (0.0%) | 0 (0.0%) |
| $20,000 to $22,499 | 0 (0.0%) | 0 (0.0%) |
| $22,500 to $24,999 | 0 (0.0%) | 0 (0.0%) |
| $25,000 to $29,999 | 0 (0.0%) | 0 (0.0%) |
| $30,000 to $34,999 | 1 (1.0%) | 8 (7.3%) |
| $35,000 to $39,999 | 0 (0.0%) | 0 (0.0%) |
| $40,000 to $44,999 | 0 (0.0%) | 4 (3.6%) |
| $45,000 to $49,999 | 0 (0.0%) | 6 (5.4%) |
| $50,000 to $54,999 | 2 (2.1%) | 0 (0.0%) |
| $55,000 to $64,999 | 2 (2.1%) | 0 (0.0%) |
| $65,000 to $74,999 | 6 (6.2%) | 6 (5.4%) |
| $75,000 to $99,999 | 6 (6.2%) | 18 (16.4%) |
| $100,000+ | 67 (69.1%) | 37 (33.6%) |
| Total | 97 (100.0%) | 110 (100.0%) |
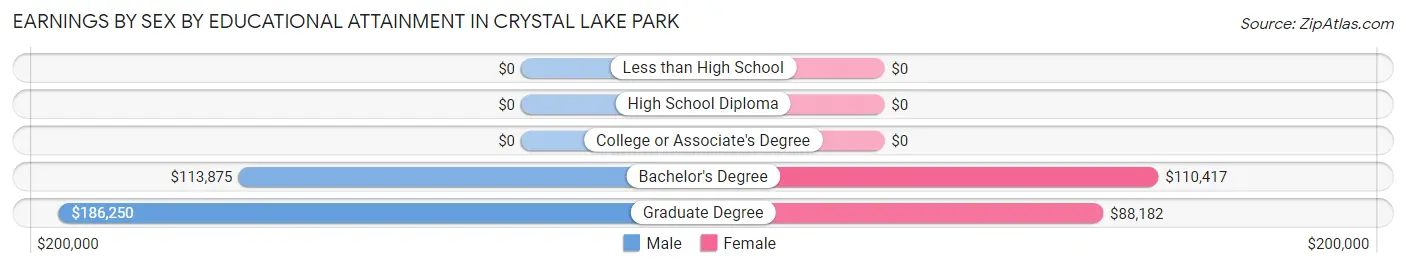
Earnings by Sex by Educational Attainment in Crystal Lake Park
Average earnings in Crystal Lake Park are $123,929 for men and $77,500 for women, a difference of 37.5%. Men with an educational attainment of graduate degree enjoy the highest average annual earnings of $186,250, while those with bachelor's degree education earn the least with $113,875. Women with an educational attainment of bachelor's degree earn the most with the average annual earnings of $110,417, while those with graduate degree education have the smallest earnings of $88,182.
| Educational Attainment | Male Income | Female Income |
| Less than High School | - | - |
| High School Diploma | - | - |
| College or Associate's Degree | - | - |
| Bachelor's Degree | $113,875 | $110,417 |
| Graduate Degree | $186,250 | $88,182 |
| Total | $123,929 | $77,500 |
Family Income in Crystal Lake Park
Family Income Brackets in Crystal Lake Park
According to the Crystal Lake Park family income data, there are 52 families falling into the $200,000+ income range, which is the most common income bracket and makes up 40.3% of all families.
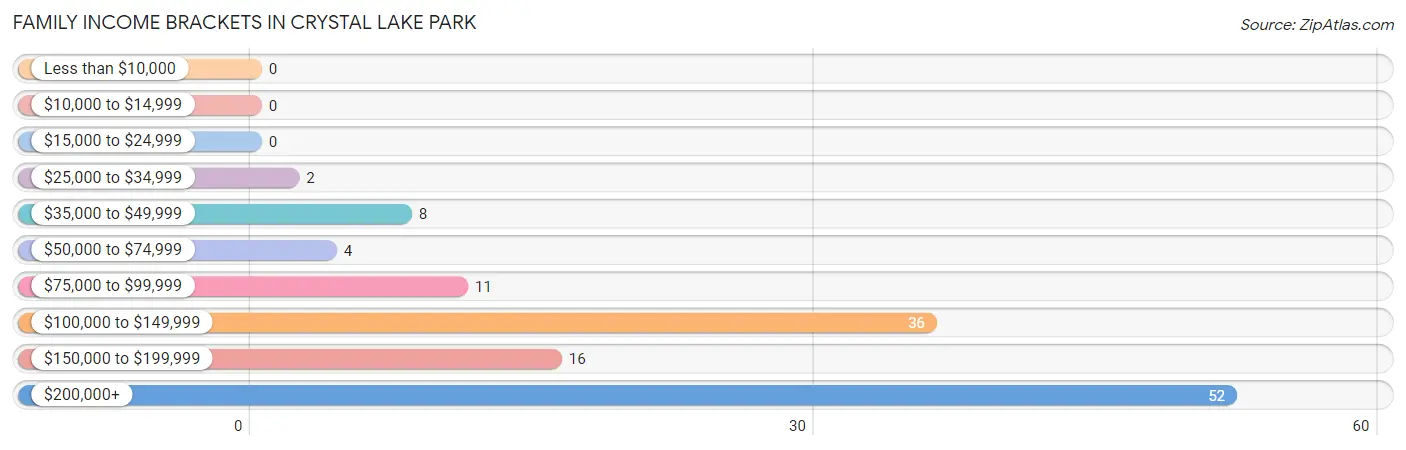
| Income Bracket | # Families | % Families |
| Less than $10,000 | 0 | 0.0% |
| $10,000 to $14,999 | 0 | 0.0% |
| $15,000 to $24,999 | 0 | 0.0% |
| $25,000 to $34,999 | 2 | 1.6% |
| $35,000 to $49,999 | 8 | 6.2% |
| $50,000 to $74,999 | 4 | 3.1% |
| $75,000 to $99,999 | 11 | 8.5% |
| $100,000 to $149,999 | 36 | 27.9% |
| $150,000 to $199,999 | 16 | 12.4% |
| $200,000+ | 52 | 40.3% |
Family Income by Famaliy Size in Crystal Lake Park
4-person families (26 | 20.2%) account for the highest median family income in Crystal Lake Park with $250,001 per family, while 2-person families (71 | 55.0%) have the highest median income of $74,323 per family member.
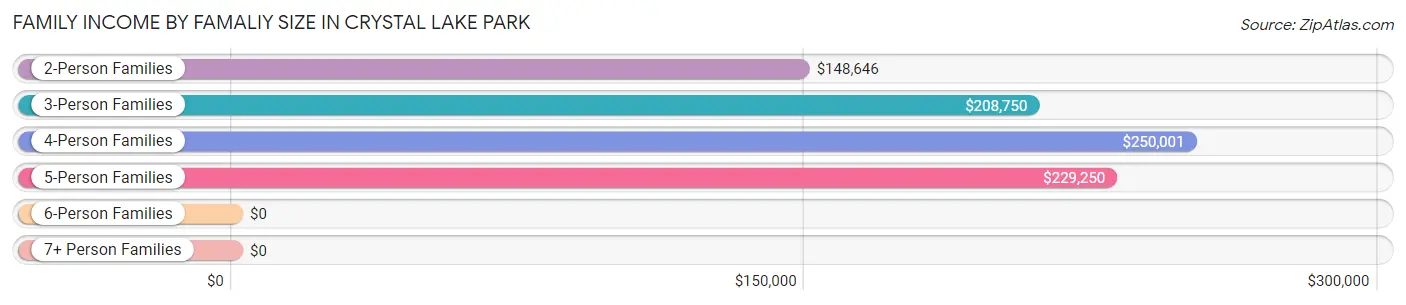
| Income Bracket | # Families | Median Income |
| 2-Person Families | 71 (55.0%) | $148,646 |
| 3-Person Families | 18 (14.0%) | $208,750 |
| 4-Person Families | 26 (20.2%) | $250,001 |
| 5-Person Families | 14 (10.8%) | $229,250 |
| 6-Person Families | 0 (0.0%) | $0 |
| 7+ Person Families | 0 (0.0%) | $0 |
| Total | 129 (100.0%) | $155,750 |
Family Income by Number of Earners in Crystal Lake Park
The median family income in Crystal Lake Park is $155,750, with families comprising 2 earners (49) having the highest median family income of $228,125, while families with 3+ earners (7) have the lowest median family income of $142,813, accounting for 38.0% and 5.4% of families, respectively.
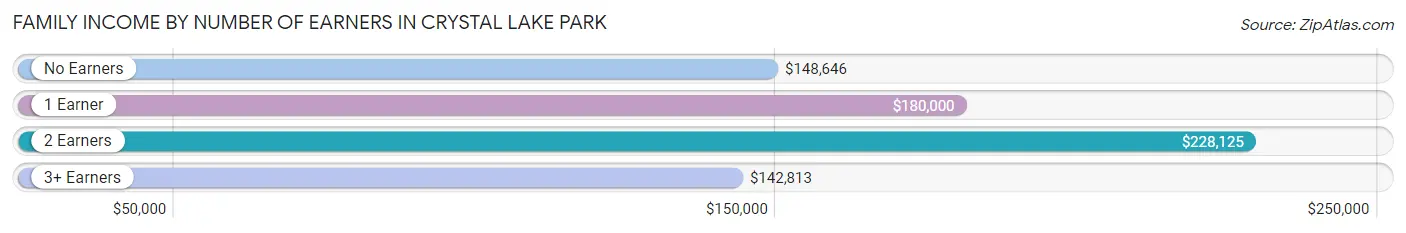
| Number of Earners | # Families | Median Income |
| No Earners | 37 (28.7%) | $148,646 |
| 1 Earner | 36 (27.9%) | $180,000 |
| 2 Earners | 49 (38.0%) | $228,125 |
| 3+ Earners | 7 (5.4%) | $142,813 |
| Total | 129 (100.0%) | $155,750 |
Household Income in Crystal Lake Park
Household Income Brackets in Crystal Lake Park
With 58 households falling in the category, the $200,000+ income range is the most frequent in Crystal Lake Park, accounting for 29.0% of all households.
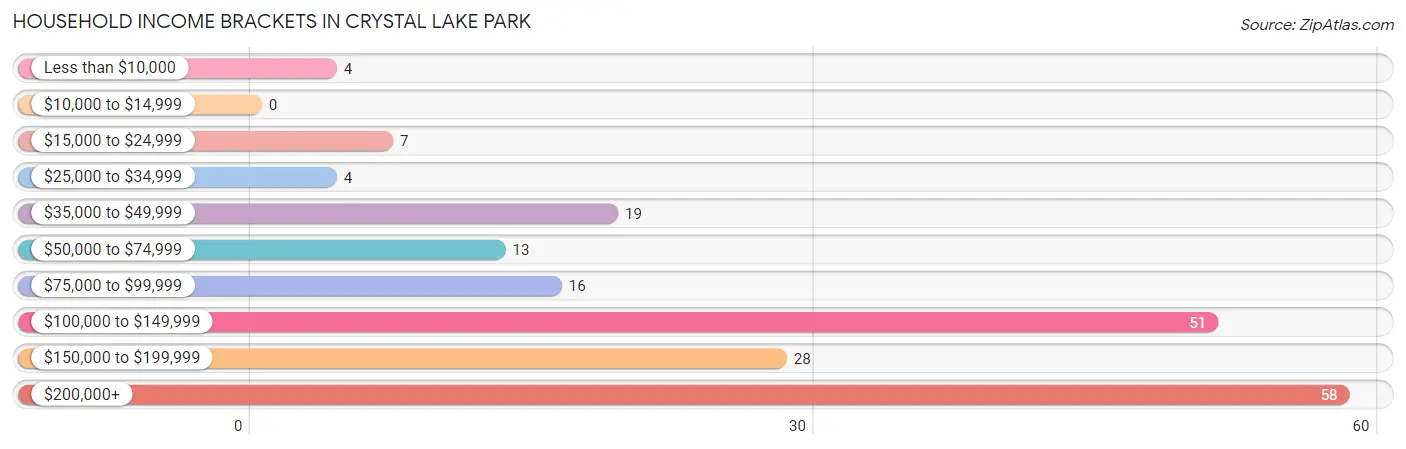
| Income Bracket | # Households | % Households |
| Less than $10,000 | 4 | 2.0% |
| $10,000 to $14,999 | 0 | 0.0% |
| $15,000 to $24,999 | 7 | 3.5% |
| $25,000 to $34,999 | 4 | 2.0% |
| $35,000 to $49,999 | 19 | 9.5% |
| $50,000 to $74,999 | 13 | 6.5% |
| $75,000 to $99,999 | 16 | 8.0% |
| $100,000 to $149,999 | 51 | 25.5% |
| $150,000 to $199,999 | 28 | 14.0% |
| $200,000+ | 58 | 29.0% |
Household Income by Householder Age in Crystal Lake Park
The median household income in Crystal Lake Park is $144,583, with the highest median household income of $250,001 found in the 25 to 44 years age bracket for the primary householder. A total of 20 households (10.0%) fall into this category.
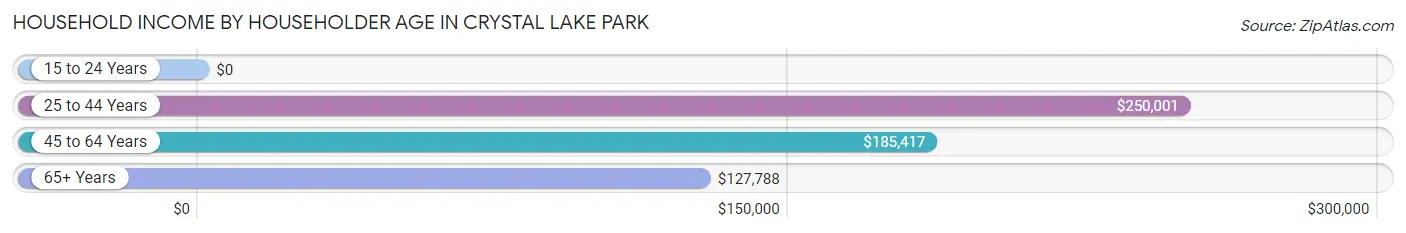
| Income Bracket | # Households | Median Income |
| 15 to 24 Years | 0 (0.0%) | $0 |
| 25 to 44 Years | 20 (10.0%) | $250,001 |
| 45 to 64 Years | 75 (37.5%) | $185,417 |
| 65+ Years | 105 (52.5%) | $127,788 |
| Total | 200 (100.0%) | $144,583 |
Poverty in Crystal Lake Park
Income Below Poverty by Sex and Age in Crystal Lake Park
With 1.0% poverty level for males and 1.5% for females among the residents of Crystal Lake Park, 55 to 64 year old males and 55 to 64 year old females are the most vulnerable to poverty, with 2 males (8.7%) and 2 females (5.3%) in their respective age groups living below the poverty level.
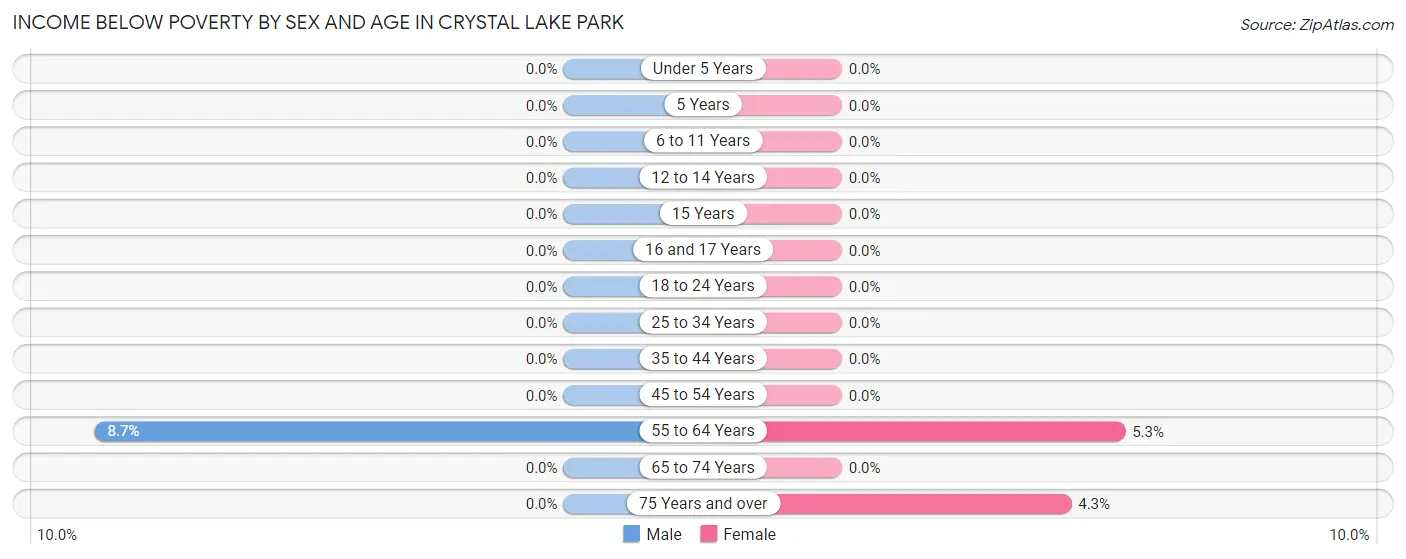
| Age Bracket | Male | Female |
| Under 5 Years | 0 (0.0%) | 0 (0.0%) |
| 5 Years | 0 (0.0%) | 0 (0.0%) |
| 6 to 11 Years | 0 (0.0%) | 0 (0.0%) |
| 12 to 14 Years | 0 (0.0%) | 0 (0.0%) |
| 15 Years | 0 (0.0%) | 0 (0.0%) |
| 16 and 17 Years | 0 (0.0%) | 0 (0.0%) |
| 18 to 24 Years | 0 (0.0%) | 0 (0.0%) |
| 25 to 34 Years | 0 (0.0%) | 0 (0.0%) |
| 35 to 44 Years | 0 (0.0%) | 0 (0.0%) |
| 45 to 54 Years | 0 (0.0%) | 0 (0.0%) |
| 55 to 64 Years | 2 (8.7%) | 2 (5.3%) |
| 65 to 74 Years | 0 (0.0%) | 0 (0.0%) |
| 75 Years and over | 0 (0.0%) | 2 (4.3%) |
| Total | 2 (1.0%) | 4 (1.5%) |
Income Above Poverty by Sex and Age in Crystal Lake Park
According to the poverty statistics in Crystal Lake Park, males aged under 5 years and females aged under 5 years are the age groups that are most secure financially, with 100.0% of males and 100.0% of females in these age groups living above the poverty line.
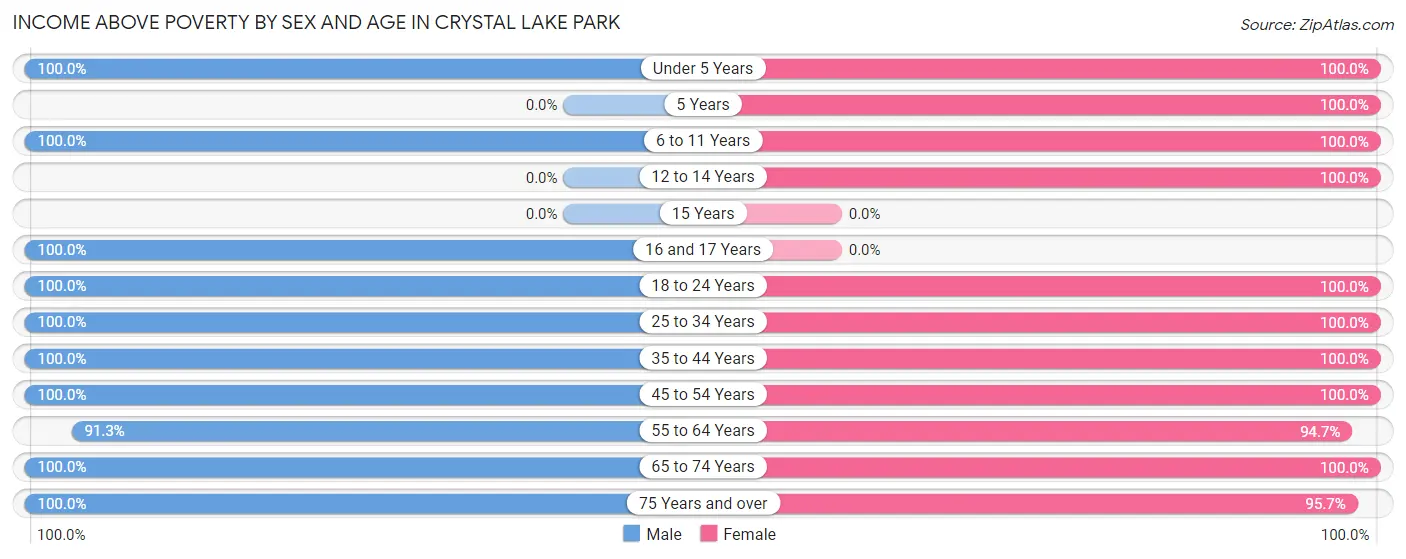
| Age Bracket | Male | Female |
| Under 5 Years | 14 (100.0%) | 7 (100.0%) |
| 5 Years | 0 (0.0%) | 2 (100.0%) |
| 6 to 11 Years | 30 (100.0%) | 21 (100.0%) |
| 12 to 14 Years | 0 (0.0%) | 18 (100.0%) |
| 15 Years | 0 (0.0%) | 0 (0.0%) |
| 16 and 17 Years | 5 (100.0%) | 0 (0.0%) |
| 18 to 24 Years | 11 (100.0%) | 6 (100.0%) |
| 25 to 34 Years | 4 (100.0%) | 11 (100.0%) |
| 35 to 44 Years | 15 (100.0%) | 23 (100.0%) |
| 45 to 54 Years | 38 (100.0%) | 33 (100.0%) |
| 55 to 64 Years | 21 (91.3%) | 36 (94.7%) |
| 65 to 74 Years | 29 (100.0%) | 54 (100.0%) |
| 75 Years and over | 31 (100.0%) | 45 (95.7%) |
| Total | 198 (99.0%) | 256 (98.5%) |
Income Below Poverty Among Married-Couple Families in Crystal Lake Park
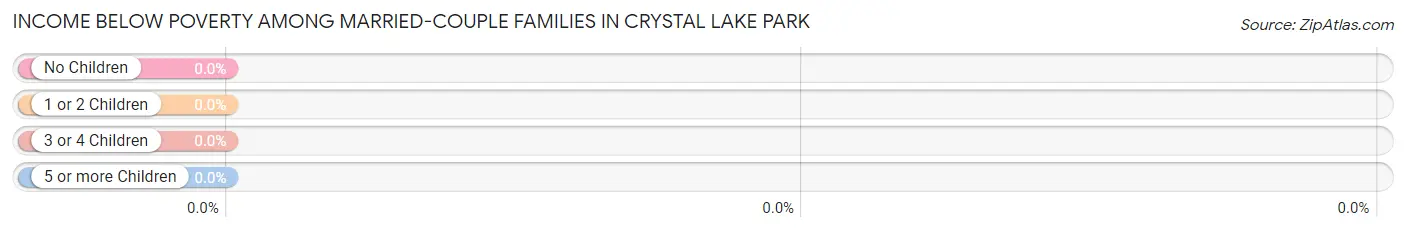
| Children | Above Poverty | Below Poverty |
| No Children | 81 (100.0%) | 0 (0.0%) |
| 1 or 2 Children | 28 (100.0%) | 0 (0.0%) |
| 3 or 4 Children | 14 (100.0%) | 0 (0.0%) |
| 5 or more Children | 0 (0.0%) | 0 (0.0%) |
| Total | 123 (100.0%) | 0 (0.0%) |
Income Below Poverty Among Single-Parent Households in Crystal Lake Park
| Children | Single Father | Single Mother |
| No Children | 0 (0.0%) | 0 (0.0%) |
| 1 or 2 Children | 0 (0.0%) | 0 (0.0%) |
| 3 or 4 Children | 0 (0.0%) | 0 (0.0%) |
| 5 or more Children | 0 (0.0%) | 0 (0.0%) |
| Total | 0 (0.0%) | 0 (0.0%) |
Income Below Poverty Among Married-Couple vs Single-Parent Households in Crystal Lake Park
| Children | Married-Couple Families | Single-Parent Households |
| No Children | 0 (0.0%) | 0 (0.0%) |
| 1 or 2 Children | 0 (0.0%) | 0 (0.0%) |
| 3 or 4 Children | 0 (0.0%) | 0 (0.0%) |
| 5 or more Children | 0 (0.0%) | 0 (0.0%) |
| Total | 0 (0.0%) | 0 (0.0%) |
Race in Crystal Lake Park
The most populous races in Crystal Lake Park are White / Caucasian (377 | 82.0%), Asian (42 | 9.1%), and Black / African American (25 | 5.4%).
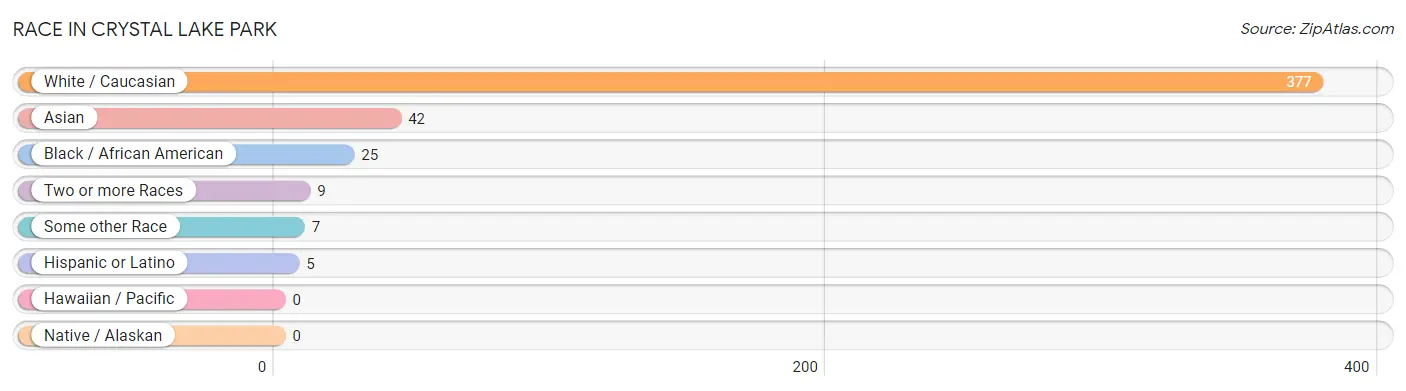
| Race | # Population | % Population |
| Asian | 42 | 9.1% |
| Black / African American | 25 | 5.4% |
| Hawaiian / Pacific | 0 | 0.0% |
| Hispanic or Latino | 5 | 1.1% |
| Native / Alaskan | 0 | 0.0% |
| White / Caucasian | 377 | 82.0% |
| Two or more Races | 9 | 2.0% |
| Some other Race | 7 | 1.5% |
| Total | 460 | 100.0% |
Ancestry in Crystal Lake Park
The most populous ancestries reported in Crystal Lake Park are German (118 | 25.7%), English (83 | 18.0%), Irish (47 | 10.2%), Scottish (34 | 7.4%), and Polish (30 | 6.5%), together accounting for 67.8% of all Crystal Lake Park residents.
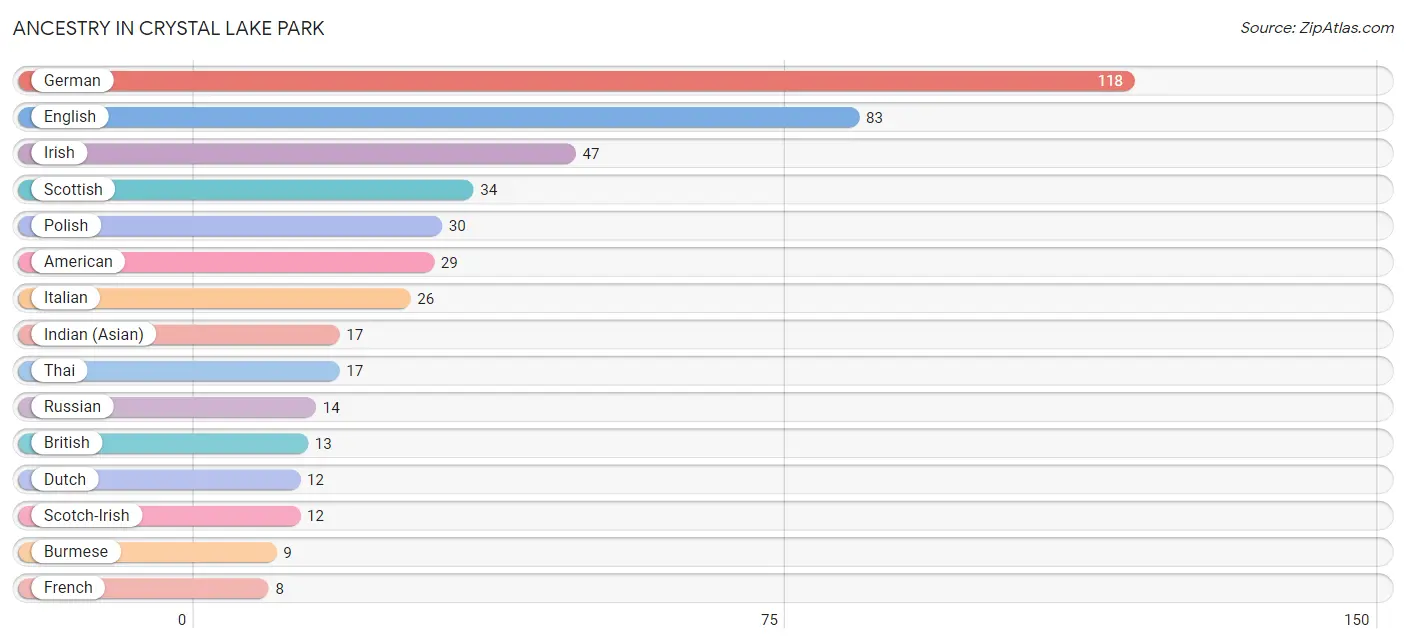
| Ancestry | # Population | % Population |
| American | 29 | 6.3% |
| Argentinean | 2 | 0.4% |
| Bhutanese | 2 | 0.4% |
| British | 13 | 2.8% |
| Burmese | 9 | 2.0% |
| Dutch | 12 | 2.6% |
| Eastern European | 2 | 0.4% |
| English | 83 | 18.0% |
| European | 2 | 0.4% |
| French | 8 | 1.7% |
| German | 118 | 25.7% |
| Greek | 1 | 0.2% |
| Hungarian | 6 | 1.3% |
| Indian (Asian) | 17 | 3.7% |
| Irish | 47 | 10.2% |
| Italian | 26 | 5.7% |
| Lithuanian | 2 | 0.4% |
| Northern European | 2 | 0.4% |
| Norwegian | 2 | 0.4% |
| Polish | 30 | 6.5% |
| Russian | 14 | 3.0% |
| Scandinavian | 2 | 0.4% |
| Scotch-Irish | 12 | 2.6% |
| Scottish | 34 | 7.4% |
| South American | 2 | 0.4% |
| Spaniard | 3 | 0.6% |
| Swedish | 6 | 1.3% |
| Swiss | 6 | 1.3% |
| Thai | 17 | 3.7% |
| Turkish | 1 | 0.2% | View All 30 Rows |
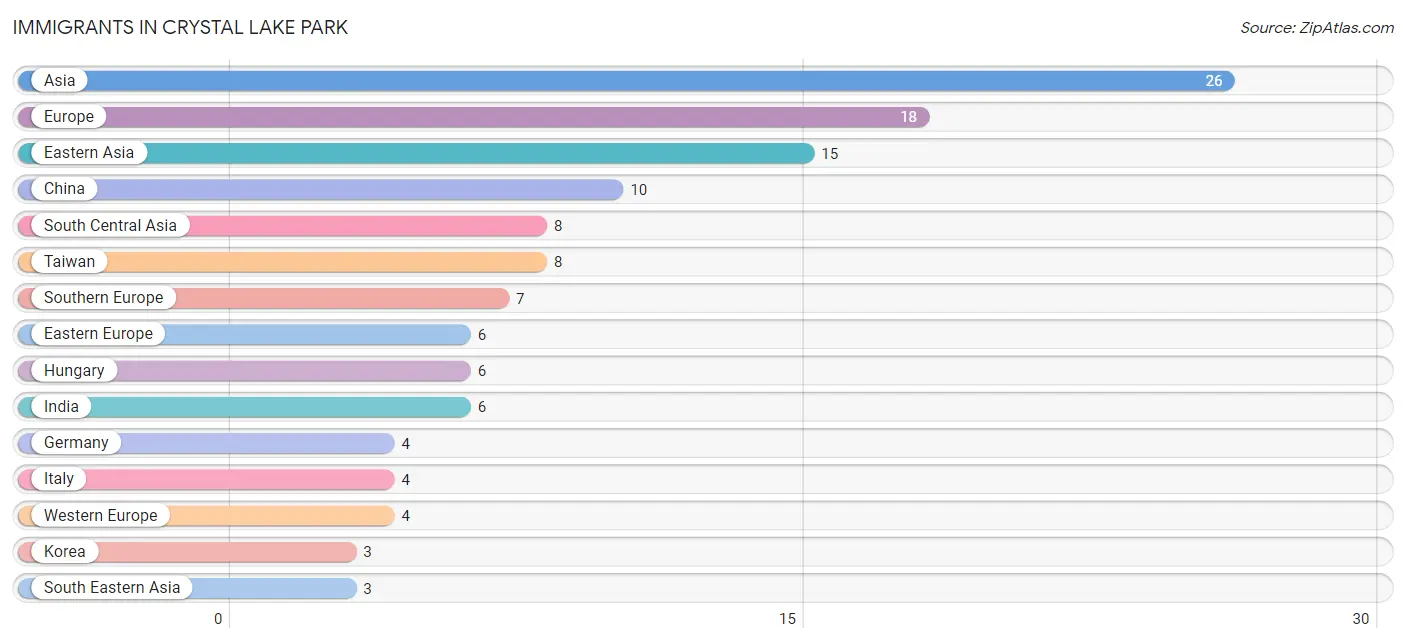
Immigrants in Crystal Lake Park
The most numerous immigrant groups reported in Crystal Lake Park came from Asia (26 | 5.7%), Europe (18 | 3.9%), Eastern Asia (15 | 3.3%), China (10 | 2.2%), and South Central Asia (8 | 1.7%), together accounting for 16.7% of all Crystal Lake Park residents.
| Immigration Origin | # Population | % Population |
| Argentina | 2 | 0.4% |
| Asia | 26 | 5.7% |
| China | 10 | 2.2% |
| Eastern Asia | 15 | 3.3% |
| Eastern Europe | 6 | 1.3% |
| Europe | 18 | 3.9% |
| Germany | 4 | 0.9% |
| Hong Kong | 2 | 0.4% |
| Hungary | 6 | 1.3% |
| India | 6 | 1.3% |
| Italy | 4 | 0.9% |
| Japan | 2 | 0.4% |
| Korea | 3 | 0.6% |
| Latin America | 2 | 0.4% |
| Northern Europe | 1 | 0.2% |
| Norway | 1 | 0.2% |
| Pakistan | 2 | 0.4% |
| South America | 2 | 0.4% |
| South Central Asia | 8 | 1.7% |
| South Eastern Asia | 3 | 0.6% |
| Southern Europe | 7 | 1.5% |
| Spain | 3 | 0.6% |
| Taiwan | 8 | 1.7% |
| Thailand | 3 | 0.6% |
| Western Europe | 4 | 0.9% | View All 25 Rows |
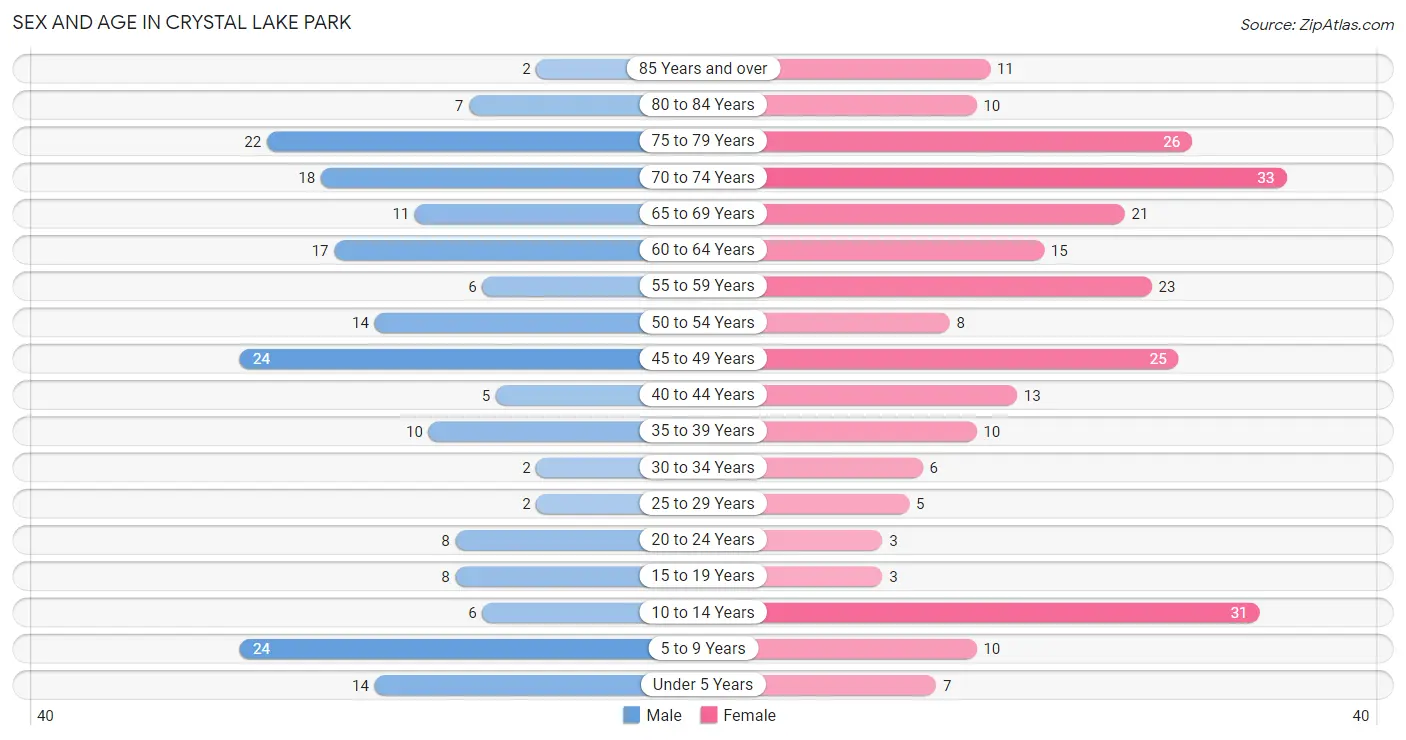
Sex and Age in Crystal Lake Park
Sex and Age in Crystal Lake Park
The most populous age groups in Crystal Lake Park are 5 to 9 Years (24 | 12.0%) for men and 70 to 74 Years (33 | 12.7%) for women.
| Age Bracket | Male | Female |
| Under 5 Years | 14 (7.0%) | 7 (2.7%) |
| 5 to 9 Years | 24 (12.0%) | 10 (3.8%) |
| 10 to 14 Years | 6 (3.0%) | 31 (11.9%) |
| 15 to 19 Years | 8 (4.0%) | 3 (1.1%) |
| 20 to 24 Years | 8 (4.0%) | 3 (1.1%) |
| 25 to 29 Years | 2 (1.0%) | 5 (1.9%) |
| 30 to 34 Years | 2 (1.0%) | 6 (2.3%) |
| 35 to 39 Years | 10 (5.0%) | 10 (3.8%) |
| 40 to 44 Years | 5 (2.5%) | 13 (5.0%) |
| 45 to 49 Years | 24 (12.0%) | 25 (9.6%) |
| 50 to 54 Years | 14 (7.0%) | 8 (3.1%) |
| 55 to 59 Years | 6 (3.0%) | 23 (8.8%) |
| 60 to 64 Years | 17 (8.5%) | 15 (5.8%) |
| 65 to 69 Years | 11 (5.5%) | 21 (8.1%) |
| 70 to 74 Years | 18 (9.0%) | 33 (12.7%) |
| 75 to 79 Years | 22 (11.0%) | 26 (10.0%) |
| 80 to 84 Years | 7 (3.5%) | 10 (3.8%) |
| 85 Years and over | 2 (1.0%) | 11 (4.2%) |
| Total | 200 (100.0%) | 260 (100.0%) |
Families and Households in Crystal Lake Park
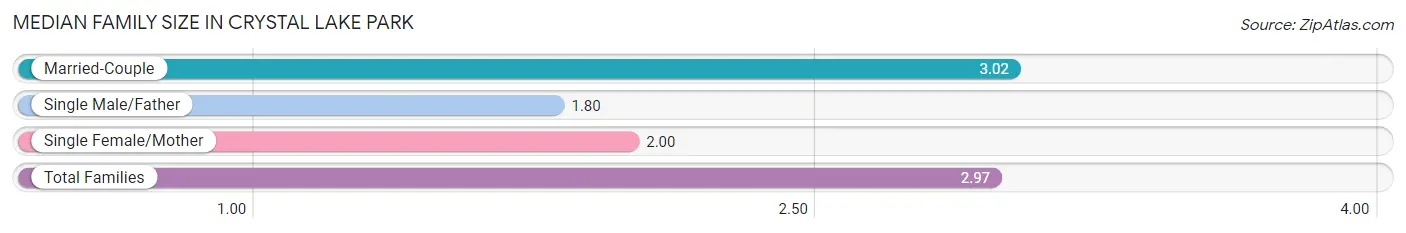
Median Family Size in Crystal Lake Park
The median family size in Crystal Lake Park is 2.97 persons per family, with married-couple families (123 | 95.4%) accounting for the largest median family size of 3.02 persons per family. On the other hand, single male/father families (5 | 3.9%) represent the smallest median family size with 1.80 persons per family.
| Family Type | # Families | Family Size |
| Married-Couple | 123 (95.4%) | 3.02 |
| Single Male/Father | 5 (3.9%) | 1.80 |
| Single Female/Mother | 1 (0.8%) | 2.00 |
| Total Families | 129 (100.0%) | 2.97 |
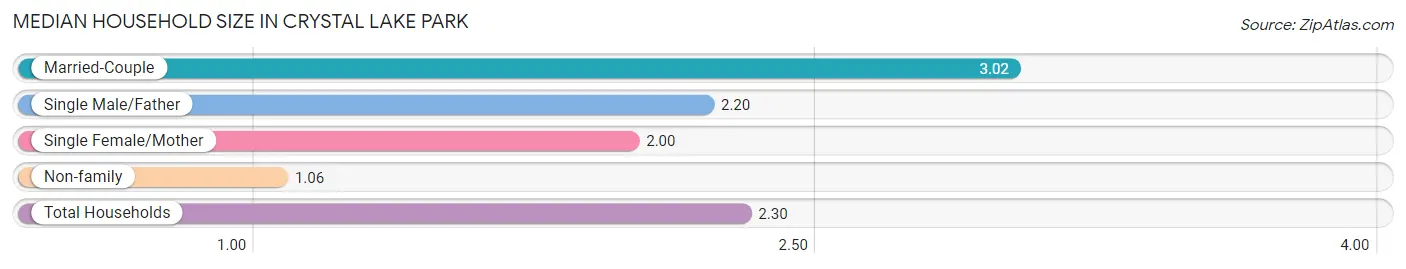
Median Household Size in Crystal Lake Park
The median household size in Crystal Lake Park is 2.30 persons per household, with married-couple households (123 | 61.5%) accounting for the largest median household size of 3.02 persons per household. non-family households (71 | 35.5%) represent the smallest median household size with 1.06 persons per household.
| Household Type | # Households | Household Size |
| Married-Couple | 123 (61.5%) | 3.02 |
| Single Male/Father | 5 (2.5%) | 2.20 |
| Single Female/Mother | 1 (0.5%) | 2.00 |
| Non-family | 71 (35.5%) | 1.06 |
| Total Households | 200 (100.0%) | 2.30 |
Household Size by Marriage Status in Crystal Lake Park
Out of a total of 200 households in Crystal Lake Park, 129 (64.5%) are family households, while 71 (35.5%) are nonfamily households. The most numerous type of family households are 2-person households, comprising 68, and the most common type of nonfamily households are 1-person households, comprising 67.
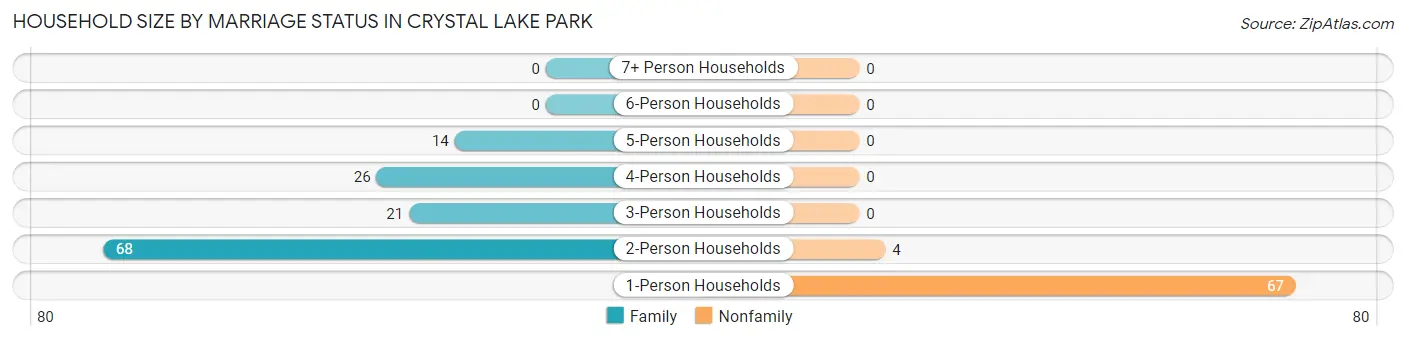
| Household Size | Family Households | Nonfamily Households |
| 1-Person Households | - | 67 (33.5%) |
| 2-Person Households | 68 (34.0%) | 4 (2.0%) |
| 3-Person Households | 21 (10.5%) | 0 (0.0%) |
| 4-Person Households | 26 (13.0%) | 0 (0.0%) |
| 5-Person Households | 14 (7.0%) | 0 (0.0%) |
| 6-Person Households | 0 (0.0%) | 0 (0.0%) |
| 7+ Person Households | 0 (0.0%) | 0 (0.0%) |
| Total | 129 (64.5%) | 71 (35.5%) |
Female Fertility in Crystal Lake Park
Fertility by Age in Crystal Lake Park
Average fertility rate in Crystal Lake Park is 29.0 births per 1,000 women. Women in the age bracket of 20 to 34 years have the highest fertility rate with 143.0 births per 1,000 women. Women in the age bracket of 20 to 34 years acount for 100.0% of all women with births.
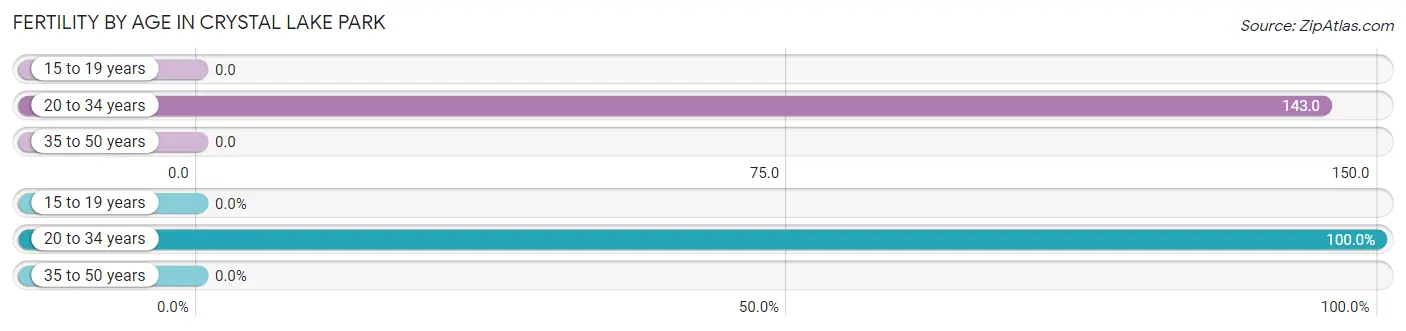
| Age Bracket | Women with Births | Births / 1,000 Women |
| 15 to 19 years | 0 (0.0%) | 0.0 |
| 20 to 34 years | 2 (100.0%) | 143.0 |
| 35 to 50 years | 0 (0.0%) | 0.0 |
| Total | 2 (100.0%) | 29.0 |
Fertility by Age by Marriage Status in Crystal Lake Park
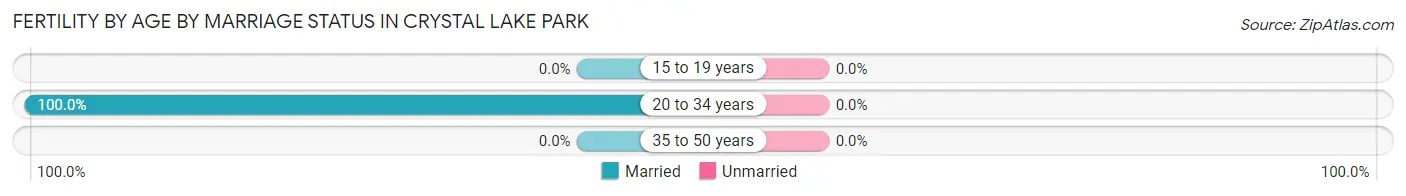
| Age Bracket | Married | Unmarried |
| 15 to 19 years | 0 (0.0%) | 0 (0.0%) |
| 20 to 34 years | 2 (100.0%) | 0 (0.0%) |
| 35 to 50 years | 0 (0.0%) | 0 (0.0%) |
| Total | 2 (100.0%) | 0 (0.0%) |
Fertility by Education in Crystal Lake Park
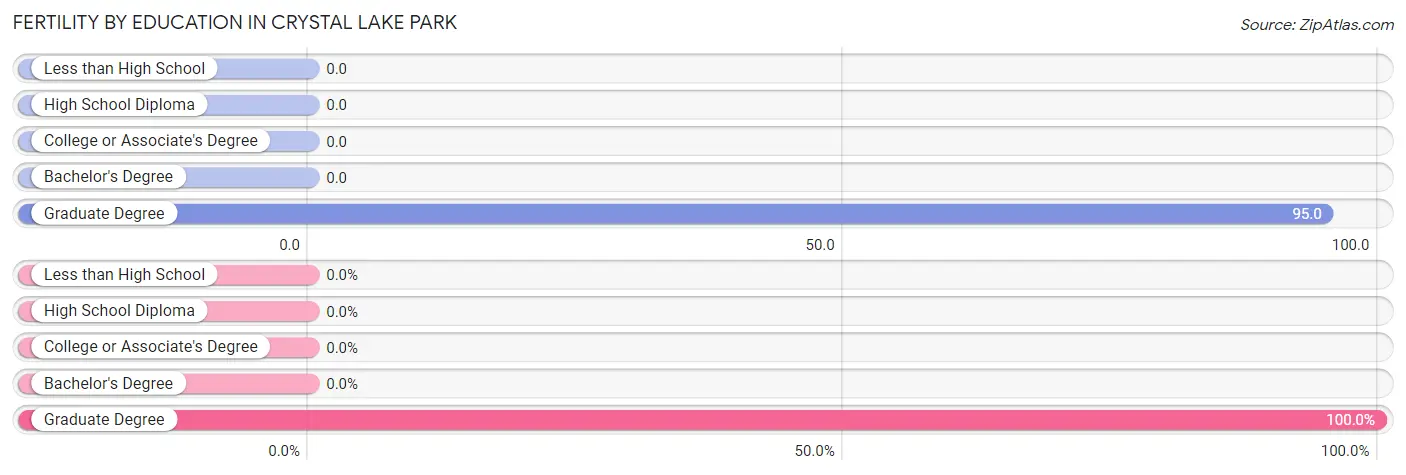
| Educational Attainment | Women with Births | Births / 1,000 Women |
| Less than High School | 0 (0.0%) | 0.0 |
| High School Diploma | 0 (0.0%) | 0.0 |
| College or Associate's Degree | 0 (0.0%) | 0.0 |
| Bachelor's Degree | 0 (0.0%) | 0.0 |
| Graduate Degree | 2 (100.0%) | 95.0 |
| Total | 2 (100.0%) | 29.0 |
Fertility by Education by Marriage Status in Crystal Lake Park
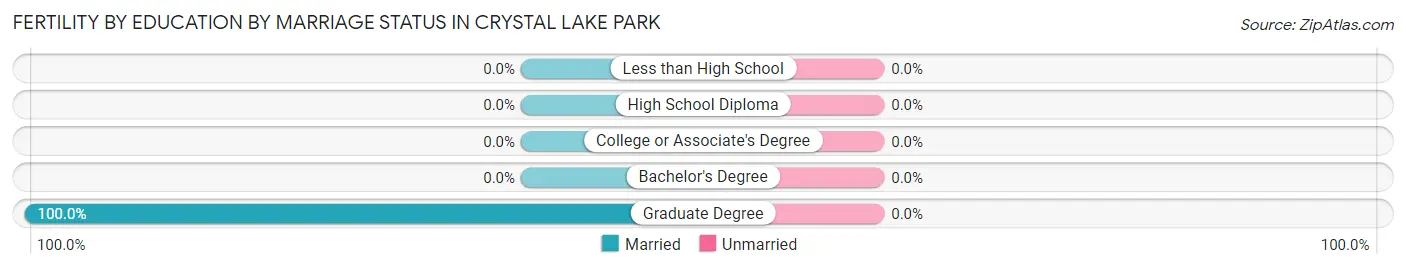
| Educational Attainment | Married | Unmarried |
| Less than High School | 0 (0.0%) | 0 (0.0%) |
| High School Diploma | 0 (0.0%) | 0 (0.0%) |
| College or Associate's Degree | 0 (0.0%) | 0 (0.0%) |
| Bachelor's Degree | 0 (0.0%) | 0 (0.0%) |
| Graduate Degree | 2 (100.0%) | 0 (0.0%) |
| Total | 2 (100.0%) | 0 (0.0%) |
Employment Characteristics in Crystal Lake Park
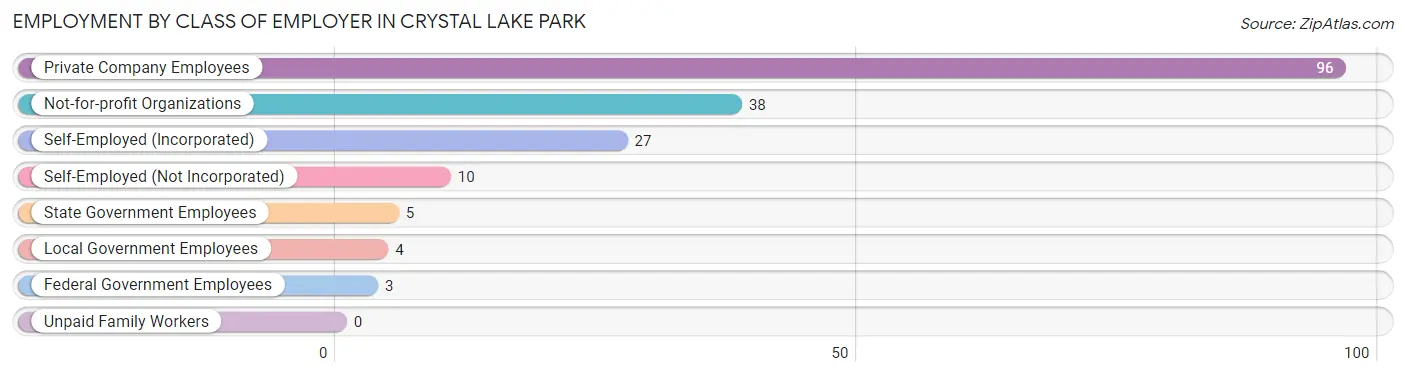
Employment by Class of Employer in Crystal Lake Park
Among the 183 employed individuals in Crystal Lake Park, private company employees (96 | 52.5%), not-for-profit organizations (38 | 20.8%), and self-employed (incorporated) (27 | 14.7%) make up the most common classes of employment.
| Employer Class | # Employees | % Employees |
| Private Company Employees | 96 | 52.5% |
| Self-Employed (Incorporated) | 27 | 14.7% |
| Self-Employed (Not Incorporated) | 10 | 5.5% |
| Not-for-profit Organizations | 38 | 20.8% |
| Local Government Employees | 4 | 2.2% |
| State Government Employees | 5 | 2.7% |
| Federal Government Employees | 3 | 1.6% |
| Unpaid Family Workers | 0 | 0.0% |
| Total | 183 | 100.0% |
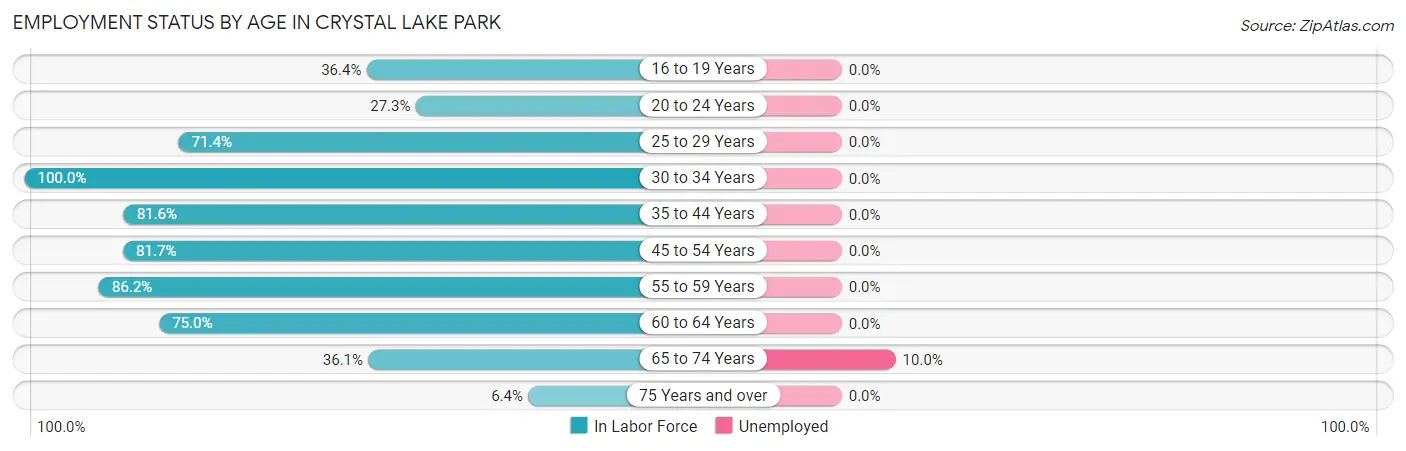
Employment Status by Age in Crystal Lake Park
According to the labor force statistics for Crystal Lake Park, out of the total population over 16 years of age (368), 52.4% or 193 individuals are in the labor force, with 1.6% or 3 of them unemployed. The age group with the highest labor force participation rate is 30 to 34 years, with 100.0% or 8 individuals in the labor force. Within the labor force, the 65 to 74 years age range has the highest percentage of unemployed individuals, with 10.0% or 3 of them being unemployed.
| Age Bracket | In Labor Force | Unemployed |
| 16 to 19 Years | 4 (36.4%) | 0 (0.0%) |
| 20 to 24 Years | 3 (27.3%) | 0 (0.0%) |
| 25 to 29 Years | 5 (71.4%) | 0 (0.0%) |
| 30 to 34 Years | 8 (100.0%) | 0 (0.0%) |
| 35 to 44 Years | 31 (81.6%) | 0 (0.0%) |
| 45 to 54 Years | 58 (81.7%) | 0 (0.0%) |
| 55 to 59 Years | 25 (86.2%) | 0 (0.0%) |
| 60 to 64 Years | 24 (75.0%) | 0 (0.0%) |
| 65 to 74 Years | 30 (36.1%) | 3 (10.0%) |
| 75 Years and over | 5 (6.4%) | 0 (0.0%) |
| Total | 193 (52.4%) | 3 (1.6%) |
Employment Status by Educational Attainment in Crystal Lake Park
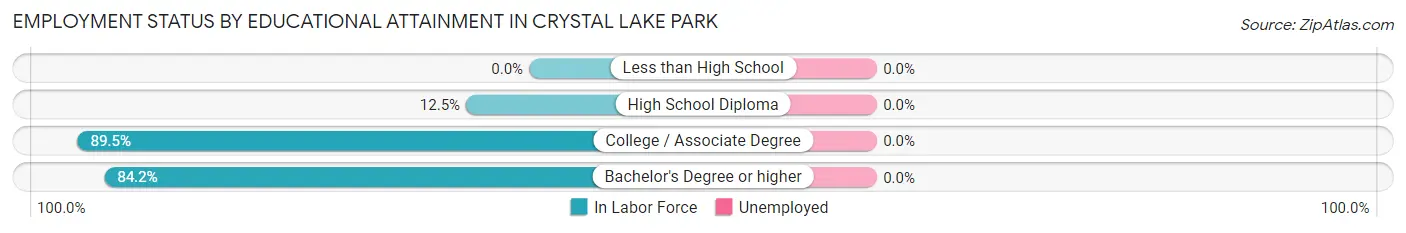
| Educational Attainment | In Labor Force | Unemployed |
| Less than High School | 0 (0.0%) | 0 (0.0%) |
| High School Diploma | 1 (12.5%) | 0 (0.0%) |
| College / Associate Degree | 17 (89.5%) | 0 (0.0%) |
| Bachelor's Degree or higher | 133 (84.2%) | 0 (0.0%) |
| Total | 151 (81.6%) | 0 (0.0%) |
Employment Occupations by Sex in Crystal Lake Park
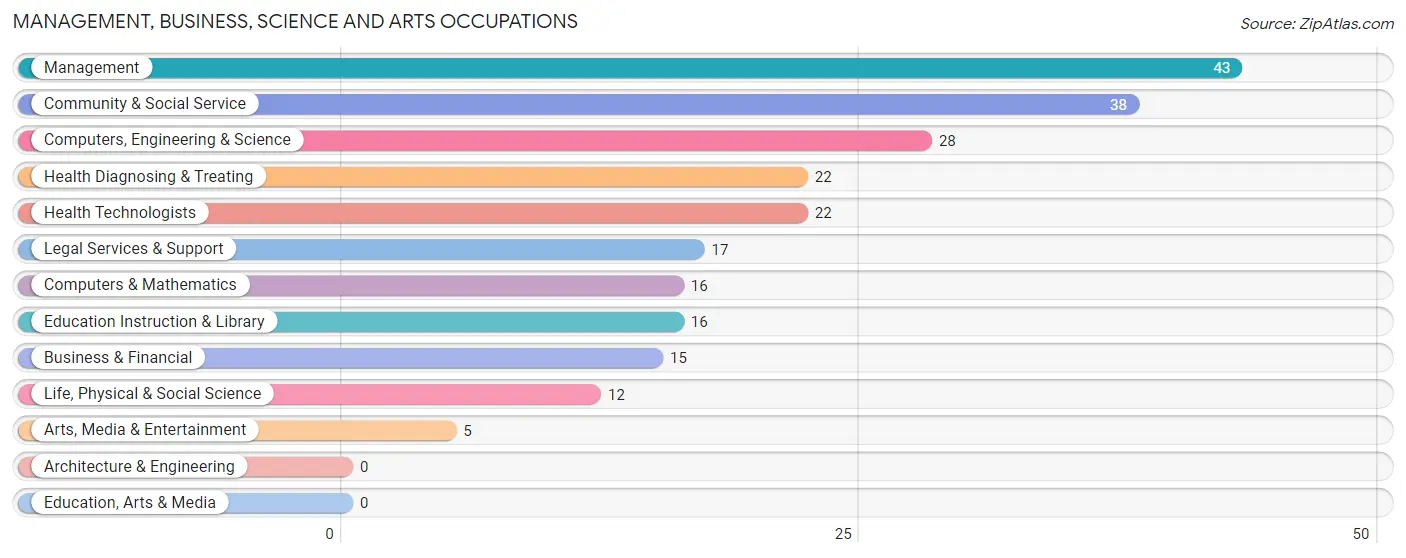
Management, Business, Science and Arts Occupations
The most common Management, Business, Science and Arts occupations in Crystal Lake Park are Management (43 | 22.6%), Community & Social Service (38 | 20.0%), Computers, Engineering & Science (28 | 14.7%), Health Diagnosing & Treating (22 | 11.6%), and Health Technologists (22 | 11.6%).
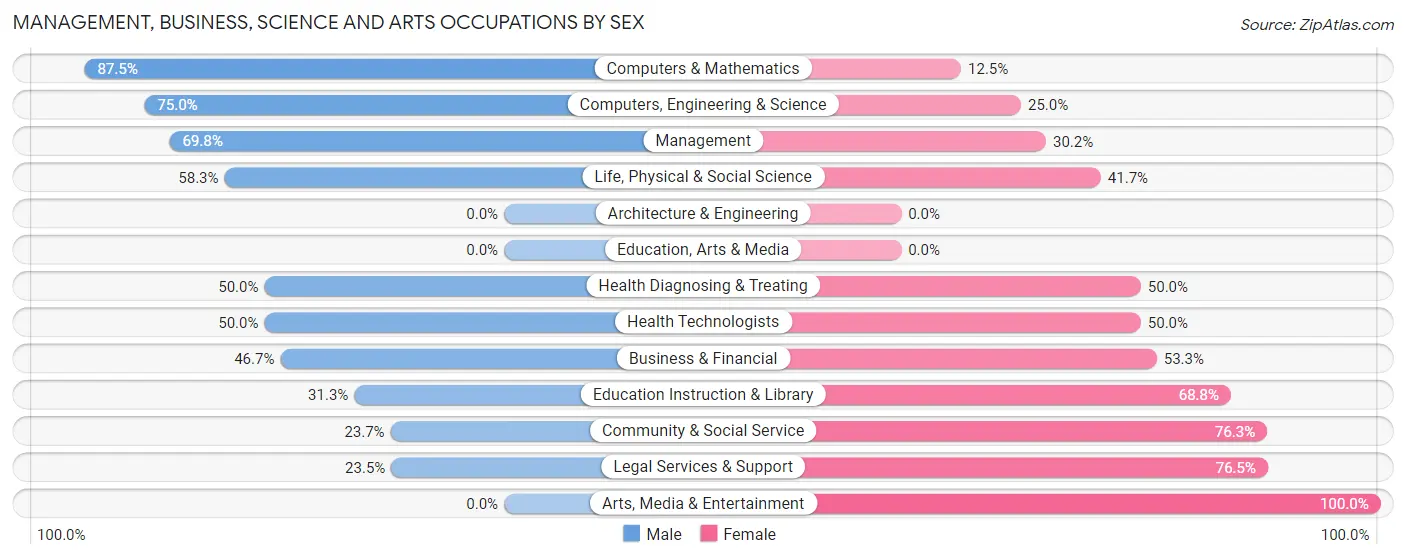
Management, Business, Science and Arts Occupations by Sex
Within the Management, Business, Science and Arts occupations in Crystal Lake Park, the most male-oriented occupations are Computers & Mathematics (87.5%), Computers, Engineering & Science (75.0%), and Management (69.8%), while the most female-oriented occupations are Arts, Media & Entertainment (100.0%), Legal Services & Support (76.5%), and Community & Social Service (76.3%).
| Occupation | Male | Female |
| Management | 30 (69.8%) | 13 (30.2%) |
| Business & Financial | 7 (46.7%) | 8 (53.3%) |
| Computers, Engineering & Science | 21 (75.0%) | 7 (25.0%) |
| Computers & Mathematics | 14 (87.5%) | 2 (12.5%) |
| Architecture & Engineering | 0 (0.0%) | 0 (0.0%) |
| Life, Physical & Social Science | 7 (58.3%) | 5 (41.7%) |
| Community & Social Service | 9 (23.7%) | 29 (76.3%) |
| Education, Arts & Media | 0 (0.0%) | 0 (0.0%) |
| Legal Services & Support | 4 (23.5%) | 13 (76.5%) |
| Education Instruction & Library | 5 (31.2%) | 11 (68.8%) |
| Arts, Media & Entertainment | 0 (0.0%) | 5 (100.0%) |
| Health Diagnosing & Treating | 11 (50.0%) | 11 (50.0%) |
| Health Technologists | 11 (50.0%) | 11 (50.0%) |
| Total (Category) | 78 (53.4%) | 68 (46.6%) |
| Total (Overall) | 89 (46.8%) | 101 (53.2%) |
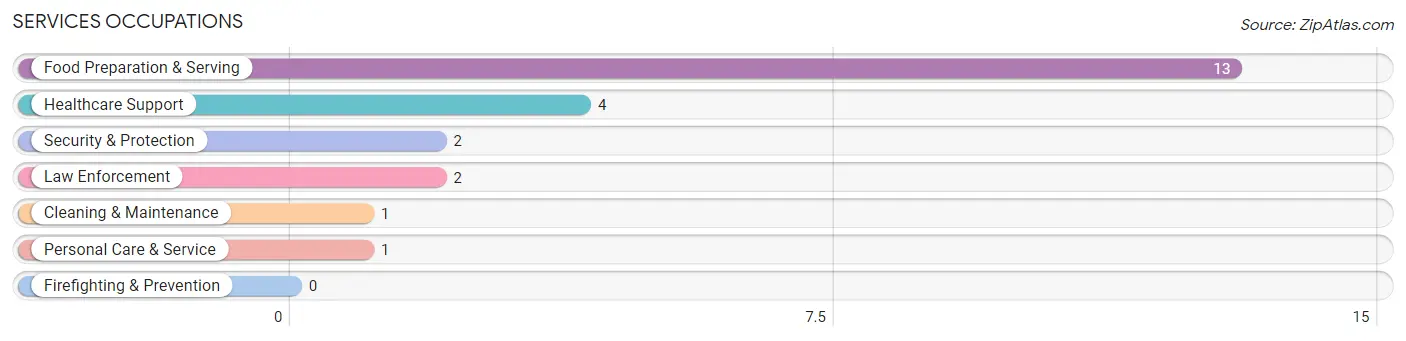
Services Occupations
The most common Services occupations in Crystal Lake Park are Food Preparation & Serving (13 | 6.8%), Healthcare Support (4 | 2.1%), Security & Protection (2 | 1.1%), Law Enforcement (2 | 1.1%), and Cleaning & Maintenance (1 | 0.5%).
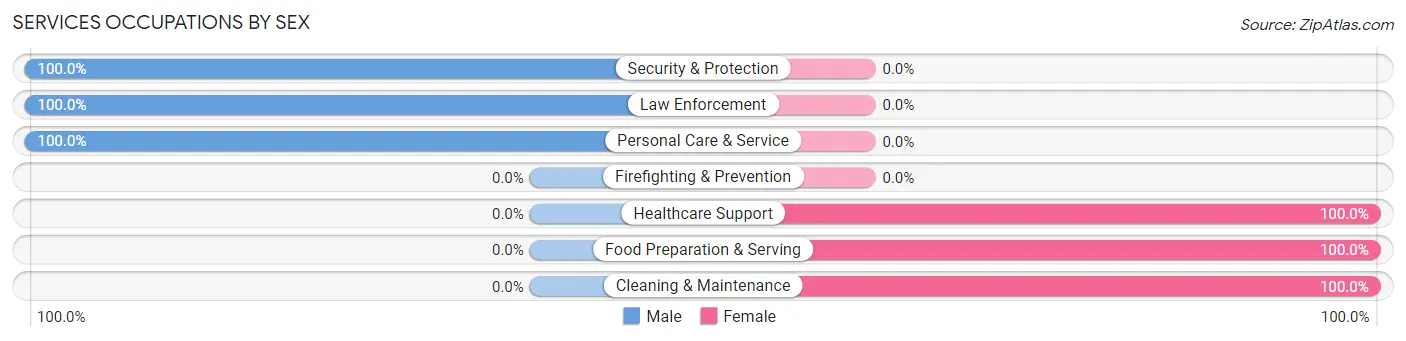
Services Occupations by Sex
Within the Services occupations in Crystal Lake Park, the most male-oriented occupations are Security & Protection (100.0%), Law Enforcement (100.0%), and Personal Care & Service (100.0%), while the most female-oriented occupations are Healthcare Support (100.0%), Food Preparation & Serving (100.0%), and Cleaning & Maintenance (100.0%).
| Occupation | Male | Female |
| Healthcare Support | 0 (0.0%) | 4 (100.0%) |
| Security & Protection | 2 (100.0%) | 0 (0.0%) |
| Firefighting & Prevention | 0 (0.0%) | 0 (0.0%) |
| Law Enforcement | 2 (100.0%) | 0 (0.0%) |
| Food Preparation & Serving | 0 (0.0%) | 13 (100.0%) |
| Cleaning & Maintenance | 0 (0.0%) | 1 (100.0%) |
| Personal Care & Service | 1 (100.0%) | 0 (0.0%) |
| Total (Category) | 3 (14.3%) | 18 (85.7%) |
| Total (Overall) | 89 (46.8%) | 101 (53.2%) |
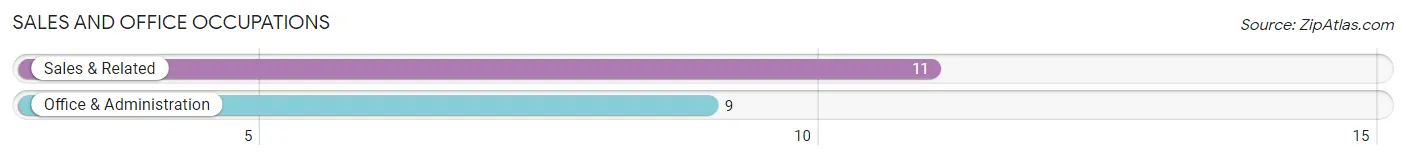
Sales and Office Occupations
The most common Sales and Office occupations in Crystal Lake Park are Sales & Related (11 | 5.8%), and Office & Administration (9 | 4.7%).
Sales and Office Occupations by Sex
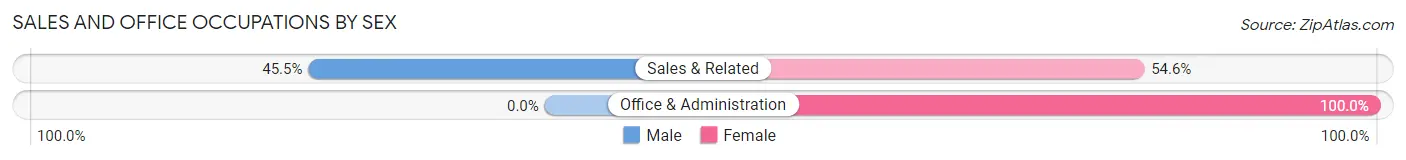
| Occupation | Male | Female |
| Sales & Related | 5 (45.5%) | 6 (54.5%) |
| Office & Administration | 0 (0.0%) | 9 (100.0%) |
| Total (Category) | 5 (25.0%) | 15 (75.0%) |
| Total (Overall) | 89 (46.8%) | 101 (53.2%) |
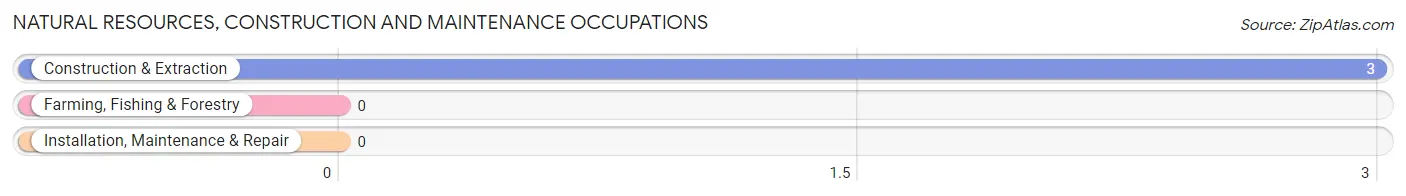
Natural Resources, Construction and Maintenance Occupations
The most common Natural Resources, Construction and Maintenance occupations in Crystal Lake Park are , and Construction & Extraction (3 | 1.6%).
Natural Resources, Construction and Maintenance Occupations by Sex
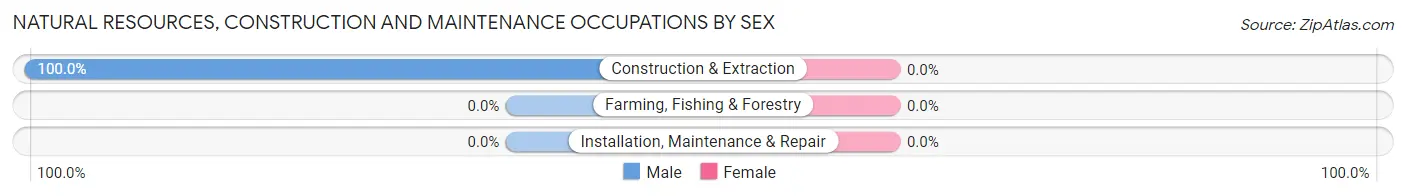
| Occupation | Male | Female |
| Farming, Fishing & Forestry | 0 (0.0%) | 0 (0.0%) |
| Construction & Extraction | 3 (100.0%) | 0 (0.0%) |
| Installation, Maintenance & Repair | 0 (0.0%) | 0 (0.0%) |
| Total (Category) | 3 (100.0%) | 0 (0.0%) |
| Total (Overall) | 89 (46.8%) | 101 (53.2%) |
Production, Transportation and Moving Occupations
Production, Transportation and Moving Occupations by Sex
| Occupation | Male | Female |
| Production | 0 (0.0%) | 0 (0.0%) |
| Transportation | 0 (0.0%) | 0 (0.0%) |
| Material Moving | 0 (0.0%) | 0 (0.0%) |
| Total (Category) | 0 (0.0%) | 0 (0.0%) |
| Total (Overall) | 89 (46.8%) | 101 (53.2%) |
Employment Industries by Sex in Crystal Lake Park
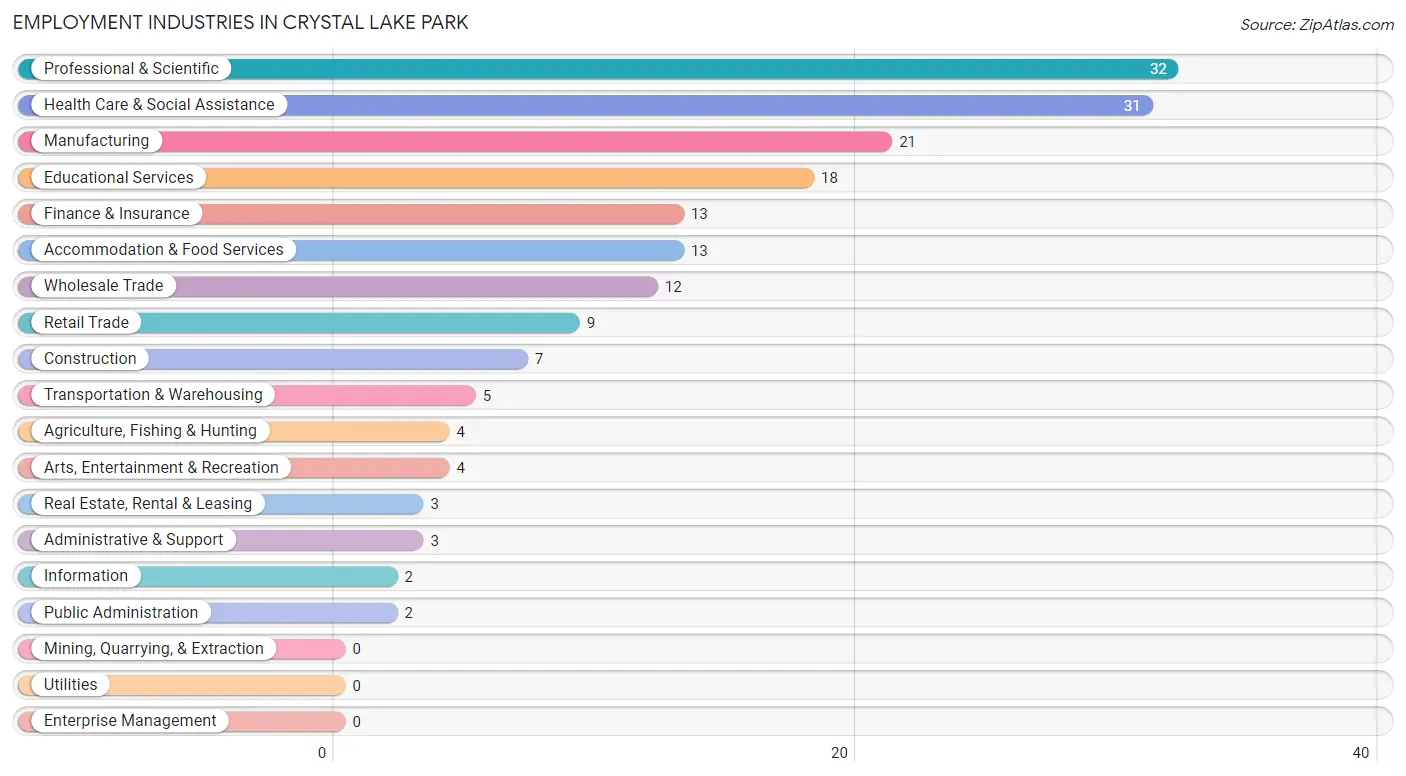
Employment Industries in Crystal Lake Park
The major employment industries in Crystal Lake Park include Professional & Scientific (32 | 16.8%), Health Care & Social Assistance (31 | 16.3%), Manufacturing (21 | 11.1%), Educational Services (18 | 9.5%), and Finance & Insurance (13 | 6.8%).
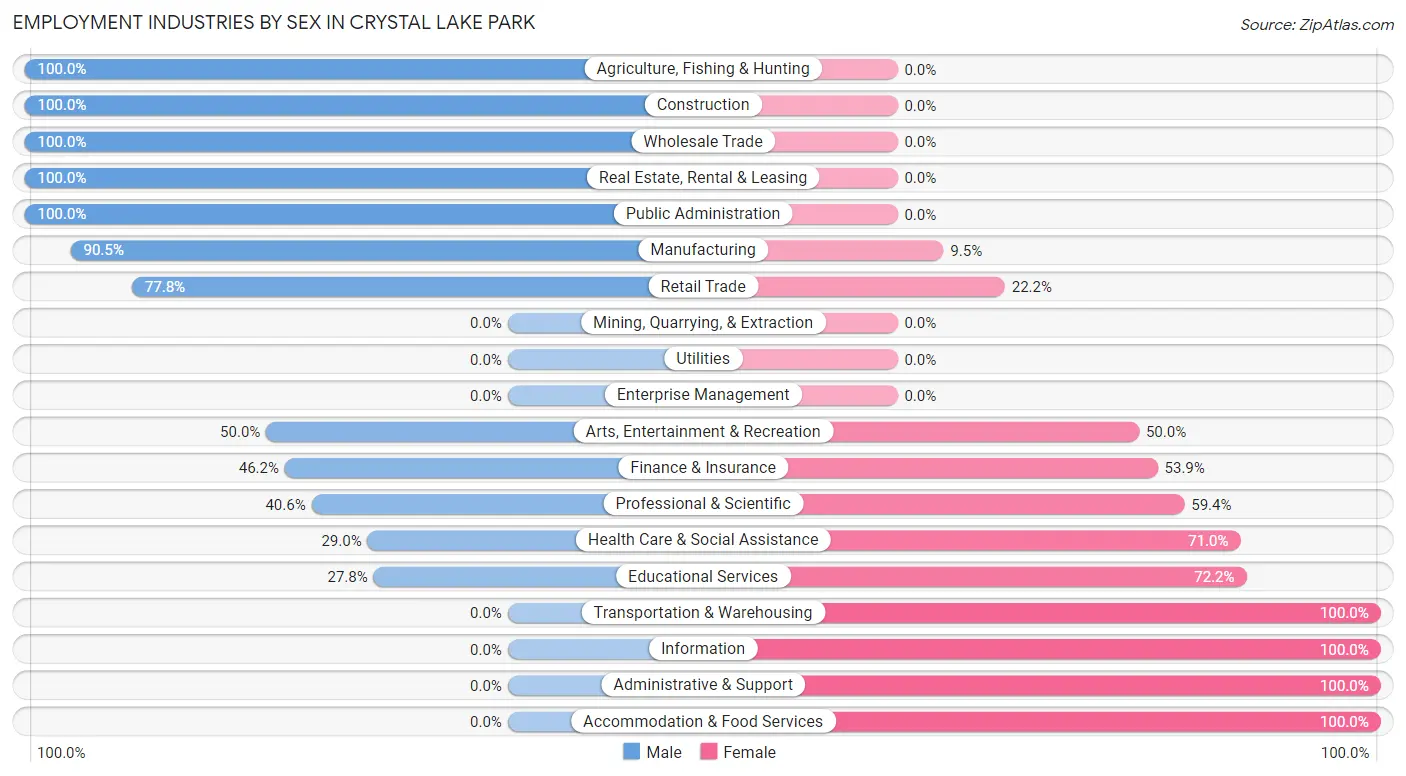
Employment Industries by Sex in Crystal Lake Park
The Crystal Lake Park industries that see more men than women are Agriculture, Fishing & Hunting (100.0%), Construction (100.0%), and Wholesale Trade (100.0%), whereas the industries that tend to have a higher number of women are Transportation & Warehousing (100.0%), Information (100.0%), and Administrative & Support (100.0%).
| Industry | Male | Female |
| Agriculture, Fishing & Hunting | 4 (100.0%) | 0 (0.0%) |
| Mining, Quarrying, & Extraction | 0 (0.0%) | 0 (0.0%) |
| Construction | 7 (100.0%) | 0 (0.0%) |
| Manufacturing | 19 (90.5%) | 2 (9.5%) |
| Wholesale Trade | 12 (100.0%) | 0 (0.0%) |
| Retail Trade | 7 (77.8%) | 2 (22.2%) |
| Transportation & Warehousing | 0 (0.0%) | 5 (100.0%) |
| Utilities | 0 (0.0%) | 0 (0.0%) |
| Information | 0 (0.0%) | 2 (100.0%) |
| Finance & Insurance | 6 (46.2%) | 7 (53.8%) |
| Real Estate, Rental & Leasing | 3 (100.0%) | 0 (0.0%) |
| Professional & Scientific | 13 (40.6%) | 19 (59.4%) |
| Enterprise Management | 0 (0.0%) | 0 (0.0%) |
| Administrative & Support | 0 (0.0%) | 3 (100.0%) |
| Educational Services | 5 (27.8%) | 13 (72.2%) |
| Health Care & Social Assistance | 9 (29.0%) | 22 (71.0%) |
| Arts, Entertainment & Recreation | 2 (50.0%) | 2 (50.0%) |
| Accommodation & Food Services | 0 (0.0%) | 13 (100.0%) |
| Public Administration | 2 (100.0%) | 0 (0.0%) |
| Total | 89 (46.8%) | 101 (53.2%) |
Education in Crystal Lake Park
School Enrollment in Crystal Lake Park
The most common levels of schooling among the 102 students in Crystal Lake Park are middle school (37 | 36.3%), elementary school (28 | 27.5%), and college / undergraduate (13 | 12.8%).
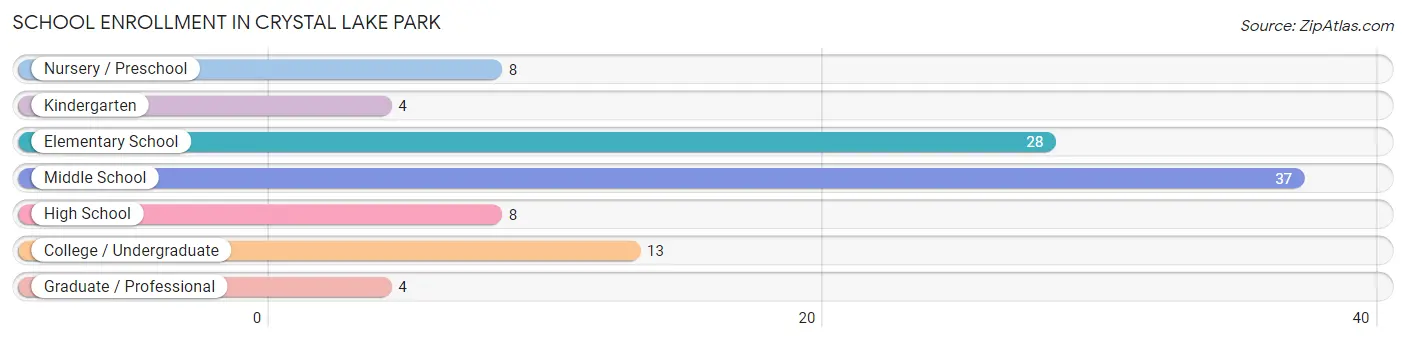
| School Level | # Students | % Students |
| Nursery / Preschool | 8 | 7.8% |
| Kindergarten | 4 | 3.9% |
| Elementary School | 28 | 27.5% |
| Middle School | 37 | 36.3% |
| High School | 8 | 7.8% |
| College / Undergraduate | 13 | 12.8% |
| Graduate / Professional | 4 | 3.9% |
| Total | 102 | 100.0% |
School Enrollment by Age by Funding Source in Crystal Lake Park
Out of a total of 102 students who are enrolled in schools in Crystal Lake Park, 19 (18.6%) attend a private institution, while the remaining 83 (81.4%) are enrolled in public schools. The age group of 35 years and over has the highest likelihood of being enrolled in private schools, with 2 (100.0% in the age bracket) enrolled. Conversely, the age group of 15 to 17 year olds has the lowest likelihood of being enrolled in a private school, with 5 (100.0% in the age bracket) attending a public institution.
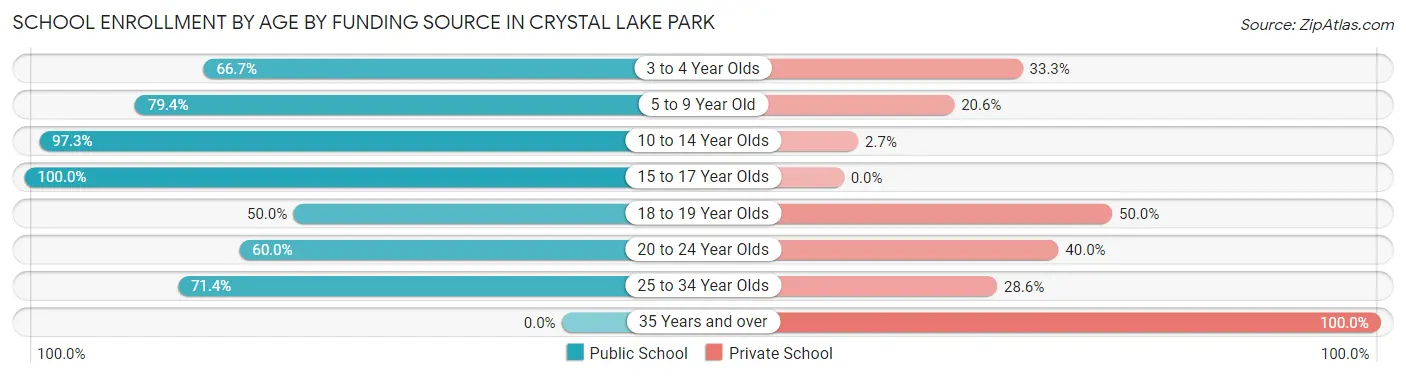
| Age Bracket | Public School | Private School |
| 3 to 4 Year Olds | 4 (66.7%) | 2 (33.3%) |
| 5 to 9 Year Old | 27 (79.4%) | 7 (20.6%) |
| 10 to 14 Year Olds | 36 (97.3%) | 1 (2.7%) |
| 15 to 17 Year Olds | 5 (100.0%) | 0 (0.0%) |
| 18 to 19 Year Olds | 3 (50.0%) | 3 (50.0%) |
| 20 to 24 Year Olds | 3 (60.0%) | 2 (40.0%) |
| 25 to 34 Year Olds | 5 (71.4%) | 2 (28.6%) |
| 35 Years and over | 0 (0.0%) | 2 (100.0%) |
| Total | 83 (81.4%) | 19 (18.6%) |
Educational Attainment by Field of Study in Crystal Lake Park
Business (58 | 17.3%), education (43 | 12.8%), science & technology (32 | 9.6%), literature & languages (31 | 9.2%), and engineering (28 | 8.4%) are the most common fields of study among 335 individuals in Crystal Lake Park who have obtained a bachelor's degree or higher.
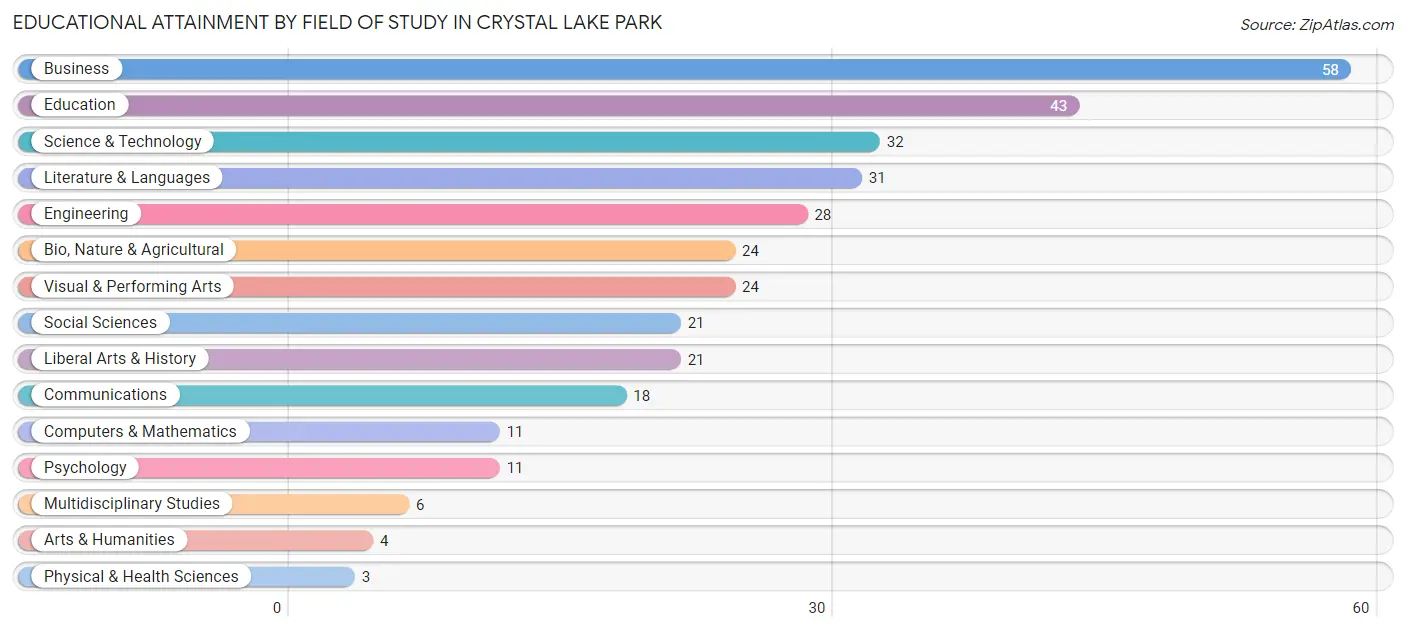
| Field of Study | # Graduates | % Graduates |
| Computers & Mathematics | 11 | 3.3% |
| Bio, Nature & Agricultural | 24 | 7.2% |
| Physical & Health Sciences | 3 | 0.9% |
| Psychology | 11 | 3.3% |
| Social Sciences | 21 | 6.3% |
| Engineering | 28 | 8.4% |
| Multidisciplinary Studies | 6 | 1.8% |
| Science & Technology | 32 | 9.6% |
| Business | 58 | 17.3% |
| Education | 43 | 12.8% |
| Literature & Languages | 31 | 9.2% |
| Liberal Arts & History | 21 | 6.3% |
| Visual & Performing Arts | 24 | 7.2% |
| Communications | 18 | 5.4% |
| Arts & Humanities | 4 | 1.2% |
| Total | 335 | 100.0% |
Transportation & Commute in Crystal Lake Park
Vehicle Availability by Sex in Crystal Lake Park
The most prevalent vehicle ownership categories in Crystal Lake Park are males with 2 vehicles (55, accounting for 63.2%) and females with 2 vehicles (54, making up 57.3%).
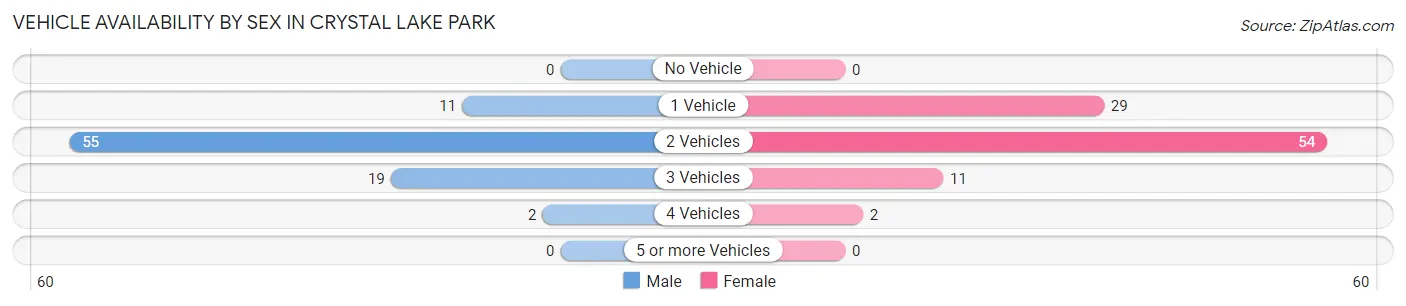
| Vehicles Available | Male | Female |
| No Vehicle | 0 (0.0%) | 0 (0.0%) |
| 1 Vehicle | 11 (12.6%) | 29 (30.2%) |
| 2 Vehicles | 55 (63.2%) | 54 (56.2%) |
| 3 Vehicles | 19 (21.8%) | 11 (11.5%) |
| 4 Vehicles | 2 (2.3%) | 2 (2.1%) |
| 5 or more Vehicles | 0 (0.0%) | 0 (0.0%) |
| Total | 87 (100.0%) | 96 (100.0%) |
Commute Time in Crystal Lake Park
The most frequently occuring commute durations in Crystal Lake Park are 15 to 19 minutes (47 commuters, 29.2%), 20 to 24 minutes (34 commuters, 21.1%), and 30 to 34 minutes (21 commuters, 13.0%).
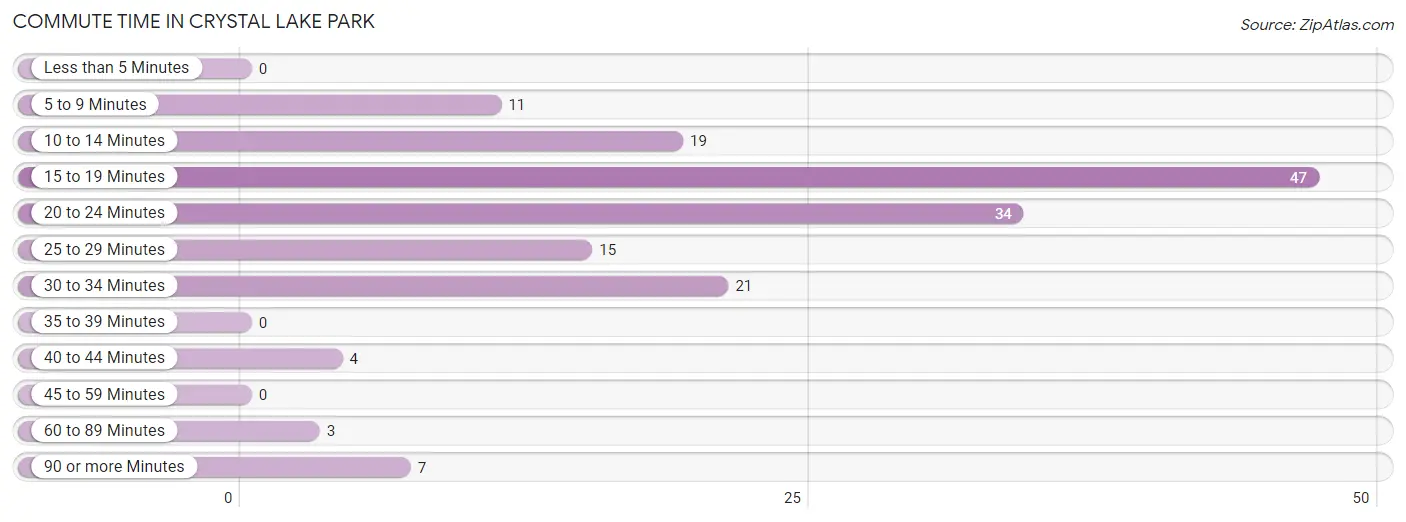
| Commute Time | # Commuters | % Commuters |
| Less than 5 Minutes | 0 | 0.0% |
| 5 to 9 Minutes | 11 | 6.8% |
| 10 to 14 Minutes | 19 | 11.8% |
| 15 to 19 Minutes | 47 | 29.2% |
| 20 to 24 Minutes | 34 | 21.1% |
| 25 to 29 Minutes | 15 | 9.3% |
| 30 to 34 Minutes | 21 | 13.0% |
| 35 to 39 Minutes | 0 | 0.0% |
| 40 to 44 Minutes | 4 | 2.5% |
| 45 to 59 Minutes | 0 | 0.0% |
| 60 to 89 Minutes | 3 | 1.9% |
| 90 or more Minutes | 7 | 4.3% |
Commute Time by Sex in Crystal Lake Park
The most common commute times in Crystal Lake Park are 20 to 24 minutes (20 commuters, 26.7%) for males and 15 to 19 minutes (34 commuters, 39.5%) for females.
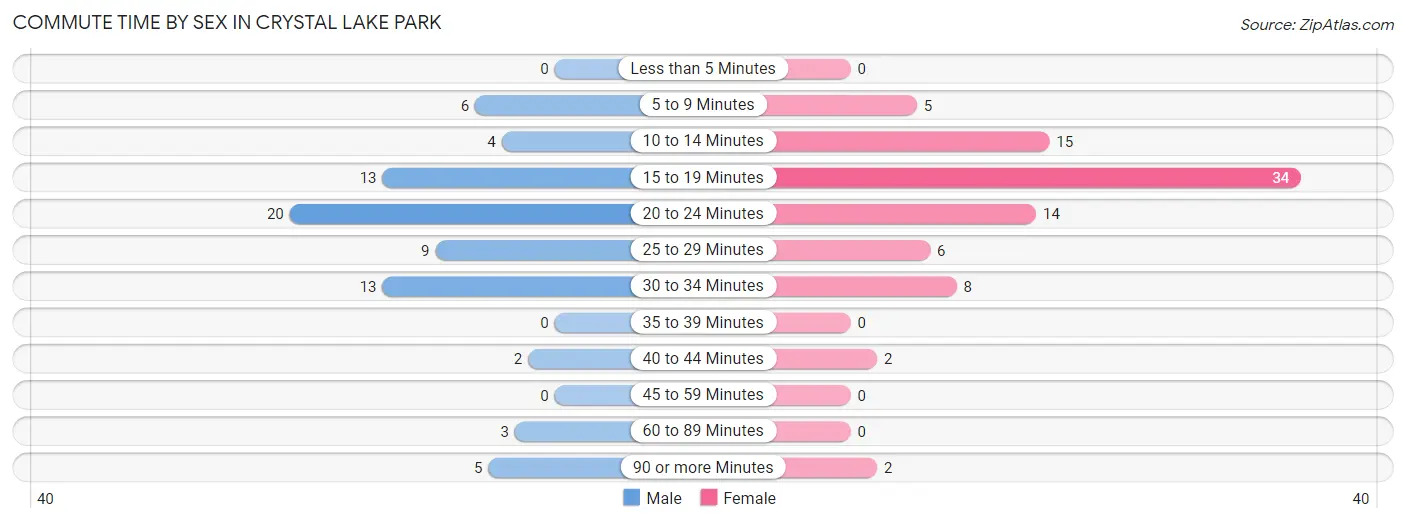
| Commute Time | Male | Female |
| Less than 5 Minutes | 0 (0.0%) | 0 (0.0%) |
| 5 to 9 Minutes | 6 (8.0%) | 5 (5.8%) |
| 10 to 14 Minutes | 4 (5.3%) | 15 (17.4%) |
| 15 to 19 Minutes | 13 (17.3%) | 34 (39.5%) |
| 20 to 24 Minutes | 20 (26.7%) | 14 (16.3%) |
| 25 to 29 Minutes | 9 (12.0%) | 6 (7.0%) |
| 30 to 34 Minutes | 13 (17.3%) | 8 (9.3%) |
| 35 to 39 Minutes | 0 (0.0%) | 0 (0.0%) |
| 40 to 44 Minutes | 2 (2.7%) | 2 (2.3%) |
| 45 to 59 Minutes | 0 (0.0%) | 0 (0.0%) |
| 60 to 89 Minutes | 3 (4.0%) | 0 (0.0%) |
| 90 or more Minutes | 5 (6.7%) | 2 (2.3%) |
Time of Departure to Work by Sex in Crystal Lake Park
The most frequent times of departure to work in Crystal Lake Park are 7:00 AM to 7:29 AM (19, 25.3%) for males and 7:30 AM to 7:59 AM (19, 22.1%) for females.
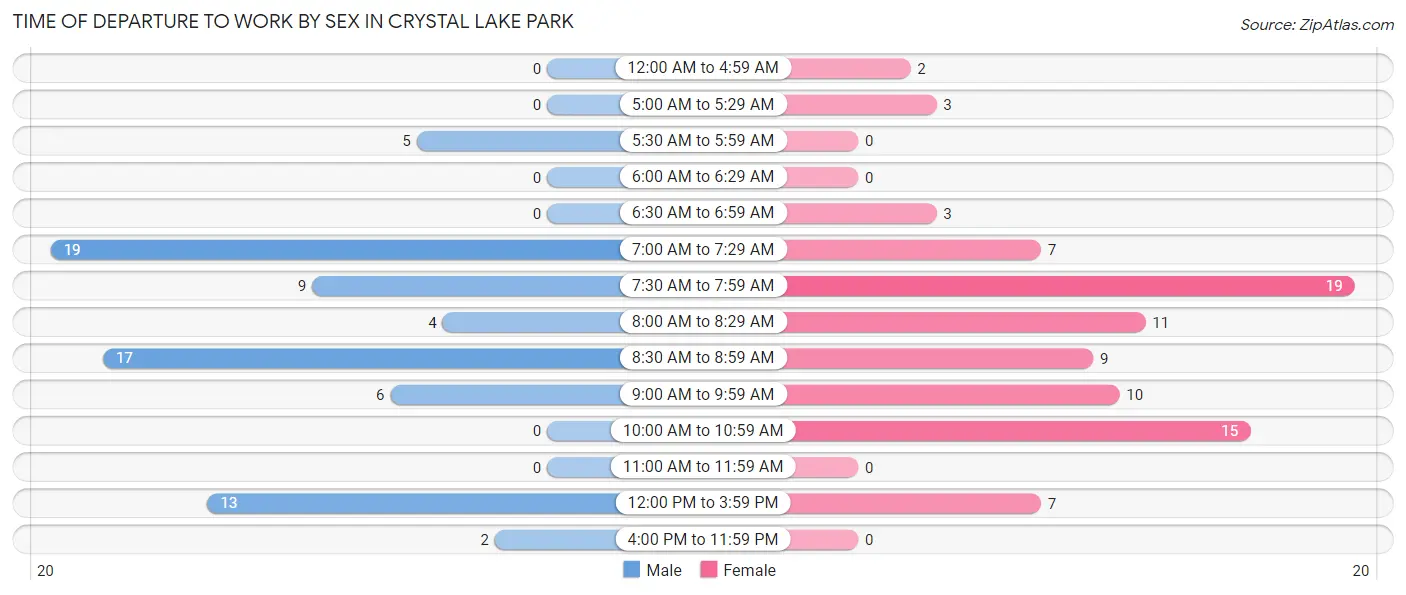
| Time of Departure | Male | Female |
| 12:00 AM to 4:59 AM | 0 (0.0%) | 2 (2.3%) |
| 5:00 AM to 5:29 AM | 0 (0.0%) | 3 (3.5%) |
| 5:30 AM to 5:59 AM | 5 (6.7%) | 0 (0.0%) |
| 6:00 AM to 6:29 AM | 0 (0.0%) | 0 (0.0%) |
| 6:30 AM to 6:59 AM | 0 (0.0%) | 3 (3.5%) |
| 7:00 AM to 7:29 AM | 19 (25.3%) | 7 (8.1%) |
| 7:30 AM to 7:59 AM | 9 (12.0%) | 19 (22.1%) |
| 8:00 AM to 8:29 AM | 4 (5.3%) | 11 (12.8%) |
| 8:30 AM to 8:59 AM | 17 (22.7%) | 9 (10.5%) |
| 9:00 AM to 9:59 AM | 6 (8.0%) | 10 (11.6%) |
| 10:00 AM to 10:59 AM | 0 (0.0%) | 15 (17.4%) |
| 11:00 AM to 11:59 AM | 0 (0.0%) | 0 (0.0%) |
| 12:00 PM to 3:59 PM | 13 (17.3%) | 7 (8.1%) |
| 4:00 PM to 11:59 PM | 2 (2.7%) | 0 (0.0%) |
| Total | 75 (100.0%) | 86 (100.0%) |
Housing Occupancy in Crystal Lake Park
Occupancy by Ownership in Crystal Lake Park
Of the total 200 dwellings in Crystal Lake Park, owner-occupied units account for 186 (93.0%), while renter-occupied units make up 14 (7.0%).
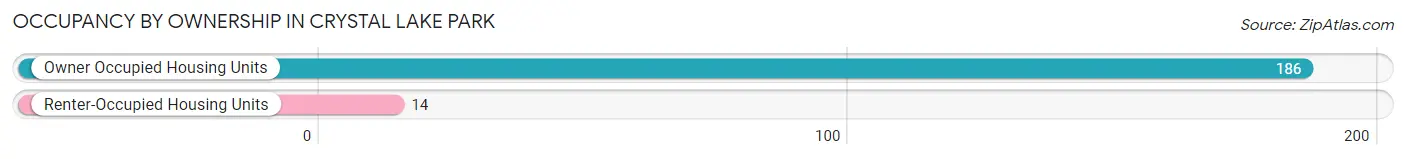
| Occupancy | # Housing Units | % Housing Units |
| Owner Occupied Housing Units | 186 | 93.0% |
| Renter-Occupied Housing Units | 14 | 7.0% |
| Total Occupied Housing Units | 200 | 100.0% |
Occupancy by Household Size in Crystal Lake Park
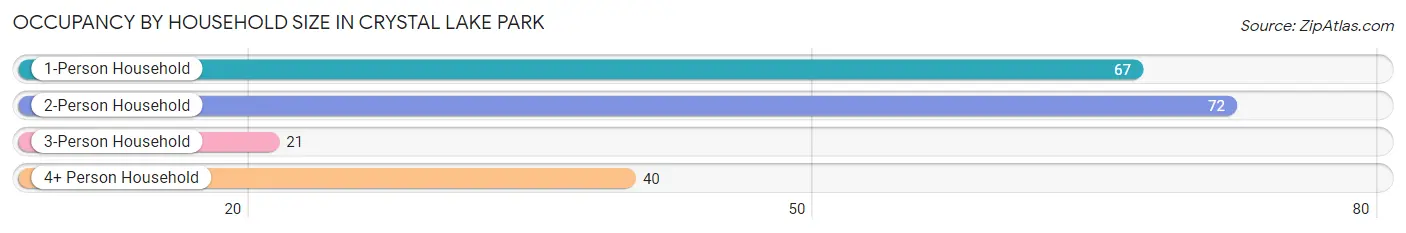
| Household Size | # Housing Units | % Housing Units |
| 1-Person Household | 67 | 33.5% |
| 2-Person Household | 72 | 36.0% |
| 3-Person Household | 21 | 10.5% |
| 4+ Person Household | 40 | 20.0% |
| Total Housing Units | 200 | 100.0% |
Occupancy by Ownership by Household Size in Crystal Lake Park
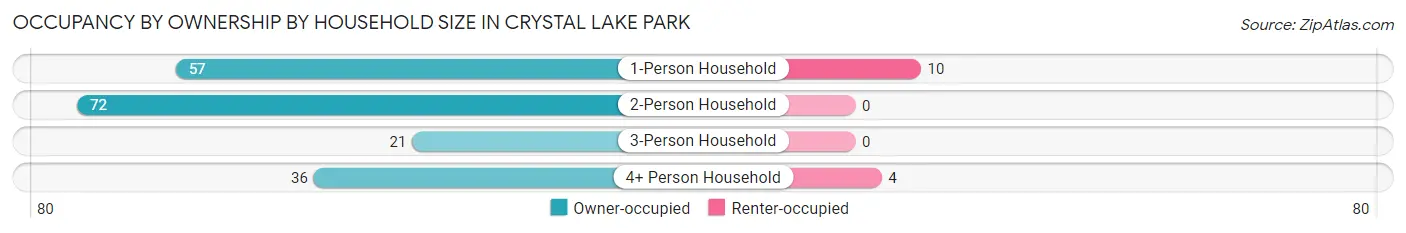
| Household Size | Owner-occupied | Renter-occupied |
| 1-Person Household | 57 (85.1%) | 10 (14.9%) |
| 2-Person Household | 72 (100.0%) | 0 (0.0%) |
| 3-Person Household | 21 (100.0%) | 0 (0.0%) |
| 4+ Person Household | 36 (90.0%) | 4 (10.0%) |
| Total Housing Units | 186 (93.0%) | 14 (7.0%) |
Occupancy by Educational Attainment in Crystal Lake Park
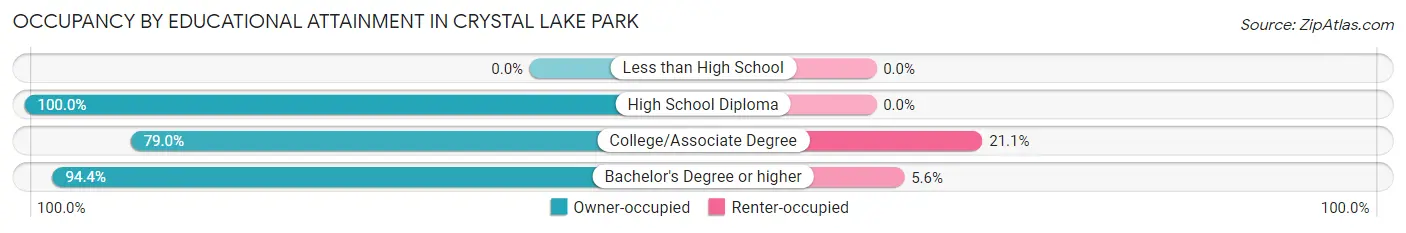
| Household Size | Owner-occupied | Renter-occupied |
| Less than High School | 0 (0.0%) | 0 (0.0%) |
| High School Diploma | 1 (100.0%) | 0 (0.0%) |
| College/Associate Degree | 15 (78.9%) | 4 (21.0%) |
| Bachelor's Degree or higher | 170 (94.4%) | 10 (5.6%) |
Occupancy by Age of Householder in Crystal Lake Park
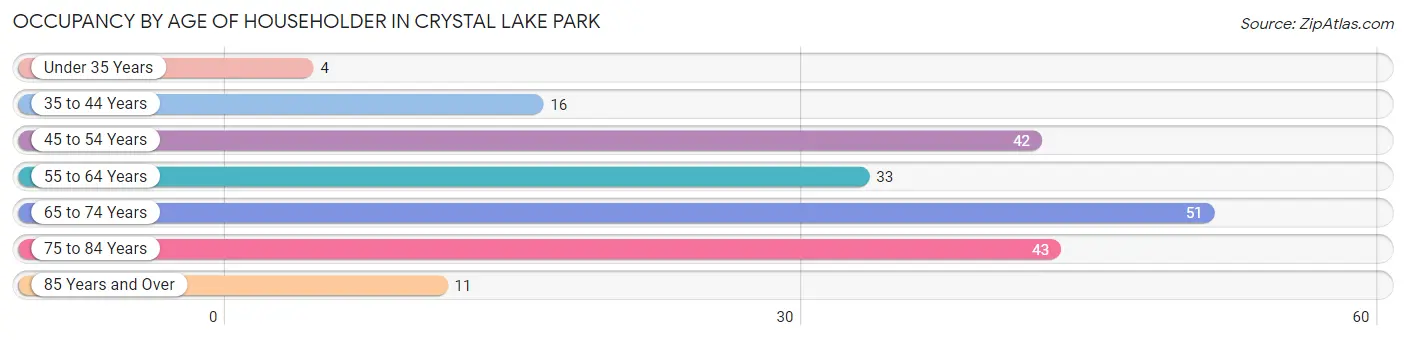
| Age Bracket | # Households | % Households |
| Under 35 Years | 4 | 2.0% |
| 35 to 44 Years | 16 | 8.0% |
| 45 to 54 Years | 42 | 21.0% |
| 55 to 64 Years | 33 | 16.5% |
| 65 to 74 Years | 51 | 25.5% |
| 75 to 84 Years | 43 | 21.5% |
| 85 Years and Over | 11 | 5.5% |
| Total | 200 | 100.0% |
Housing Finances in Crystal Lake Park
Median Income by Occupancy in Crystal Lake Park
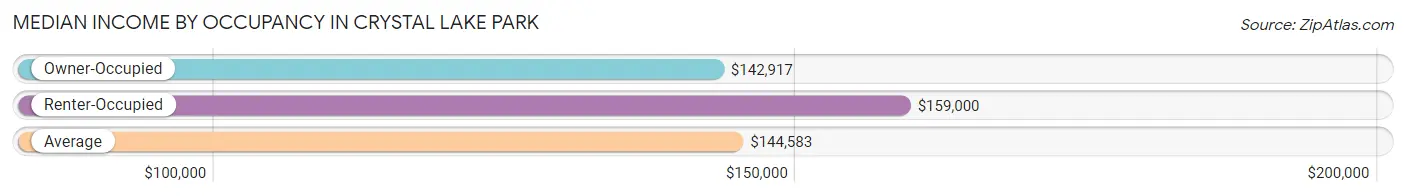
| Occupancy Type | # Households | Median Income |
| Owner-Occupied | 186 (93.0%) | $142,917 |
| Renter-Occupied | 14 (7.0%) | $159,000 |
| Average | 200 (100.0%) | $144,583 |
Occupancy by Householder Income Bracket in Crystal Lake Park
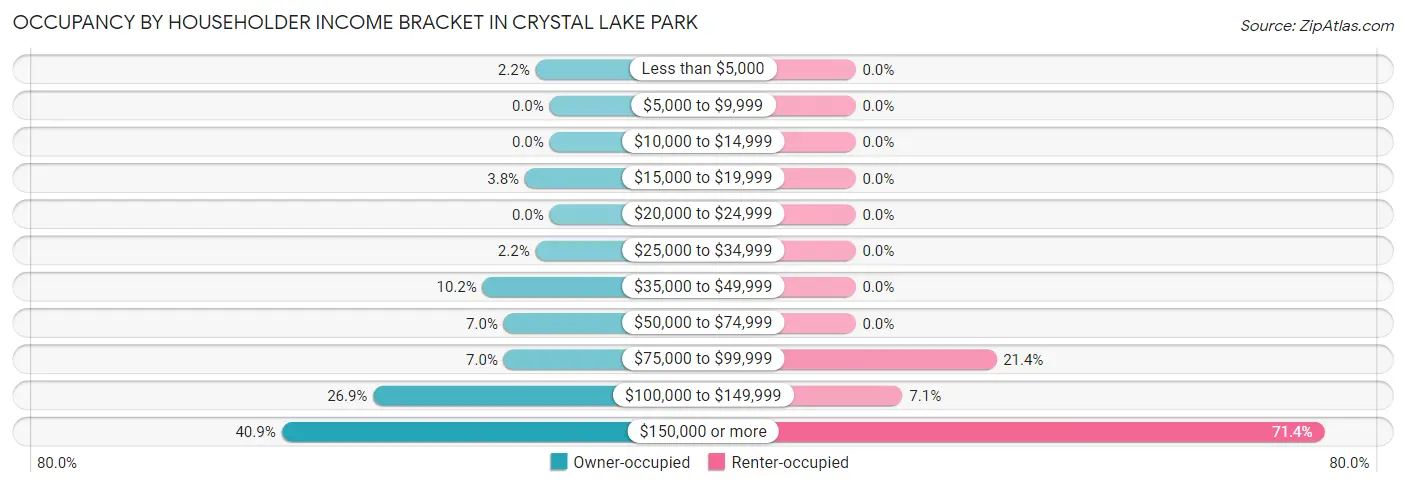
| Income Bracket | Owner-occupied | Renter-occupied |
| Less than $5,000 | 4 (2.1%) | 0 (0.0%) |
| $5,000 to $9,999 | 0 (0.0%) | 0 (0.0%) |
| $10,000 to $14,999 | 0 (0.0%) | 0 (0.0%) |
| $15,000 to $19,999 | 7 (3.8%) | 0 (0.0%) |
| $20,000 to $24,999 | 0 (0.0%) | 0 (0.0%) |
| $25,000 to $34,999 | 4 (2.1%) | 0 (0.0%) |
| $35,000 to $49,999 | 19 (10.2%) | 0 (0.0%) |
| $50,000 to $74,999 | 13 (7.0%) | 0 (0.0%) |
| $75,000 to $99,999 | 13 (7.0%) | 3 (21.4%) |
| $100,000 to $149,999 | 50 (26.9%) | 1 (7.1%) |
| $150,000 or more | 76 (40.9%) | 10 (71.4%) |
| Total | 186 (100.0%) | 14 (100.0%) |
Monthly Housing Cost Tiers in Crystal Lake Park
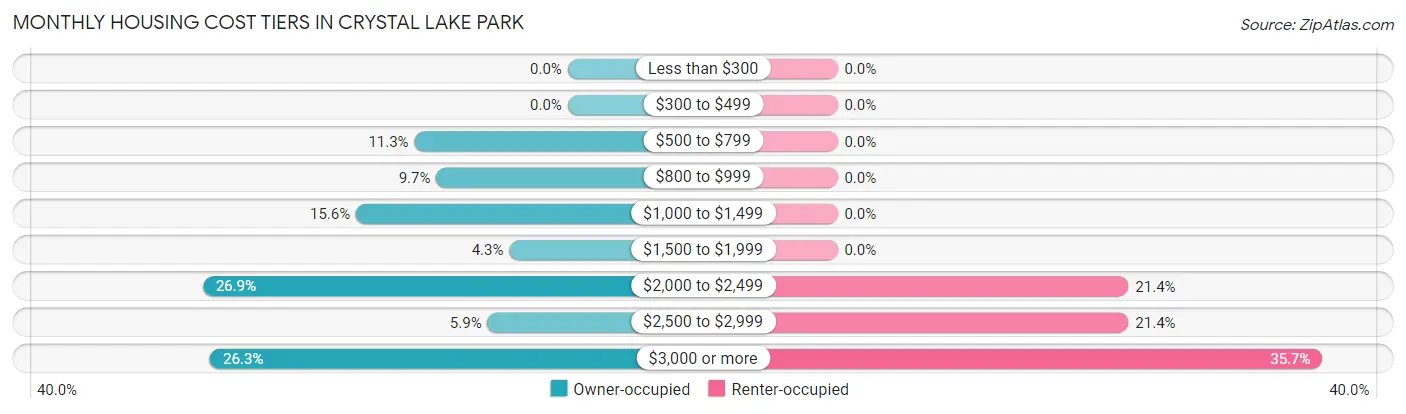
| Monthly Cost | Owner-occupied | Renter-occupied |
| Less than $300 | 0 (0.0%) | 0 (0.0%) |
| $300 to $499 | 0 (0.0%) | 0 (0.0%) |
| $500 to $799 | 21 (11.3%) | 0 (0.0%) |
| $800 to $999 | 18 (9.7%) | 0 (0.0%) |
| $1,000 to $1,499 | 29 (15.6%) | 0 (0.0%) |
| $1,500 to $1,999 | 8 (4.3%) | 0 (0.0%) |
| $2,000 to $2,499 | 50 (26.9%) | 3 (21.4%) |
| $2,500 to $2,999 | 11 (5.9%) | 3 (21.4%) |
| $3,000 or more | 49 (26.3%) | 5 (35.7%) |
| Total | 186 (100.0%) | 14 (100.0%) |
Physical Housing Characteristics in Crystal Lake Park
Housing Structures in Crystal Lake Park
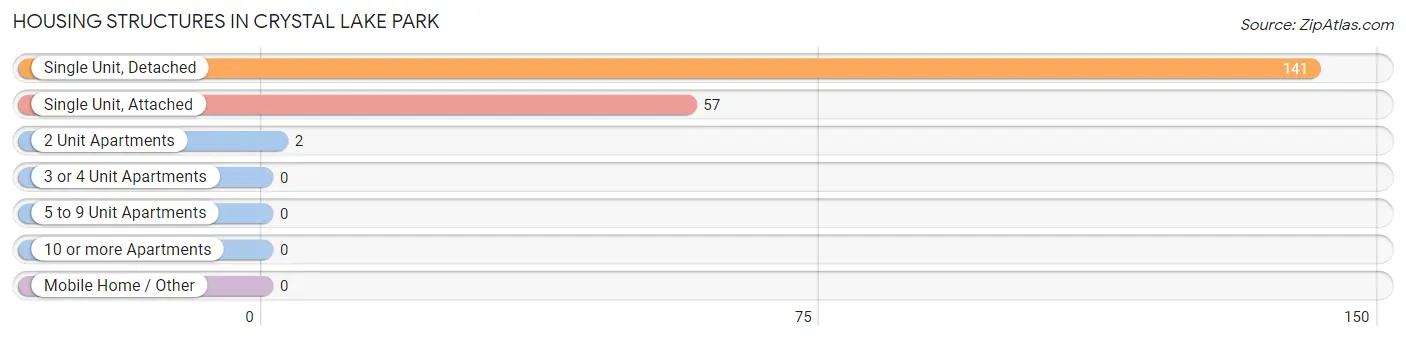
| Structure Type | # Housing Units | % Housing Units |
| Single Unit, Detached | 141 | 70.5% |
| Single Unit, Attached | 57 | 28.5% |
| 2 Unit Apartments | 2 | 1.0% |
| 3 or 4 Unit Apartments | 0 | 0.0% |
| 5 to 9 Unit Apartments | 0 | 0.0% |
| 10 or more Apartments | 0 | 0.0% |
| Mobile Home / Other | 0 | 0.0% |
| Total | 200 | 100.0% |
Housing Structures by Occupancy in Crystal Lake Park
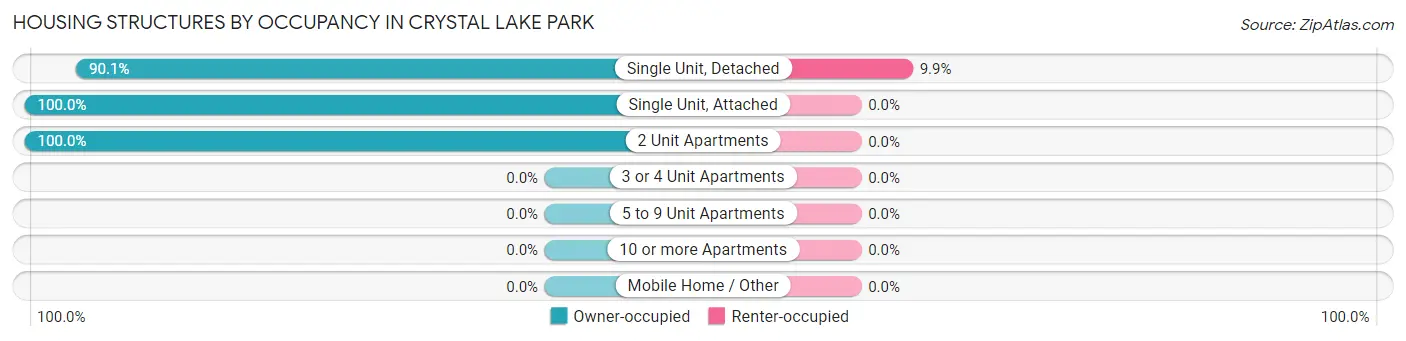
| Structure Type | Owner-occupied | Renter-occupied |
| Single Unit, Detached | 127 (90.1%) | 14 (9.9%) |
| Single Unit, Attached | 57 (100.0%) | 0 (0.0%) |
| 2 Unit Apartments | 2 (100.0%) | 0 (0.0%) |
| 3 or 4 Unit Apartments | 0 (0.0%) | 0 (0.0%) |
| 5 to 9 Unit Apartments | 0 (0.0%) | 0 (0.0%) |
| 10 or more Apartments | 0 (0.0%) | 0 (0.0%) |
| Mobile Home / Other | 0 (0.0%) | 0 (0.0%) |
| Total | 186 (93.0%) | 14 (7.0%) |
Housing Structures by Number of Rooms in Crystal Lake Park
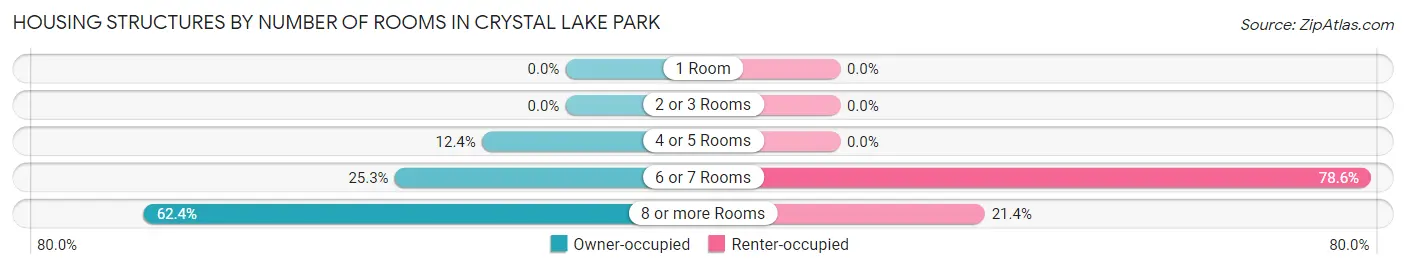
| Number of Rooms | Owner-occupied | Renter-occupied |
| 1 Room | 0 (0.0%) | 0 (0.0%) |
| 2 or 3 Rooms | 0 (0.0%) | 0 (0.0%) |
| 4 or 5 Rooms | 23 (12.4%) | 0 (0.0%) |
| 6 or 7 Rooms | 47 (25.3%) | 11 (78.6%) |
| 8 or more Rooms | 116 (62.4%) | 3 (21.4%) |
| Total | 186 (100.0%) | 14 (100.0%) |
Housing Structure by Heating Type in Crystal Lake Park
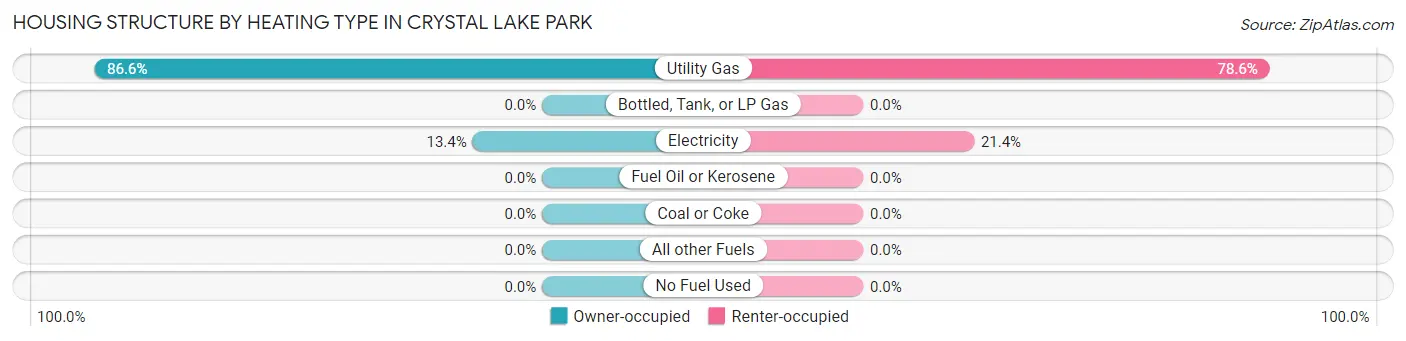
| Heating Type | Owner-occupied | Renter-occupied |
| Utility Gas | 161 (86.6%) | 11 (78.6%) |
| Bottled, Tank, or LP Gas | 0 (0.0%) | 0 (0.0%) |
| Electricity | 25 (13.4%) | 3 (21.4%) |
| Fuel Oil or Kerosene | 0 (0.0%) | 0 (0.0%) |
| Coal or Coke | 0 (0.0%) | 0 (0.0%) |
| All other Fuels | 0 (0.0%) | 0 (0.0%) |
| No Fuel Used | 0 (0.0%) | 0 (0.0%) |
| Total | 186 (100.0%) | 14 (100.0%) |
Household Vehicle Usage in Crystal Lake Park
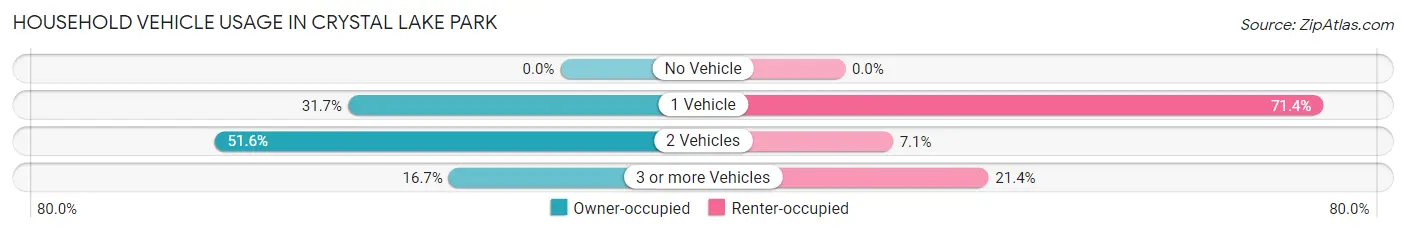
| Vehicles per Household | Owner-occupied | Renter-occupied |
| No Vehicle | 0 (0.0%) | 0 (0.0%) |
| 1 Vehicle | 59 (31.7%) | 10 (71.4%) |
| 2 Vehicles | 96 (51.6%) | 1 (7.1%) |
| 3 or more Vehicles | 31 (16.7%) | 3 (21.4%) |
| Total | 186 (100.0%) | 14 (100.0%) |
Real Estate & Mortgages in Crystal Lake Park
Real Estate and Mortgage Overview in Crystal Lake Park
| Characteristic | Without Mortgage | With Mortgage |
| Housing Units | 81 | 105 |
| Median Property Value | $614,100 | $589,300 |
| Median Household Income | $106,250 | $53 |
| Monthly Housing Costs | $1,181 | $47 |
| Real Estate Taxes | $6,534 | $0 |
Property Value by Mortgage Status in Crystal Lake Park
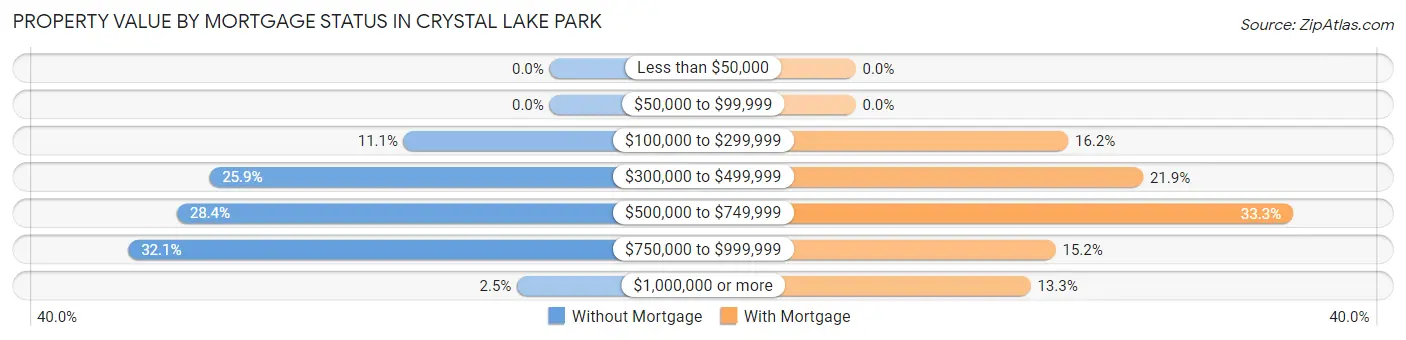
| Property Value | Without Mortgage | With Mortgage |
| Less than $50,000 | 0 (0.0%) | 0 (0.0%) |
| $50,000 to $99,999 | 0 (0.0%) | 0 (0.0%) |
| $100,000 to $299,999 | 9 (11.1%) | 17 (16.2%) |
| $300,000 to $499,999 | 21 (25.9%) | 23 (21.9%) |
| $500,000 to $749,999 | 23 (28.4%) | 35 (33.3%) |
| $750,000 to $999,999 | 26 (32.1%) | 16 (15.2%) |
| $1,000,000 or more | 2 (2.5%) | 14 (13.3%) |
| Total | 81 (100.0%) | 105 (100.0%) |
Household Income by Mortgage Status in Crystal Lake Park
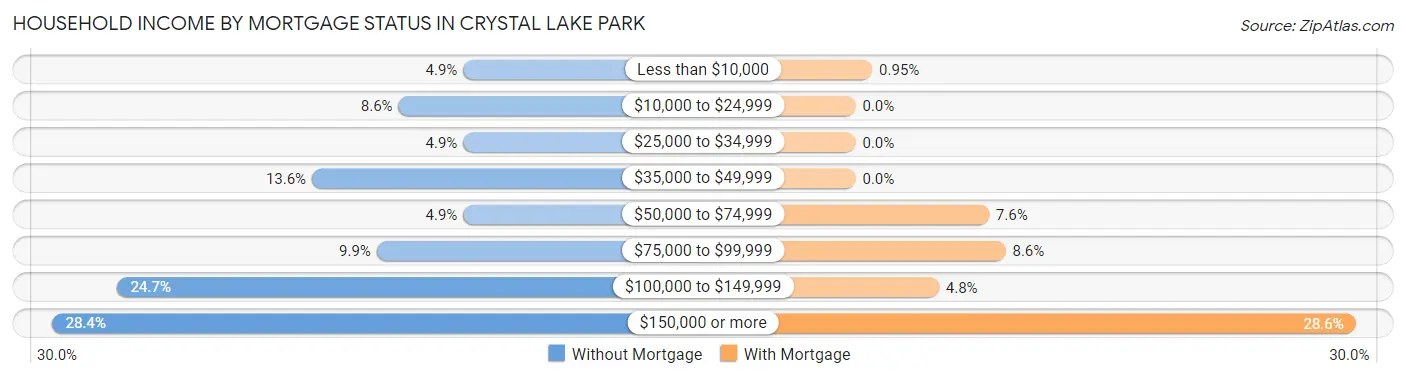
| Household Income | Without Mortgage | With Mortgage |
| Less than $10,000 | 4 (4.9%) | 1 (0.9%) |
| $10,000 to $24,999 | 7 (8.6%) | 0 (0.0%) |
| $25,000 to $34,999 | 4 (4.9%) | 0 (0.0%) |
| $35,000 to $49,999 | 11 (13.6%) | 0 (0.0%) |
| $50,000 to $74,999 | 4 (4.9%) | 8 (7.6%) |
| $75,000 to $99,999 | 8 (9.9%) | 9 (8.6%) |
| $100,000 to $149,999 | 20 (24.7%) | 5 (4.8%) |
| $150,000 or more | 23 (28.4%) | 30 (28.6%) |
| Total | 81 (100.0%) | 105 (100.0%) |
Property Value to Household Income Ratio in Crystal Lake Park
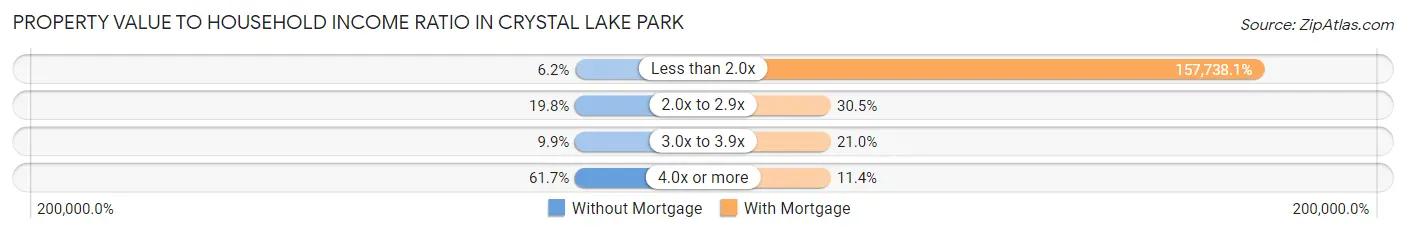
| Value-to-Income Ratio | Without Mortgage | With Mortgage |
| Less than 2.0x | 5 (6.2%) | 165,625 (157,738.1%) |
| 2.0x to 2.9x | 16 (19.8%) | 32 (30.5%) |
| 3.0x to 3.9x | 8 (9.9%) | 22 (20.9%) |
| 4.0x or more | 50 (61.7%) | 12 (11.4%) |
| Total | 81 (100.0%) | 105 (100.0%) |
Real Estate Taxes by Mortgage Status in Crystal Lake Park
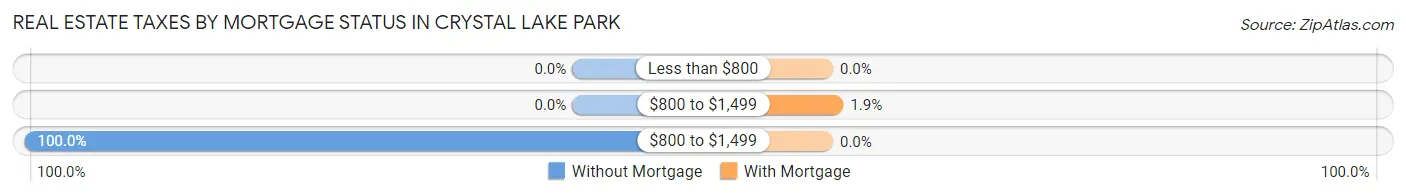
| Property Taxes | Without Mortgage | With Mortgage |
| Less than $800 | 0 (0.0%) | 0 (0.0%) |
| $800 to $1,499 | 0 (0.0%) | 2 (1.9%) |
| $800 to $1,499 | 81 (100.0%) | 0 (0.0%) |
| Total | 81 (100.0%) | 105 (100.0%) |
Health & Disability in Crystal Lake Park
Health Insurance Coverage by Age in Crystal Lake Park
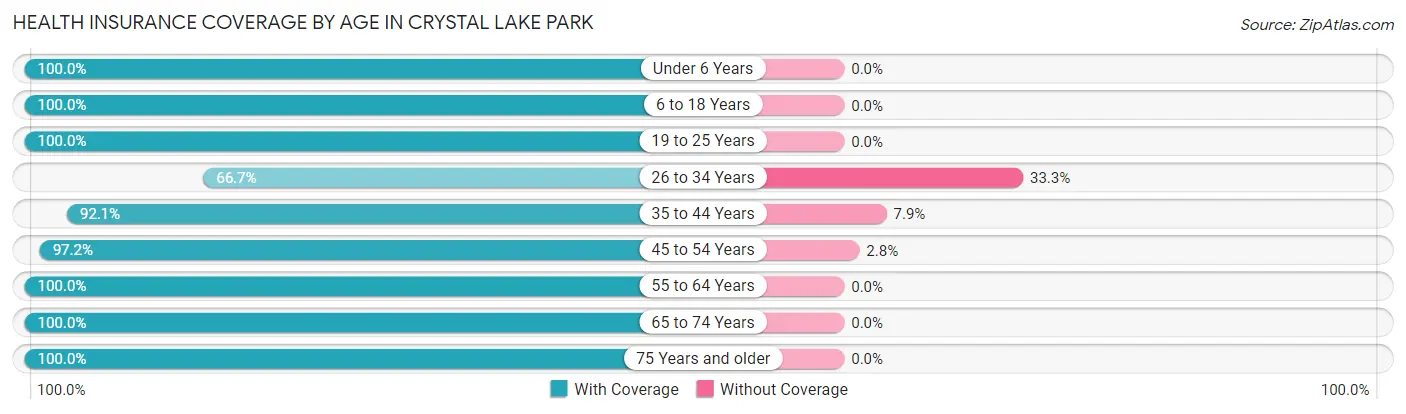
| Age Bracket | With Coverage | Without Coverage |
| Under 6 Years | 23 (100.0%) | 0 (0.0%) |
| 6 to 18 Years | 74 (100.0%) | 0 (0.0%) |
| 19 to 25 Years | 17 (100.0%) | 0 (0.0%) |
| 26 to 34 Years | 10 (66.7%) | 5 (33.3%) |
| 35 to 44 Years | 35 (92.1%) | 3 (7.9%) |
| 45 to 54 Years | 69 (97.2%) | 2 (2.8%) |
| 55 to 64 Years | 61 (100.0%) | 0 (0.0%) |
| 65 to 74 Years | 83 (100.0%) | 0 (0.0%) |
| 75 Years and older | 78 (100.0%) | 0 (0.0%) |
| Total | 450 (97.8%) | 10 (2.2%) |
Health Insurance Coverage by Citizenship Status in Crystal Lake Park
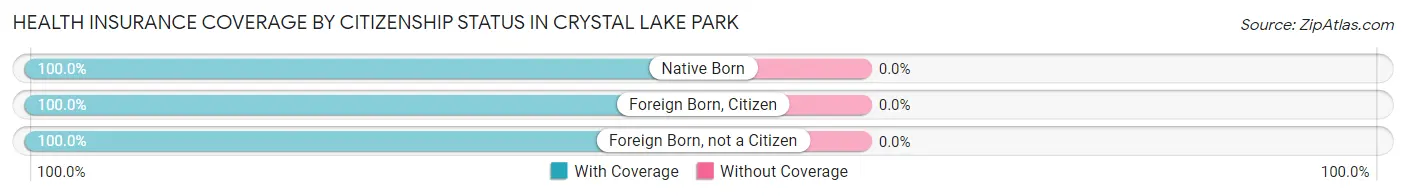
| Citizenship Status | With Coverage | Without Coverage |
| Native Born | 23 (100.0%) | 0 (0.0%) |
| Foreign Born, Citizen | 74 (100.0%) | 0 (0.0%) |
| Foreign Born, not a Citizen | 17 (100.0%) | 0 (0.0%) |
Health Insurance Coverage by Household Income in Crystal Lake Park
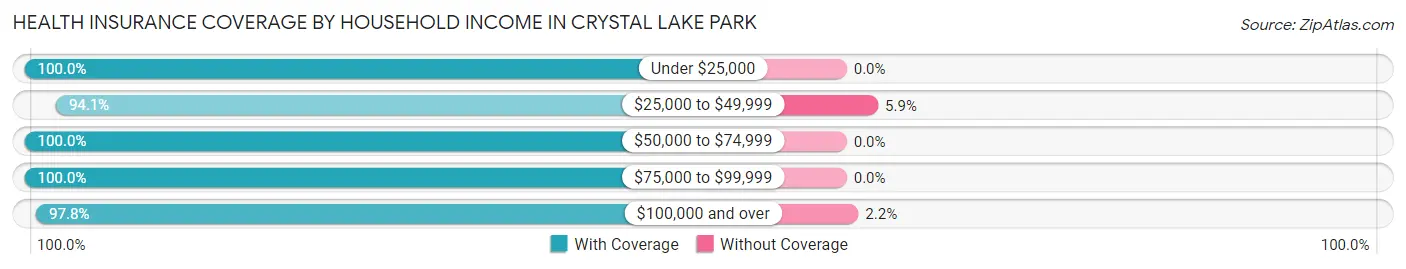
| Household Income | With Coverage | Without Coverage |
| Under $25,000 | 11 (100.0%) | 0 (0.0%) |
| $25,000 to $49,999 | 32 (94.1%) | 2 (5.9%) |
| $50,000 to $74,999 | 19 (100.0%) | 0 (0.0%) |
| $75,000 to $99,999 | 27 (100.0%) | 0 (0.0%) |
| $100,000 and over | 361 (97.8%) | 8 (2.2%) |
Public vs Private Health Insurance Coverage by Age in Crystal Lake Park
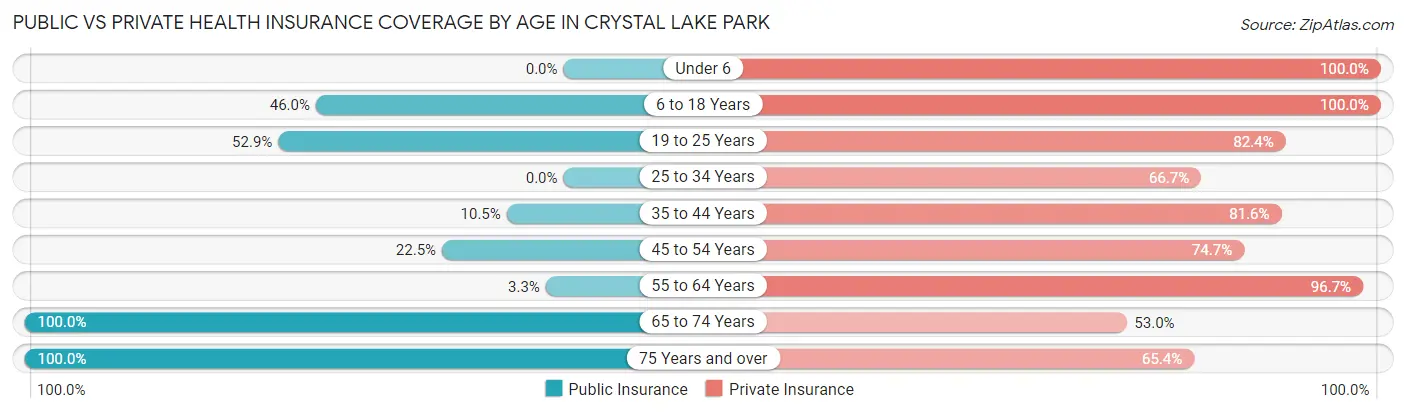
| Age Bracket | Public Insurance | Private Insurance |
| Under 6 | 0 (0.0%) | 23 (100.0%) |
| 6 to 18 Years | 34 (46.0%) | 74 (100.0%) |
| 19 to 25 Years | 9 (52.9%) | 14 (82.4%) |
| 25 to 34 Years | 0 (0.0%) | 10 (66.7%) |
| 35 to 44 Years | 4 (10.5%) | 31 (81.6%) |
| 45 to 54 Years | 16 (22.5%) | 53 (74.7%) |
| 55 to 64 Years | 2 (3.3%) | 59 (96.7%) |
| 65 to 74 Years | 83 (100.0%) | 44 (53.0%) |
| 75 Years and over | 78 (100.0%) | 51 (65.4%) |
| Total | 226 (49.1%) | 359 (78.0%) |
Disability Status by Sex by Age in Crystal Lake Park
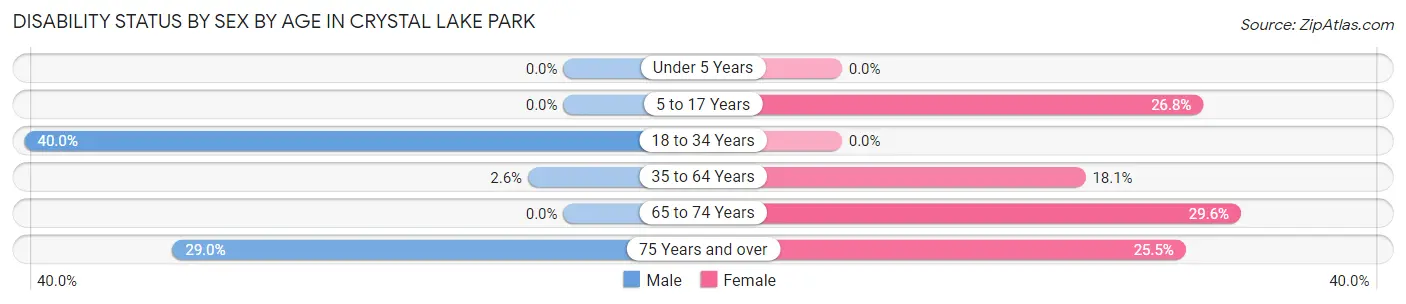
| Age Bracket | Male | Female |
| Under 5 Years | 0 (0.0%) | 0 (0.0%) |
| 5 to 17 Years | 0 (0.0%) | 11 (26.8%) |
| 18 to 34 Years | 6 (40.0%) | 0 (0.0%) |
| 35 to 64 Years | 2 (2.6%) | 17 (18.1%) |
| 65 to 74 Years | 0 (0.0%) | 16 (29.6%) |
| 75 Years and over | 9 (29.0%) | 12 (25.5%) |
Disability Class by Sex by Age in Crystal Lake Park
Disability Class: Hearing Difficulty
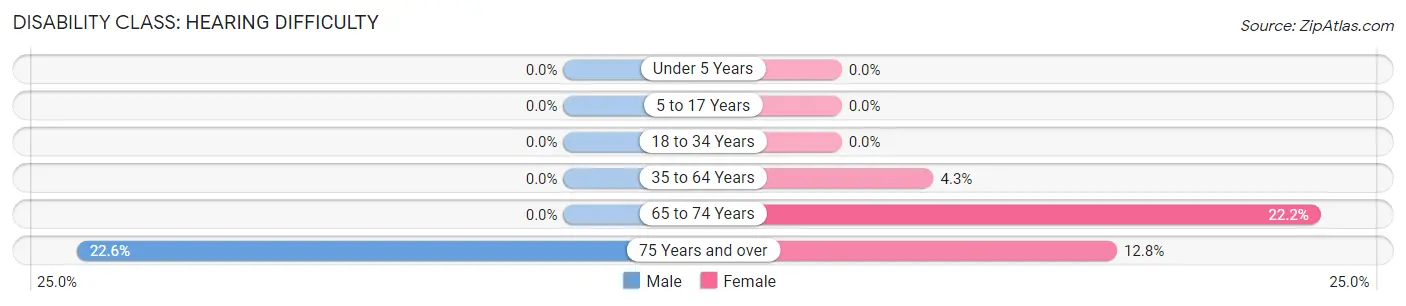
| Age Bracket | Male | Female |
| Under 5 Years | 0 (0.0%) | 0 (0.0%) |
| 5 to 17 Years | 0 (0.0%) | 0 (0.0%) |
| 18 to 34 Years | 0 (0.0%) | 0 (0.0%) |
| 35 to 64 Years | 0 (0.0%) | 4 (4.3%) |
| 65 to 74 Years | 0 (0.0%) | 12 (22.2%) |
| 75 Years and over | 7 (22.6%) | 6 (12.8%) |
Disability Class: Vision Difficulty
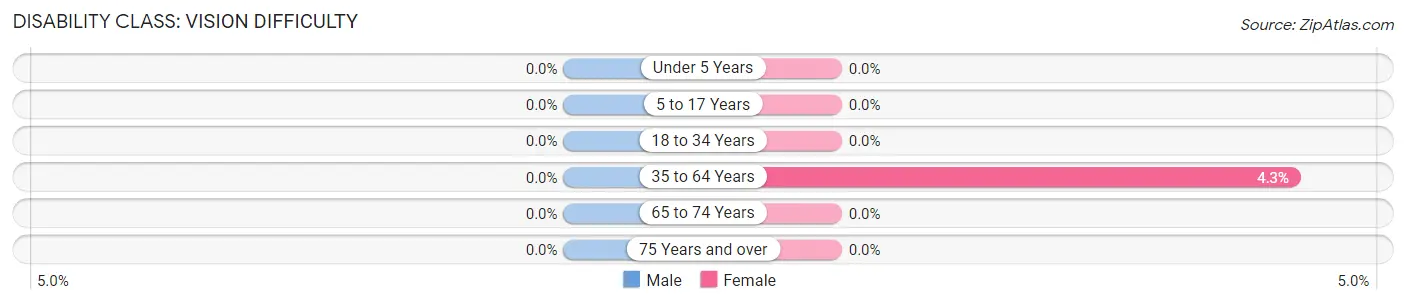
| Age Bracket | Male | Female |
| Under 5 Years | 0 (0.0%) | 0 (0.0%) |
| 5 to 17 Years | 0 (0.0%) | 0 (0.0%) |
| 18 to 34 Years | 0 (0.0%) | 0 (0.0%) |
| 35 to 64 Years | 0 (0.0%) | 4 (4.3%) |
| 65 to 74 Years | 0 (0.0%) | 0 (0.0%) |
| 75 Years and over | 0 (0.0%) | 0 (0.0%) |
Disability Class: Cognitive Difficulty
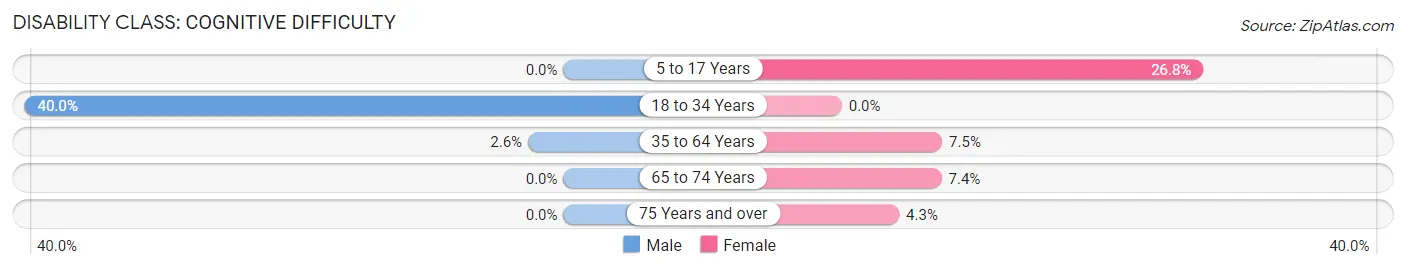
| Age Bracket | Male | Female |
| 5 to 17 Years | 0 (0.0%) | 11 (26.8%) |
| 18 to 34 Years | 6 (40.0%) | 0 (0.0%) |
| 35 to 64 Years | 2 (2.6%) | 7 (7.4%) |
| 65 to 74 Years | 0 (0.0%) | 4 (7.4%) |
| 75 Years and over | 0 (0.0%) | 2 (4.3%) |
Disability Class: Ambulatory Difficulty
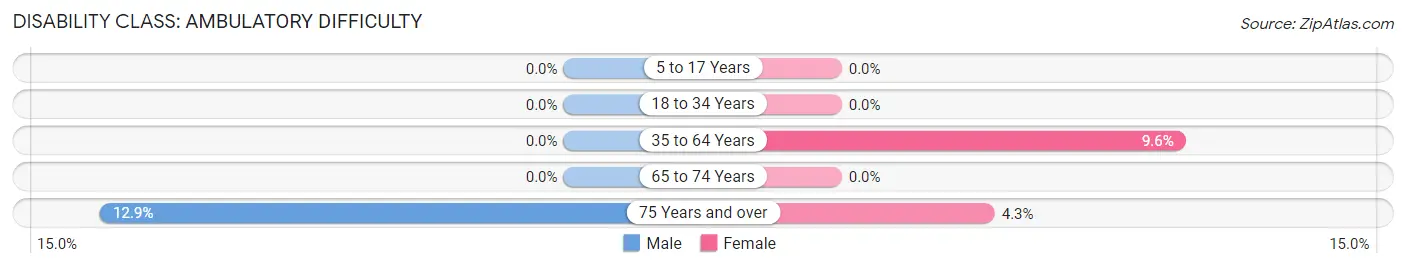
| Age Bracket | Male | Female |
| 5 to 17 Years | 0 (0.0%) | 0 (0.0%) |
| 18 to 34 Years | 0 (0.0%) | 0 (0.0%) |
| 35 to 64 Years | 0 (0.0%) | 9 (9.6%) |
| 65 to 74 Years | 0 (0.0%) | 0 (0.0%) |
| 75 Years and over | 4 (12.9%) | 2 (4.3%) |
Disability Class: Self-Care Difficulty
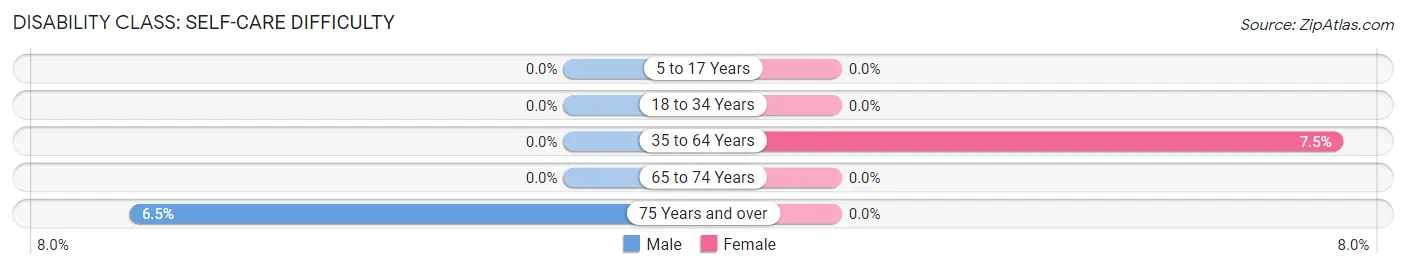
| Age Bracket | Male | Female |
| 5 to 17 Years | 0 (0.0%) | 0 (0.0%) |
| 18 to 34 Years | 0 (0.0%) | 0 (0.0%) |
| 35 to 64 Years | 0 (0.0%) | 7 (7.4%) |
| 65 to 74 Years | 0 (0.0%) | 0 (0.0%) |
| 75 Years and over | 2 (6.5%) | 0 (0.0%) |
Technology Access in Crystal Lake Park
Computing Device Access in Crystal Lake Park
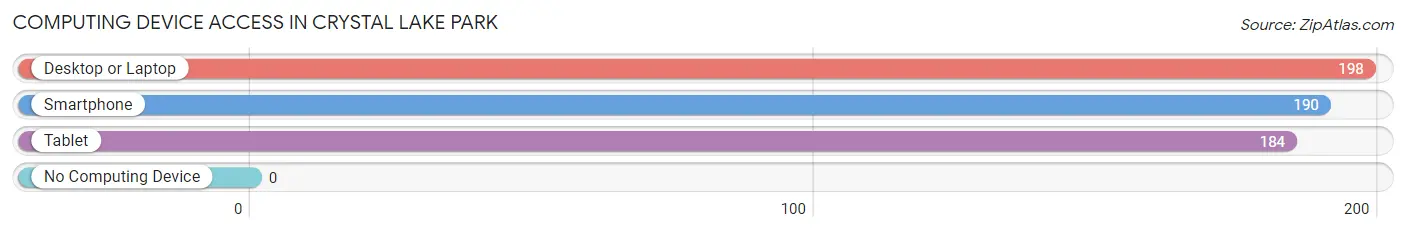
| Device Type | # Households | % Households |
| Desktop or Laptop | 198 | 99.0% |
| Smartphone | 190 | 95.0% |
| Tablet | 184 | 92.0% |
| No Computing Device | 0 | 0.0% |
| Total | 200 | 100.0% |
Internet Access in Crystal Lake Park
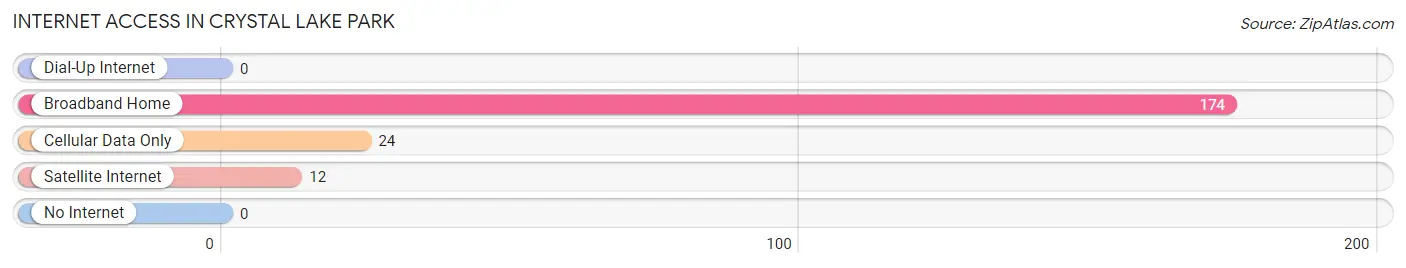
| Internet Type | # Households | % Households |
| Dial-Up Internet | 0 | 0.0% |
| Broadband Home | 174 | 87.0% |
| Cellular Data Only | 24 | 12.0% |
| Satellite Internet | 12 | 6.0% |
| No Internet | 0 | 0.0% |
| Total | 200 | 100.0% |
Crystal Lake Park Summary
Introduction
Crystal Lake Park is a small city located in St. Louis County, Missouri. It is situated in the northwest corner of the county, just south of the Missouri River. The city was incorporated in 1951 and has a population of approximately 2,000 people. The city is known for its beautiful lake, which is the centerpiece of the city. The lake is surrounded by a park, which is a popular destination for locals and visitors alike.
Geography
Crystal Lake Park is located in the northwest corner of St. Louis County, Missouri. It is situated just south of the Missouri River and is bordered by the cities of St. Charles, St. Peters, and O’Fallon. The city covers an area of 1.2 square miles and is located at an elevation of 645 feet. The city is located in the Central Lowland region of the United States and is characterized by rolling hills and flat plains. The climate in the area is humid continental, with hot summers and cold winters.
Demographics
As of the 2010 census, the population of Crystal Lake Park was 2,039. The racial makeup of the city was 94.3% White, 1.2% African American, 0.3% Native American, 0.7% Asian, 0.1% Pacific Islander, 1.2% from other races, and 2.4% from two or more races. Hispanic or Latino of any race were 3.2% of the population.
Economy
The economy of Crystal Lake Park is largely based on the service industry. The city is home to a variety of restaurants, retail stores, and other businesses. The city also has a number of manufacturing and industrial businesses, including a plastics factory and a printing company. The city is also home to a number of medical facilities, including a hospital and a nursing home.
History
Crystal Lake Park was first settled in the early 1800s by a group of German immigrants. The city was originally known as “Crystal Lake” and was named after the crystal-clear lake that was located in the area. The city was officially incorporated in 1951 and has since grown to become a popular destination for locals and visitors alike.
Conclusion
Crystal Lake Park is a small city located in St. Louis County, Missouri. It is situated in the northwest corner of the county, just south of the Missouri River. The city was incorporated in 1951 and has a population of approximately 2,000 people. The city is known for its beautiful lake, which is the centerpiece of the city. The economy of Crystal Lake Park is largely based on the service industry, and the city is home to a variety of restaurants, retail stores, and other businesses. The city also has a number of manufacturing and industrial businesses, including a plastics factory and a printing company. The city is also home to a number of medical facilities, including a hospital and a nursing home. Crystal Lake Park is a popular destination for locals and visitors alike, and its history and geography make it a unique and interesting place to visit.
Common Questions
What is Per Capita Income in Crystal Lake Park?
Per Capita income in Crystal Lake Park is $86,381.
What is the Median Family Income in Crystal Lake Park?
Median Family Income in Crystal Lake Park is $155,750.
What is the Median Household income in Crystal Lake Park?
Median Household Income in Crystal Lake Park is $144,583.
What is Income or Wage Gap in Crystal Lake Park?
Income or Wage Gap in Crystal Lake Park is 40.2%.
Women in Crystal Lake Park earn 59.8 cents for every dollar earned by a man.
What is Inequality or Gini Index in Crystal Lake Park?
Inequality or Gini Index in Crystal Lake Park is 0.47.
What is the Total Population of Crystal Lake Park?
Total Population of Crystal Lake Park is 460.
What is the Total Male Population of Crystal Lake Park?
Total Male Population of Crystal Lake Park is 200.
What is the Total Female Population of Crystal Lake Park?
Total Female Population of Crystal Lake Park is 260.
What is the Ratio of Males per 100 Females in Crystal Lake Park?
There are 76.92 Males per 100 Females in Crystal Lake Park.
What is the Ratio of Females per 100 Males in Crystal Lake Park?
There are 130.00 Females per 100 Males in Crystal Lake Park.
What is the Median Population Age in Crystal Lake Park?
Median Population Age in Crystal Lake Park is 52.7 Years.
What is the Average Family Size in Crystal Lake Park
Average Family Size in Crystal Lake Park is 3.0 People.
What is the Average Household Size in Crystal Lake Park
Average Household Size in Crystal Lake Park is 2.3 People.
How Large is the Labor Force in Crystal Lake Park?
There are 193 People in the Labor Forcein in Crystal Lake Park.
What is the Percentage of People in the Labor Force in Crystal Lake Park?
52.4% of People are in the Labor Force in Crystal Lake Park.
What is the Unemployment Rate in Crystal Lake Park?
Unemployment Rate in Crystal Lake Park is 1.6%.