O Fallon, MO Map & Demographics
O Fallon Map
O Fallon Overview
$45,938
PER CAPITA INCOME
$122,413
AVG FAMILY INCOME
$104,863
AVG HOUSEHOLD INCOME
31.6%
WAGE / INCOME GAP [ % ]
68.4¢/ $1
WAGE / INCOME GAP [ $ ]
$9,192
FAMILY INCOME DEFICIT
0.38
INEQUALITY / GINI INDEX
91,825
TOTAL POPULATION
44,962
MALE POPULATION
46,863
FEMALE POPULATION
95.94
MALES / 100 FEMALES
104.23
FEMALES / 100 MALES
38.0
MEDIAN AGE
3.1
AVG FAMILY SIZE
2.7
AVG HOUSEHOLD SIZE
52,380
LABOR FORCE [ PEOPLE ]
73.0%
PERCENT IN LABOR FORCE
3.1%
UNEMPLOYMENT RATE
O Fallon Area Codes
Income in O Fallon
Income Overview in O Fallon
Per Capita Income in O Fallon is $45,938, while median incomes of families and households are $122,413 and $104,863 respectively.
| Characteristic | Number | Measure |
| Per Capita Income | 91,825 | $45,938 |
| Median Family Income | 25,031 | $122,413 |
| Mean Family Income | 25,031 | $138,453 |
| Median Household Income | 34,174 | $104,863 |
| Mean Household Income | 34,174 | $121,477 |
| Income Deficit | 25,031 | $9,192 |
| Wage / Income Gap (%) | 91,825 | 31.56% |
| Wage / Income Gap ($) | 91,825 | 68.44¢ per $1 |
| Gini / Inequality Index | 91,825 | 0.38 |
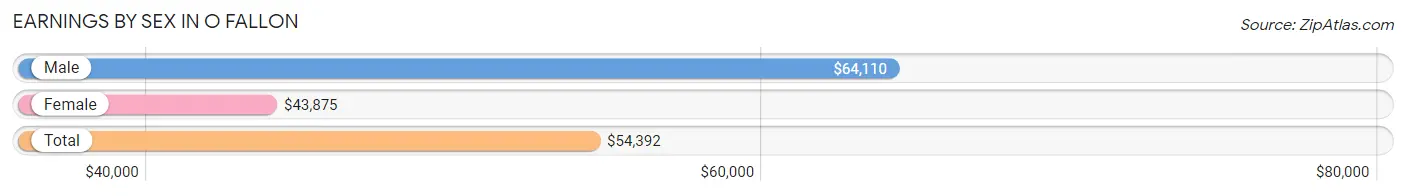
Earnings by Sex in O Fallon
Average Earnings in O Fallon are $54,392, $64,110 for men and $43,875 for women, a difference of 31.6%.
| Sex | Number | Average Earnings |
| Male | 27,923 (51.6%) | $64,110 |
| Female | 26,210 (48.4%) | $43,875 |
| Total | 54,133 (100.0%) | $54,392 |
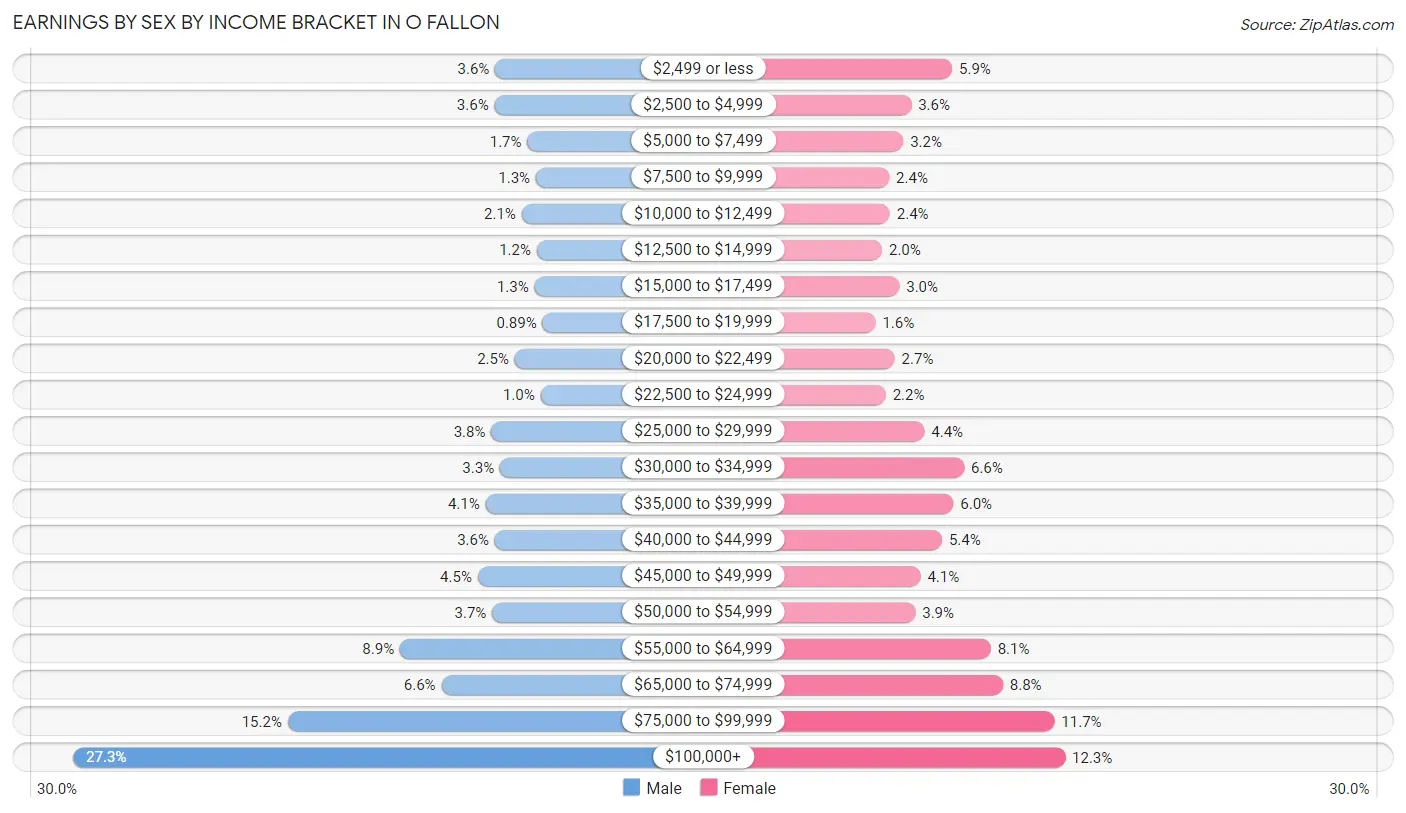
Earnings by Sex by Income Bracket in O Fallon
The most common earnings brackets in O Fallon are $100,000+ for men (7,614 | 27.3%) and $100,000+ for women (3,215 | 12.3%).
| Income | Male | Female |
| $2,499 or less | 990 (3.5%) | 1,551 (5.9%) |
| $2,500 to $4,999 | 1,003 (3.6%) | 949 (3.6%) |
| $5,000 to $7,499 | 485 (1.7%) | 832 (3.2%) |
| $7,500 to $9,999 | 353 (1.3%) | 624 (2.4%) |
| $10,000 to $12,499 | 575 (2.1%) | 634 (2.4%) |
| $12,500 to $14,999 | 338 (1.2%) | 520 (2.0%) |
| $15,000 to $17,499 | 375 (1.3%) | 774 (2.9%) |
| $17,500 to $19,999 | 249 (0.9%) | 422 (1.6%) |
| $20,000 to $22,499 | 684 (2.5%) | 705 (2.7%) |
| $22,500 to $24,999 | 279 (1.0%) | 573 (2.2%) |
| $25,000 to $29,999 | 1,053 (3.8%) | 1,142 (4.4%) |
| $30,000 to $34,999 | 917 (3.3%) | 1,728 (6.6%) |
| $35,000 to $39,999 | 1,141 (4.1%) | 1,570 (6.0%) |
| $40,000 to $44,999 | 998 (3.6%) | 1,401 (5.3%) |
| $45,000 to $49,999 | 1,265 (4.5%) | 1,084 (4.1%) |
| $50,000 to $54,999 | 1,038 (3.7%) | 1,009 (3.8%) |
| $55,000 to $64,999 | 2,484 (8.9%) | 2,120 (8.1%) |
| $65,000 to $74,999 | 1,834 (6.6%) | 2,299 (8.8%) |
| $75,000 to $99,999 | 4,248 (15.2%) | 3,058 (11.7%) |
| $100,000+ | 7,614 (27.3%) | 3,215 (12.3%) |
| Total | 27,923 (100.0%) | 26,210 (100.0%) |
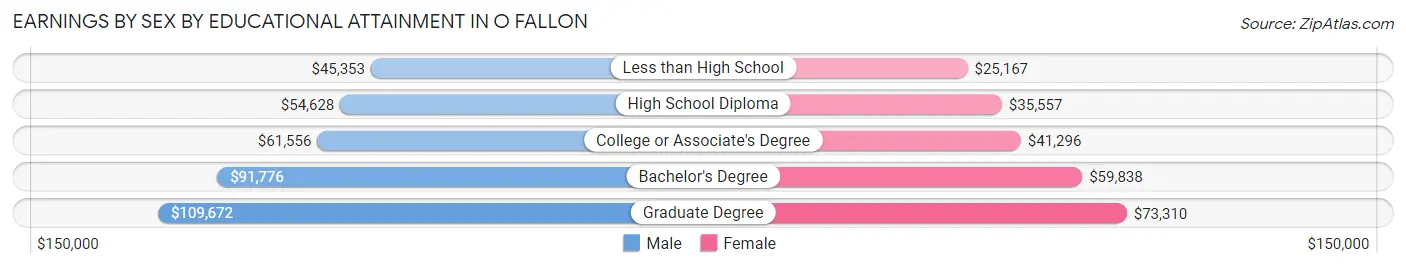
Earnings by Sex by Educational Attainment in O Fallon
Average earnings in O Fallon are $72,221 for men and $51,466 for women, a difference of 28.7%. Men with an educational attainment of graduate degree enjoy the highest average annual earnings of $109,672, while those with less than high school education earn the least with $45,353. Women with an educational attainment of graduate degree earn the most with the average annual earnings of $73,310, while those with less than high school education have the smallest earnings of $25,167.
| Educational Attainment | Male Income | Female Income |
| Less than High School | $45,353 | $25,167 |
| High School Diploma | $54,628 | $35,557 |
| College or Associate's Degree | $61,556 | $41,296 |
| Bachelor's Degree | $91,776 | $59,838 |
| Graduate Degree | $109,672 | $73,310 |
| Total | $72,221 | $51,466 |
Family Income in O Fallon
Family Income Brackets in O Fallon
According to the O Fallon family income data, there are 6,808 families falling into the $100,000 to $149,999 income range, which is the most common income bracket and makes up 27.2% of all families. Conversely, the less than $10,000 income bracket is the least frequent group with only 150 families (0.6%) belonging to this category.
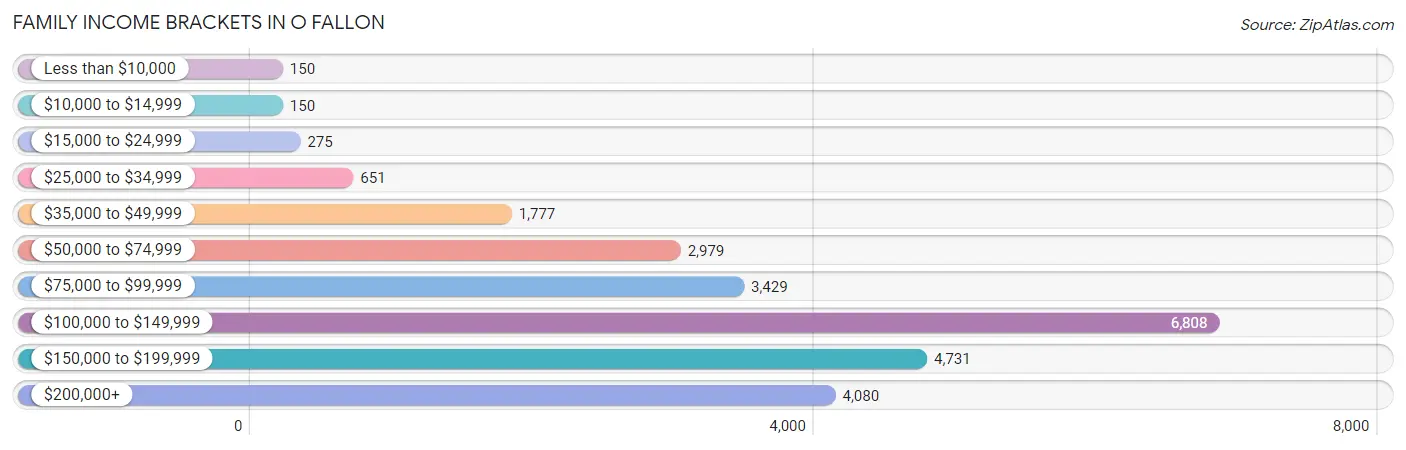
| Income Bracket | # Families | % Families |
| Less than $10,000 | 150 | 0.6% |
| $10,000 to $14,999 | 150 | 0.6% |
| $15,000 to $24,999 | 275 | 1.1% |
| $25,000 to $34,999 | 651 | 2.6% |
| $35,000 to $49,999 | 1,777 | 7.1% |
| $50,000 to $74,999 | 2,979 | 11.9% |
| $75,000 to $99,999 | 3,429 | 13.7% |
| $100,000 to $149,999 | 6,808 | 27.2% |
| $150,000 to $199,999 | 4,731 | 18.9% |
| $200,000+ | 4,080 | 16.3% |
Family Income by Famaliy Size in O Fallon
5-person families (2,518 | 10.1%) account for the highest median family income in O Fallon with $139,292 per family, while 2-person families (10,242 | 40.9%) have the highest median income of $49,599 per family member.
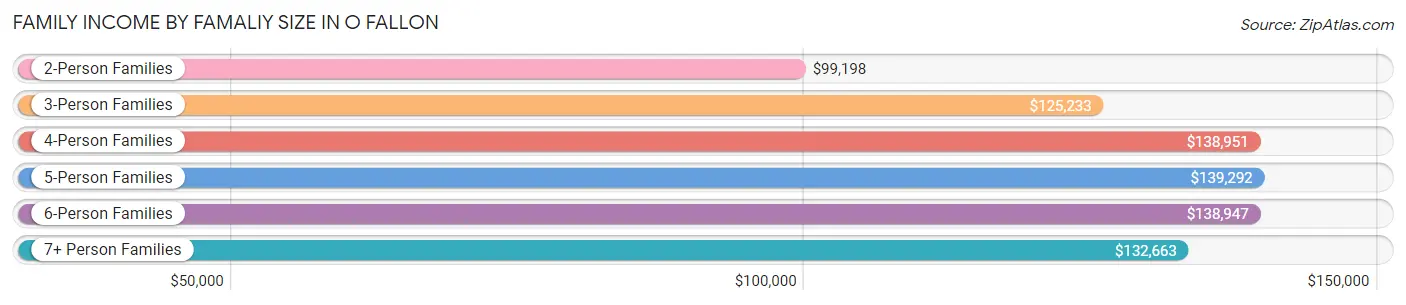
| Income Bracket | # Families | Median Income |
| 2-Person Families | 10,242 (40.9%) | $99,198 |
| 3-Person Families | 5,882 (23.5%) | $125,233 |
| 4-Person Families | 5,564 (22.2%) | $138,951 |
| 5-Person Families | 2,518 (10.1%) | $139,292 |
| 6-Person Families | 576 (2.3%) | $138,947 |
| 7+ Person Families | 249 (1.0%) | $132,663 |
| Total | 25,031 (100.0%) | $122,413 |
Family Income by Number of Earners in O Fallon
The median family income in O Fallon is $122,413, with families comprising 3+ earners (4,397) having the highest median family income of $160,188, while families with no earners (2,600) have the lowest median family income of $62,903, accounting for 17.6% and 10.4% of families, respectively.
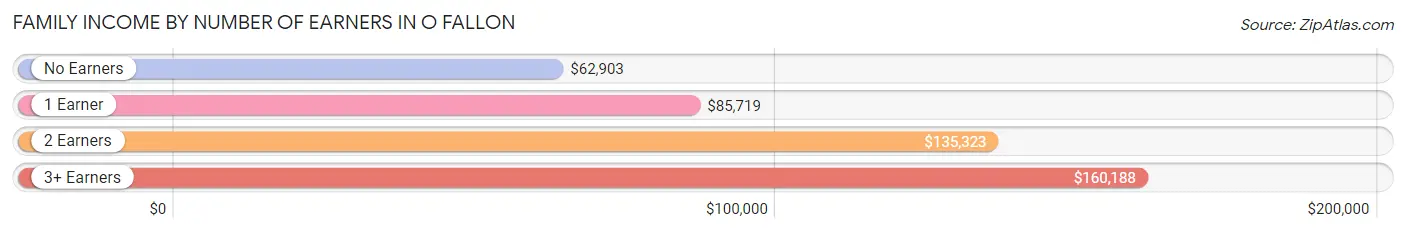
| Number of Earners | # Families | Median Income |
| No Earners | 2,600 (10.4%) | $62,903 |
| 1 Earner | 5,957 (23.8%) | $85,719 |
| 2 Earners | 12,077 (48.2%) | $135,323 |
| 3+ Earners | 4,397 (17.6%) | $160,188 |
| Total | 25,031 (100.0%) | $122,413 |
Household Income in O Fallon
Household Income Brackets in O Fallon
With 8,133 households falling in the category, the $100,000 to $149,999 income range is the most frequent in O Fallon, accounting for 23.8% of all households. In contrast, only 581 households (1.7%) fall into the $10,000 to $14,999 income bracket, making it the least populous group.
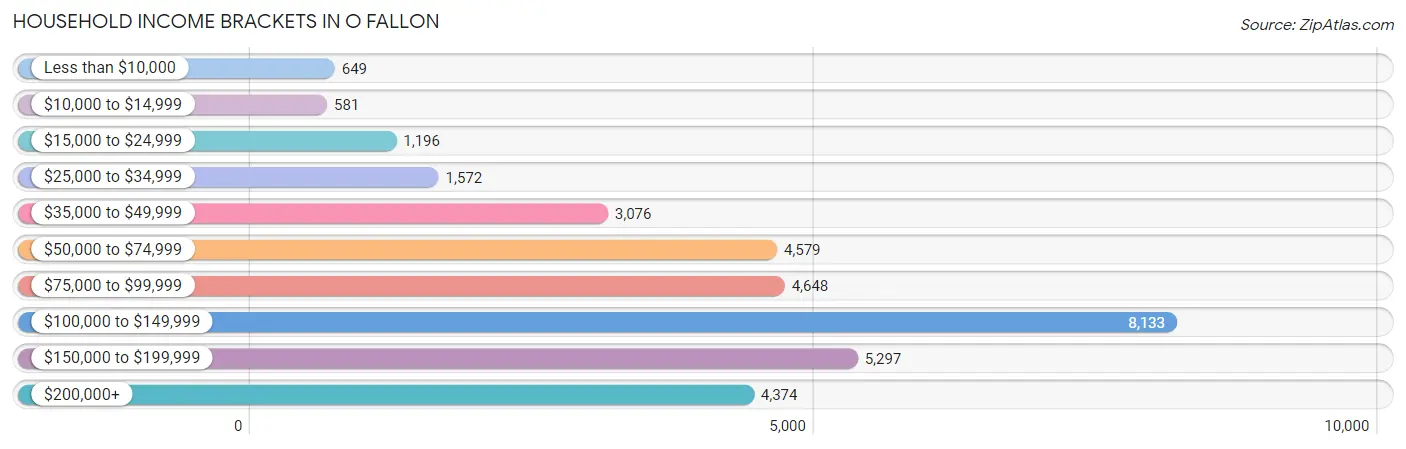
| Income Bracket | # Households | % Households |
| Less than $10,000 | 649 | 1.9% |
| $10,000 to $14,999 | 581 | 1.7% |
| $15,000 to $24,999 | 1,196 | 3.5% |
| $25,000 to $34,999 | 1,572 | 4.6% |
| $35,000 to $49,999 | 3,076 | 9.0% |
| $50,000 to $74,999 | 4,579 | 13.4% |
| $75,000 to $99,999 | 4,648 | 13.6% |
| $100,000 to $149,999 | 8,133 | 23.8% |
| $150,000 to $199,999 | 5,297 | 15.5% |
| $200,000+ | 4,374 | 12.8% |
Household Income by Householder Age in O Fallon
The median household income in O Fallon is $104,863, with the highest median household income of $132,417 found in the 45 to 64 years age bracket for the primary householder. A total of 14,136 households (41.4%) fall into this category. Meanwhile, the 65+ years age bracket for the primary householder has the lowest median household income of $58,570, with 7,408 households (21.7%) in this group.
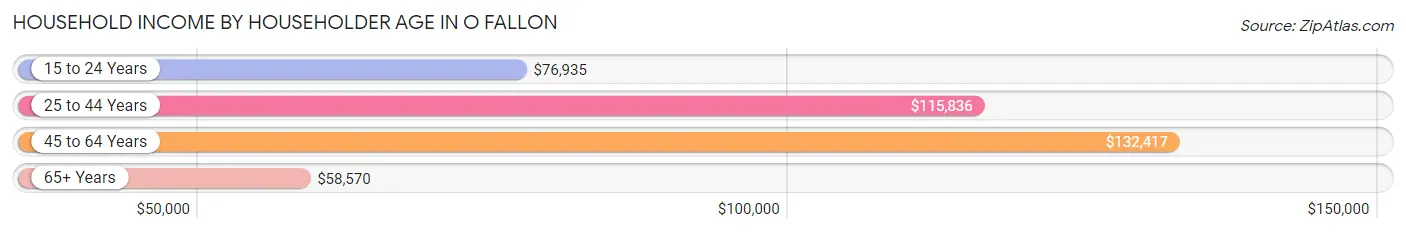
| Income Bracket | # Households | Median Income |
| 15 to 24 Years | 657 (1.9%) | $76,935 |
| 25 to 44 Years | 11,973 (35.0%) | $115,836 |
| 45 to 64 Years | 14,136 (41.4%) | $132,417 |
| 65+ Years | 7,408 (21.7%) | $58,570 |
| Total | 34,174 (100.0%) | $104,863 |
Poverty in O Fallon
Income Below Poverty by Sex and Age in O Fallon
With 3.7% poverty level for males and 5.3% for females among the residents of O Fallon, 18 to 24 year old males and 15 year old females are the most vulnerable to poverty, with 246 males (7.7%) and 112 females (17.8%) in their respective age groups living below the poverty level.
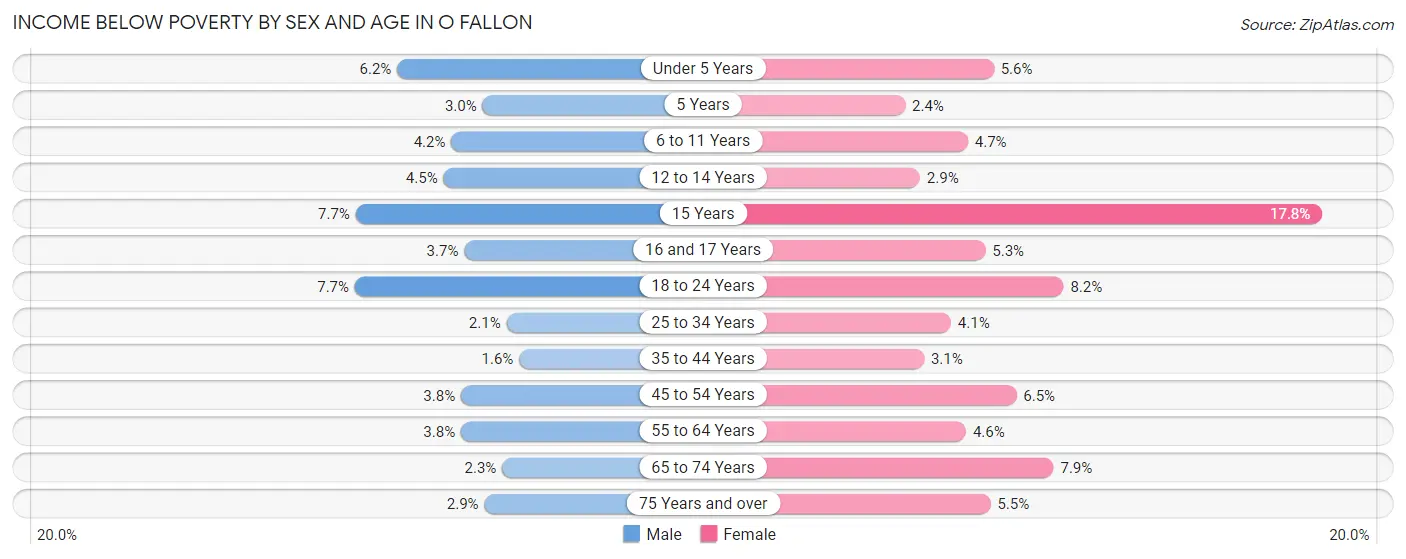
| Age Bracket | Male | Female |
| Under 5 Years | 204 (6.2%) | 157 (5.6%) |
| 5 Years | 17 (3.0%) | 14 (2.4%) |
| 6 to 11 Years | 164 (4.2%) | 155 (4.7%) |
| 12 to 14 Years | 78 (4.4%) | 56 (2.9%) |
| 15 Years | 71 (7.7%) | 112 (17.8%) |
| 16 and 17 Years | 42 (3.7%) | 90 (5.3%) |
| 18 to 24 Years | 246 (7.7%) | 269 (8.2%) |
| 25 to 34 Years | 127 (2.1%) | 259 (4.1%) |
| 35 to 44 Years | 108 (1.6%) | 190 (3.0%) |
| 45 to 54 Years | 247 (3.8%) | 430 (6.5%) |
| 55 to 64 Years | 222 (3.8%) | 279 (4.6%) |
| 65 to 74 Years | 71 (2.3%) | 304 (7.9%) |
| 75 Years and over | 56 (2.9%) | 165 (5.5%) |
| Total | 1,653 (3.7%) | 2,480 (5.3%) |
Income Above Poverty by Sex and Age in O Fallon
According to the poverty statistics in O Fallon, males aged 35 to 44 years and females aged 5 years are the age groups that are most secure financially, with 98.4% of males and 97.7% of females in these age groups living above the poverty line.
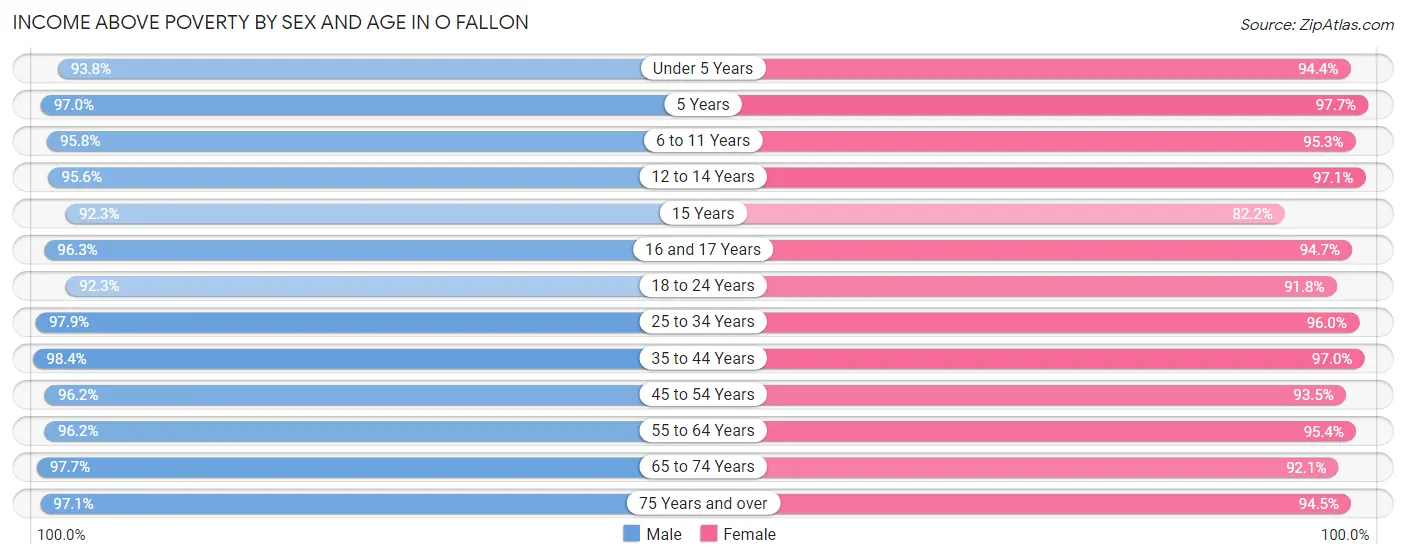
| Age Bracket | Male | Female |
| Under 5 Years | 3,103 (93.8%) | 2,629 (94.4%) |
| 5 Years | 550 (97.0%) | 583 (97.7%) |
| 6 to 11 Years | 3,781 (95.8%) | 3,154 (95.3%) |
| 12 to 14 Years | 1,673 (95.6%) | 1,873 (97.1%) |
| 15 Years | 850 (92.3%) | 516 (82.2%) |
| 16 and 17 Years | 1,098 (96.3%) | 1,600 (94.7%) |
| 18 to 24 Years | 2,933 (92.3%) | 3,000 (91.8%) |
| 25 to 34 Years | 5,881 (97.9%) | 6,136 (96.0%) |
| 35 to 44 Years | 6,491 (98.4%) | 6,032 (97.0%) |
| 45 to 54 Years | 6,257 (96.2%) | 6,209 (93.5%) |
| 55 to 64 Years | 5,626 (96.2%) | 5,778 (95.4%) |
| 65 to 74 Years | 3,059 (97.7%) | 3,562 (92.1%) |
| 75 Years and over | 1,856 (97.1%) | 2,826 (94.5%) |
| Total | 43,158 (96.3%) | 43,898 (94.7%) |
Income Below Poverty Among Married-Couple Families in O Fallon
The poverty statistics for married-couple families in O Fallon show that 1.5% or 312 of the total 20,421 families live below the poverty line. Families with 3 or 4 children have the highest poverty rate of 5.8%, comprising of 116 families. On the other hand, families with 5 or more children have the lowest poverty rate of 0.0%, which includes 0 families.
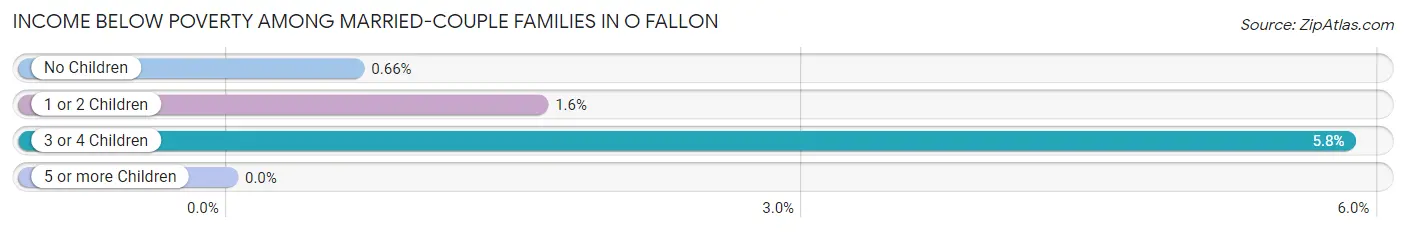
| Children | Above Poverty | Below Poverty |
| No Children | 10,579 (99.3%) | 70 (0.7%) |
| 1 or 2 Children | 7,633 (98.4%) | 126 (1.6%) |
| 3 or 4 Children | 1,871 (94.2%) | 116 (5.8%) |
| 5 or more Children | 26 (100.0%) | 0 (0.0%) |
| Total | 20,109 (98.5%) | 312 (1.5%) |
Income Below Poverty Among Single-Parent Households in O Fallon
According to the poverty data in O Fallon, 4.8% or 71 single-father households and 7.8% or 244 single-mother households are living below the poverty line. Among single-father households, those with 1 or 2 children have the highest poverty rate, with 50 households (5.9%) experiencing poverty. Likewise, among single-mother households, those with 5 or more children have the highest poverty rate, with 13 households (100.0%) falling below the poverty line.
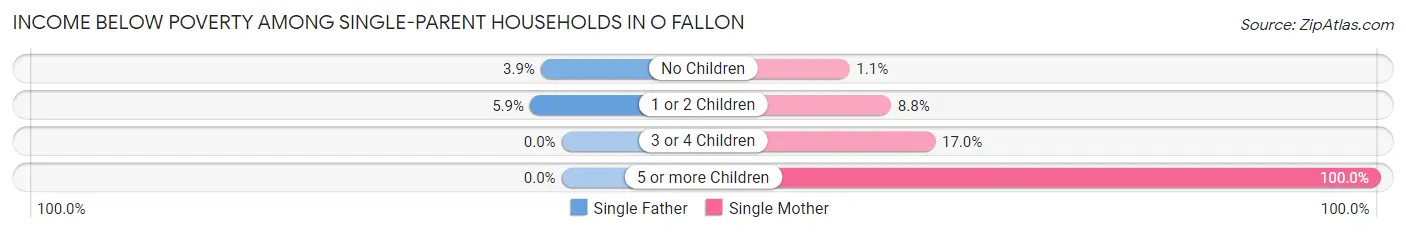
| Children | Single Father | Single Mother |
| No Children | 21 (3.9%) | 11 (1.1%) |
| 1 or 2 Children | 50 (5.9%) | 148 (8.8%) |
| 3 or 4 Children | 0 (0.0%) | 72 (17.0%) |
| 5 or more Children | 0 (0.0%) | 13 (100.0%) |
| Total | 71 (4.8%) | 244 (7.8%) |
Income Below Poverty Among Married-Couple vs Single-Parent Households in O Fallon
The poverty data for O Fallon shows that 312 of the married-couple family households (1.5%) and 315 of the single-parent households (6.8%) are living below the poverty level. Within the married-couple family households, those with 3 or 4 children have the highest poverty rate, with 116 households (5.8%) falling below the poverty line. Among the single-parent households, those with 5 or more children have the highest poverty rate, with 13 household (100.0%) living below poverty.
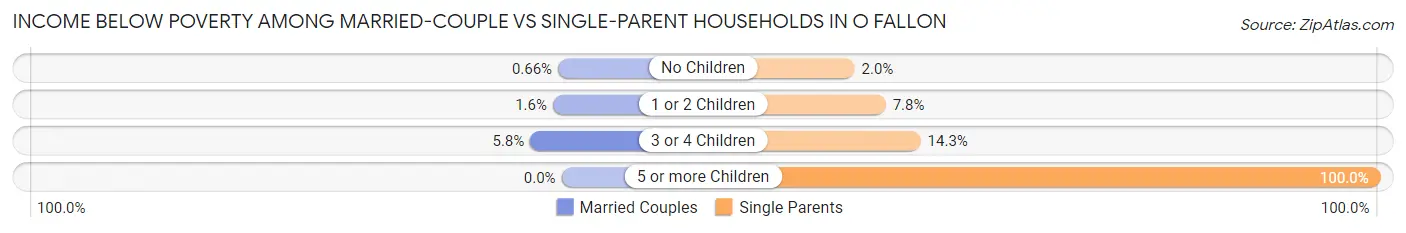
| Children | Married-Couple Families | Single-Parent Households |
| No Children | 70 (0.7%) | 32 (2.0%) |
| 1 or 2 Children | 126 (1.6%) | 198 (7.8%) |
| 3 or 4 Children | 116 (5.8%) | 72 (14.3%) |
| 5 or more Children | 0 (0.0%) | 13 (100.0%) |
| Total | 312 (1.5%) | 315 (6.8%) |
Race in O Fallon
The most populous races in O Fallon are White / Caucasian (77,421 | 84.3%), Black / African American (4,554 | 5.0%), and Two or more Races (4,463 | 4.9%).
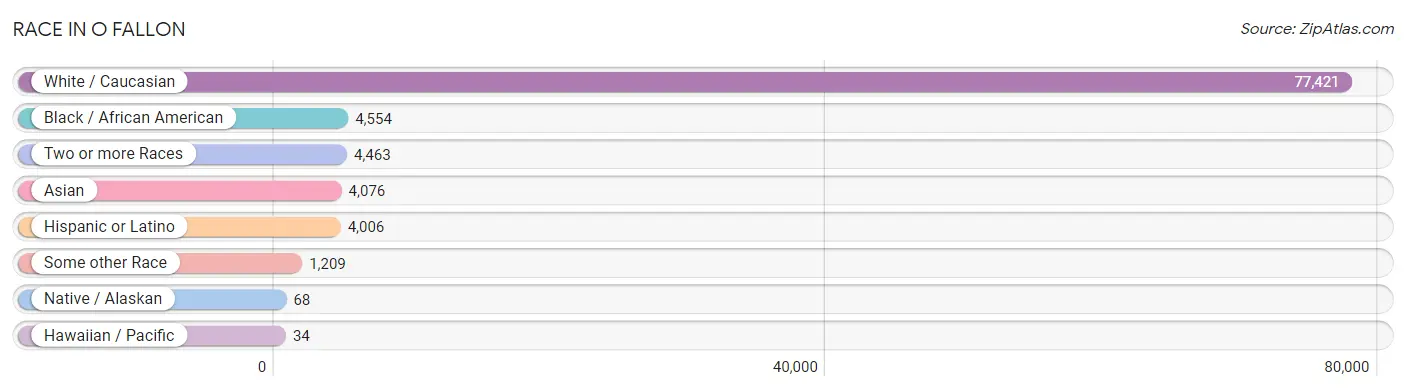
| Race | # Population | % Population |
| Asian | 4,076 | 4.4% |
| Black / African American | 4,554 | 5.0% |
| Hawaiian / Pacific | 34 | 0.0% |
| Hispanic or Latino | 4,006 | 4.4% |
| Native / Alaskan | 68 | 0.1% |
| White / Caucasian | 77,421 | 84.3% |
| Two or more Races | 4,463 | 4.9% |
| Some other Race | 1,209 | 1.3% |
| Total | 91,825 | 100.0% |
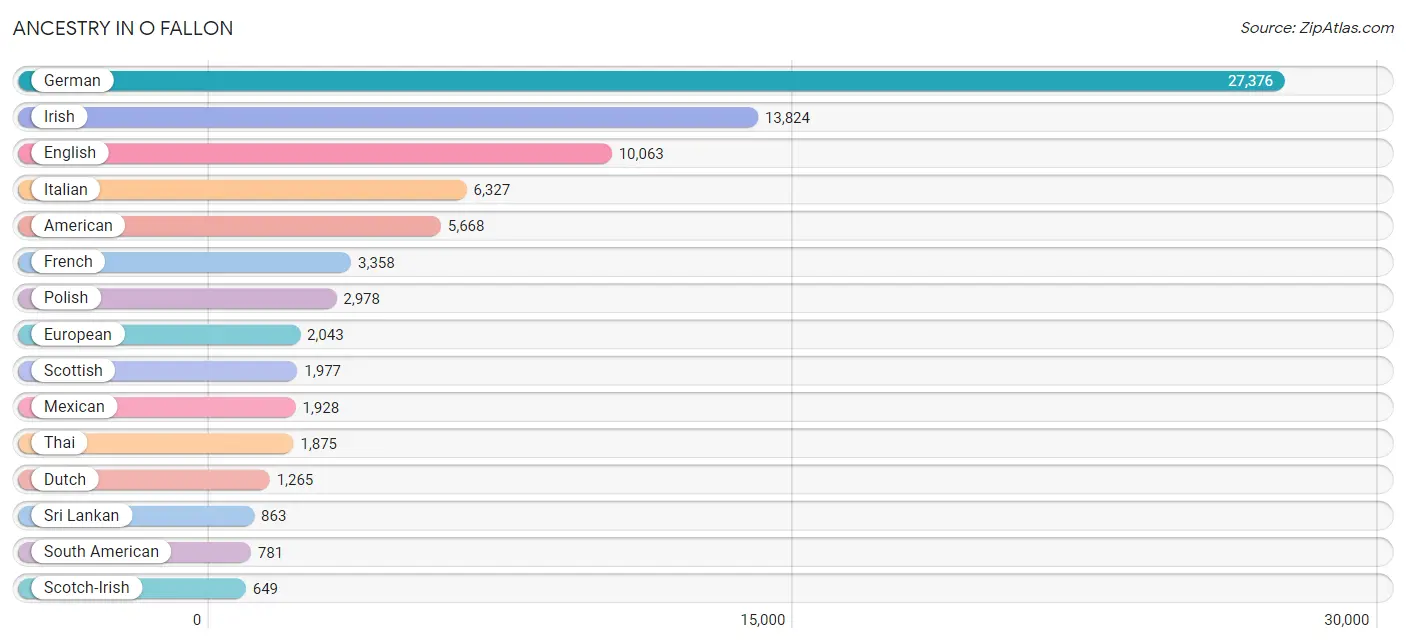
Ancestry in O Fallon
The most populous ancestries reported in O Fallon are German (27,376 | 29.8%), Irish (13,824 | 15.0%), English (10,063 | 11.0%), Italian (6,327 | 6.9%), and American (5,668 | 6.2%), together accounting for 68.9% of all O Fallon residents.
| Ancestry | # Population | % Population |
| African | 145 | 0.2% |
| American | 5,668 | 6.2% |
| Arab | 459 | 0.5% |
| Argentinean | 69 | 0.1% |
| Armenian | 20 | 0.0% |
| Austrian | 87 | 0.1% |
| Bangladeshi | 24 | 0.0% |
| Belgian | 93 | 0.1% |
| Bhutanese | 103 | 0.1% |
| Blackfeet | 14 | 0.0% |
| Bolivian | 20 | 0.0% |
| Brazilian | 125 | 0.1% |
| British | 400 | 0.4% |
| Bulgarian | 21 | 0.0% |
| Burmese | 393 | 0.4% |
| Cajun | 2 | 0.0% |
| Canadian | 38 | 0.0% |
| Central American | 284 | 0.3% |
| Central American Indian | 1 | 0.0% |
| Cherokee | 172 | 0.2% |
| Choctaw | 19 | 0.0% |
| Colombian | 383 | 0.4% |
| Croatian | 307 | 0.3% |
| Cuban | 173 | 0.2% |
| Czech | 244 | 0.3% |
| Czechoslovakian | 87 | 0.1% |
| Danish | 186 | 0.2% |
| Dominican | 37 | 0.0% |
| Dutch | 1,265 | 1.4% |
| Eastern European | 200 | 0.2% |
| Ecuadorian | 43 | 0.1% |
| English | 10,063 | 11.0% |
| European | 2,043 | 2.2% |
| Finnish | 90 | 0.1% |
| French | 3,358 | 3.7% |
| French American Indian | 20 | 0.0% |
| French Canadian | 169 | 0.2% |
| German | 27,376 | 29.8% |
| Greek | 331 | 0.4% |
| Guatemalan | 224 | 0.2% |
| Haitian | 68 | 0.1% |
| Honduran | 34 | 0.0% |
| Hungarian | 163 | 0.2% |
| Indian (Asian) | 406 | 0.4% |
| Inupiat | 16 | 0.0% |
| Iranian | 102 | 0.1% |
| Irish | 13,824 | 15.0% |
| Italian | 6,327 | 6.9% |
| Jamaican | 82 | 0.1% |
| Korean | 583 | 0.6% |
| Lebanese | 107 | 0.1% |
| Lithuanian | 94 | 0.1% |
| Luxembourger | 23 | 0.0% |
| Mexican | 1,928 | 2.1% |
| Moroccan | 5 | 0.0% |
| Northern European | 123 | 0.1% |
| Norwegian | 577 | 0.6% |
| Pakistani | 86 | 0.1% |
| Palestinian | 263 | 0.3% |
| Panamanian | 26 | 0.0% |
| Pennsylvania German | 24 | 0.0% |
| Peruvian | 228 | 0.3% |
| Polish | 2,978 | 3.2% |
| Portuguese | 48 | 0.1% |
| Puerto Rican | 210 | 0.2% |
| Russian | 302 | 0.3% |
| Samoan | 73 | 0.1% |
| Scandinavian | 136 | 0.2% |
| Scotch-Irish | 649 | 0.7% |
| Scottish | 1,977 | 2.1% |
| Sioux | 5 | 0.0% |
| Slovak | 43 | 0.1% |
| Slovene | 17 | 0.0% |
| Somali | 8 | 0.0% |
| South American | 781 | 0.9% |
| Spaniard | 50 | 0.1% |
| Spanish | 316 | 0.3% |
| Sri Lankan | 863 | 0.9% |
| Subsaharan African | 177 | 0.2% |
| Swedish | 548 | 0.6% |
| Swiss | 213 | 0.2% |
| Thai | 1,875 | 2.0% |
| Turkish | 76 | 0.1% |
| Ugandan | 11 | 0.0% |
| Ukrainian | 214 | 0.2% |
| Ute | 94 | 0.1% |
| Venezuelan | 38 | 0.0% |
| Vietnamese | 60 | 0.1% |
| Welsh | 285 | 0.3% |
| Yugoslavian | 20 | 0.0% | View All 90 Rows |
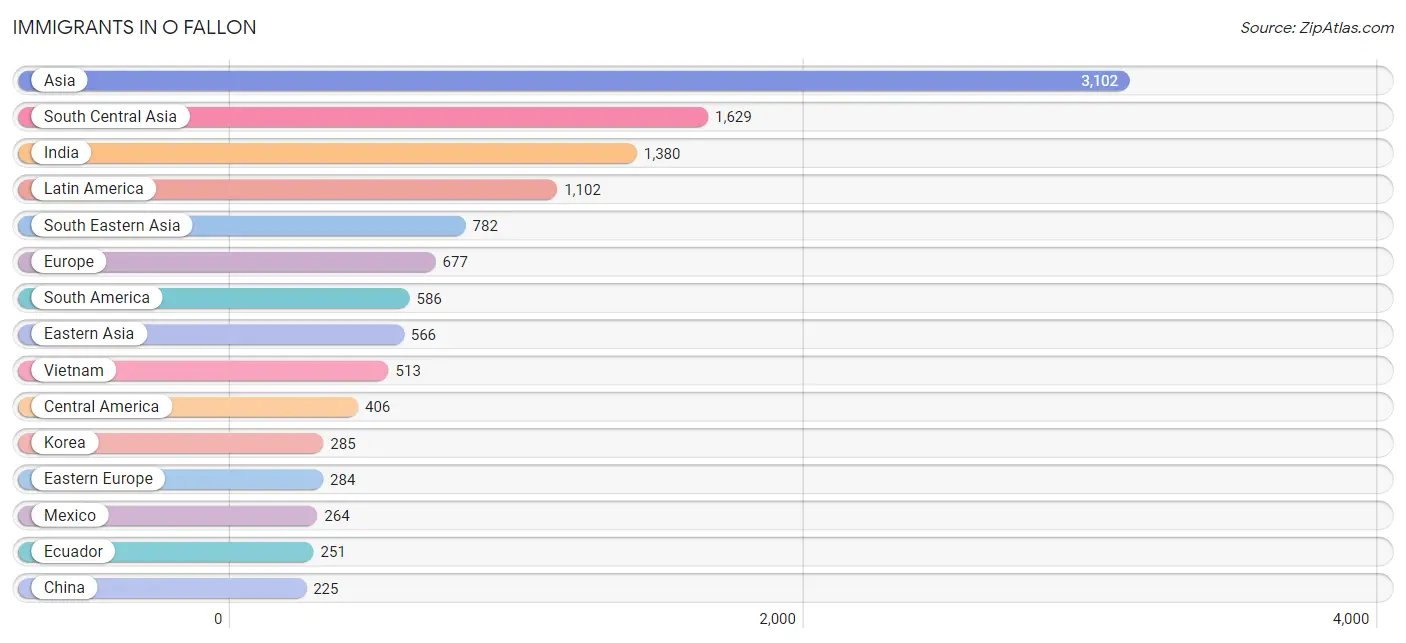
Immigrants in O Fallon
The most numerous immigrant groups reported in O Fallon came from Asia (3,102 | 3.4%), South Central Asia (1,629 | 1.8%), India (1,380 | 1.5%), Latin America (1,102 | 1.2%), and South Eastern Asia (782 | 0.9%), together accounting for 8.7% of all O Fallon residents.
| Immigration Origin | # Population | % Population |
| Africa | 35 | 0.0% |
| Argentina | 13 | 0.0% |
| Asia | 3,102 | 3.4% |
| Australia | 13 | 0.0% |
| Austria | 16 | 0.0% |
| Bangladesh | 18 | 0.0% |
| Belarus | 76 | 0.1% |
| Bosnia and Herzegovina | 7 | 0.0% |
| Brazil | 62 | 0.1% |
| Bulgaria | 21 | 0.0% |
| Canada | 7 | 0.0% |
| Caribbean | 110 | 0.1% |
| Central America | 406 | 0.4% |
| China | 225 | 0.3% |
| Colombia | 125 | 0.1% |
| Congo | 24 | 0.0% |
| Cuba | 33 | 0.0% |
| Dominican Republic | 37 | 0.0% |
| Eastern Africa | 11 | 0.0% |
| Eastern Asia | 566 | 0.6% |
| Eastern Europe | 284 | 0.3% |
| Ecuador | 251 | 0.3% |
| England | 111 | 0.1% |
| Europe | 677 | 0.7% |
| Germany | 157 | 0.2% |
| Guatemala | 142 | 0.2% |
| Haiti | 40 | 0.0% |
| Hong Kong | 26 | 0.0% |
| India | 1,380 | 1.5% |
| Iran | 25 | 0.0% |
| Ireland | 8 | 0.0% |
| Israel | 62 | 0.1% |
| Italy | 37 | 0.0% |
| Japan | 56 | 0.1% |
| Korea | 285 | 0.3% |
| Kuwait | 17 | 0.0% |
| Latin America | 1,102 | 1.2% |
| Mexico | 264 | 0.3% |
| Middle Africa | 24 | 0.0% |
| Northern Europe | 157 | 0.2% |
| Oceania | 33 | 0.0% |
| Pakistan | 206 | 0.2% |
| Peru | 115 | 0.1% |
| Philippines | 183 | 0.2% |
| Russia | 76 | 0.1% |
| South America | 586 | 0.6% |
| South Central Asia | 1,629 | 1.8% |
| South Eastern Asia | 782 | 0.9% |
| Southern Europe | 63 | 0.1% |
| Spain | 26 | 0.0% |
| Sweden | 4 | 0.0% |
| Thailand | 86 | 0.1% |
| Turkey | 28 | 0.0% |
| Uganda | 11 | 0.0% |
| Ukraine | 84 | 0.1% |
| Venezuela | 20 | 0.0% |
| Vietnam | 513 | 0.6% |
| Western Asia | 125 | 0.1% |
| Western Europe | 173 | 0.2% | View All 59 Rows |
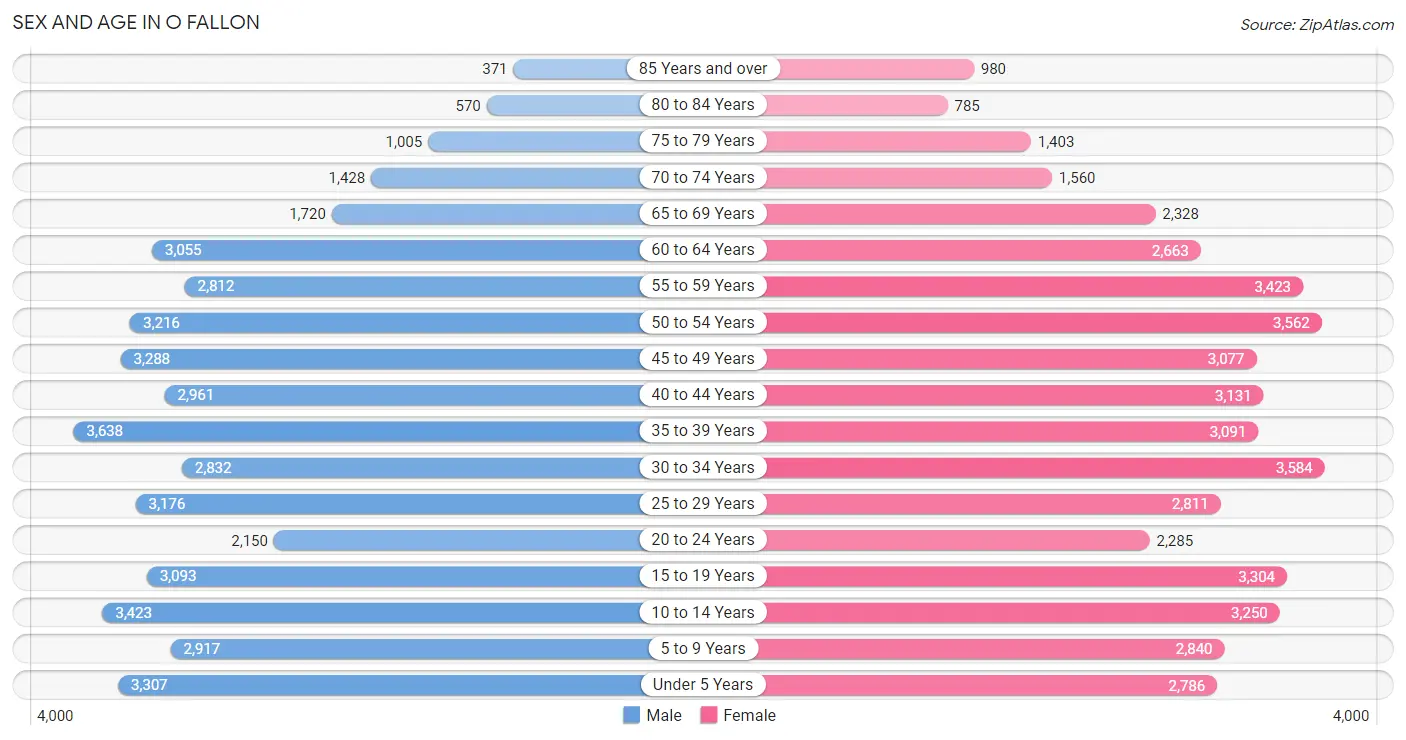
Sex and Age in O Fallon
Sex and Age in O Fallon
The most populous age groups in O Fallon are 35 to 39 Years (3,638 | 8.1%) for men and 30 to 34 Years (3,584 | 7.6%) for women.
| Age Bracket | Male | Female |
| Under 5 Years | 3,307 (7.4%) | 2,786 (5.9%) |
| 5 to 9 Years | 2,917 (6.5%) | 2,840 (6.1%) |
| 10 to 14 Years | 3,423 (7.6%) | 3,250 (6.9%) |
| 15 to 19 Years | 3,093 (6.9%) | 3,304 (7.0%) |
| 20 to 24 Years | 2,150 (4.8%) | 2,285 (4.9%) |
| 25 to 29 Years | 3,176 (7.1%) | 2,811 (6.0%) |
| 30 to 34 Years | 2,832 (6.3%) | 3,584 (7.6%) |
| 35 to 39 Years | 3,638 (8.1%) | 3,091 (6.6%) |
| 40 to 44 Years | 2,961 (6.6%) | 3,131 (6.7%) |
| 45 to 49 Years | 3,288 (7.3%) | 3,077 (6.6%) |
| 50 to 54 Years | 3,216 (7.1%) | 3,562 (7.6%) |
| 55 to 59 Years | 2,812 (6.2%) | 3,423 (7.3%) |
| 60 to 64 Years | 3,055 (6.8%) | 2,663 (5.7%) |
| 65 to 69 Years | 1,720 (3.8%) | 2,328 (5.0%) |
| 70 to 74 Years | 1,428 (3.2%) | 1,560 (3.3%) |
| 75 to 79 Years | 1,005 (2.2%) | 1,403 (3.0%) |
| 80 to 84 Years | 570 (1.3%) | 785 (1.7%) |
| 85 Years and over | 371 (0.8%) | 980 (2.1%) |
| Total | 44,962 (100.0%) | 46,863 (100.0%) |
Families and Households in O Fallon
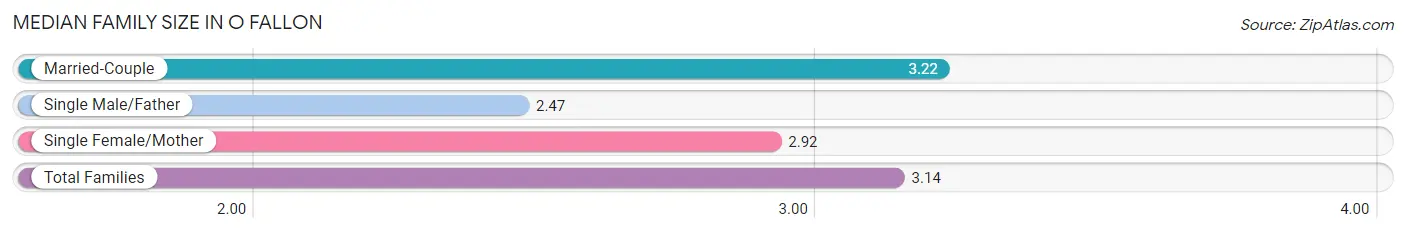
Median Family Size in O Fallon
The median family size in O Fallon is 3.14 persons per family, with married-couple families (20,421 | 81.6%) accounting for the largest median family size of 3.22 persons per family. On the other hand, single male/father families (1,468 | 5.9%) represent the smallest median family size with 2.47 persons per family.
| Family Type | # Families | Family Size |
| Married-Couple | 20,421 (81.6%) | 3.22 |
| Single Male/Father | 1,468 (5.9%) | 2.47 |
| Single Female/Mother | 3,142 (12.6%) | 2.92 |
| Total Families | 25,031 (100.0%) | 3.14 |
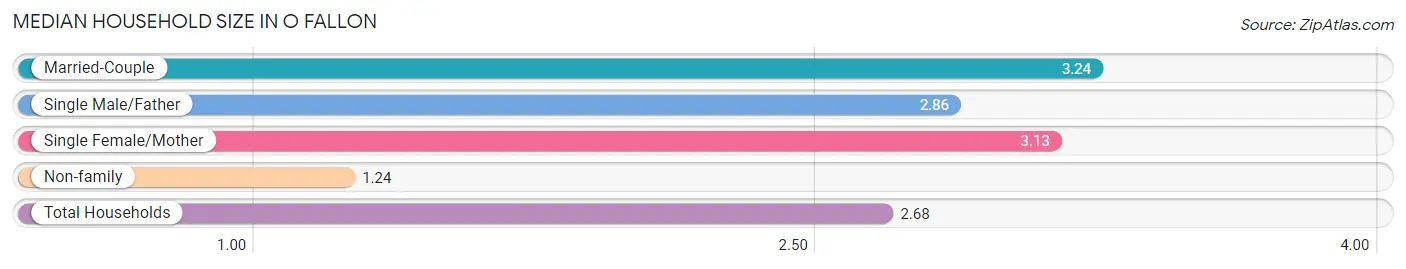
Median Household Size in O Fallon
The median household size in O Fallon is 2.68 persons per household, with married-couple households (20,421 | 59.8%) accounting for the largest median household size of 3.24 persons per household. non-family households (9,143 | 26.8%) represent the smallest median household size with 1.24 persons per household.
| Household Type | # Households | Household Size |
| Married-Couple | 20,421 (59.8%) | 3.24 |
| Single Male/Father | 1,468 (4.3%) | 2.86 |
| Single Female/Mother | 3,142 (9.2%) | 3.13 |
| Non-family | 9,143 (26.8%) | 1.24 |
| Total Households | 34,174 (100.0%) | 2.68 |
Household Size by Marriage Status in O Fallon
Out of a total of 34,174 households in O Fallon, 25,031 (73.3%) are family households, while 9,143 (26.8%) are nonfamily households. The most numerous type of family households are 2-person households, comprising 9,714, and the most common type of nonfamily households are 1-person households, comprising 7,418.
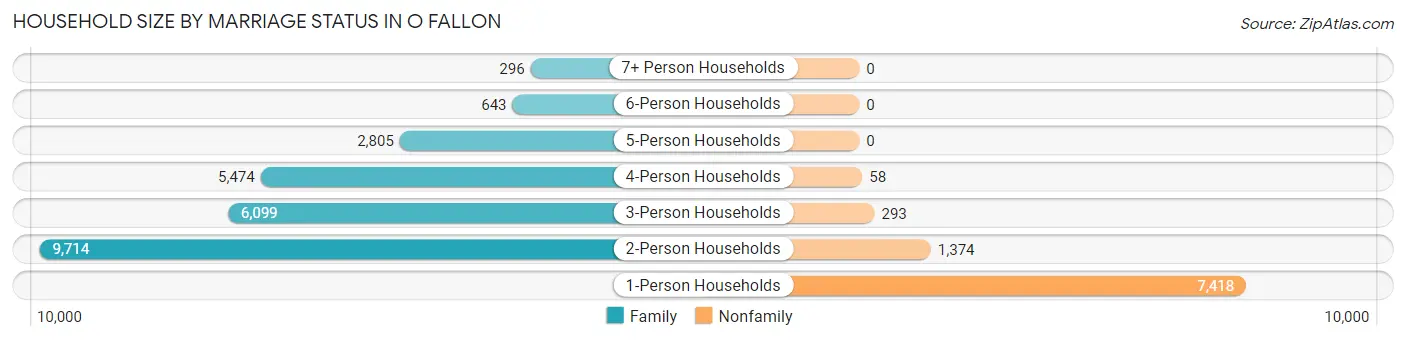
| Household Size | Family Households | Nonfamily Households |
| 1-Person Households | - | 7,418 (21.7%) |
| 2-Person Households | 9,714 (28.4%) | 1,374 (4.0%) |
| 3-Person Households | 6,099 (17.8%) | 293 (0.9%) |
| 4-Person Households | 5,474 (16.0%) | 58 (0.2%) |
| 5-Person Households | 2,805 (8.2%) | 0 (0.0%) |
| 6-Person Households | 643 (1.9%) | 0 (0.0%) |
| 7+ Person Households | 296 (0.9%) | 0 (0.0%) |
| Total | 25,031 (73.3%) | 9,143 (26.8%) |
Female Fertility in O Fallon
Fertility by Age in O Fallon
Average fertility rate in O Fallon is 52.0 births per 1,000 women. Women in the age bracket of 20 to 34 years have the highest fertility rate with 93.0 births per 1,000 women. Women in the age bracket of 20 to 34 years acount for 70.6% of all women with births.
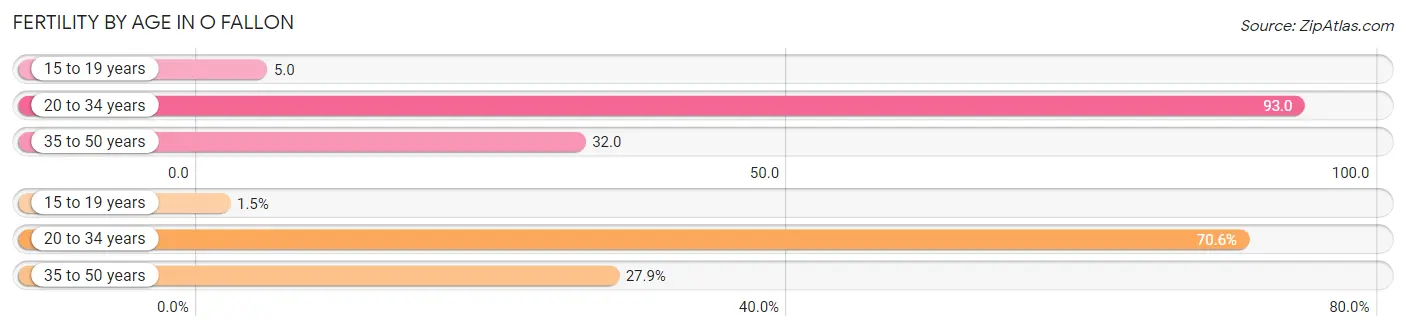
| Age Bracket | Women with Births | Births / 1,000 Women |
| 15 to 19 years | 17 (1.5%) | 5.0 |
| 20 to 34 years | 806 (70.6%) | 93.0 |
| 35 to 50 years | 318 (27.9%) | 32.0 |
| Total | 1,141 (100.0%) | 52.0 |
Fertility by Age by Marriage Status in O Fallon
79.9% of women with births (1,141) in O Fallon are married. The highest percentage of unmarried women with births falls into 15 to 19 years age bracket with 100.0% of them unmarried at the time of birth, while the lowest percentage of unmarried women with births belong to 35 to 50 years age bracket with 15.4% of them unmarried.
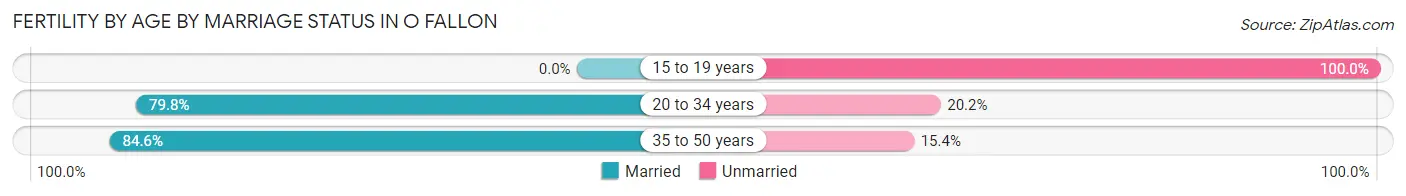
| Age Bracket | Married | Unmarried |
| 15 to 19 years | 0 (0.0%) | 17 (100.0%) |
| 20 to 34 years | 643 (79.8%) | 163 (20.2%) |
| 35 to 50 years | 269 (84.6%) | 49 (15.4%) |
| Total | 912 (79.9%) | 229 (20.1%) |
Fertility by Education in O Fallon
Average fertility rate in O Fallon is 52.0 births per 1,000 women. Women with the education attainment of graduate degree have the highest fertility rate of 72.0 births per 1,000 women, while women with the education attainment of less than high school have the lowest fertility at 7.0 births per 1,000 women. Women with the education attainment of bachelor's degree represent 33.9% of all women with births.
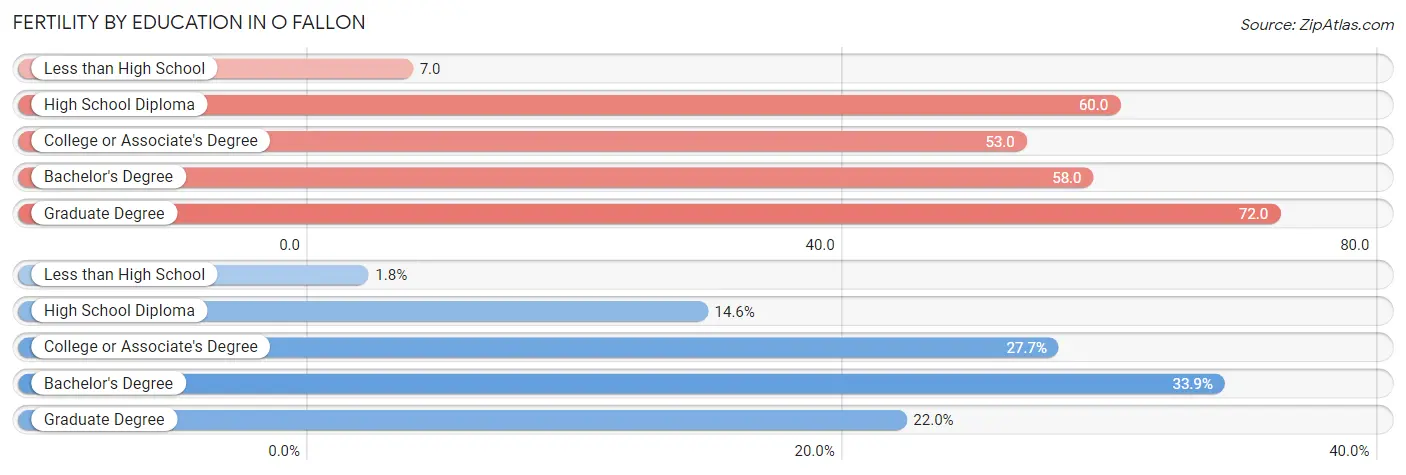
| Educational Attainment | Women with Births | Births / 1,000 Women |
| Less than High School | 21 (1.8%) | 7.0 |
| High School Diploma | 166 (14.5%) | 60.0 |
| College or Associate's Degree | 316 (27.7%) | 53.0 |
| Bachelor's Degree | 387 (33.9%) | 58.0 |
| Graduate Degree | 251 (22.0%) | 72.0 |
| Total | 1,141 (100.0%) | 52.0 |
Fertility by Education by Marriage Status in O Fallon
20.1% of women with births in O Fallon are unmarried. Women with the educational attainment of less than high school are most likely to be married with 100.0% of them married at childbirth, while women with the educational attainment of graduate degree are least likely to be married with 41.0% of them unmarried at childbirth.
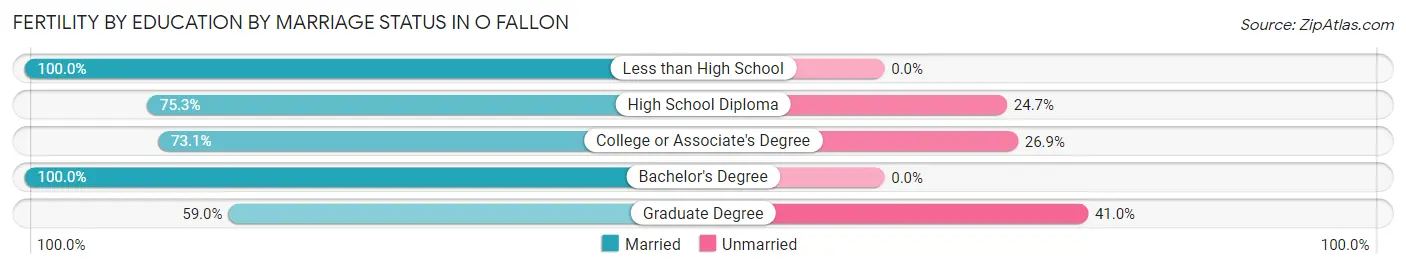
| Educational Attainment | Married | Unmarried |
| Less than High School | 21 (100.0%) | 0 (0.0%) |
| High School Diploma | 125 (75.3%) | 41 (24.7%) |
| College or Associate's Degree | 231 (73.1%) | 85 (26.9%) |
| Bachelor's Degree | 387 (100.0%) | 0 (0.0%) |
| Graduate Degree | 148 (59.0%) | 103 (41.0%) |
| Total | 912 (79.9%) | 229 (20.1%) |
Employment Characteristics in O Fallon
Employment by Class of Employer in O Fallon
Among the 50,214 employed individuals in O Fallon, private company employees (36,879 | 73.4%), not-for-profit organizations (4,690 | 9.3%), and local government employees (3,410 | 6.8%) make up the most common classes of employment.
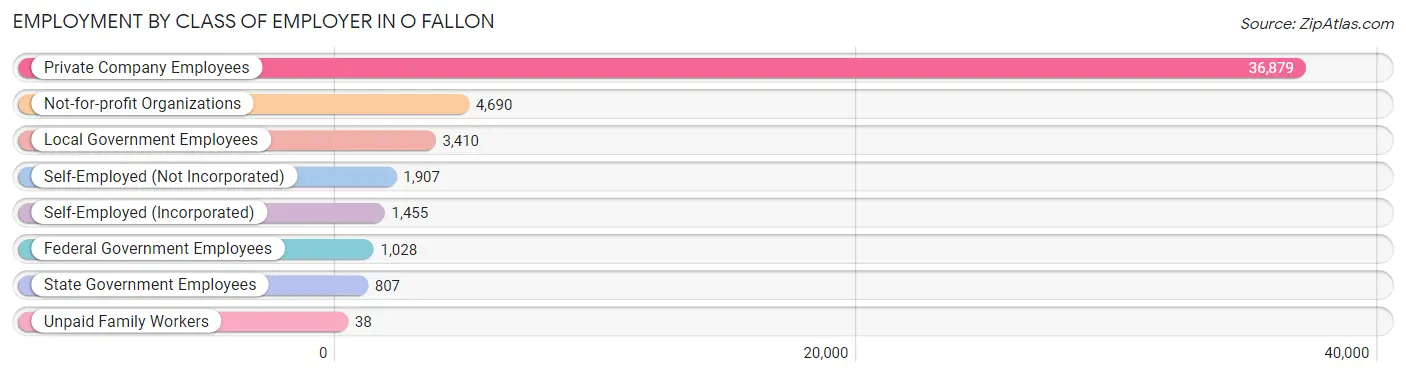
| Employer Class | # Employees | % Employees |
| Private Company Employees | 36,879 | 73.4% |
| Self-Employed (Incorporated) | 1,455 | 2.9% |
| Self-Employed (Not Incorporated) | 1,907 | 3.8% |
| Not-for-profit Organizations | 4,690 | 9.3% |
| Local Government Employees | 3,410 | 6.8% |
| State Government Employees | 807 | 1.6% |
| Federal Government Employees | 1,028 | 2.1% |
| Unpaid Family Workers | 38 | 0.1% |
| Total | 50,214 | 100.0% |
Employment Status by Age in O Fallon
According to the labor force statistics for O Fallon, out of the total population over 16 years of age (71,753), 73.0% or 52,380 individuals are in the labor force, with 3.1% or 1,624 of them unemployed. The age group with the highest labor force participation rate is 25 to 29 years, with 92.3% or 5,526 individuals in the labor force. Within the labor force, the 16 to 19 years age range has the highest percentage of unemployed individuals, with 7.4% or 209 of them being unemployed.
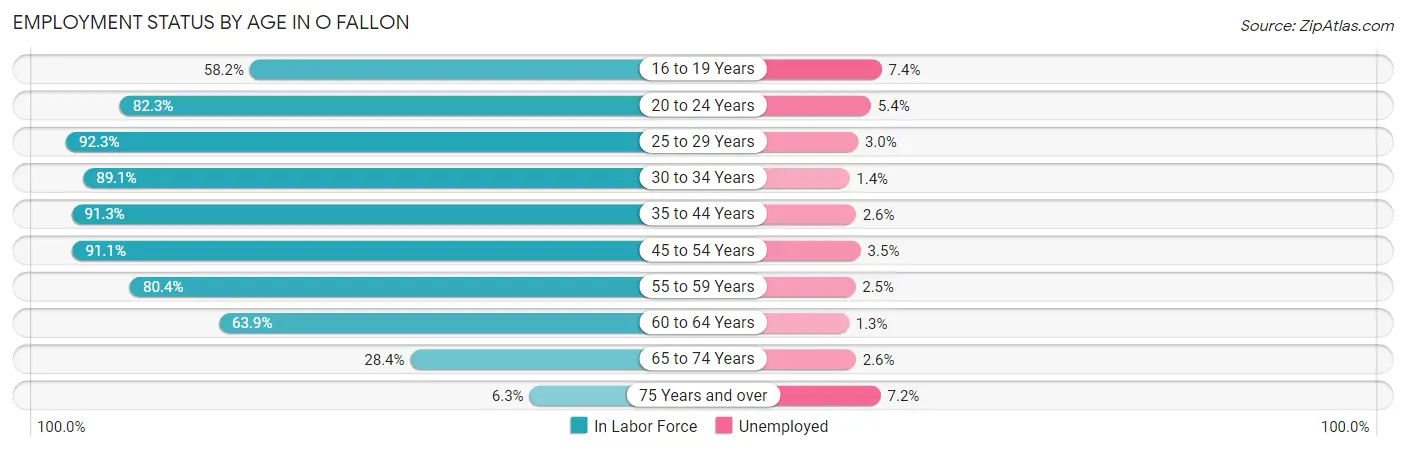
| Age Bracket | In Labor Force | Unemployed |
| 16 to 19 Years | 2,822 (58.2%) | 209 (7.4%) |
| 20 to 24 Years | 3,650 (82.3%) | 197 (5.4%) |
| 25 to 29 Years | 5,526 (92.3%) | 166 (3.0%) |
| 30 to 34 Years | 5,717 (89.1%) | 80 (1.4%) |
| 35 to 44 Years | 11,706 (91.3%) | 304 (2.6%) |
| 45 to 54 Years | 11,973 (91.1%) | 419 (3.5%) |
| 55 to 59 Years | 5,013 (80.4%) | 125 (2.5%) |
| 60 to 64 Years | 3,654 (63.9%) | 48 (1.3%) |
| 65 to 74 Years | 1,998 (28.4%) | 52 (2.6%) |
| 75 Years and over | 322 (6.3%) | 23 (7.2%) |
| Total | 52,380 (73.0%) | 1,624 (3.1%) |
Employment Status by Educational Attainment in O Fallon
According to labor force statistics for O Fallon, 86.6% of individuals (43,577) out of the total population between 25 and 64 years of age (50,320) are in the labor force, with 2.6% or 1,133 of them being unemployed. The group with the highest labor force participation rate are those with the educational attainment of bachelor's degree or higher, with 90.8% or 21,473 individuals in the labor force. Within the labor force, individuals with college / associate degree education have the highest percentage of unemployment, with 4.1% or 525 of them being unemployed.
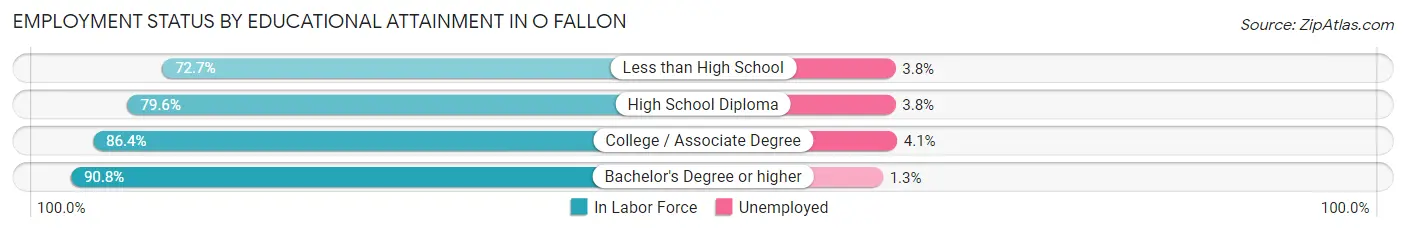
| Educational Attainment | In Labor Force | Unemployed |
| Less than High School | 1,319 (72.7%) | 69 (3.8%) |
| High School Diploma | 7,994 (79.6%) | 382 (3.8%) |
| College / Associate Degree | 12,799 (86.4%) | 607 (4.1%) |
| Bachelor's Degree or higher | 21,473 (90.8%) | 307 (1.3%) |
| Total | 43,577 (86.6%) | 1,308 (2.6%) |
Employment Occupations by Sex in O Fallon
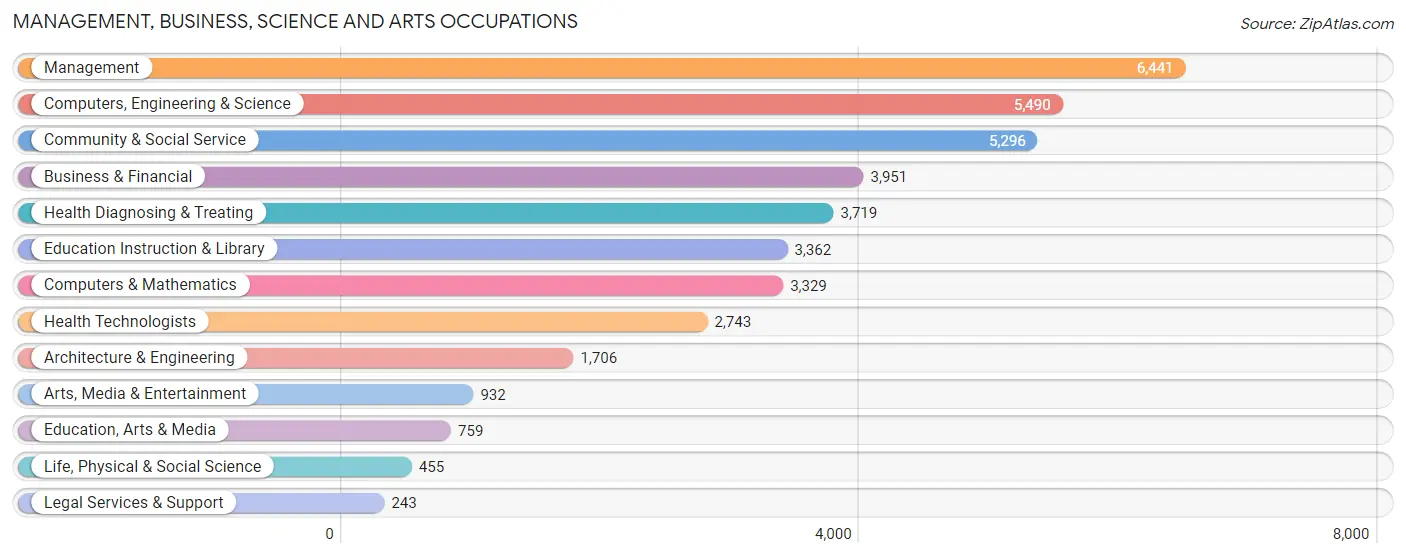
Management, Business, Science and Arts Occupations
The most common Management, Business, Science and Arts occupations in O Fallon are Management (6,441 | 12.7%), Computers, Engineering & Science (5,490 | 10.8%), Community & Social Service (5,296 | 10.4%), Business & Financial (3,951 | 7.8%), and Health Diagnosing & Treating (3,719 | 7.3%).
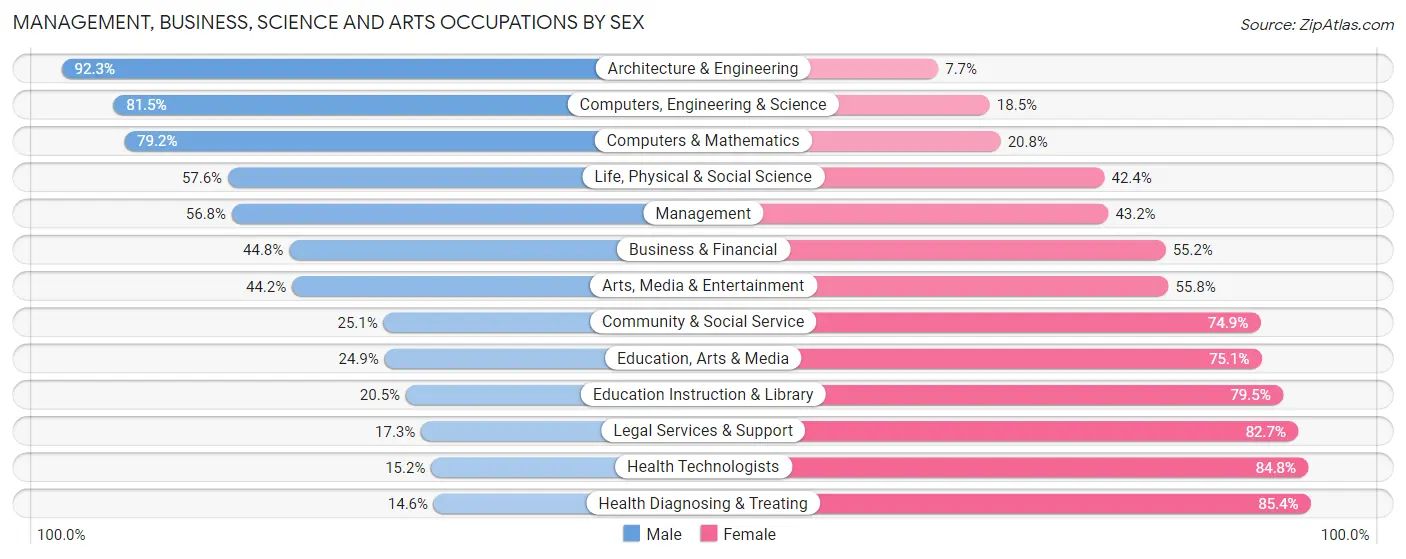
Management, Business, Science and Arts Occupations by Sex
Within the Management, Business, Science and Arts occupations in O Fallon, the most male-oriented occupations are Architecture & Engineering (92.3%), Computers, Engineering & Science (81.5%), and Computers & Mathematics (79.2%), while the most female-oriented occupations are Health Diagnosing & Treating (85.4%), Health Technologists (84.8%), and Legal Services & Support (82.7%).
| Occupation | Male | Female |
| Management | 3,656 (56.8%) | 2,785 (43.2%) |
| Business & Financial | 1,771 (44.8%) | 2,180 (55.2%) |
| Computers, Engineering & Science | 4,474 (81.5%) | 1,016 (18.5%) |
| Computers & Mathematics | 2,638 (79.2%) | 691 (20.8%) |
| Architecture & Engineering | 1,574 (92.3%) | 132 (7.7%) |
| Life, Physical & Social Science | 262 (57.6%) | 193 (42.4%) |
| Community & Social Service | 1,331 (25.1%) | 3,965 (74.9%) |
| Education, Arts & Media | 189 (24.9%) | 570 (75.1%) |
| Legal Services & Support | 42 (17.3%) | 201 (82.7%) |
| Education Instruction & Library | 688 (20.5%) | 2,674 (79.5%) |
| Arts, Media & Entertainment | 412 (44.2%) | 520 (55.8%) |
| Health Diagnosing & Treating | 544 (14.6%) | 3,175 (85.4%) |
| Health Technologists | 416 (15.2%) | 2,327 (84.8%) |
| Total (Category) | 11,776 (47.3%) | 13,121 (52.7%) |
| Total (Overall) | 26,148 (51.6%) | 24,553 (48.4%) |
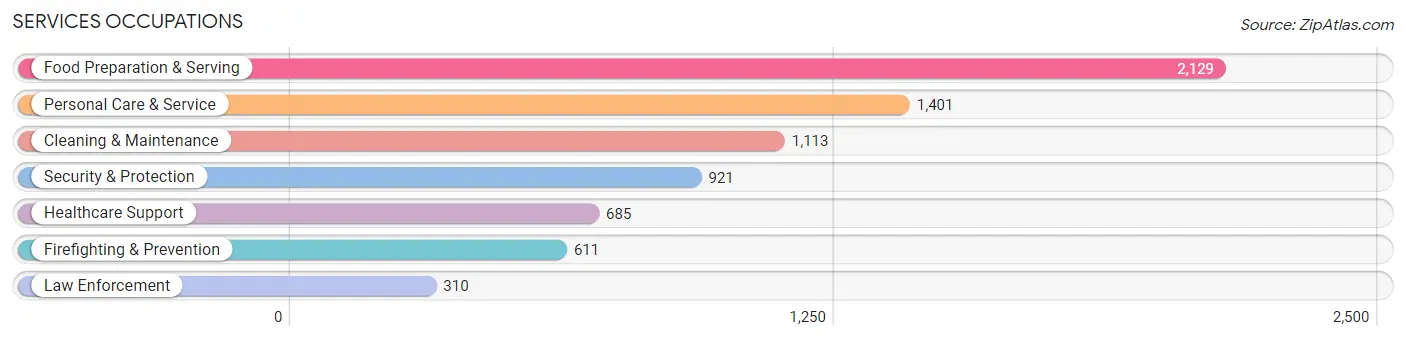
Services Occupations
The most common Services occupations in O Fallon are Food Preparation & Serving (2,129 | 4.2%), Personal Care & Service (1,401 | 2.8%), Cleaning & Maintenance (1,113 | 2.2%), Security & Protection (921 | 1.8%), and Healthcare Support (685 | 1.3%).
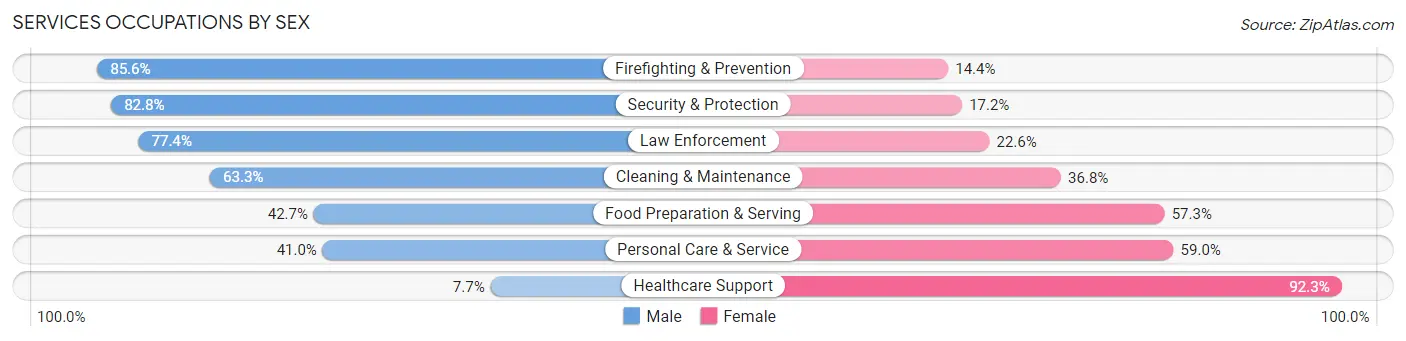
Services Occupations by Sex
Within the Services occupations in O Fallon, the most male-oriented occupations are Firefighting & Prevention (85.6%), Security & Protection (82.8%), and Law Enforcement (77.4%), while the most female-oriented occupations are Healthcare Support (92.3%), Personal Care & Service (59.0%), and Food Preparation & Serving (57.3%).
| Occupation | Male | Female |
| Healthcare Support | 53 (7.7%) | 632 (92.3%) |
| Security & Protection | 763 (82.8%) | 158 (17.2%) |
| Firefighting & Prevention | 523 (85.6%) | 88 (14.4%) |
| Law Enforcement | 240 (77.4%) | 70 (22.6%) |
| Food Preparation & Serving | 910 (42.7%) | 1,219 (57.3%) |
| Cleaning & Maintenance | 704 (63.2%) | 409 (36.7%) |
| Personal Care & Service | 574 (41.0%) | 827 (59.0%) |
| Total (Category) | 3,004 (48.1%) | 3,245 (51.9%) |
| Total (Overall) | 26,148 (51.6%) | 24,553 (48.4%) |
Sales and Office Occupations
The most common Sales and Office occupations in O Fallon are Sales & Related (5,945 | 11.7%), and Office & Administration (5,563 | 11.0%).

Sales and Office Occupations by Sex

| Occupation | Male | Female |
| Sales & Related | 3,302 (55.5%) | 2,643 (44.5%) |
| Office & Administration | 1,257 (22.6%) | 4,306 (77.4%) |
| Total (Category) | 4,559 (39.6%) | 6,949 (60.4%) |
| Total (Overall) | 26,148 (51.6%) | 24,553 (48.4%) |
Natural Resources, Construction and Maintenance Occupations
The most common Natural Resources, Construction and Maintenance occupations in O Fallon are Construction & Extraction (2,154 | 4.3%), Installation, Maintenance & Repair (1,451 | 2.9%), and Farming, Fishing & Forestry (35 | 0.1%).
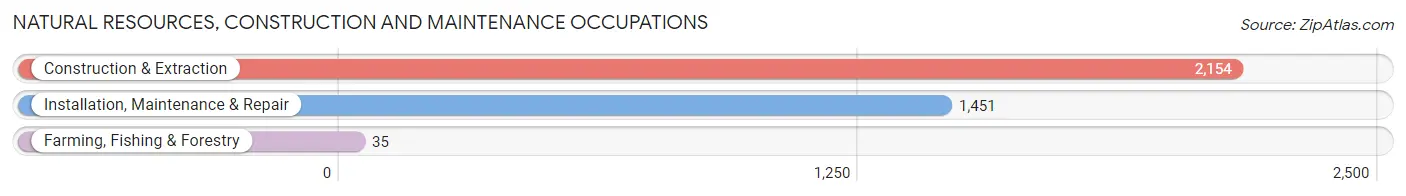
Natural Resources, Construction and Maintenance Occupations by Sex

| Occupation | Male | Female |
| Farming, Fishing & Forestry | 35 (100.0%) | 0 (0.0%) |
| Construction & Extraction | 2,076 (96.4%) | 78 (3.6%) |
| Installation, Maintenance & Repair | 1,440 (99.2%) | 11 (0.8%) |
| Total (Category) | 3,551 (97.6%) | 89 (2.5%) |
| Total (Overall) | 26,148 (51.6%) | 24,553 (48.4%) |
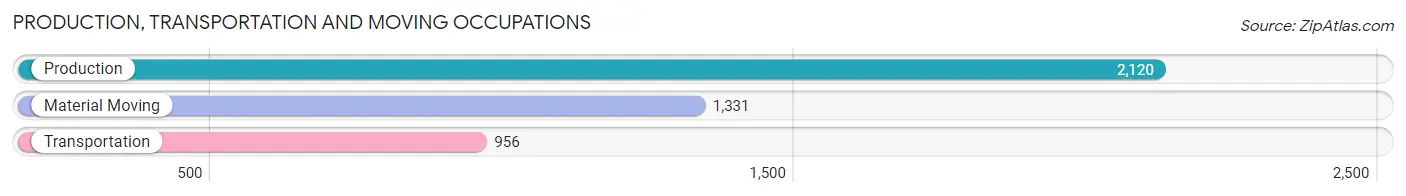
Production, Transportation and Moving Occupations
The most common Production, Transportation and Moving occupations in O Fallon are Production (2,120 | 4.2%), Material Moving (1,331 | 2.6%), and Transportation (956 | 1.9%).
Production, Transportation and Moving Occupations by Sex
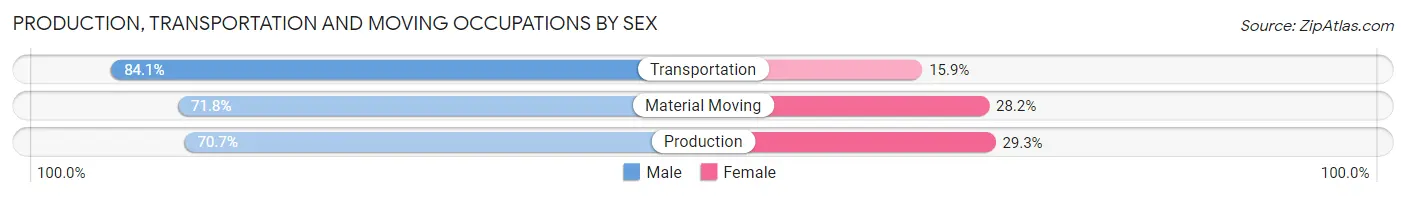
| Occupation | Male | Female |
| Production | 1,498 (70.7%) | 622 (29.3%) |
| Transportation | 804 (84.1%) | 152 (15.9%) |
| Material Moving | 956 (71.8%) | 375 (28.2%) |
| Total (Category) | 3,258 (73.9%) | 1,149 (26.1%) |
| Total (Overall) | 26,148 (51.6%) | 24,553 (48.4%) |
Employment Industries by Sex in O Fallon
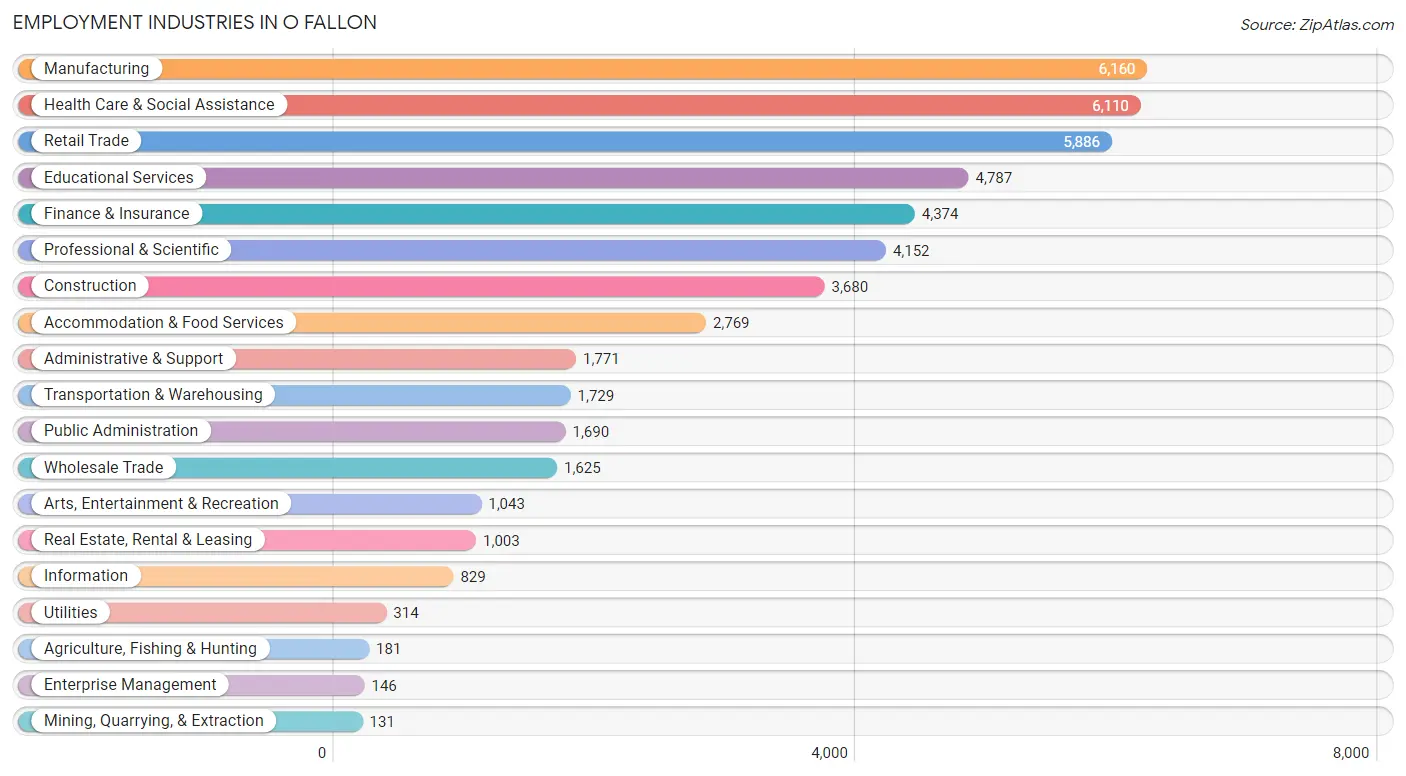
Employment Industries in O Fallon
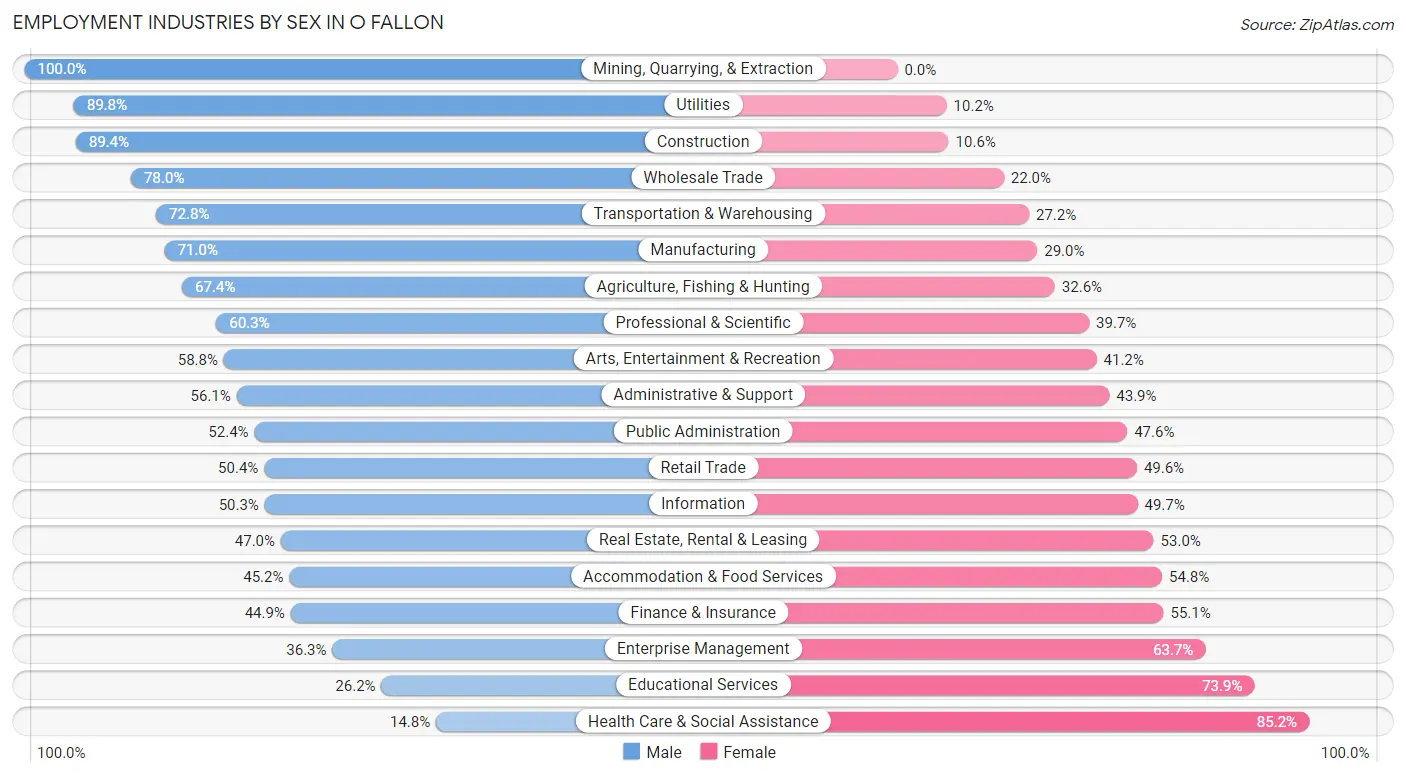
The major employment industries in O Fallon include Manufacturing (6,160 | 12.1%), Health Care & Social Assistance (6,110 | 12.0%), Retail Trade (5,886 | 11.6%), Educational Services (4,787 | 9.4%), and Finance & Insurance (4,374 | 8.6%).
Employment Industries by Sex in O Fallon
The O Fallon industries that see more men than women are Mining, Quarrying, & Extraction (100.0%), Utilities (89.8%), and Construction (89.4%), whereas the industries that tend to have a higher number of women are Health Care & Social Assistance (85.2%), Educational Services (73.9%), and Enterprise Management (63.7%).
| Industry | Male | Female |
| Agriculture, Fishing & Hunting | 122 (67.4%) | 59 (32.6%) |
| Mining, Quarrying, & Extraction | 131 (100.0%) | 0 (0.0%) |
| Construction | 3,290 (89.4%) | 390 (10.6%) |
| Manufacturing | 4,376 (71.0%) | 1,784 (29.0%) |
| Wholesale Trade | 1,267 (78.0%) | 358 (22.0%) |
| Retail Trade | 2,968 (50.4%) | 2,918 (49.6%) |
| Transportation & Warehousing | 1,258 (72.8%) | 471 (27.2%) |
| Utilities | 282 (89.8%) | 32 (10.2%) |
| Information | 417 (50.3%) | 412 (49.7%) |
| Finance & Insurance | 1,965 (44.9%) | 2,409 (55.1%) |
| Real Estate, Rental & Leasing | 471 (47.0%) | 532 (53.0%) |
| Professional & Scientific | 2,504 (60.3%) | 1,648 (39.7%) |
| Enterprise Management | 53 (36.3%) | 93 (63.7%) |
| Administrative & Support | 994 (56.1%) | 777 (43.9%) |
| Educational Services | 1,252 (26.2%) | 3,535 (73.9%) |
| Health Care & Social Assistance | 907 (14.8%) | 5,203 (85.2%) |
| Arts, Entertainment & Recreation | 613 (58.8%) | 430 (41.2%) |
| Accommodation & Food Services | 1,252 (45.2%) | 1,517 (54.8%) |
| Public Administration | 886 (52.4%) | 804 (47.6%) |
| Total | 26,148 (51.6%) | 24,553 (48.4%) |
Education in O Fallon
School Enrollment in O Fallon
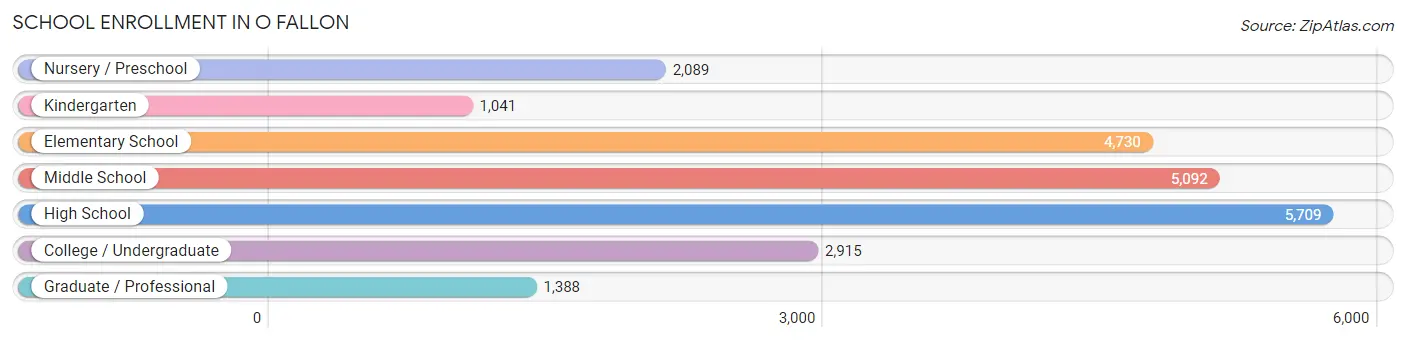
The most common levels of schooling among the 22,964 students in O Fallon are high school (5,709 | 24.9%), middle school (5,092 | 22.2%), and elementary school (4,730 | 20.6%).
| School Level | # Students | % Students |
| Nursery / Preschool | 2,089 | 9.1% |
| Kindergarten | 1,041 | 4.5% |
| Elementary School | 4,730 | 20.6% |
| Middle School | 5,092 | 22.2% |
| High School | 5,709 | 24.9% |
| College / Undergraduate | 2,915 | 12.7% |
| Graduate / Professional | 1,388 | 6.0% |
| Total | 22,964 | 100.0% |
School Enrollment by Age by Funding Source in O Fallon
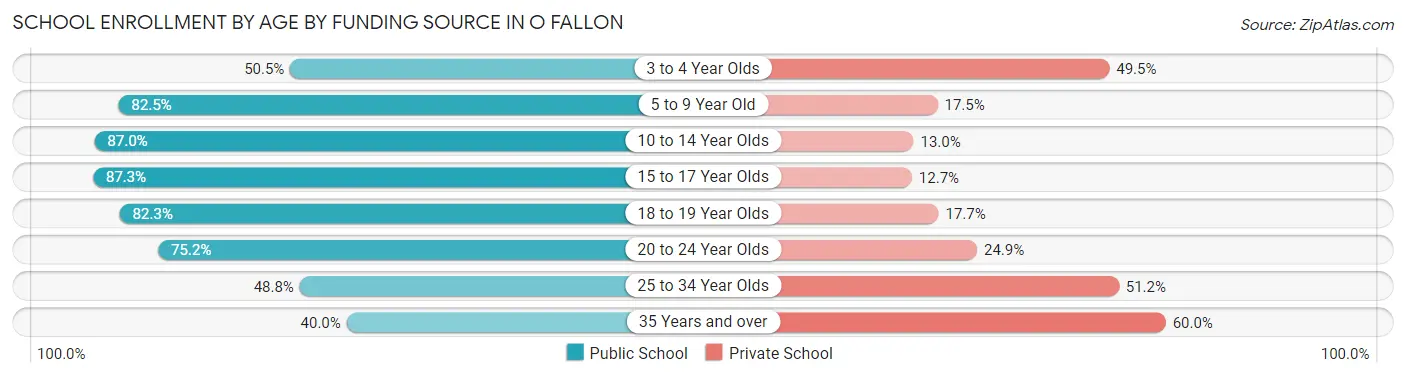
Out of a total of 22,964 students who are enrolled in schools in O Fallon, 4,960 (21.6%) attend a private institution, while the remaining 18,004 (78.4%) are enrolled in public schools. The age group of 35 years and over has the highest likelihood of being enrolled in private schools, with 610 (60.0% in the age bracket) enrolled. Conversely, the age group of 15 to 17 year olds has the lowest likelihood of being enrolled in a private school, with 3,709 (87.3% in the age bracket) attending a public institution.
| Age Bracket | Public School | Private School |
| 3 to 4 Year Olds | 816 (50.5%) | 799 (49.5%) |
| 5 to 9 Year Old | 4,439 (82.5%) | 940 (17.5%) |
| 10 to 14 Year Olds | 5,672 (87.0%) | 848 (13.0%) |
| 15 to 17 Year Olds | 3,709 (87.3%) | 540 (12.7%) |
| 18 to 19 Year Olds | 1,313 (82.3%) | 282 (17.7%) |
| 20 to 24 Year Olds | 1,098 (75.1%) | 363 (24.8%) |
| 25 to 34 Year Olds | 550 (48.8%) | 578 (51.2%) |
| 35 Years and over | 407 (40.0%) | 610 (60.0%) |
| Total | 18,004 (78.4%) | 4,960 (21.6%) |
Educational Attainment by Field of Study in O Fallon
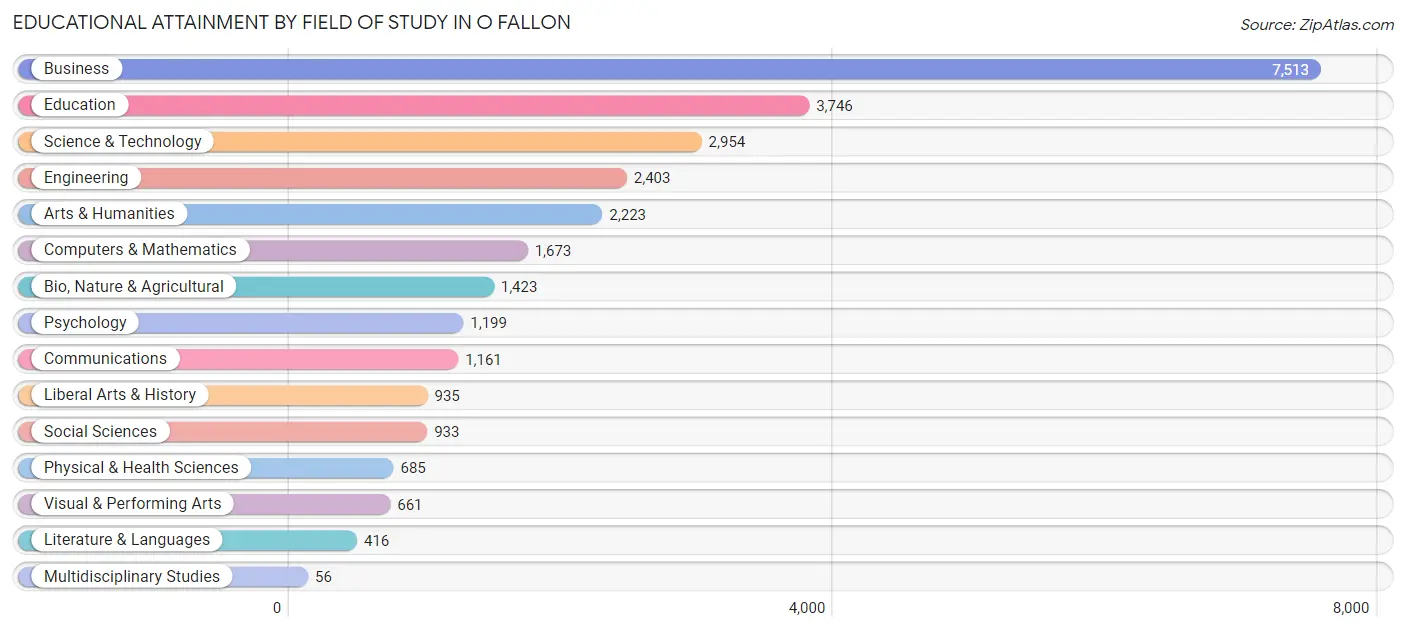
Business (7,513 | 26.9%), education (3,746 | 13.4%), science & technology (2,954 | 10.6%), engineering (2,403 | 8.6%), and arts & humanities (2,223 | 7.9%) are the most common fields of study among 27,981 individuals in O Fallon who have obtained a bachelor's degree or higher.
| Field of Study | # Graduates | % Graduates |
| Computers & Mathematics | 1,673 | 6.0% |
| Bio, Nature & Agricultural | 1,423 | 5.1% |
| Physical & Health Sciences | 685 | 2.5% |
| Psychology | 1,199 | 4.3% |
| Social Sciences | 933 | 3.3% |
| Engineering | 2,403 | 8.6% |
| Multidisciplinary Studies | 56 | 0.2% |
| Science & Technology | 2,954 | 10.6% |
| Business | 7,513 | 26.9% |
| Education | 3,746 | 13.4% |
| Literature & Languages | 416 | 1.5% |
| Liberal Arts & History | 935 | 3.3% |
| Visual & Performing Arts | 661 | 2.4% |
| Communications | 1,161 | 4.2% |
| Arts & Humanities | 2,223 | 7.9% |
| Total | 27,981 | 100.0% |
Transportation & Commute in O Fallon
Vehicle Availability by Sex in O Fallon
The most prevalent vehicle ownership categories in O Fallon are males with 2 vehicles (11,985, accounting for 46.1%) and females with 2 vehicles (10,577, making up 49.5%).
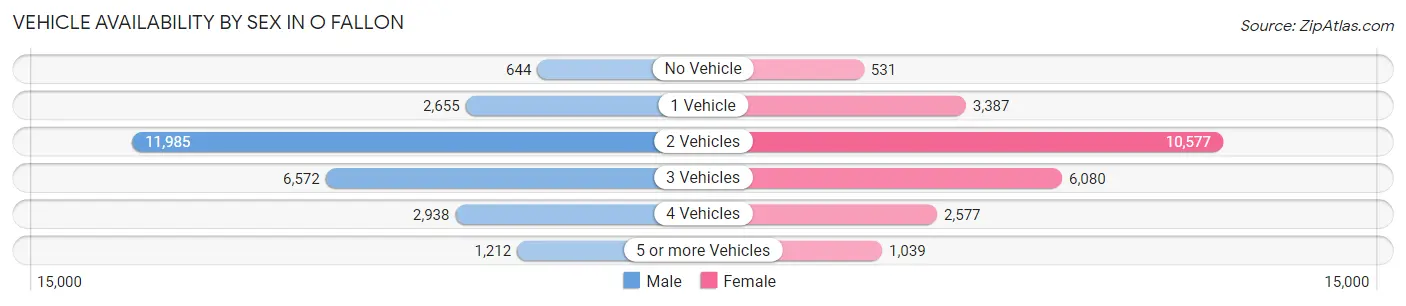
| Vehicles Available | Male | Female |
| No Vehicle | 644 (2.5%) | 531 (2.2%) |
| 1 Vehicle | 2,655 (10.2%) | 3,387 (14.0%) |
| 2 Vehicles | 11,985 (46.1%) | 10,577 (43.7%) |
| 3 Vehicles | 6,572 (25.3%) | 6,080 (25.1%) |
| 4 Vehicles | 2,938 (11.3%) | 2,577 (10.6%) |
| 5 or more Vehicles | 1,212 (4.7%) | 1,039 (4.3%) |
| Total | 26,006 (100.0%) | 24,191 (100.0%) |
Commute Time in O Fallon
The most frequently occuring commute durations in O Fallon are 30 to 34 minutes (7,619 commuters, 17.6%), 20 to 24 minutes (6,084 commuters, 14.1%), and 15 to 19 minutes (5,951 commuters, 13.8%).
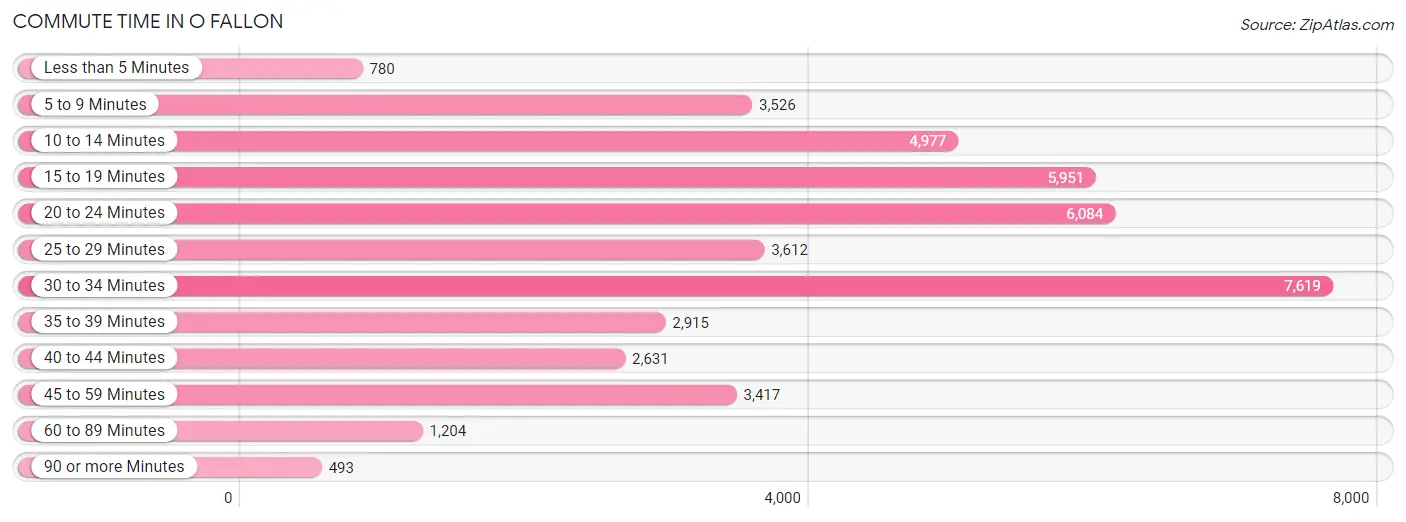
| Commute Time | # Commuters | % Commuters |
| Less than 5 Minutes | 780 | 1.8% |
| 5 to 9 Minutes | 3,526 | 8.2% |
| 10 to 14 Minutes | 4,977 | 11.5% |
| 15 to 19 Minutes | 5,951 | 13.8% |
| 20 to 24 Minutes | 6,084 | 14.1% |
| 25 to 29 Minutes | 3,612 | 8.4% |
| 30 to 34 Minutes | 7,619 | 17.6% |
| 35 to 39 Minutes | 2,915 | 6.8% |
| 40 to 44 Minutes | 2,631 | 6.1% |
| 45 to 59 Minutes | 3,417 | 7.9% |
| 60 to 89 Minutes | 1,204 | 2.8% |
| 90 or more Minutes | 493 | 1.1% |
Commute Time by Sex in O Fallon
The most common commute times in O Fallon are 30 to 34 minutes (4,603 commuters, 19.9%) for males and 30 to 34 minutes (3,016 commuters, 15.0%) for females.
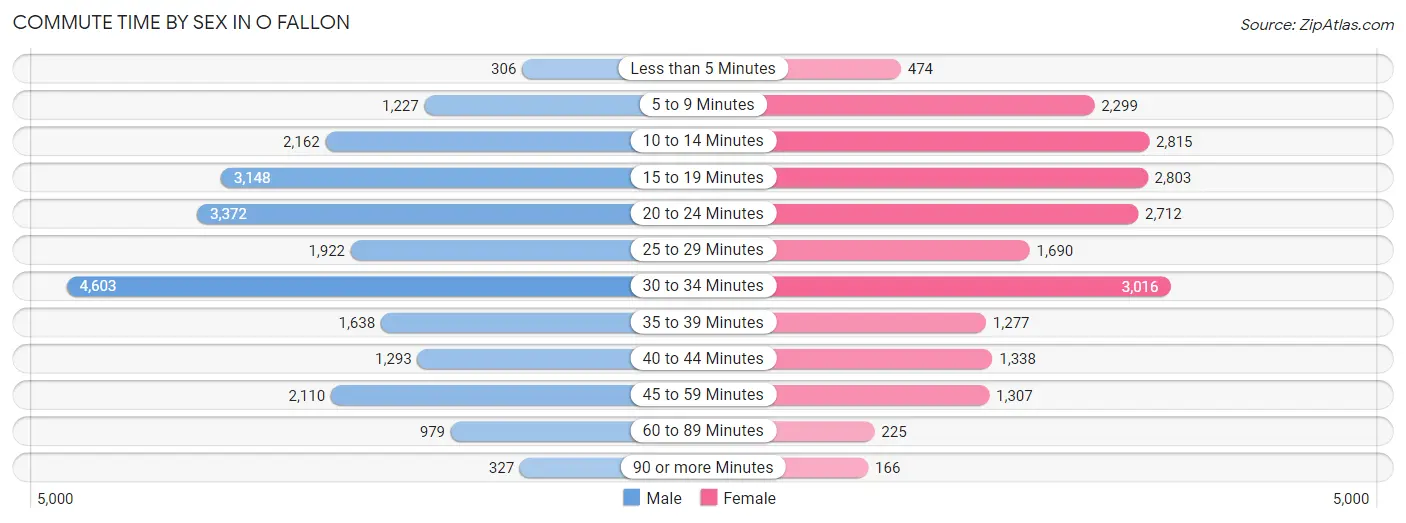
| Commute Time | Male | Female |
| Less than 5 Minutes | 306 (1.3%) | 474 (2.4%) |
| 5 to 9 Minutes | 1,227 (5.3%) | 2,299 (11.4%) |
| 10 to 14 Minutes | 2,162 (9.4%) | 2,815 (14.0%) |
| 15 to 19 Minutes | 3,148 (13.6%) | 2,803 (13.9%) |
| 20 to 24 Minutes | 3,372 (14.6%) | 2,712 (13.5%) |
| 25 to 29 Minutes | 1,922 (8.3%) | 1,690 (8.4%) |
| 30 to 34 Minutes | 4,603 (19.9%) | 3,016 (15.0%) |
| 35 to 39 Minutes | 1,638 (7.1%) | 1,277 (6.4%) |
| 40 to 44 Minutes | 1,293 (5.6%) | 1,338 (6.7%) |
| 45 to 59 Minutes | 2,110 (9.1%) | 1,307 (6.5%) |
| 60 to 89 Minutes | 979 (4.2%) | 225 (1.1%) |
| 90 or more Minutes | 327 (1.4%) | 166 (0.8%) |
Time of Departure to Work by Sex in O Fallon
The most frequent times of departure to work in O Fallon are 7:00 AM to 7:29 AM (3,365, 14.6%) for males and 7:00 AM to 7:29 AM (3,600, 17.9%) for females.
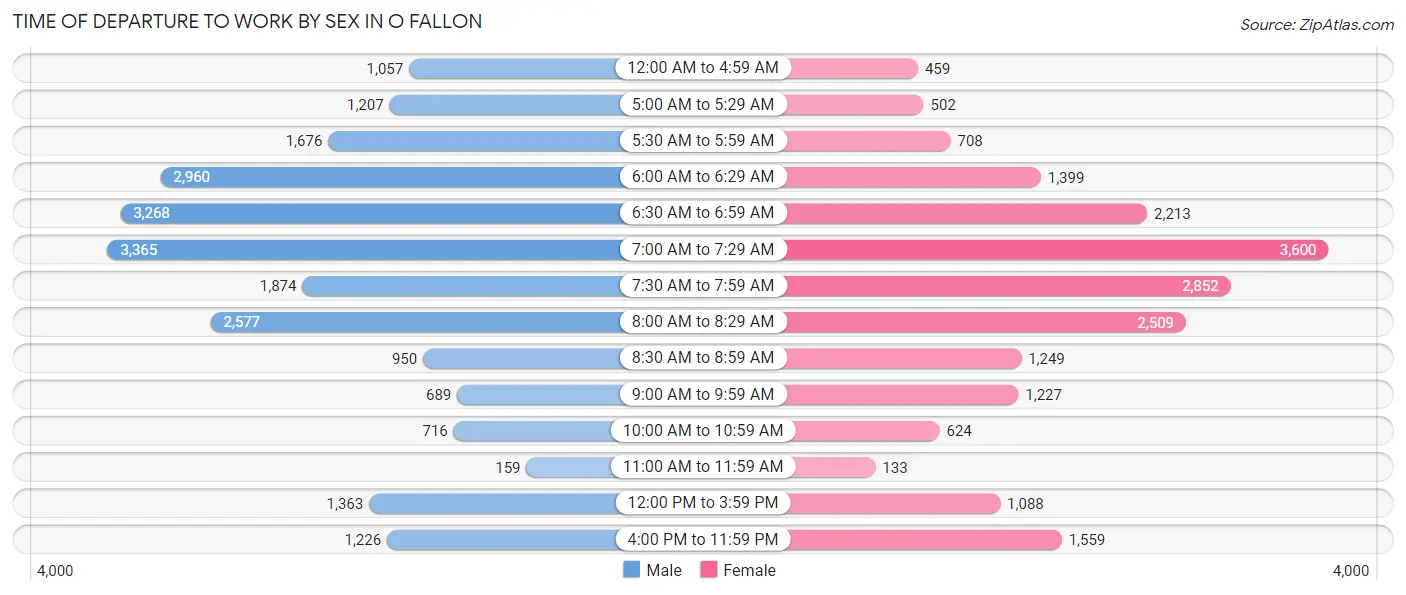
| Time of Departure | Male | Female |
| 12:00 AM to 4:59 AM | 1,057 (4.6%) | 459 (2.3%) |
| 5:00 AM to 5:29 AM | 1,207 (5.2%) | 502 (2.5%) |
| 5:30 AM to 5:59 AM | 1,676 (7.3%) | 708 (3.5%) |
| 6:00 AM to 6:29 AM | 2,960 (12.8%) | 1,399 (7.0%) |
| 6:30 AM to 6:59 AM | 3,268 (14.2%) | 2,213 (11.0%) |
| 7:00 AM to 7:29 AM | 3,365 (14.6%) | 3,600 (17.9%) |
| 7:30 AM to 7:59 AM | 1,874 (8.1%) | 2,852 (14.2%) |
| 8:00 AM to 8:29 AM | 2,577 (11.2%) | 2,509 (12.5%) |
| 8:30 AM to 8:59 AM | 950 (4.1%) | 1,249 (6.2%) |
| 9:00 AM to 9:59 AM | 689 (3.0%) | 1,227 (6.1%) |
| 10:00 AM to 10:59 AM | 716 (3.1%) | 624 (3.1%) |
| 11:00 AM to 11:59 AM | 159 (0.7%) | 133 (0.7%) |
| 12:00 PM to 3:59 PM | 1,363 (5.9%) | 1,088 (5.4%) |
| 4:00 PM to 11:59 PM | 1,226 (5.3%) | 1,559 (7.7%) |
| Total | 23,087 (100.0%) | 20,122 (100.0%) |
Housing Occupancy in O Fallon
Occupancy by Ownership in O Fallon
Of the total 34,174 dwellings in O Fallon, owner-occupied units account for 27,638 (80.9%), while renter-occupied units make up 6,536 (19.1%).
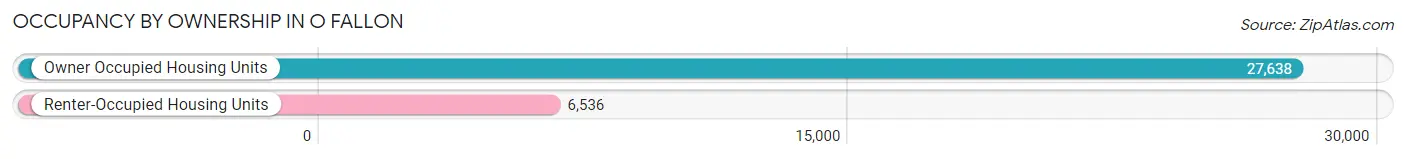
| Occupancy | # Housing Units | % Housing Units |
| Owner Occupied Housing Units | 27,638 | 80.9% |
| Renter-Occupied Housing Units | 6,536 | 19.1% |
| Total Occupied Housing Units | 34,174 | 100.0% |
Occupancy by Household Size in O Fallon
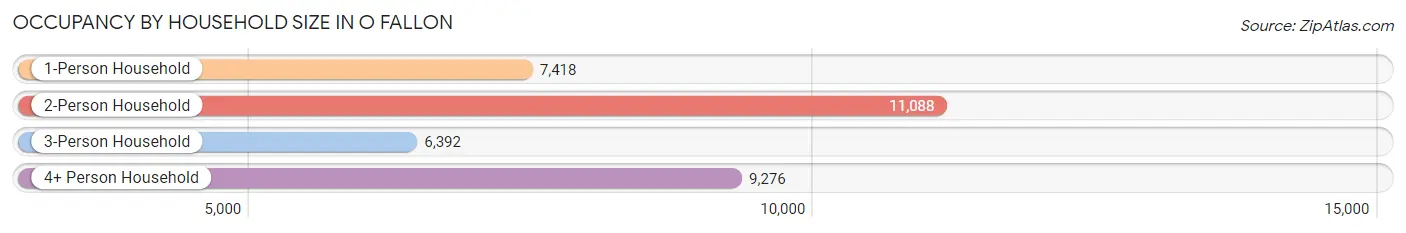
| Household Size | # Housing Units | % Housing Units |
| 1-Person Household | 7,418 | 21.7% |
| 2-Person Household | 11,088 | 32.5% |
| 3-Person Household | 6,392 | 18.7% |
| 4+ Person Household | 9,276 | 27.1% |
| Total Housing Units | 34,174 | 100.0% |
Occupancy by Ownership by Household Size in O Fallon
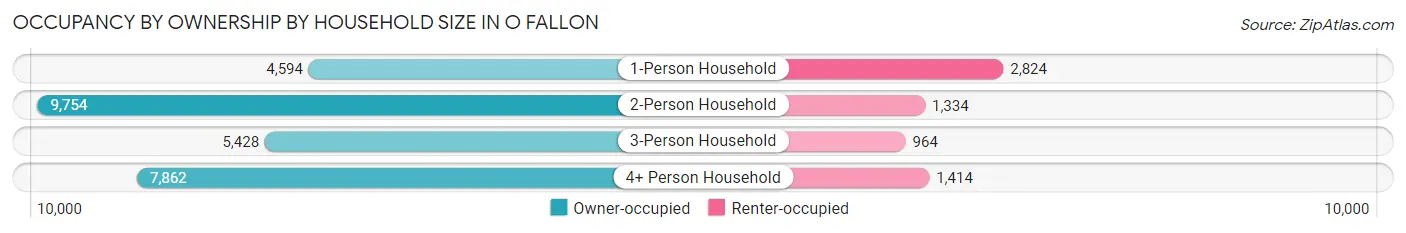
| Household Size | Owner-occupied | Renter-occupied |
| 1-Person Household | 4,594 (61.9%) | 2,824 (38.1%) |
| 2-Person Household | 9,754 (88.0%) | 1,334 (12.0%) |
| 3-Person Household | 5,428 (84.9%) | 964 (15.1%) |
| 4+ Person Household | 7,862 (84.8%) | 1,414 (15.2%) |
| Total Housing Units | 27,638 (80.9%) | 6,536 (19.1%) |
Occupancy by Educational Attainment in O Fallon
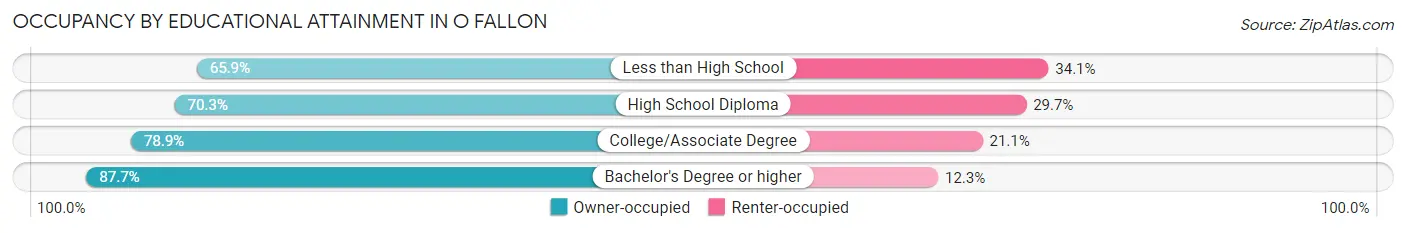
| Household Size | Owner-occupied | Renter-occupied |
| Less than High School | 793 (65.9%) | 411 (34.1%) |
| High School Diploma | 4,775 (70.3%) | 2,021 (29.7%) |
| College/Associate Degree | 8,004 (78.9%) | 2,139 (21.1%) |
| Bachelor's Degree or higher | 14,066 (87.7%) | 1,965 (12.3%) |
Occupancy by Age of Householder in O Fallon
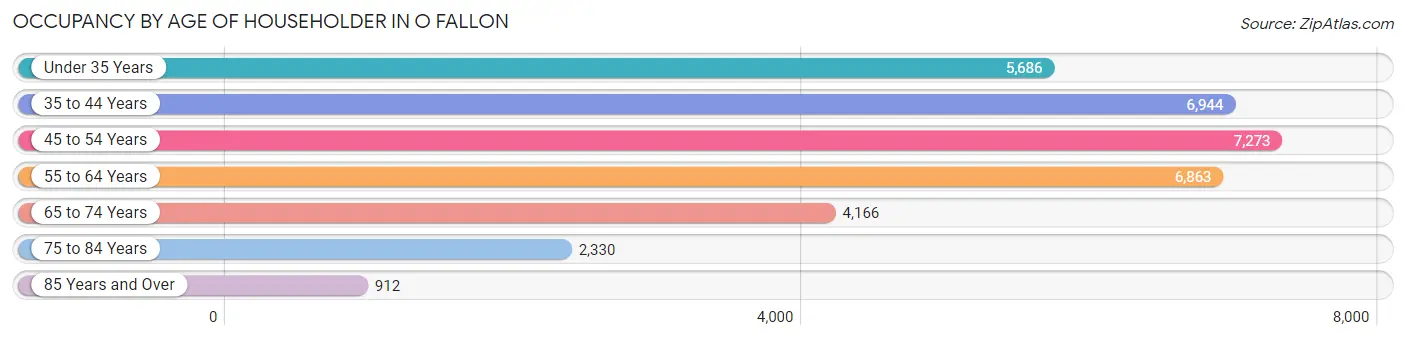
| Age Bracket | # Households | % Households |
| Under 35 Years | 5,686 | 16.6% |
| 35 to 44 Years | 6,944 | 20.3% |
| 45 to 54 Years | 7,273 | 21.3% |
| 55 to 64 Years | 6,863 | 20.1% |
| 65 to 74 Years | 4,166 | 12.2% |
| 75 to 84 Years | 2,330 | 6.8% |
| 85 Years and Over | 912 | 2.7% |
| Total | 34,174 | 100.0% |
Housing Finances in O Fallon
Median Income by Occupancy in O Fallon
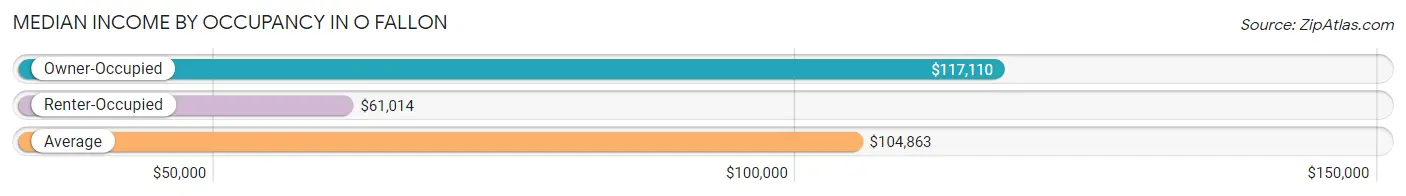
| Occupancy Type | # Households | Median Income |
| Owner-Occupied | 27,638 (80.9%) | $117,110 |
| Renter-Occupied | 6,536 (19.1%) | $61,014 |
| Average | 34,174 (100.0%) | $104,863 |
Occupancy by Householder Income Bracket in O Fallon
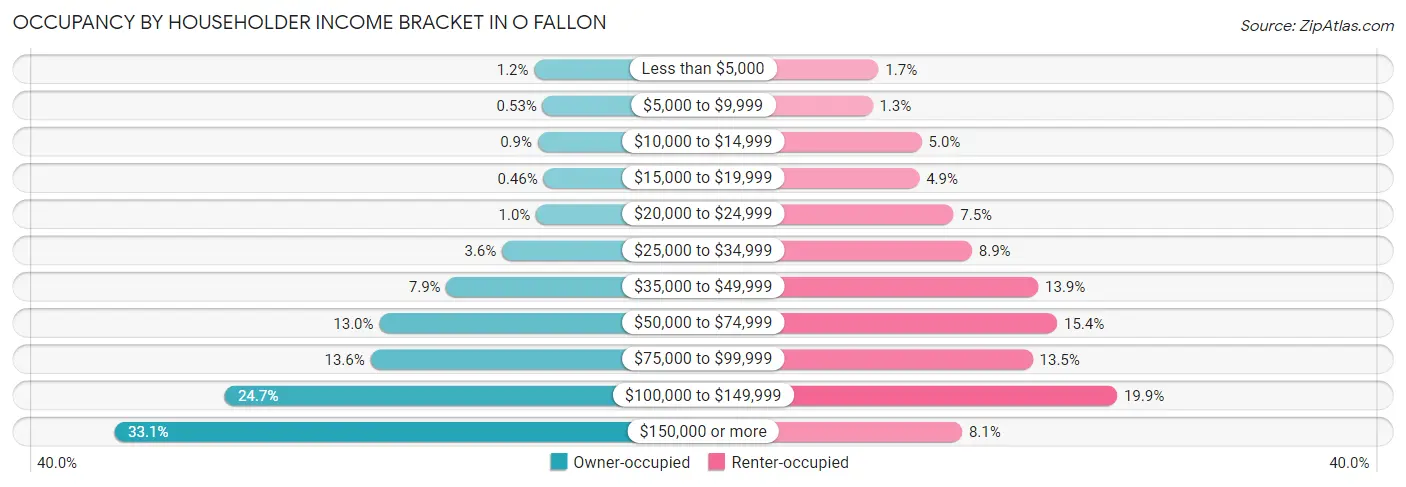
| Income Bracket | Owner-occupied | Renter-occupied |
| Less than $5,000 | 321 (1.2%) | 114 (1.7%) |
| $5,000 to $9,999 | 146 (0.5%) | 84 (1.3%) |
| $10,000 to $14,999 | 250 (0.9%) | 329 (5.0%) |
| $15,000 to $19,999 | 128 (0.5%) | 317 (4.9%) |
| $20,000 to $24,999 | 281 (1.0%) | 487 (7.4%) |
| $25,000 to $34,999 | 1,001 (3.6%) | 579 (8.9%) |
| $35,000 to $49,999 | 2,172 (7.9%) | 909 (13.9%) |
| $50,000 to $74,999 | 3,586 (13.0%) | 1,003 (15.3%) |
| $75,000 to $99,999 | 3,771 (13.6%) | 882 (13.5%) |
| $100,000 to $149,999 | 6,835 (24.7%) | 1,302 (19.9%) |
| $150,000 or more | 9,147 (33.1%) | 530 (8.1%) |
| Total | 27,638 (100.0%) | 6,536 (100.0%) |
Monthly Housing Cost Tiers in O Fallon
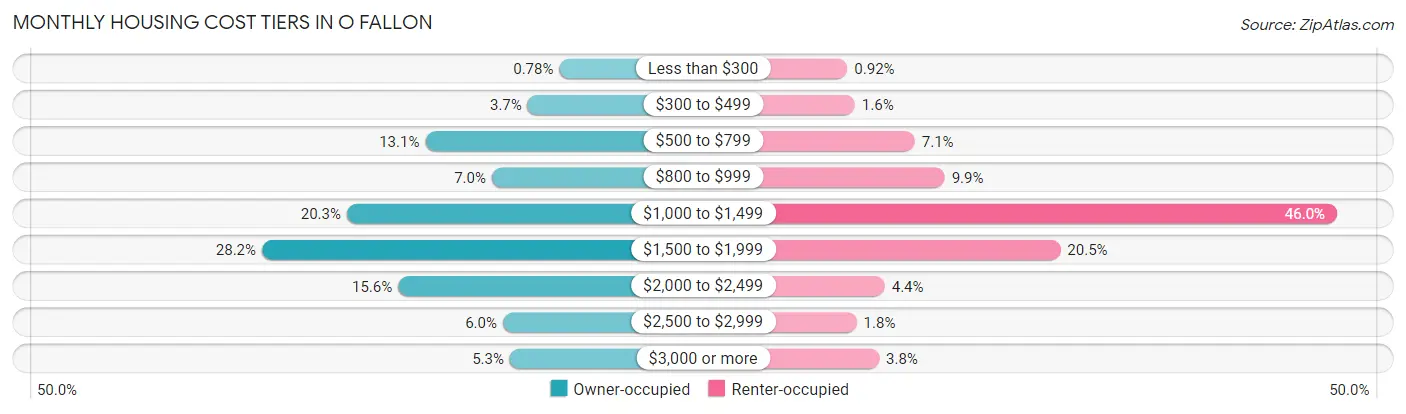
| Monthly Cost | Owner-occupied | Renter-occupied |
| Less than $300 | 215 (0.8%) | 60 (0.9%) |
| $300 to $499 | 1,019 (3.7%) | 105 (1.6%) |
| $500 to $799 | 3,625 (13.1%) | 466 (7.1%) |
| $800 to $999 | 1,931 (7.0%) | 646 (9.9%) |
| $1,000 to $1,499 | 5,622 (20.3%) | 3,005 (46.0%) |
| $1,500 to $1,999 | 7,784 (28.2%) | 1,342 (20.5%) |
| $2,000 to $2,499 | 4,316 (15.6%) | 285 (4.4%) |
| $2,500 to $2,999 | 1,652 (6.0%) | 116 (1.8%) |
| $3,000 or more | 1,474 (5.3%) | 251 (3.8%) |
| Total | 27,638 (100.0%) | 6,536 (100.0%) |
Physical Housing Characteristics in O Fallon
Housing Structures in O Fallon
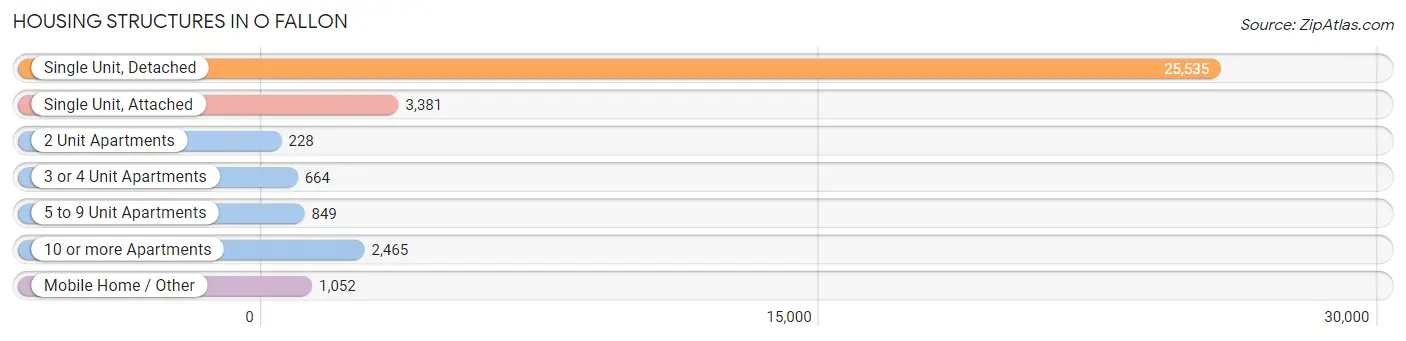
| Structure Type | # Housing Units | % Housing Units |
| Single Unit, Detached | 25,535 | 74.7% |
| Single Unit, Attached | 3,381 | 9.9% |
| 2 Unit Apartments | 228 | 0.7% |
| 3 or 4 Unit Apartments | 664 | 1.9% |
| 5 to 9 Unit Apartments | 849 | 2.5% |
| 10 or more Apartments | 2,465 | 7.2% |
| Mobile Home / Other | 1,052 | 3.1% |
| Total | 34,174 | 100.0% |
Housing Structures by Occupancy in O Fallon
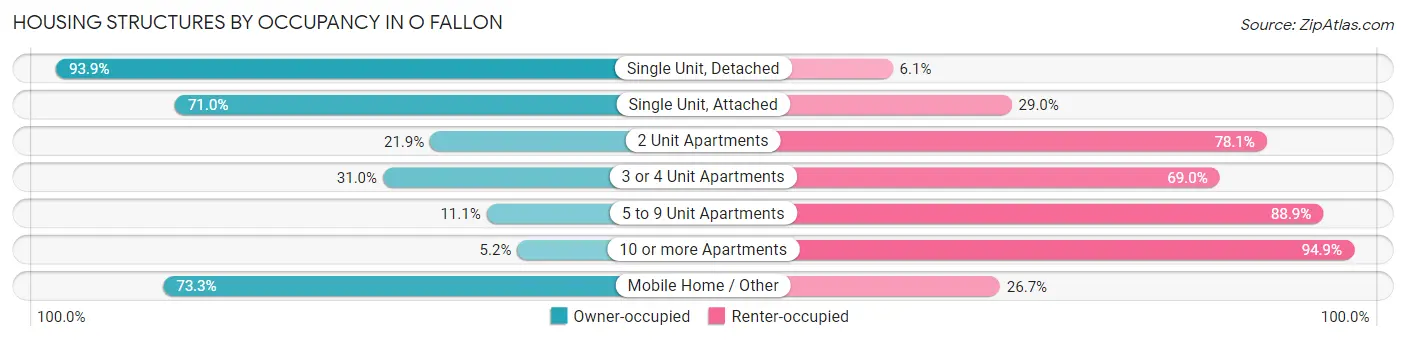
| Structure Type | Owner-occupied | Renter-occupied |
| Single Unit, Detached | 23,988 (93.9%) | 1,547 (6.1%) |
| Single Unit, Attached | 2,402 (71.0%) | 979 (29.0%) |
| 2 Unit Apartments | 50 (21.9%) | 178 (78.1%) |
| 3 or 4 Unit Apartments | 206 (31.0%) | 458 (69.0%) |
| 5 to 9 Unit Apartments | 94 (11.1%) | 755 (88.9%) |
| 10 or more Apartments | 127 (5.1%) | 2,338 (94.9%) |
| Mobile Home / Other | 771 (73.3%) | 281 (26.7%) |
| Total | 27,638 (80.9%) | 6,536 (19.1%) |
Housing Structures by Number of Rooms in O Fallon
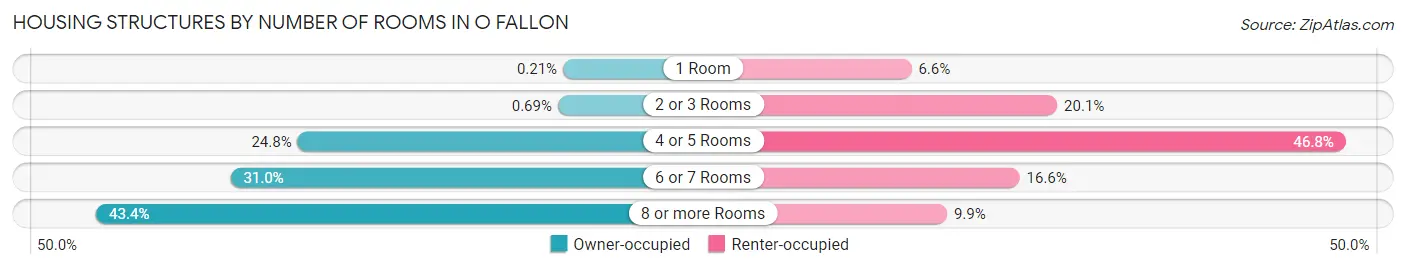
| Number of Rooms | Owner-occupied | Renter-occupied |
| 1 Room | 58 (0.2%) | 433 (6.6%) |
| 2 or 3 Rooms | 190 (0.7%) | 1,313 (20.1%) |
| 4 or 5 Rooms | 6,844 (24.8%) | 3,057 (46.8%) |
| 6 or 7 Rooms | 8,557 (31.0%) | 1,086 (16.6%) |
| 8 or more Rooms | 11,989 (43.4%) | 647 (9.9%) |
| Total | 27,638 (100.0%) | 6,536 (100.0%) |
Housing Structure by Heating Type in O Fallon
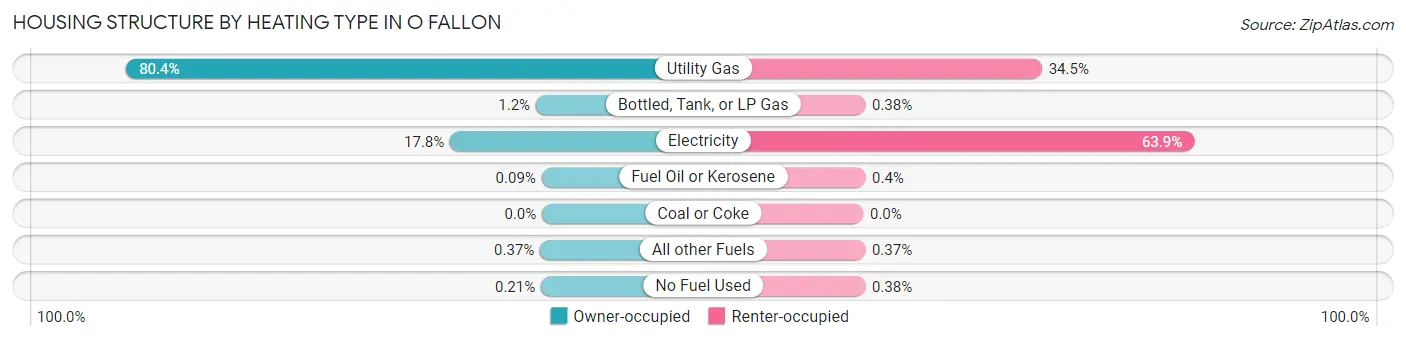
| Heating Type | Owner-occupied | Renter-occupied |
| Utility Gas | 22,206 (80.3%) | 2,257 (34.5%) |
| Bottled, Tank, or LP Gas | 332 (1.2%) | 25 (0.4%) |
| Electricity | 4,913 (17.8%) | 4,179 (63.9%) |
| Fuel Oil or Kerosene | 25 (0.1%) | 26 (0.4%) |
| Coal or Coke | 0 (0.0%) | 0 (0.0%) |
| All other Fuels | 103 (0.4%) | 24 (0.4%) |
| No Fuel Used | 59 (0.2%) | 25 (0.4%) |
| Total | 27,638 (100.0%) | 6,536 (100.0%) |
Household Vehicle Usage in O Fallon
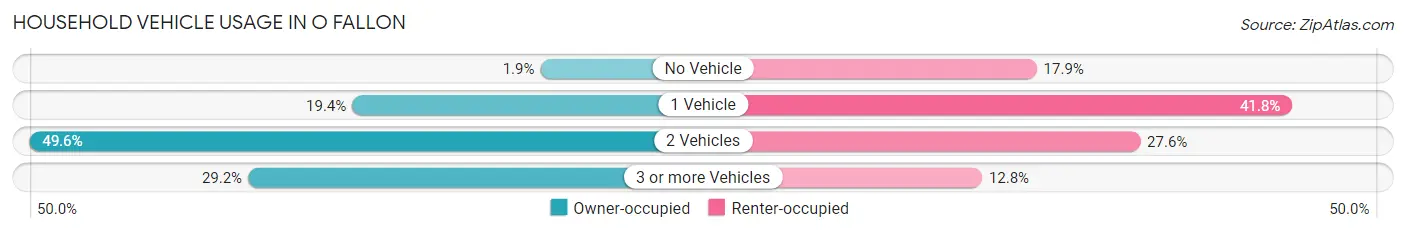
| Vehicles per Household | Owner-occupied | Renter-occupied |
| No Vehicle | 515 (1.9%) | 1,170 (17.9%) |
| 1 Vehicle | 5,370 (19.4%) | 2,729 (41.7%) |
| 2 Vehicles | 13,697 (49.6%) | 1,801 (27.6%) |
| 3 or more Vehicles | 8,056 (29.1%) | 836 (12.8%) |
| Total | 27,638 (100.0%) | 6,536 (100.0%) |
Real Estate & Mortgages in O Fallon
Real Estate and Mortgage Overview in O Fallon
| Characteristic | Without Mortgage | With Mortgage |
| Housing Units | 6,126 | 21,512 |
| Median Property Value | $279,300 | $284,600 |
| Median Household Income | $83,037 | $7,778 |
| Monthly Housing Costs | $683 | $1,474 |
| Real Estate Taxes | $3,358 | $336 |
Property Value by Mortgage Status in O Fallon
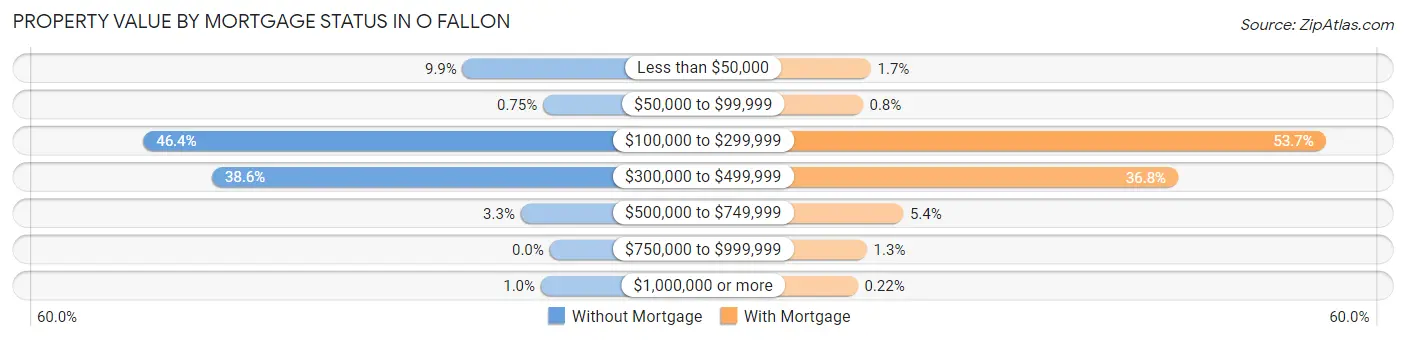
| Property Value | Without Mortgage | With Mortgage |
| Less than $50,000 | 609 (9.9%) | 370 (1.7%) |
| $50,000 to $99,999 | 46 (0.7%) | 173 (0.8%) |
| $100,000 to $299,999 | 2,844 (46.4%) | 11,555 (53.7%) |
| $300,000 to $499,999 | 2,364 (38.6%) | 7,926 (36.8%) |
| $500,000 to $749,999 | 202 (3.3%) | 1,166 (5.4%) |
| $750,000 to $999,999 | 0 (0.0%) | 274 (1.3%) |
| $1,000,000 or more | 61 (1.0%) | 48 (0.2%) |
| Total | 6,126 (100.0%) | 21,512 (100.0%) |
Household Income by Mortgage Status in O Fallon
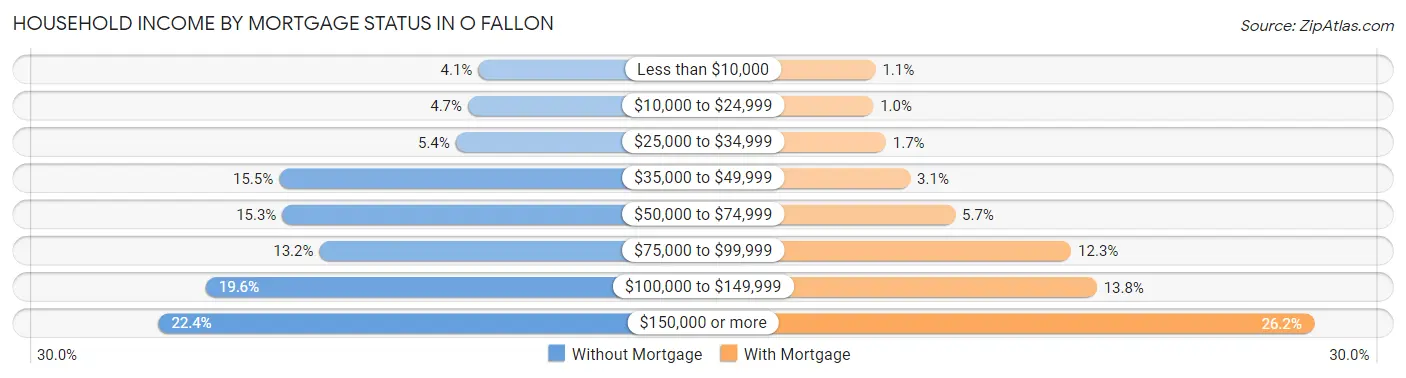
| Household Income | Without Mortgage | With Mortgage |
| Less than $10,000 | 250 (4.1%) | 245 (1.1%) |
| $10,000 to $24,999 | 286 (4.7%) | 217 (1.0%) |
| $25,000 to $34,999 | 329 (5.4%) | 373 (1.7%) |
| $35,000 to $49,999 | 947 (15.5%) | 672 (3.1%) |
| $50,000 to $74,999 | 936 (15.3%) | 1,225 (5.7%) |
| $75,000 to $99,999 | 806 (13.2%) | 2,650 (12.3%) |
| $100,000 to $149,999 | 1,203 (19.6%) | 2,965 (13.8%) |
| $150,000 or more | 1,369 (22.4%) | 5,632 (26.2%) |
| Total | 6,126 (100.0%) | 21,512 (100.0%) |
Property Value to Household Income Ratio in O Fallon
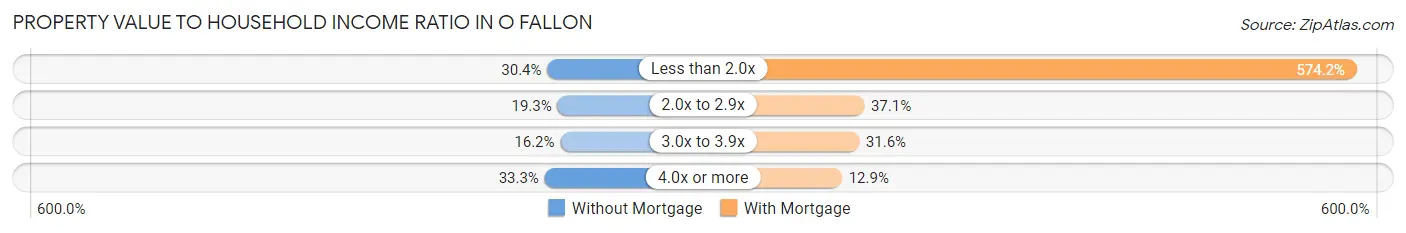
| Value-to-Income Ratio | Without Mortgage | With Mortgage |
| Less than 2.0x | 1,861 (30.4%) | 123,529 (574.2%) |
| 2.0x to 2.9x | 1,179 (19.3%) | 7,987 (37.1%) |
| 3.0x to 3.9x | 991 (16.2%) | 6,794 (31.6%) |
| 4.0x or more | 2,038 (33.3%) | 2,768 (12.9%) |
| Total | 6,126 (100.0%) | 21,512 (100.0%) |
Real Estate Taxes by Mortgage Status in O Fallon

| Property Taxes | Without Mortgage | With Mortgage |
| Less than $800 | 356 (5.8%) | 33 (0.2%) |
| $800 to $1,499 | 240 (3.9%) | 313 (1.5%) |
| $800 to $1,499 | 5,193 (84.8%) | 1,154 (5.4%) |
| Total | 6,126 (100.0%) | 21,512 (100.0%) |
Health & Disability in O Fallon
Health Insurance Coverage by Age in O Fallon
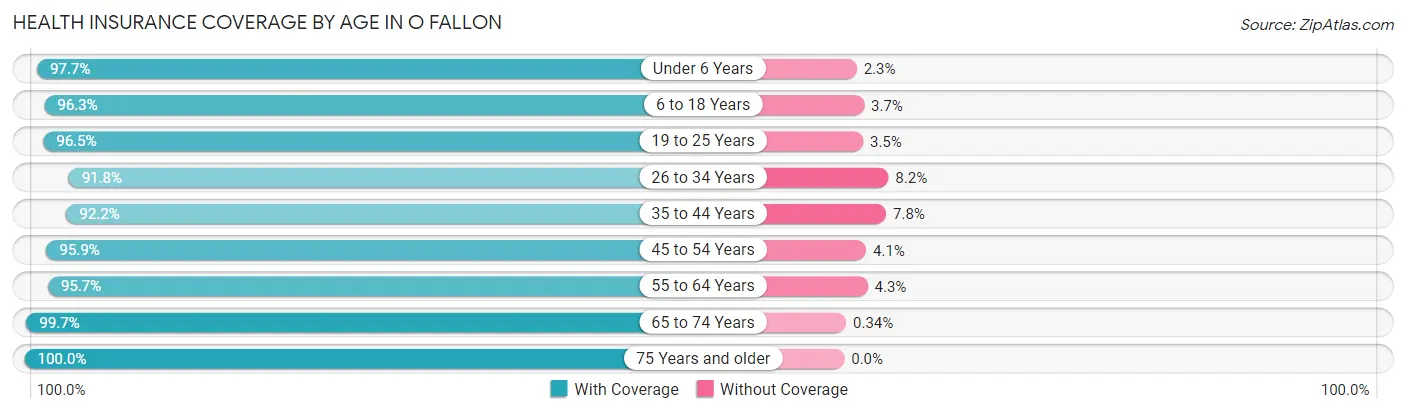
| Age Bracket | With Coverage | Without Coverage |
| Under 6 Years | 7,250 (97.7%) | 172 (2.3%) |
| 6 to 18 Years | 16,142 (96.3%) | 619 (3.7%) |
| 19 to 25 Years | 5,958 (96.5%) | 216 (3.5%) |
| 26 to 34 Years | 10,421 (91.8%) | 935 (8.2%) |
| 35 to 44 Years | 11,803 (92.2%) | 998 (7.8%) |
| 45 to 54 Years | 12,608 (95.9%) | 535 (4.1%) |
| 55 to 64 Years | 11,388 (95.7%) | 517 (4.3%) |
| 65 to 74 Years | 6,972 (99.7%) | 24 (0.3%) |
| 75 Years and older | 4,903 (100.0%) | 0 (0.0%) |
| Total | 87,445 (95.6%) | 4,016 (4.4%) |
Health Insurance Coverage by Citizenship Status in O Fallon
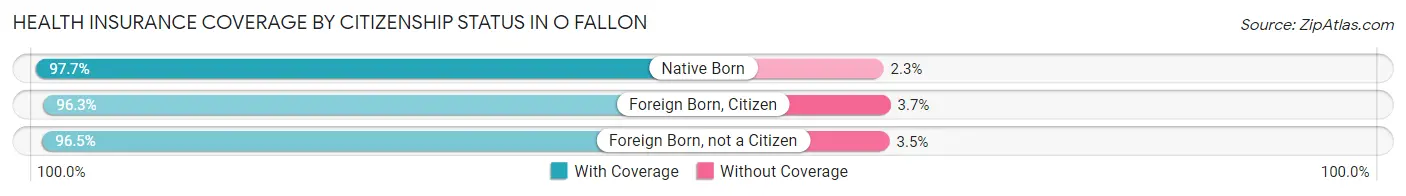
| Citizenship Status | With Coverage | Without Coverage |
| Native Born | 7,250 (97.7%) | 172 (2.3%) |
| Foreign Born, Citizen | 16,142 (96.3%) | 619 (3.7%) |
| Foreign Born, not a Citizen | 5,958 (96.5%) | 216 (3.5%) |
Health Insurance Coverage by Household Income in O Fallon
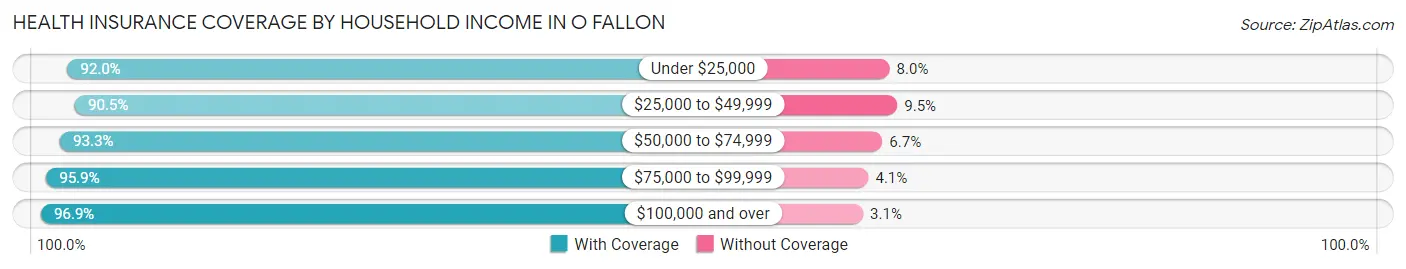
| Household Income | With Coverage | Without Coverage |
| Under $25,000 | 3,332 (92.0%) | 291 (8.0%) |
| $25,000 to $49,999 | 8,025 (90.5%) | 839 (9.5%) |
| $50,000 to $74,999 | 8,865 (93.3%) | 634 (6.7%) |
| $75,000 to $99,999 | 11,391 (95.9%) | 483 (4.1%) |
| $100,000 and over | 55,766 (96.9%) | 1,765 (3.1%) |
Public vs Private Health Insurance Coverage by Age in O Fallon
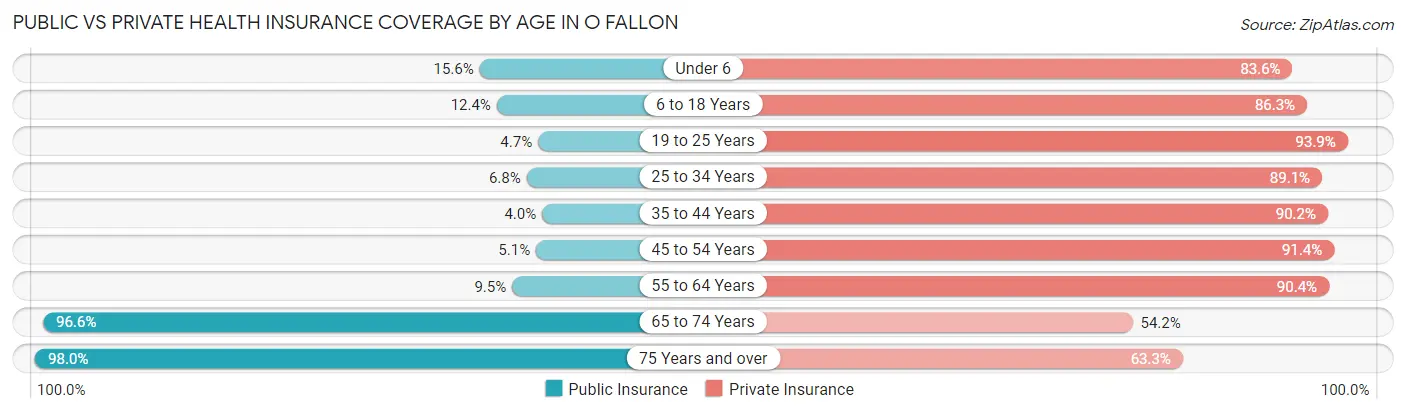
| Age Bracket | Public Insurance | Private Insurance |
| Under 6 | 1,155 (15.6%) | 6,208 (83.6%) |
| 6 to 18 Years | 2,074 (12.4%) | 14,469 (86.3%) |
| 19 to 25 Years | 291 (4.7%) | 5,796 (93.9%) |
| 25 to 34 Years | 776 (6.8%) | 10,119 (89.1%) |
| 35 to 44 Years | 505 (4.0%) | 11,547 (90.2%) |
| 45 to 54 Years | 668 (5.1%) | 12,009 (91.4%) |
| 55 to 64 Years | 1,135 (9.5%) | 10,763 (90.4%) |
| 65 to 74 Years | 6,756 (96.6%) | 3,788 (54.1%) |
| 75 Years and over | 4,807 (98.0%) | 3,102 (63.3%) |
| Total | 18,167 (19.9%) | 77,801 (85.1%) |
Disability Status by Sex by Age in O Fallon
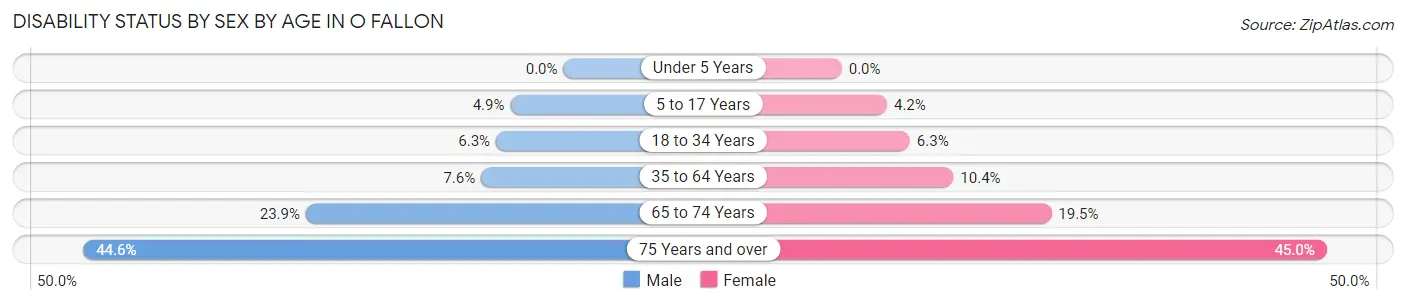
| Age Bracket | Male | Female |
| Under 5 Years | 0 (0.0%) | 0 (0.0%) |
| 5 to 17 Years | 413 (4.9%) | 353 (4.2%) |
| 18 to 34 Years | 573 (6.3%) | 611 (6.3%) |
| 35 to 64 Years | 1,446 (7.6%) | 1,960 (10.4%) |
| 65 to 74 Years | 748 (23.9%) | 752 (19.5%) |
| 75 Years and over | 852 (44.6%) | 1,346 (45.0%) |
Disability Class by Sex by Age in O Fallon
Disability Class: Hearing Difficulty
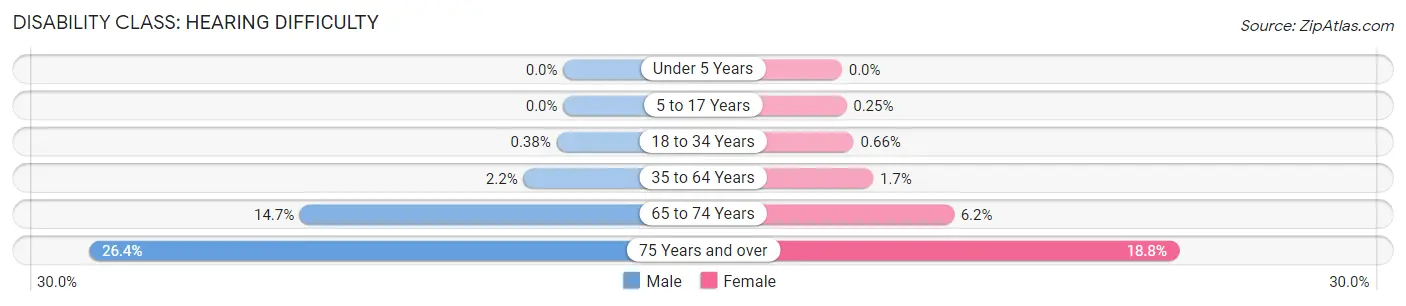
| Age Bracket | Male | Female |
| Under 5 Years | 0 (0.0%) | 0 (0.0%) |
| 5 to 17 Years | 0 (0.0%) | 21 (0.3%) |
| 18 to 34 Years | 35 (0.4%) | 64 (0.7%) |
| 35 to 64 Years | 420 (2.2%) | 330 (1.7%) |
| 65 to 74 Years | 459 (14.7%) | 241 (6.2%) |
| 75 Years and over | 505 (26.4%) | 561 (18.8%) |
Disability Class: Vision Difficulty
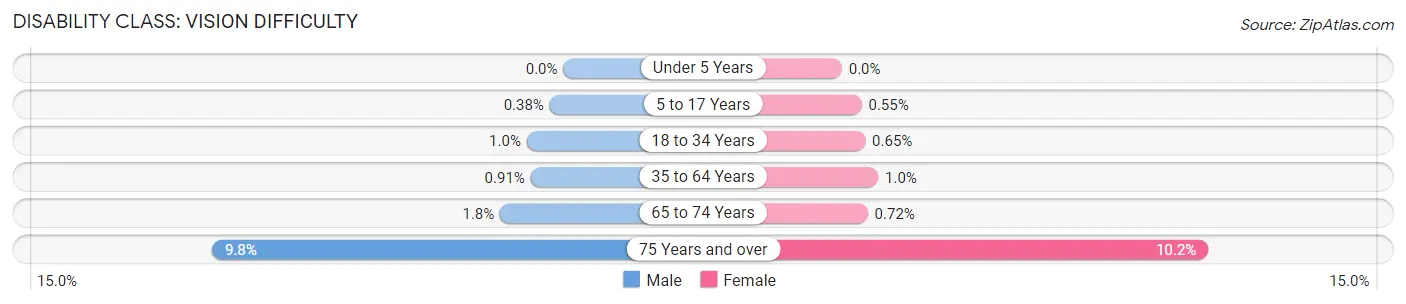
| Age Bracket | Male | Female |
| Under 5 Years | 0 (0.0%) | 0 (0.0%) |
| 5 to 17 Years | 32 (0.4%) | 46 (0.5%) |
| 18 to 34 Years | 93 (1.0%) | 63 (0.6%) |
| 35 to 64 Years | 172 (0.9%) | 192 (1.0%) |
| 65 to 74 Years | 55 (1.8%) | 28 (0.7%) |
| 75 Years and over | 187 (9.8%) | 305 (10.2%) |
Disability Class: Cognitive Difficulty
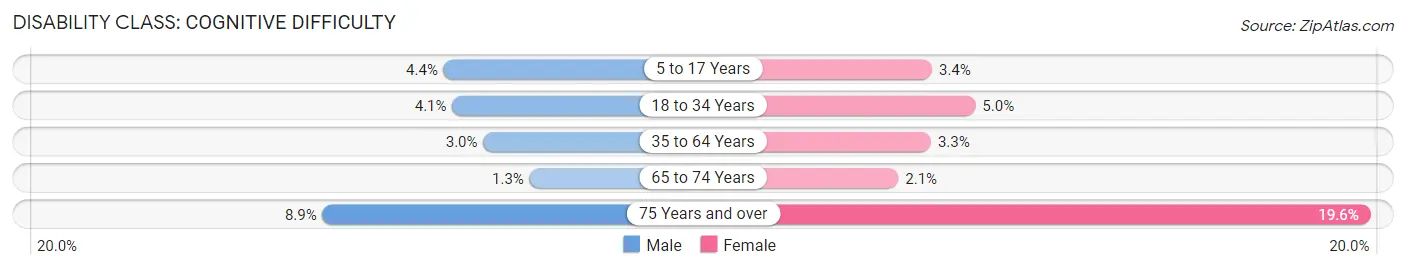
| Age Bracket | Male | Female |
| 5 to 17 Years | 373 (4.4%) | 282 (3.4%) |
| 18 to 34 Years | 377 (4.1%) | 479 (5.0%) |
| 35 to 64 Years | 562 (3.0%) | 626 (3.3%) |
| 65 to 74 Years | 39 (1.3%) | 81 (2.1%) |
| 75 Years and over | 171 (8.9%) | 587 (19.6%) |
Disability Class: Ambulatory Difficulty
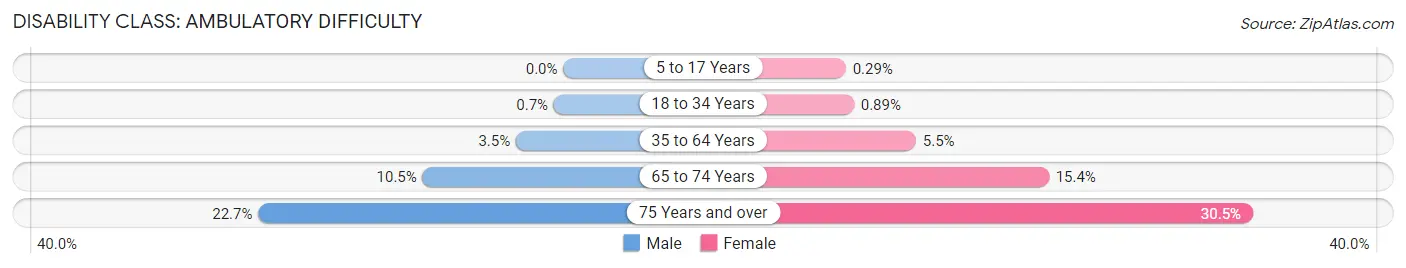
| Age Bracket | Male | Female |
| 5 to 17 Years | 0 (0.0%) | 24 (0.3%) |
| 18 to 34 Years | 64 (0.7%) | 86 (0.9%) |
| 35 to 64 Years | 665 (3.5%) | 1,041 (5.5%) |
| 65 to 74 Years | 327 (10.4%) | 594 (15.4%) |
| 75 Years and over | 433 (22.7%) | 913 (30.5%) |
Disability Class: Self-Care Difficulty
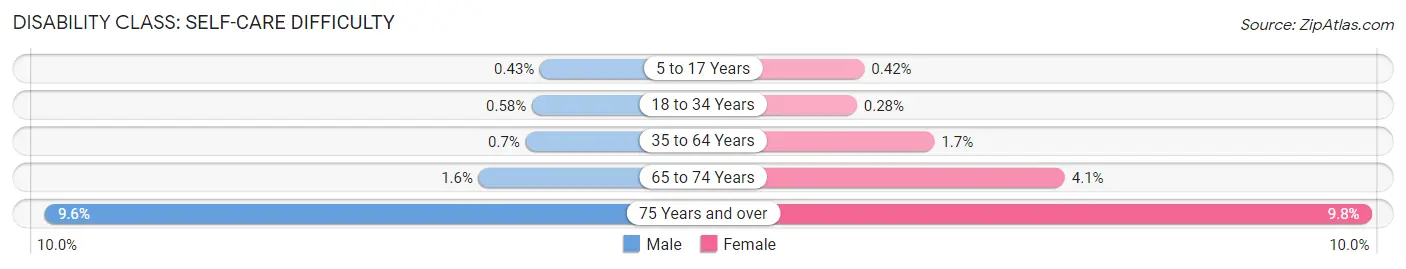
| Age Bracket | Male | Female |
| 5 to 17 Years | 36 (0.4%) | 35 (0.4%) |
| 18 to 34 Years | 53 (0.6%) | 27 (0.3%) |
| 35 to 64 Years | 132 (0.7%) | 325 (1.7%) |
| 65 to 74 Years | 49 (1.6%) | 160 (4.1%) |
| 75 Years and over | 184 (9.6%) | 294 (9.8%) |
Technology Access in O Fallon
Computing Device Access in O Fallon
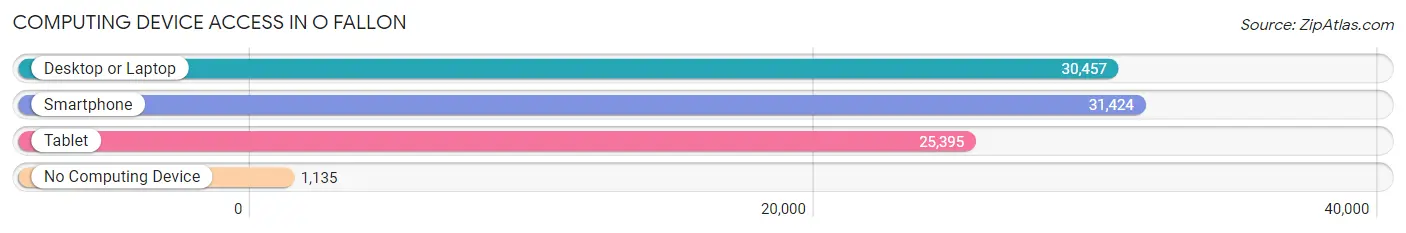
| Device Type | # Households | % Households |
| Desktop or Laptop | 30,457 | 89.1% |
| Smartphone | 31,424 | 91.9% |
| Tablet | 25,395 | 74.3% |
| No Computing Device | 1,135 | 3.3% |
| Total | 34,174 | 100.0% |
Internet Access in O Fallon
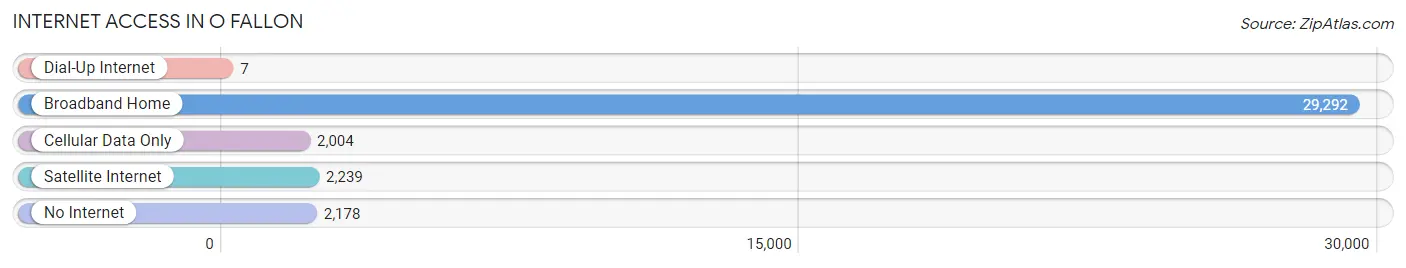
| Internet Type | # Households | % Households |
| Dial-Up Internet | 7 | 0.0% |
| Broadband Home | 29,292 | 85.7% |
| Cellular Data Only | 2,004 | 5.9% |
| Satellite Internet | 2,239 | 6.6% |
| No Internet | 2,178 | 6.4% |
| Total | 34,174 | 100.0% |
O Fallon Summary
OFallon, Missouri is a city located in St. Charles County, Missouri, United States. It is part of the St. Louis metropolitan area. The population was 79,329 at the 2010 census, making it the largest city in St. Charles County and the seventh largest in the state of Missouri.
History
OFallon was founded in 1856 by German immigrants who named the city after a prominent local family, the O’Fallons. The city was originally a farming community, but it quickly grew into a bustling industrial center. The city was incorporated in 1874 and has since grown to become one of the largest cities in the St. Louis metropolitan area.
Geography
OFallon is located in St. Charles County, Missouri, about 25 miles west of downtown St. Louis. The city is situated on the Missouri River and is bordered by the cities of St. Peters, St. Charles, and Wentzville. The city covers an area of approximately 33 square miles and has a population density of 2,400 people per square mile.
Economy
OFallon’s economy is largely based on manufacturing and retail. The city is home to several large companies, including MasterCard, Boeing, and Express Scripts. The city also has a thriving retail sector, with several large shopping centers and malls. The city is also home to several large medical centers, including St. Luke’s Hospital and Mercy Hospital.
Demographics
As of the 2010 census, OFallon had a population of 79,329. The racial makeup of the city was 79.2% White, 11.3% African American, 0.4% Native American, 3.2% Asian, 0.1% Pacific Islander, and 4.8% from other races. The median household income was $63,945 and the median family income was $76,945. The per capita income was $30,945.
OFallon is a diverse city with a variety of cultures and backgrounds. The city is home to a large number of immigrants from around the world, including Mexico, India, China, and the Philippines. The city also has a large population of military personnel, as it is home to the Scott Air Force Base.
Conclusion
OFallon, Missouri is a vibrant city located in St. Charles County, Missouri. The city has a rich history and a diverse population. The city’s economy is largely based on manufacturing and retail, and it is home to several large companies and medical centers. The city is also home to a large number of immigrants from around the world, as well as a large population of military personnel. OFallon is a great place to live and work, and it is sure to continue to grow and thrive in the years to come.
Common Questions
What is Per Capita Income in O Fallon?
Per Capita income in O Fallon is $45,938.
What is the Median Family Income in O Fallon?
Median Family Income in O Fallon is $122,413.
What is the Median Household income in O Fallon?
Median Household Income in O Fallon is $104,863.
What is Income or Wage Gap in O Fallon?
Income or Wage Gap in O Fallon is 31.6%.
Women in O Fallon earn 68.4 cents for every dollar earned by a man.
What is Family Income Deficit in O Fallon?
Family Income Deficit in O Fallon is $9,192.
Families that are below poverty line in O Fallon earn $9,192 less on average than the poverty threshold level.
What is Inequality or Gini Index in O Fallon?
Inequality or Gini Index in O Fallon is 0.38.
What is the Total Population of O Fallon?
Total Population of O Fallon is 91,825.
What is the Total Male Population of O Fallon?
Total Male Population of O Fallon is 44,962.
What is the Total Female Population of O Fallon?
Total Female Population of O Fallon is 46,863.
What is the Ratio of Males per 100 Females in O Fallon?
There are 95.94 Males per 100 Females in O Fallon.
What is the Ratio of Females per 100 Males in O Fallon?
There are 104.23 Females per 100 Males in O Fallon.
What is the Median Population Age in O Fallon?
Median Population Age in O Fallon is 38.0 Years.
What is the Average Family Size in O Fallon
Average Family Size in O Fallon is 3.1 People.
What is the Average Household Size in O Fallon
Average Household Size in O Fallon is 2.7 People.
How Large is the Labor Force in O Fallon?
There are 52,380 People in the Labor Forcein in O Fallon.
What is the Percentage of People in the Labor Force in O Fallon?
73.0% of People are in the Labor Force in O Fallon.
What is the Unemployment Rate in O Fallon?
Unemployment Rate in O Fallon is 3.1%.