Leisure Lake, MO Map & Demographics
Leisure Lake Map
Leisure Lake Overview
$27,541
PER CAPITA INCOME
$93,611
AVG FAMILY INCOME
$14,261
AVG HOUSEHOLD INCOME
73.6%
WAGE / INCOME GAP [ % ]
26.4¢/ $1
WAGE / INCOME GAP [ $ ]
0.54
INEQUALITY / GINI INDEX
199
TOTAL POPULATION
62
MALE POPULATION
137
FEMALE POPULATION
45.26
MALES / 100 FEMALES
220.97
FEMALES / 100 MALES
33.5
MEDIAN AGE
2.6
AVG FAMILY SIZE
1.4
AVG HOUSEHOLD SIZE
169
LABOR FORCE [ PEOPLE ]
98.3%
PERCENT IN LABOR FORCE
Income in Leisure Lake
Income Overview in Leisure Lake
Per Capita Income in Leisure Lake is $27,541, while median incomes of families and households are $93,611 and $14,261 respectively.
| Characteristic | Number | Measure |
| Per Capita Income | 199 | $27,541 |
| Median Family Income | 34 | $93,611 |
| Mean Family Income | 34 | $114,891 |
| Median Household Income | 141 | $14,261 |
| Mean Household Income | 141 | $39,942 |
| Income Deficit | 34 | $0 |
| Wage / Income Gap (%) | 199 | 73.64% |
| Wage / Income Gap ($) | 199 | 26.36¢ per $1 |
| Gini / Inequality Index | 199 | 0.54 |
Earnings by Sex in Leisure Lake
Average Earnings in Leisure Lake are $11,844, $43,281 for men and $11,411 for women, a difference of 73.6%.
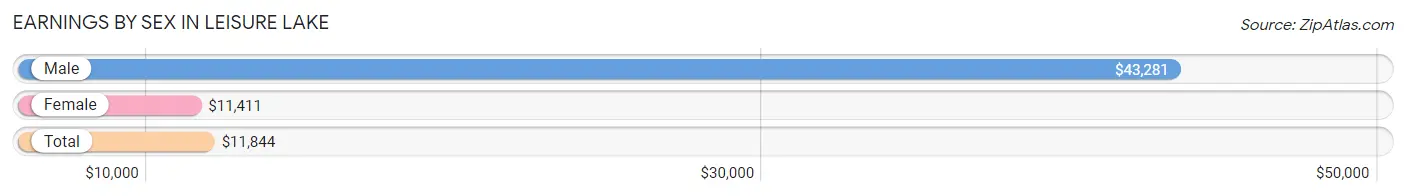
| Sex | Number | Average Earnings |
| Male | 35 (20.7%) | $43,281 |
| Female | 134 (79.3%) | $11,411 |
| Total | 169 (100.0%) | $11,844 |
Earnings by Sex by Income Bracket in Leisure Lake
The most common earnings brackets in Leisure Lake are $40,000 to $44,999 for men (12 | 34.3%) and $10,000 to $12,499 for women (101 | 75.4%).
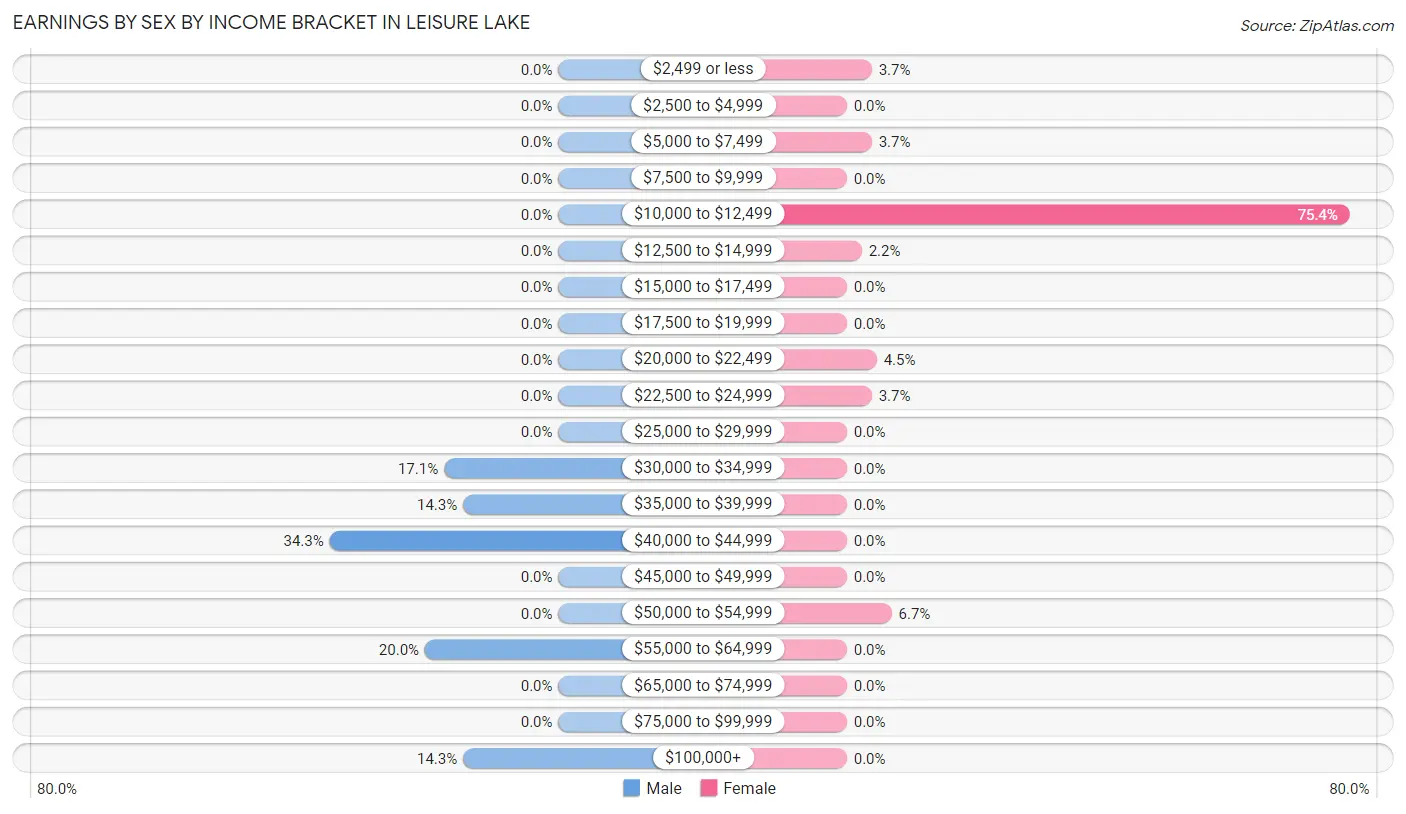
| Income | Male | Female |
| $2,499 or less | 0 (0.0%) | 5 (3.7%) |
| $2,500 to $4,999 | 0 (0.0%) | 0 (0.0%) |
| $5,000 to $7,499 | 0 (0.0%) | 5 (3.7%) |
| $7,500 to $9,999 | 0 (0.0%) | 0 (0.0%) |
| $10,000 to $12,499 | 0 (0.0%) | 101 (75.4%) |
| $12,500 to $14,999 | 0 (0.0%) | 3 (2.2%) |
| $15,000 to $17,499 | 0 (0.0%) | 0 (0.0%) |
| $17,500 to $19,999 | 0 (0.0%) | 0 (0.0%) |
| $20,000 to $22,499 | 0 (0.0%) | 6 (4.5%) |
| $22,500 to $24,999 | 0 (0.0%) | 5 (3.7%) |
| $25,000 to $29,999 | 0 (0.0%) | 0 (0.0%) |
| $30,000 to $34,999 | 6 (17.1%) | 0 (0.0%) |
| $35,000 to $39,999 | 5 (14.3%) | 0 (0.0%) |
| $40,000 to $44,999 | 12 (34.3%) | 0 (0.0%) |
| $45,000 to $49,999 | 0 (0.0%) | 0 (0.0%) |
| $50,000 to $54,999 | 0 (0.0%) | 9 (6.7%) |
| $55,000 to $64,999 | 7 (20.0%) | 0 (0.0%) |
| $65,000 to $74,999 | 0 (0.0%) | 0 (0.0%) |
| $75,000 to $99,999 | 0 (0.0%) | 0 (0.0%) |
| $100,000+ | 5 (14.3%) | 0 (0.0%) |
| Total | 35 (100.0%) | 134 (100.0%) |
Earnings by Sex by Educational Attainment in Leisure Lake
Average earnings in Leisure Lake are $43,281 for men and $11,411 for women, a difference of 73.6%. Men with an educational attainment of high school diploma enjoy the highest average annual earnings of $55,357, while those with high school diploma education earn the least with $55,357. Women with an educational attainment of high school diploma earn the most with the average annual earnings of $14,167, while those with less than high school education have the smallest earnings of $11,188.
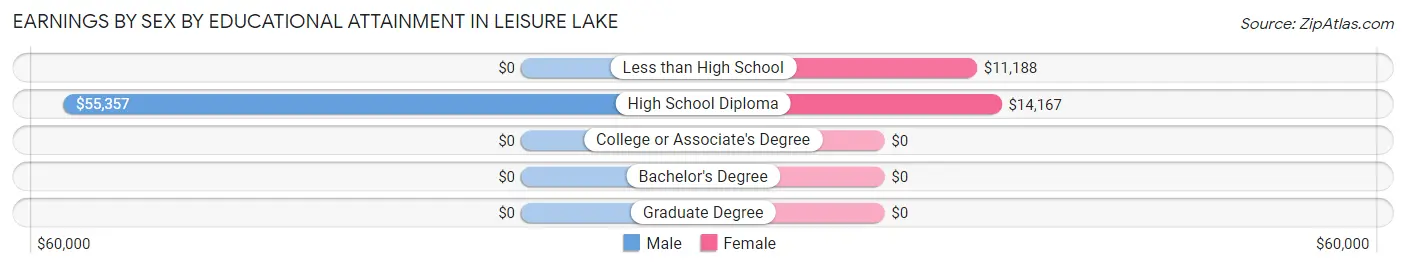
| Educational Attainment | Male Income | Female Income |
| Less than High School | - | - |
| High School Diploma | $55,357 | $14,167 |
| College or Associate's Degree | - | - |
| Bachelor's Degree | - | - |
| Graduate Degree | - | - |
| Total | $43,281 | $11,411 |
Family Income in Leisure Lake
Family Income Brackets in Leisure Lake
According to the Leisure Lake family income data, there are 13 families falling into the $50,000 to $74,999 income range, which is the most common income bracket and makes up 38.2% of all families.
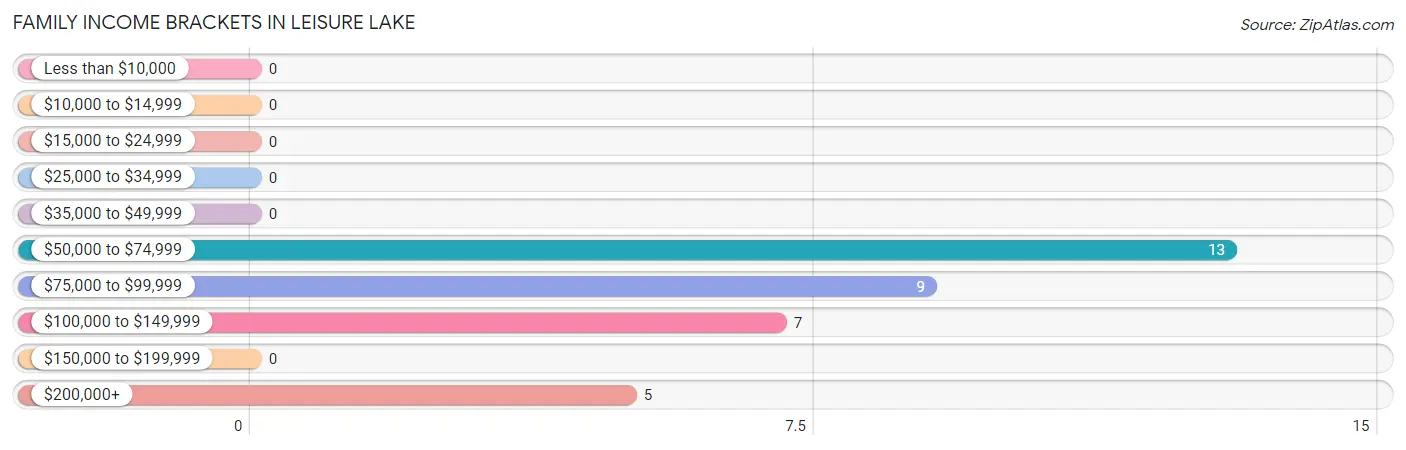
| Income Bracket | # Families | % Families |
| Less than $10,000 | 0 | 0.0% |
| $10,000 to $14,999 | 0 | 0.0% |
| $15,000 to $24,999 | 0 | 0.0% |
| $25,000 to $34,999 | 0 | 0.0% |
| $35,000 to $49,999 | 0 | 0.0% |
| $50,000 to $74,999 | 13 | 38.2% |
| $75,000 to $99,999 | 9 | 26.5% |
| $100,000 to $149,999 | 7 | 20.6% |
| $150,000 to $199,999 | 0 | 0.0% |
| $200,000+ | 5 | 14.7% |
Family Income by Famaliy Size in Leisure Lake
2-person families (26 | 76.5%) account for the highest median family income in Leisure Lake with $94,722 per family, while 2-person families (26 | 76.5%) have the highest median income of $47,361 per family member.
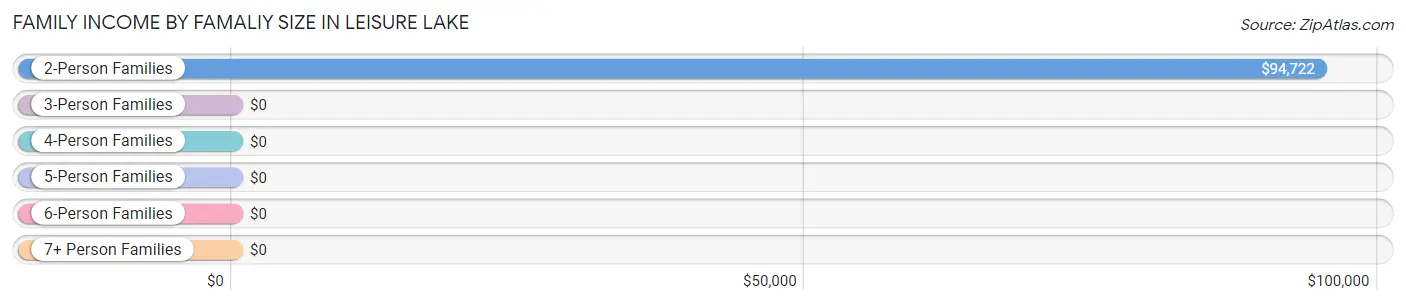
| Income Bracket | # Families | Median Income |
| 2-Person Families | 26 (76.5%) | $94,722 |
| 3-Person Families | 0 (0.0%) | $0 |
| 4-Person Families | 0 (0.0%) | $0 |
| 5-Person Families | 8 (23.5%) | $0 |
| 6-Person Families | 0 (0.0%) | $0 |
| 7+ Person Families | 0 (0.0%) | $0 |
| Total | 34 (100.0%) | $93,611 |
Family Income by Number of Earners in Leisure Lake
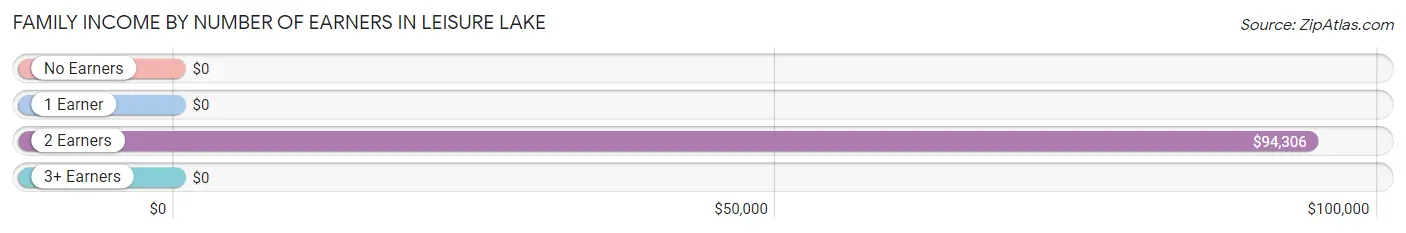
| Number of Earners | # Families | Median Income |
| No Earners | 0 (0.0%) | $0 |
| 1 Earner | 5 (14.7%) | $0 |
| 2 Earners | 29 (85.3%) | $94,306 |
| 3+ Earners | 0 (0.0%) | $0 |
| Total | 34 (100.0%) | $93,611 |
Household Income in Leisure Lake
Household Income Brackets in Leisure Lake
With 93 households falling in the category, the $10,000 to $14,999 income range is the most frequent in Leisure Lake, accounting for 66.0% of all households.
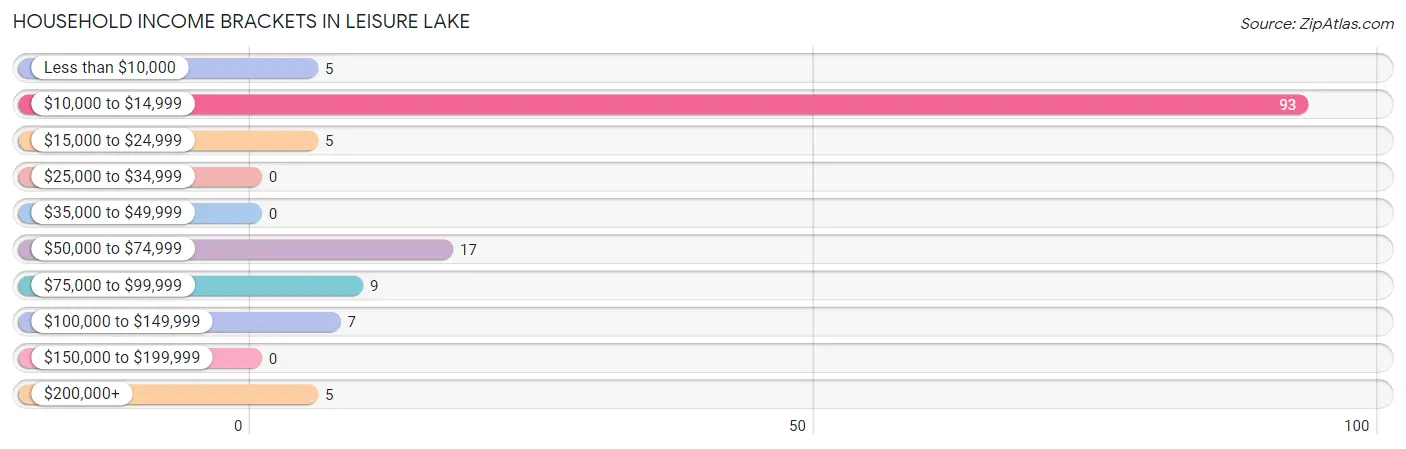
| Income Bracket | # Households | % Households |
| Less than $10,000 | 5 | 3.5% |
| $10,000 to $14,999 | 93 | 66.0% |
| $15,000 to $24,999 | 5 | 3.5% |
| $25,000 to $34,999 | 0 | 0.0% |
| $35,000 to $49,999 | 0 | 0.0% |
| $50,000 to $74,999 | 17 | 12.1% |
| $75,000 to $99,999 | 9 | 6.4% |
| $100,000 to $149,999 | 7 | 5.0% |
| $150,000 to $199,999 | 0 | 0.0% |
| $200,000+ | 5 | 3.5% |
Household Income by Householder Age in Leisure Lake
The median household income in Leisure Lake is $14,261, with the highest median household income of $13,978 found in the 25 to 44 years age bracket for the primary householder. A total of 110 households (78.0%) fall into this category.
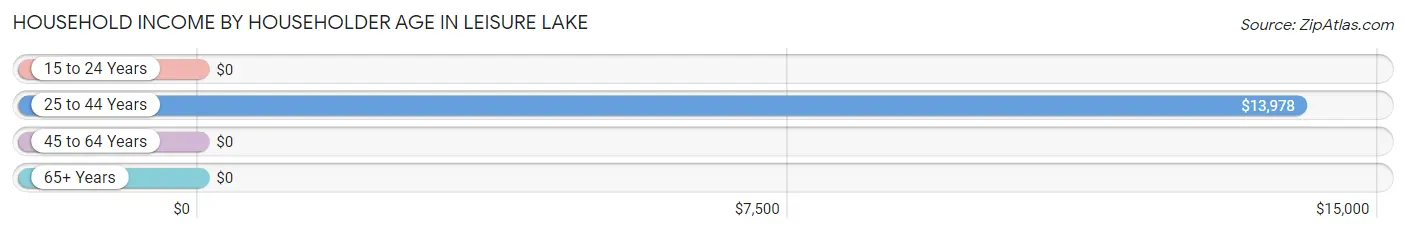
| Income Bracket | # Households | Median Income |
| 15 to 24 Years | 0 (0.0%) | $0 |
| 25 to 44 Years | 110 (78.0%) | $13,978 |
| 45 to 64 Years | 19 (13.5%) | $0 |
| 65+ Years | 12 (8.5%) | $0 |
| Total | 141 (100.0%) | $14,261 |
Poverty in Leisure Lake
Income Below Poverty by Sex and Age in Leisure Lake
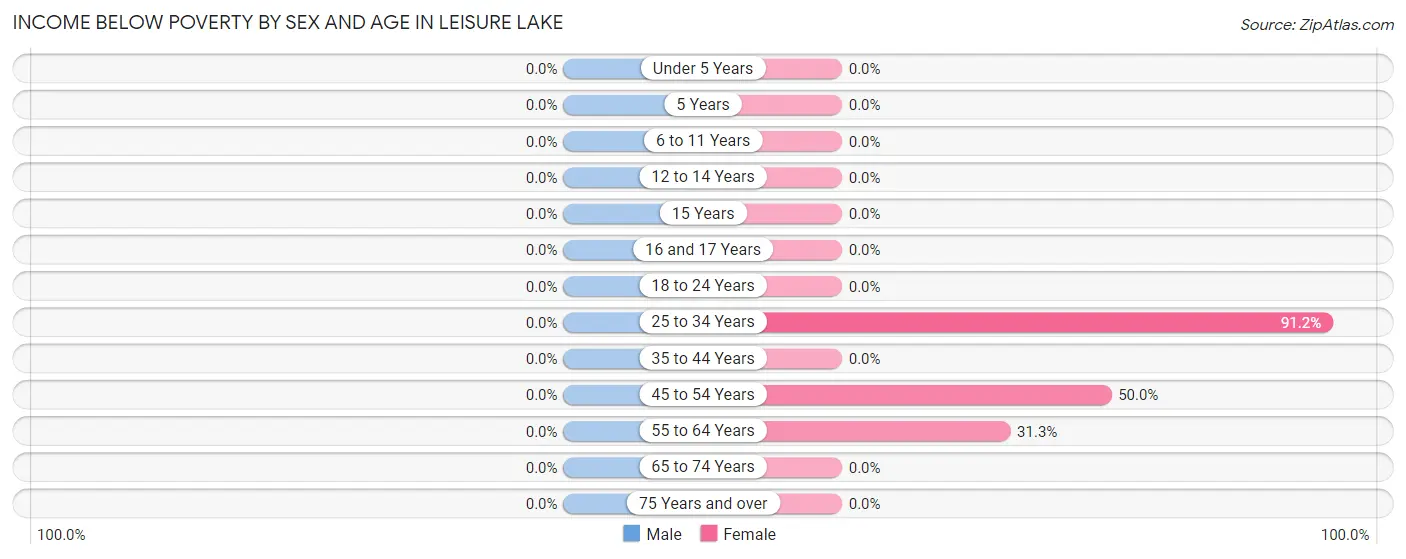
| Age Bracket | Male | Female |
| Under 5 Years | 0 (0.0%) | 0 (0.0%) |
| 5 Years | 0 (0.0%) | 0 (0.0%) |
| 6 to 11 Years | 0 (0.0%) | 0 (0.0%) |
| 12 to 14 Years | 0 (0.0%) | 0 (0.0%) |
| 15 Years | 0 (0.0%) | 0 (0.0%) |
| 16 and 17 Years | 0 (0.0%) | 0 (0.0%) |
| 18 to 24 Years | 0 (0.0%) | 0 (0.0%) |
| 25 to 34 Years | 0 (0.0%) | 93 (91.2%) |
| 35 to 44 Years | 0 (0.0%) | 0 (0.0%) |
| 45 to 54 Years | 0 (0.0%) | 3 (50.0%) |
| 55 to 64 Years | 0 (0.0%) | 5 (31.2%) |
| 65 to 74 Years | 0 (0.0%) | 0 (0.0%) |
| 75 Years and over | 0 (0.0%) | 0 (0.0%) |
| Total | 0 (0.0%) | 101 (73.7%) |
Income Above Poverty by Sex and Age in Leisure Lake
According to the poverty statistics in Leisure Lake, males aged under 5 years and females aged 35 to 44 years are the age groups that are most secure financially, with 100.0% of males and 100.0% of females in these age groups living above the poverty line.
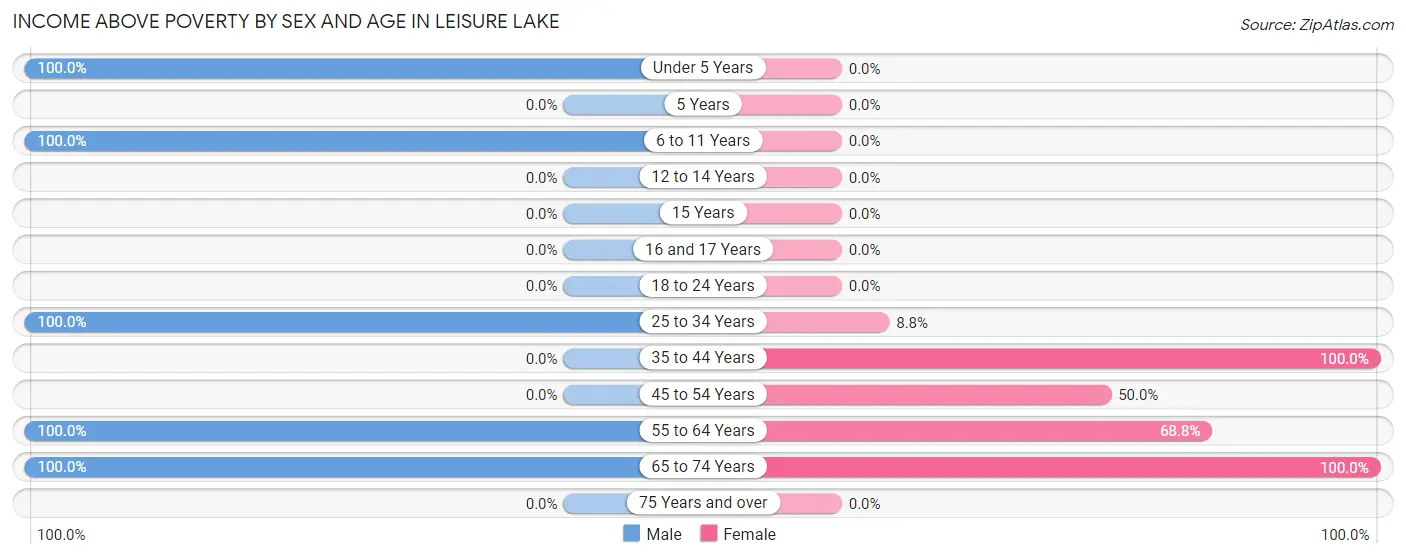
| Age Bracket | Male | Female |
| Under 5 Years | 9 (100.0%) | 0 (0.0%) |
| 5 Years | 0 (0.0%) | 0 (0.0%) |
| 6 to 11 Years | 18 (100.0%) | 0 (0.0%) |
| 12 to 14 Years | 0 (0.0%) | 0 (0.0%) |
| 15 Years | 0 (0.0%) | 0 (0.0%) |
| 16 and 17 Years | 0 (0.0%) | 0 (0.0%) |
| 18 to 24 Years | 0 (0.0%) | 0 (0.0%) |
| 25 to 34 Years | 14 (100.0%) | 9 (8.8%) |
| 35 to 44 Years | 0 (0.0%) | 8 (100.0%) |
| 45 to 54 Years | 0 (0.0%) | 3 (50.0%) |
| 55 to 64 Years | 14 (100.0%) | 11 (68.8%) |
| 65 to 74 Years | 7 (100.0%) | 5 (100.0%) |
| 75 Years and over | 0 (0.0%) | 0 (0.0%) |
| Total | 62 (100.0%) | 36 (26.3%) |
Income Below Poverty Among Married-Couple Families in Leisure Lake
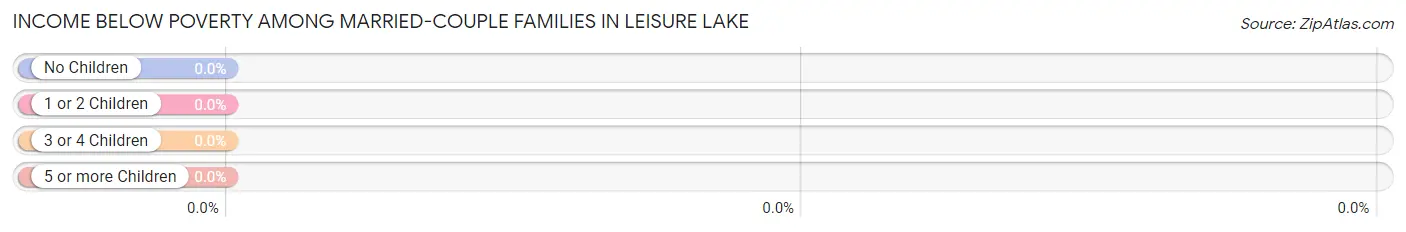
| Children | Above Poverty | Below Poverty |
| No Children | 26 (100.0%) | 0 (0.0%) |
| 1 or 2 Children | 0 (0.0%) | 0 (0.0%) |
| 3 or 4 Children | 8 (100.0%) | 0 (0.0%) |
| 5 or more Children | 0 (0.0%) | 0 (0.0%) |
| Total | 34 (100.0%) | 0 (0.0%) |
Income Below Poverty Among Single-Parent Households in Leisure Lake
| Children | Single Father | Single Mother |
| No Children | 0 (0.0%) | 0 (0.0%) |
| 1 or 2 Children | 0 (0.0%) | 0 (0.0%) |
| 3 or 4 Children | 0 (0.0%) | 0 (0.0%) |
| 5 or more Children | 0 (0.0%) | 0 (0.0%) |
| Total | 0 (0.0%) | 0 (0.0%) |
Income Below Poverty Among Married-Couple vs Single-Parent Households in Leisure Lake
| Children | Married-Couple Families | Single-Parent Households |
| No Children | 0 (0.0%) | 0 (0.0%) |
| 1 or 2 Children | 0 (0.0%) | 0 (0.0%) |
| 3 or 4 Children | 0 (0.0%) | 0 (0.0%) |
| 5 or more Children | 0 (0.0%) | 0 (0.0%) |
| Total | 0 (0.0%) | 0 (0.0%) |
Race in Leisure Lake
The most populous races in Leisure Lake are , and White / Caucasian (199 | 100.0%).
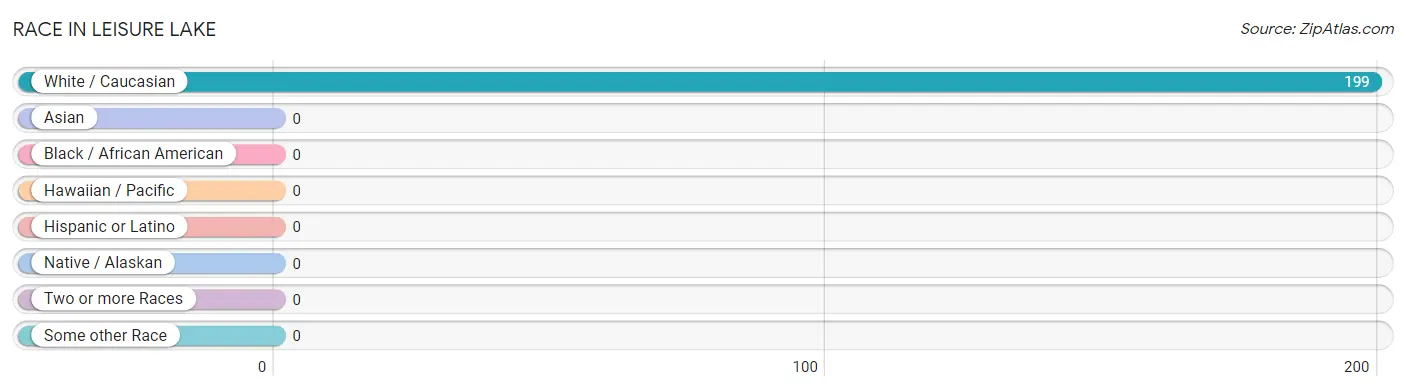
| Race | # Population | % Population |
| Asian | 0 | 0.0% |
| Black / African American | 0 | 0.0% |
| Hawaiian / Pacific | 0 | 0.0% |
| Hispanic or Latino | 0 | 0.0% |
| Native / Alaskan | 0 | 0.0% |
| White / Caucasian | 199 | 100.0% |
| Two or more Races | 0 | 0.0% |
| Some other Race | 0 | 0.0% |
| Total | 199 | 100.0% |
Ancestry in Leisure Lake
The most populous ancestries reported in Leisure Lake are German (27 | 13.6%), Irish (11 | 5.5%), French Canadian (5 | 2.5%), and Scotch-Irish (5 | 2.5%), together accounting for 24.1% of all Leisure Lake residents.
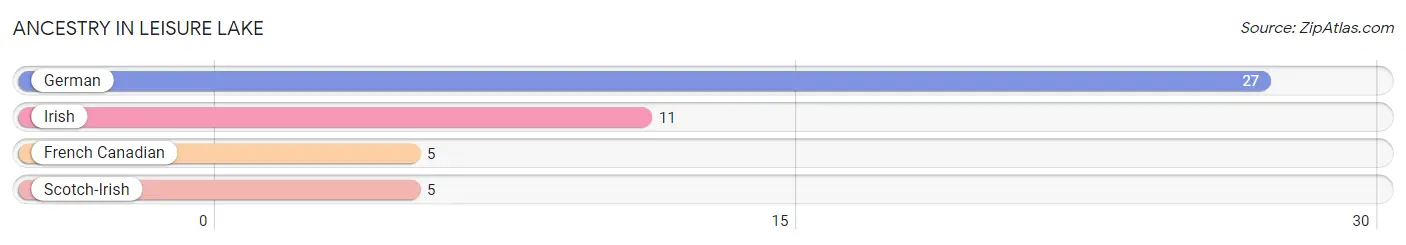
| Ancestry | # Population | % Population |
| French Canadian | 5 | 2.5% |
| German | 27 | 13.6% |
| Irish | 11 | 5.5% |
| Scotch-Irish | 5 | 2.5% | View All 4 Rows |
Immigrants in Leisure Lake

| Immigration Origin | # Population | % Population | View All 0 Rows |
Sex and Age in Leisure Lake
Sex and Age in Leisure Lake
The most populous age groups in Leisure Lake are 5 to 9 Years (18 | 29.0%) for men and 30 to 34 Years (102 | 74.5%) for women.
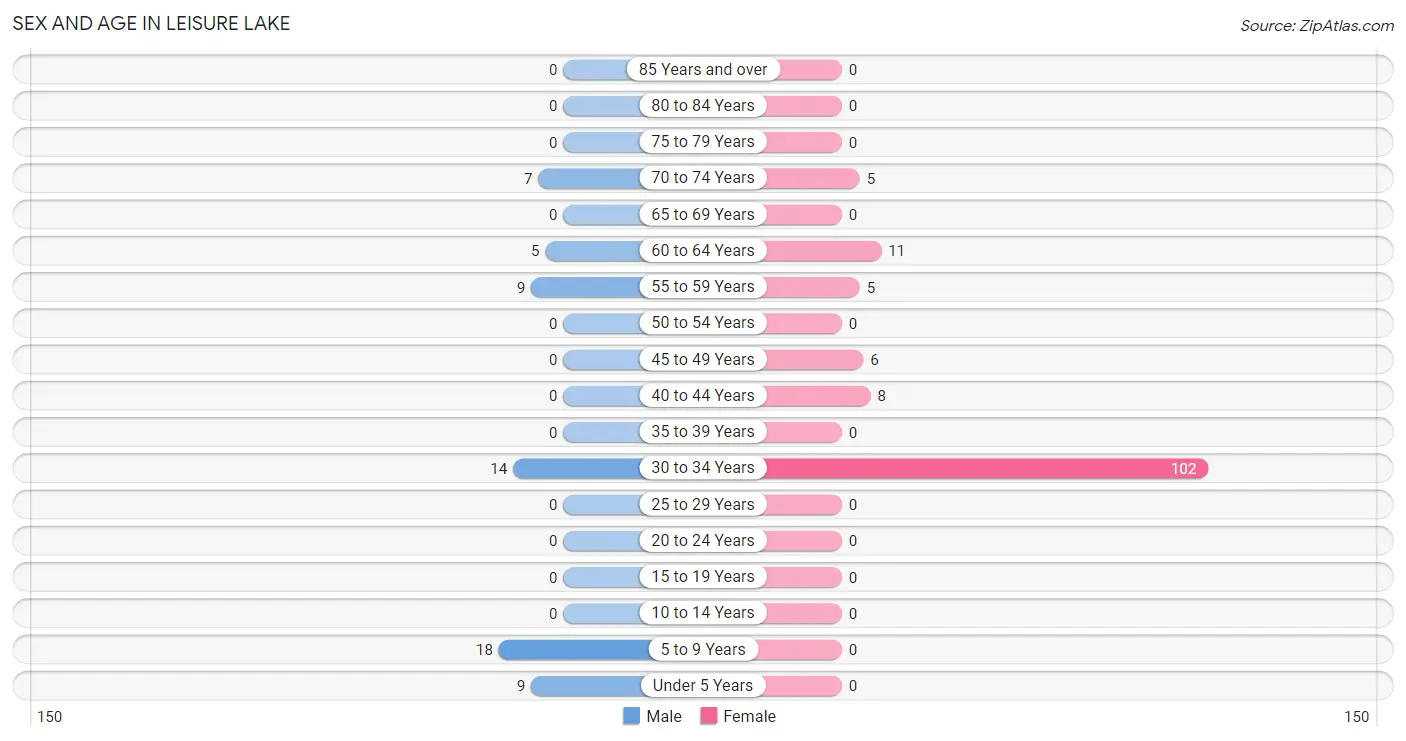
| Age Bracket | Male | Female |
| Under 5 Years | 9 (14.5%) | 0 (0.0%) |
| 5 to 9 Years | 18 (29.0%) | 0 (0.0%) |
| 10 to 14 Years | 0 (0.0%) | 0 (0.0%) |
| 15 to 19 Years | 0 (0.0%) | 0 (0.0%) |
| 20 to 24 Years | 0 (0.0%) | 0 (0.0%) |
| 25 to 29 Years | 0 (0.0%) | 0 (0.0%) |
| 30 to 34 Years | 14 (22.6%) | 102 (74.5%) |
| 35 to 39 Years | 0 (0.0%) | 0 (0.0%) |
| 40 to 44 Years | 0 (0.0%) | 8 (5.8%) |
| 45 to 49 Years | 0 (0.0%) | 6 (4.4%) |
| 50 to 54 Years | 0 (0.0%) | 0 (0.0%) |
| 55 to 59 Years | 9 (14.5%) | 5 (3.6%) |
| 60 to 64 Years | 5 (8.1%) | 11 (8.0%) |
| 65 to 69 Years | 0 (0.0%) | 0 (0.0%) |
| 70 to 74 Years | 7 (11.3%) | 5 (3.6%) |
| 75 to 79 Years | 0 (0.0%) | 0 (0.0%) |
| 80 to 84 Years | 0 (0.0%) | 0 (0.0%) |
| 85 Years and over | 0 (0.0%) | 0 (0.0%) |
| Total | 62 (100.0%) | 137 (100.0%) |
Families and Households in Leisure Lake
Median Family Size in Leisure Lake
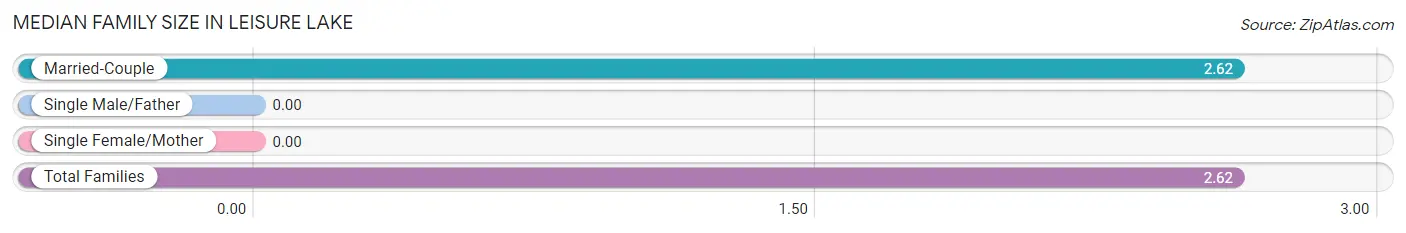
| Family Type | # Families | Family Size |
| Married-Couple | 34 (100.0%) | 2.62 |
| Single Male/Father | 0 (0.0%) | - |
| Single Female/Mother | 0 (0.0%) | - |
| Total Families | 34 (100.0%) | 2.62 |
Median Household Size in Leisure Lake
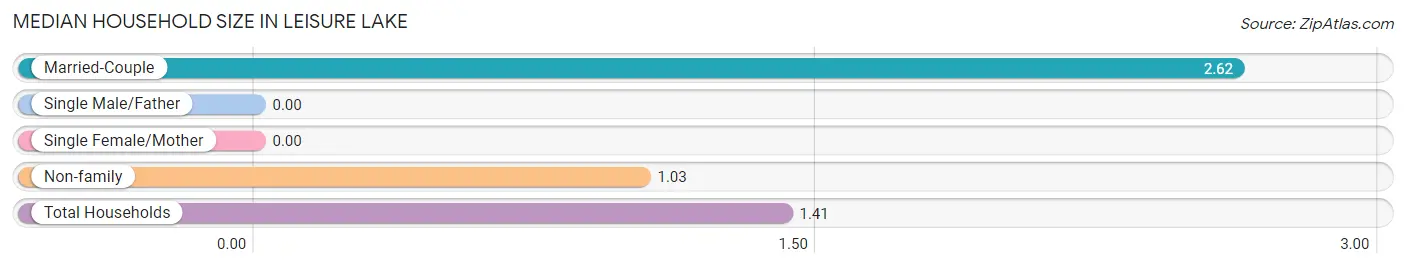
| Household Type | # Households | Household Size |
| Married-Couple | 34 (24.1%) | 2.62 |
| Single Male/Father | 0 (0.0%) | - |
| Single Female/Mother | 0 (0.0%) | - |
| Non-family | 107 (75.9%) | 1.03 |
| Total Households | 141 (100.0%) | 1.41 |
Household Size by Marriage Status in Leisure Lake
Out of a total of 141 households in Leisure Lake, 34 (24.1%) are family households, while 107 (75.9%) are nonfamily households. The most numerous type of family households are 2-person households, comprising 26, and the most common type of nonfamily households are 1-person households, comprising 103.
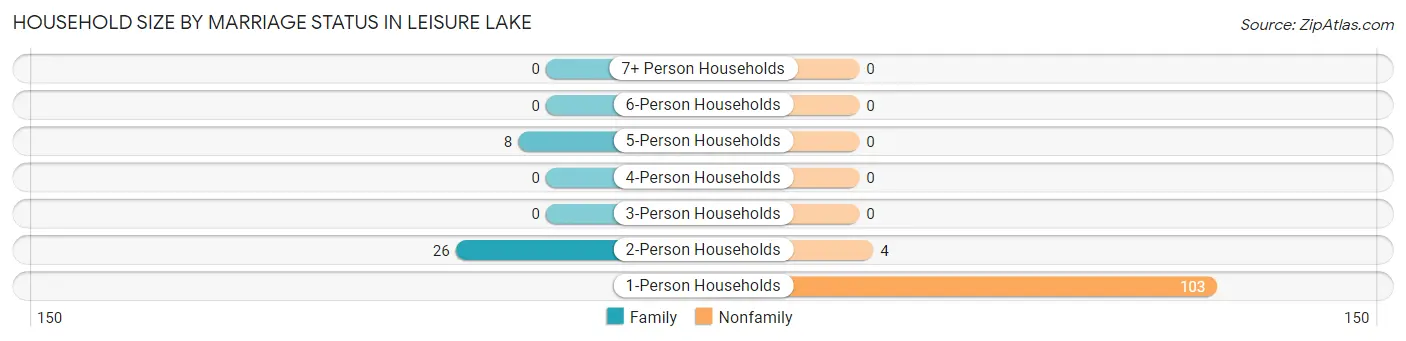
| Household Size | Family Households | Nonfamily Households |
| 1-Person Households | - | 103 (73.1%) |
| 2-Person Households | 26 (18.4%) | 4 (2.8%) |
| 3-Person Households | 0 (0.0%) | 0 (0.0%) |
| 4-Person Households | 0 (0.0%) | 0 (0.0%) |
| 5-Person Households | 8 (5.7%) | 0 (0.0%) |
| 6-Person Households | 0 (0.0%) | 0 (0.0%) |
| 7+ Person Households | 0 (0.0%) | 0 (0.0%) |
| Total | 34 (24.1%) | 107 (75.9%) |
Female Fertility in Leisure Lake
Fertility by Age in Leisure Lake
| Age Bracket | Women with Births | Births / 1,000 Women |
| 15 to 19 years | 0 (0.0%) | 0.0 |
| 20 to 34 years | 0 (0.0%) | 0.0 |
| 35 to 50 years | 0 (0.0%) | 0.0 |
| Total | 0 (0.0%) | 0.0 |
Fertility by Age by Marriage Status in Leisure Lake
| Age Bracket | Married | Unmarried |
| 15 to 19 years | 0 (0.0%) | 0 (0.0%) |
| 20 to 34 years | 0 (0.0%) | 0 (0.0%) |
| 35 to 50 years | 0 (0.0%) | 0 (0.0%) |
| Total | 0 (0.0%) | 0 (0.0%) |
Fertility by Education in Leisure Lake
| Educational Attainment | Women with Births | Births / 1,000 Women |
| Less than High School | 0 (0.0%) | 0.0 |
| High School Diploma | 0 (0.0%) | 0.0 |
| College or Associate's Degree | 0 (0.0%) | 0.0 |
| Bachelor's Degree | 0 (0.0%) | 0.0 |
| Graduate Degree | 0 (0.0%) | 0.0 |
| Total | 0 (0.0%) | 0.0 |
Fertility by Education by Marriage Status in Leisure Lake
| Educational Attainment | Married | Unmarried |
| Less than High School | 0 (0.0%) | 0 (0.0%) |
| High School Diploma | 0 (0.0%) | 0 (0.0%) |
| College or Associate's Degree | 0 (0.0%) | 0 (0.0%) |
| Bachelor's Degree | 0 (0.0%) | 0 (0.0%) |
| Graduate Degree | 0 (0.0%) | 0 (0.0%) |
| Total | 0 (0.0%) | 0 (0.0%) |
Employment Characteristics in Leisure Lake
Employment by Class of Employer in Leisure Lake
Among the 159 employed individuals in Leisure Lake, private company employees (124 | 78.0%), local government employees (22 | 13.8%), and self-employed (incorporated) (8 | 5.0%) make up the most common classes of employment.
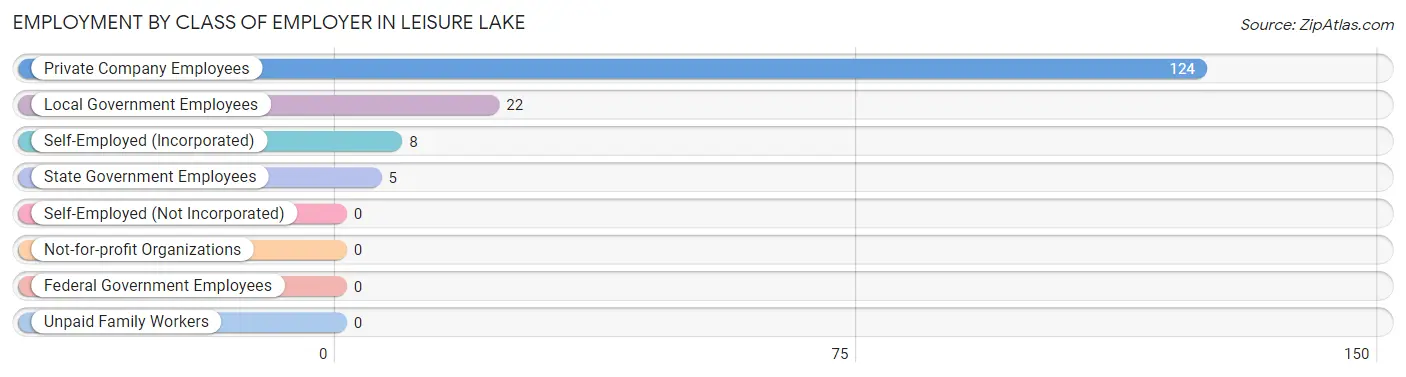
| Employer Class | # Employees | % Employees |
| Private Company Employees | 124 | 78.0% |
| Self-Employed (Incorporated) | 8 | 5.0% |
| Self-Employed (Not Incorporated) | 0 | 0.0% |
| Not-for-profit Organizations | 0 | 0.0% |
| Local Government Employees | 22 | 13.8% |
| State Government Employees | 5 | 3.1% |
| Federal Government Employees | 0 | 0.0% |
| Unpaid Family Workers | 0 | 0.0% |
| Total | 159 | 100.0% |
Employment Status by Age in Leisure Lake
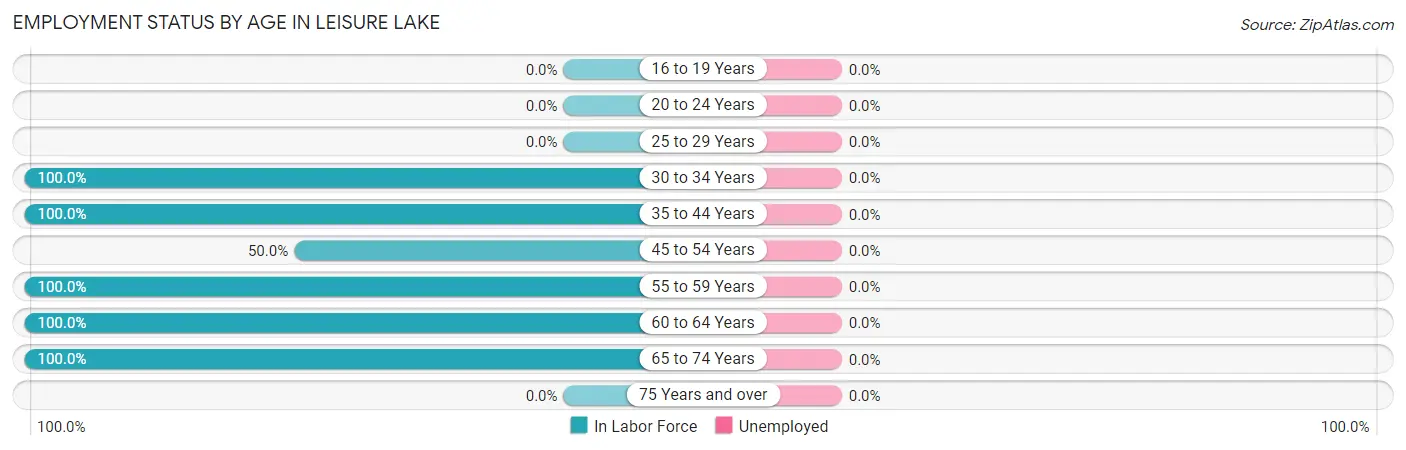
| Age Bracket | In Labor Force | Unemployed |
| 16 to 19 Years | 0 (0.0%) | 0 (0.0%) |
| 20 to 24 Years | 0 (0.0%) | 0 (0.0%) |
| 25 to 29 Years | 0 (0.0%) | 0 (0.0%) |
| 30 to 34 Years | 116 (100.0%) | 0 (0.0%) |
| 35 to 44 Years | 8 (100.0%) | 0 (0.0%) |
| 45 to 54 Years | 3 (50.0%) | 0 (0.0%) |
| 55 to 59 Years | 14 (100.0%) | 0 (0.0%) |
| 60 to 64 Years | 16 (100.0%) | 0 (0.0%) |
| 65 to 74 Years | 12 (100.0%) | 0 (0.0%) |
| 75 Years and over | 0 (0.0%) | 0 (0.0%) |
| Total | 169 (98.3%) | 0 (0.0%) |
Employment Status by Educational Attainment in Leisure Lake
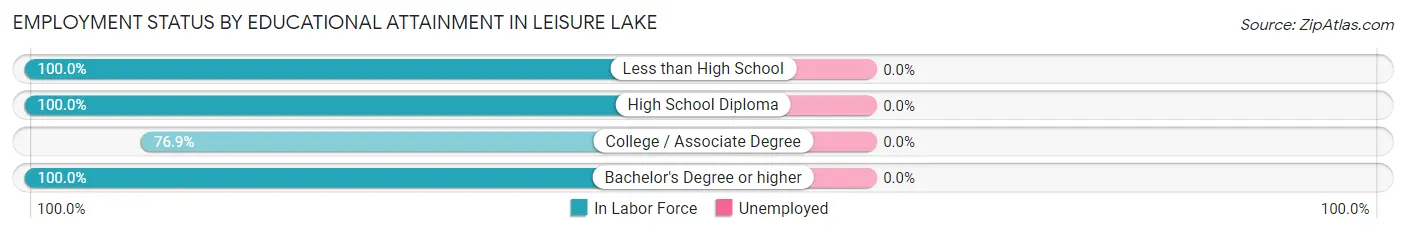
| Educational Attainment | In Labor Force | Unemployed |
| Less than High School | 101 (100.0%) | 0 (0.0%) |
| High School Diploma | 29 (100.0%) | 0 (0.0%) |
| College / Associate Degree | 10 (76.9%) | 0 (0.0%) |
| Bachelor's Degree or higher | 17 (100.0%) | 0 (0.0%) |
| Total | 157 (98.1%) | 0 (0.0%) |
Employment Occupations by Sex in Leisure Lake
Management, Business, Science and Arts Occupations
The most common Management, Business, Science and Arts occupations in Leisure Lake are Community & Social Service (9 | 5.3%), and Education Instruction & Library (9 | 5.3%).
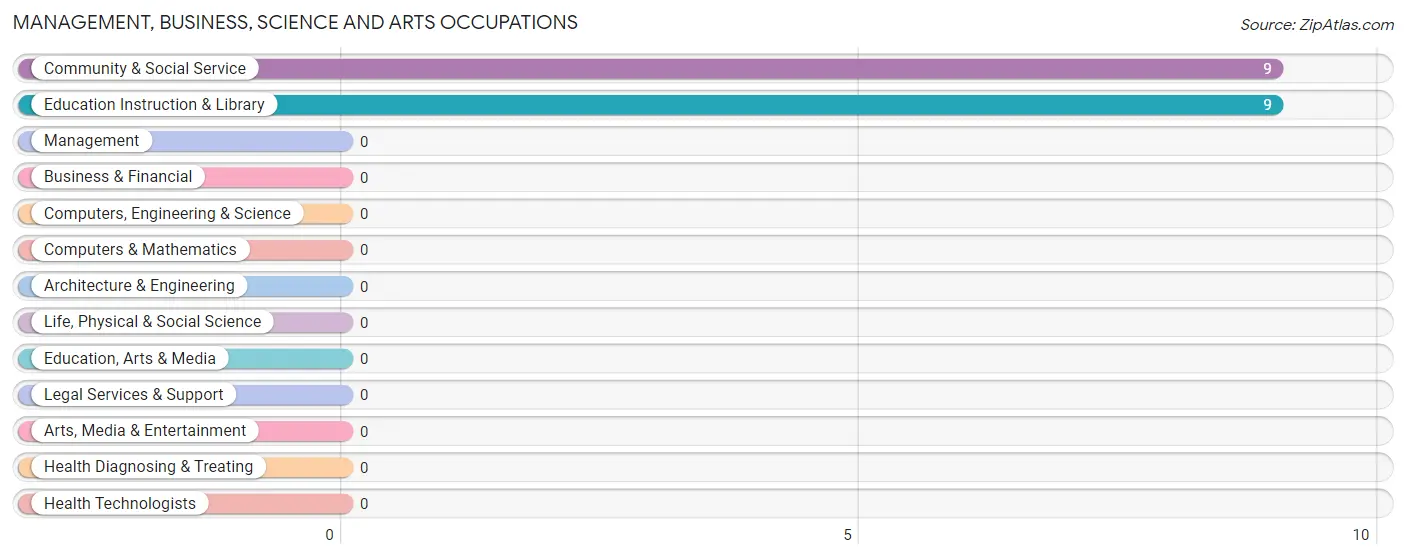
Management, Business, Science and Arts Occupations by Sex
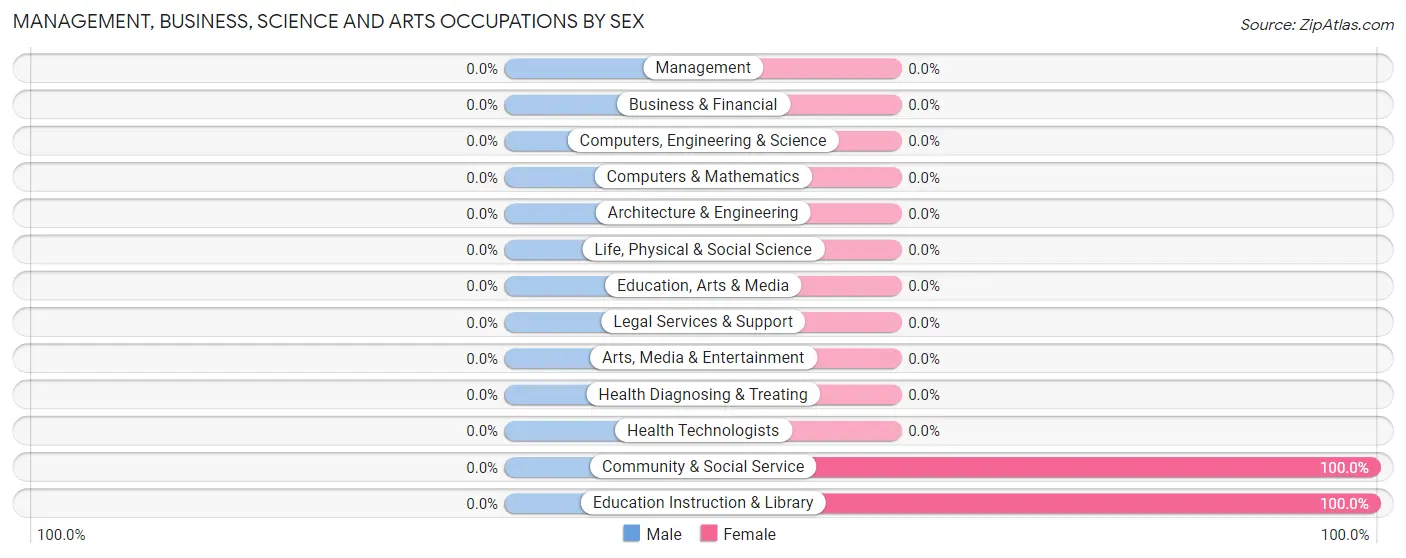
| Occupation | Male | Female |
| Management | 0 (0.0%) | 0 (0.0%) |
| Business & Financial | 0 (0.0%) | 0 (0.0%) |
| Computers, Engineering & Science | 0 (0.0%) | 0 (0.0%) |
| Computers & Mathematics | 0 (0.0%) | 0 (0.0%) |
| Architecture & Engineering | 0 (0.0%) | 0 (0.0%) |
| Life, Physical & Social Science | 0 (0.0%) | 0 (0.0%) |
| Community & Social Service | 0 (0.0%) | 9 (100.0%) |
| Education, Arts & Media | 0 (0.0%) | 0 (0.0%) |
| Legal Services & Support | 0 (0.0%) | 0 (0.0%) |
| Education Instruction & Library | 0 (0.0%) | 9 (100.0%) |
| Arts, Media & Entertainment | 0 (0.0%) | 0 (0.0%) |
| Health Diagnosing & Treating | 0 (0.0%) | 0 (0.0%) |
| Health Technologists | 0 (0.0%) | 0 (0.0%) |
| Total (Category) | 0 (0.0%) | 9 (100.0%) |
| Total (Overall) | 35 (20.7%) | 134 (79.3%) |
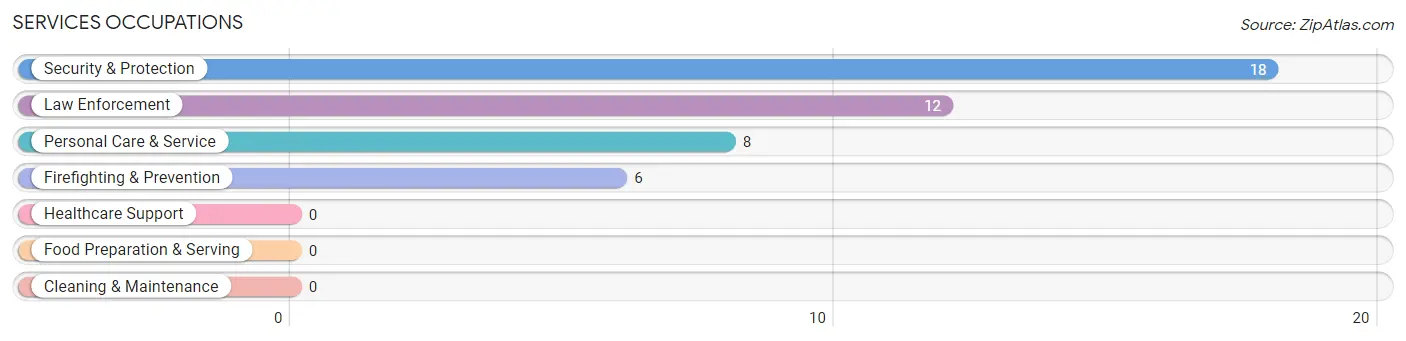
Services Occupations
The most common Services occupations in Leisure Lake are Security & Protection (18 | 10.6%), Law Enforcement (12 | 7.1%), Personal Care & Service (8 | 4.7%), and Firefighting & Prevention (6 | 3.5%).
Services Occupations by Sex
Within the Services occupations in Leisure Lake, the most male-oriented occupations are Law Enforcement (100.0%), and Security & Protection (66.7%), while the most female-oriented occupations are Firefighting & Prevention (100.0%), Personal Care & Service (100.0%), and Security & Protection (33.3%).
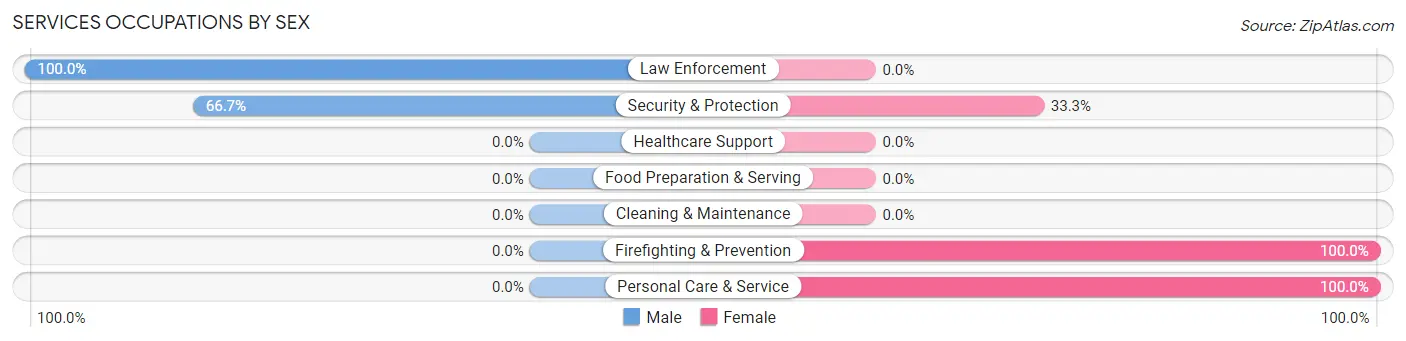
| Occupation | Male | Female |
| Healthcare Support | 0 (0.0%) | 0 (0.0%) |
| Security & Protection | 12 (66.7%) | 6 (33.3%) |
| Firefighting & Prevention | 0 (0.0%) | 6 (100.0%) |
| Law Enforcement | 12 (100.0%) | 0 (0.0%) |
| Food Preparation & Serving | 0 (0.0%) | 0 (0.0%) |
| Cleaning & Maintenance | 0 (0.0%) | 0 (0.0%) |
| Personal Care & Service | 0 (0.0%) | 8 (100.0%) |
| Total (Category) | 12 (46.2%) | 14 (53.8%) |
| Total (Overall) | 35 (20.7%) | 134 (79.3%) |
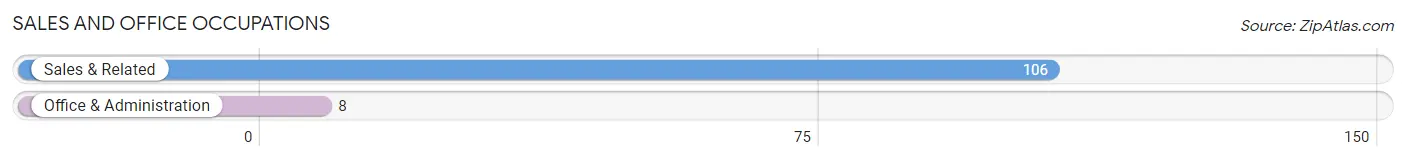
Sales and Office Occupations
The most common Sales and Office occupations in Leisure Lake are Sales & Related (106 | 62.7%), and Office & Administration (8 | 4.7%).
Sales and Office Occupations by Sex
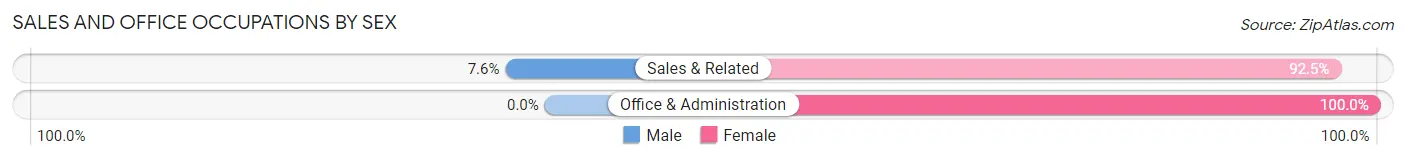
| Occupation | Male | Female |
| Sales & Related | 8 (7.5%) | 98 (92.4%) |
| Office & Administration | 0 (0.0%) | 8 (100.0%) |
| Total (Category) | 8 (7.0%) | 106 (93.0%) |
| Total (Overall) | 35 (20.7%) | 134 (79.3%) |
Natural Resources, Construction and Maintenance Occupations
The most common Natural Resources, Construction and Maintenance occupations in Leisure Lake are , and Construction & Extraction (6 | 3.5%).
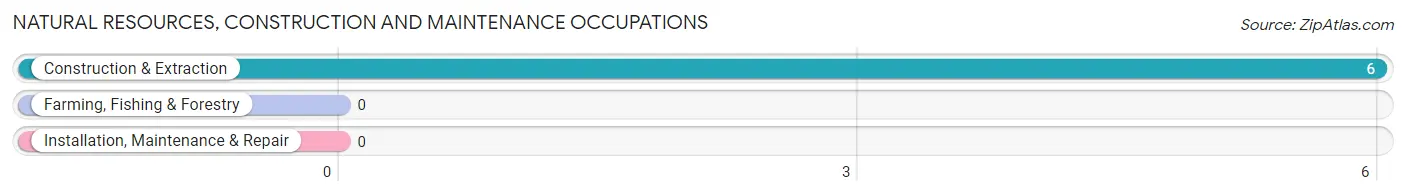
Natural Resources, Construction and Maintenance Occupations by Sex
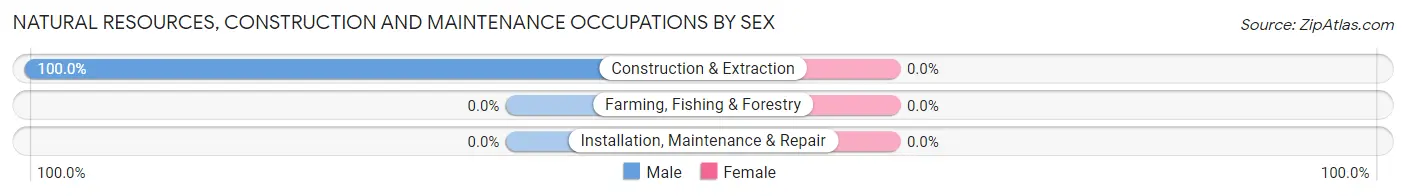
| Occupation | Male | Female |
| Farming, Fishing & Forestry | 0 (0.0%) | 0 (0.0%) |
| Construction & Extraction | 6 (100.0%) | 0 (0.0%) |
| Installation, Maintenance & Repair | 0 (0.0%) | 0 (0.0%) |
| Total (Category) | 6 (100.0%) | 0 (0.0%) |
| Total (Overall) | 35 (20.7%) | 134 (79.3%) |
Production, Transportation and Moving Occupations
The most common Production, Transportation and Moving occupations in Leisure Lake are Transportation (10 | 5.9%), and Production (4 | 2.4%).
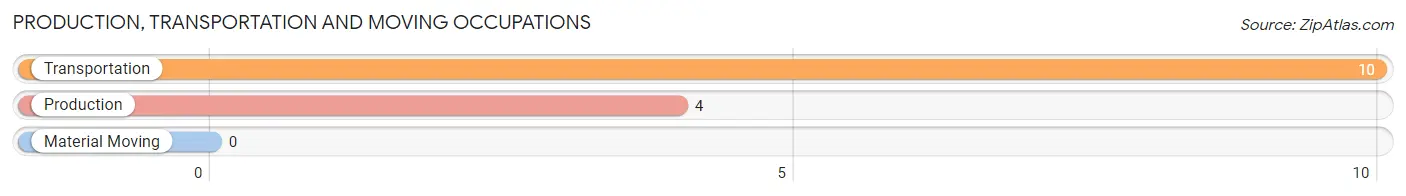
Production, Transportation and Moving Occupations by Sex
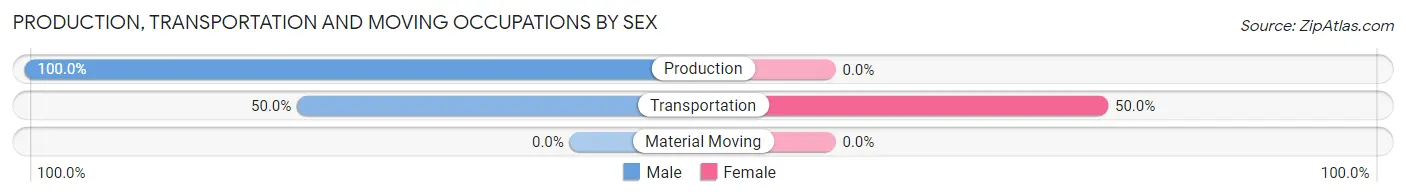
| Occupation | Male | Female |
| Production | 4 (100.0%) | 0 (0.0%) |
| Transportation | 5 (50.0%) | 5 (50.0%) |
| Material Moving | 0 (0.0%) | 0 (0.0%) |
| Total (Category) | 9 (64.3%) | 5 (35.7%) |
| Total (Overall) | 35 (20.7%) | 134 (79.3%) |
Employment Industries by Sex in Leisure Lake
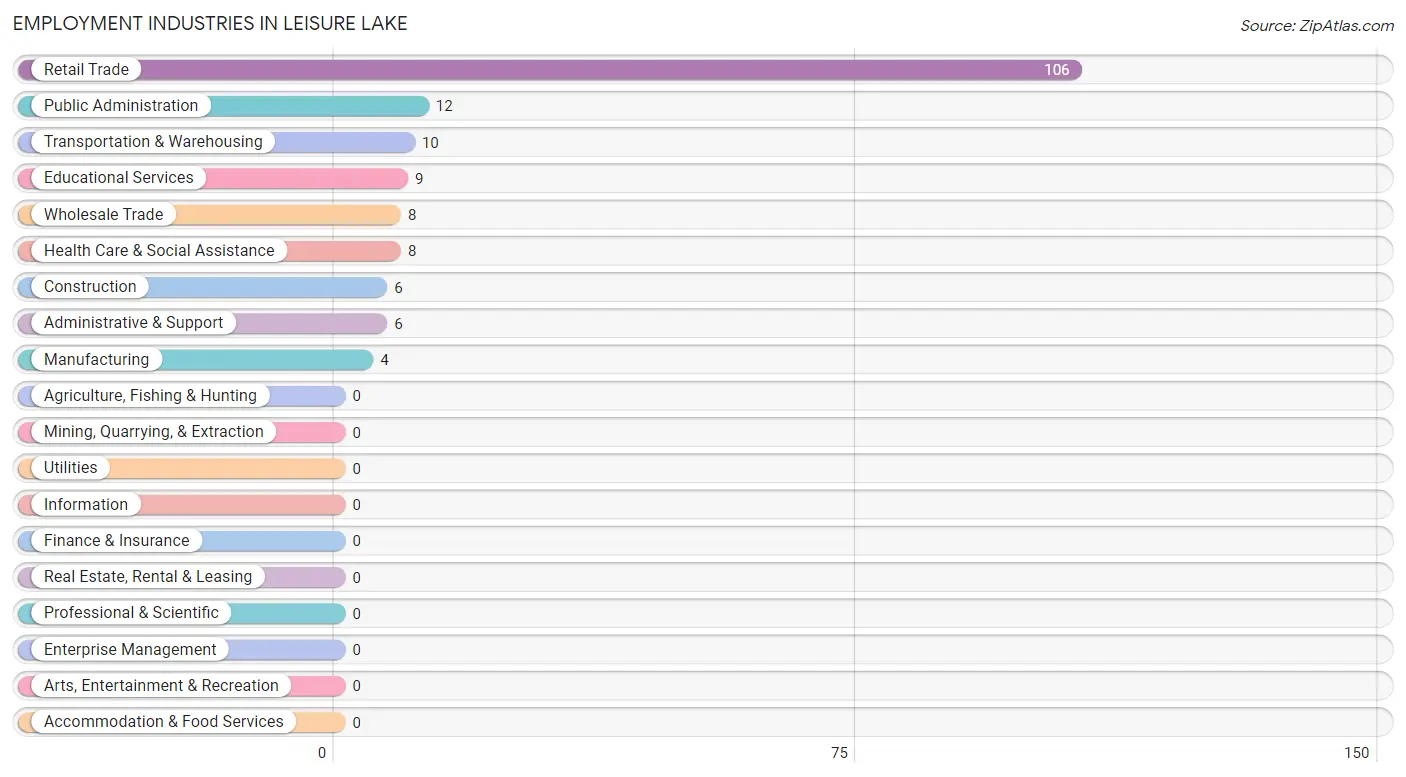
Employment Industries in Leisure Lake
The major employment industries in Leisure Lake include Retail Trade (106 | 62.7%), Public Administration (12 | 7.1%), Transportation & Warehousing (10 | 5.9%), Educational Services (9 | 5.3%), and Wholesale Trade (8 | 4.7%).
Employment Industries by Sex in Leisure Lake
The Leisure Lake industries that see more men than women are Construction (100.0%), Manufacturing (100.0%), and Wholesale Trade (100.0%), whereas the industries that tend to have a higher number of women are Retail Trade (100.0%), Administrative & Support (100.0%), and Educational Services (100.0%).
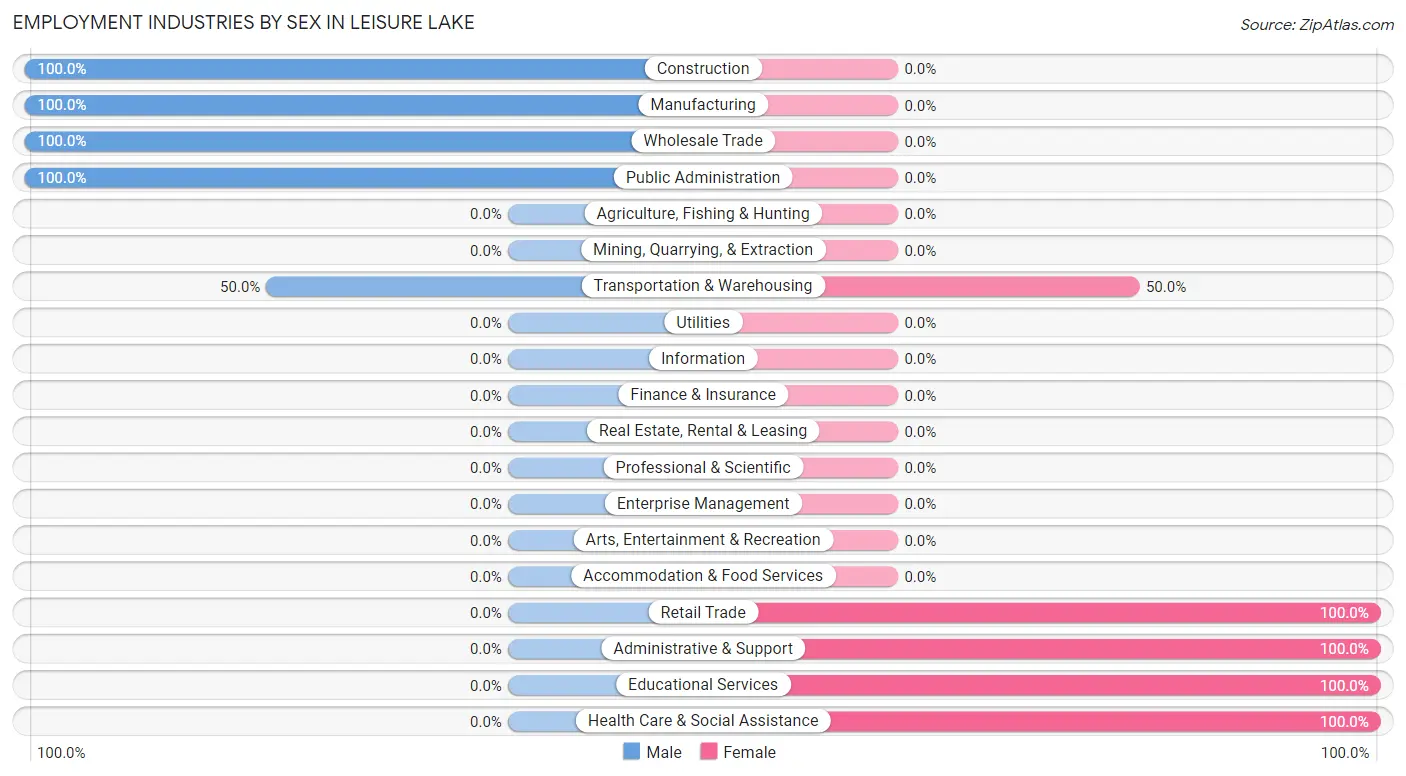
| Industry | Male | Female |
| Agriculture, Fishing & Hunting | 0 (0.0%) | 0 (0.0%) |
| Mining, Quarrying, & Extraction | 0 (0.0%) | 0 (0.0%) |
| Construction | 6 (100.0%) | 0 (0.0%) |
| Manufacturing | 4 (100.0%) | 0 (0.0%) |
| Wholesale Trade | 8 (100.0%) | 0 (0.0%) |
| Retail Trade | 0 (0.0%) | 106 (100.0%) |
| Transportation & Warehousing | 5 (50.0%) | 5 (50.0%) |
| Utilities | 0 (0.0%) | 0 (0.0%) |
| Information | 0 (0.0%) | 0 (0.0%) |
| Finance & Insurance | 0 (0.0%) | 0 (0.0%) |
| Real Estate, Rental & Leasing | 0 (0.0%) | 0 (0.0%) |
| Professional & Scientific | 0 (0.0%) | 0 (0.0%) |
| Enterprise Management | 0 (0.0%) | 0 (0.0%) |
| Administrative & Support | 0 (0.0%) | 6 (100.0%) |
| Educational Services | 0 (0.0%) | 9 (100.0%) |
| Health Care & Social Assistance | 0 (0.0%) | 8 (100.0%) |
| Arts, Entertainment & Recreation | 0 (0.0%) | 0 (0.0%) |
| Accommodation & Food Services | 0 (0.0%) | 0 (0.0%) |
| Public Administration | 12 (100.0%) | 0 (0.0%) |
| Total | 35 (20.7%) | 134 (79.3%) |
Education in Leisure Lake
School Enrollment in Leisure Lake
The most common levels of schooling among the 27 students in Leisure Lake are nursery / preschool (9 | 33.3%), kindergarten (9 | 33.3%), and elementary school (9 | 33.3%).
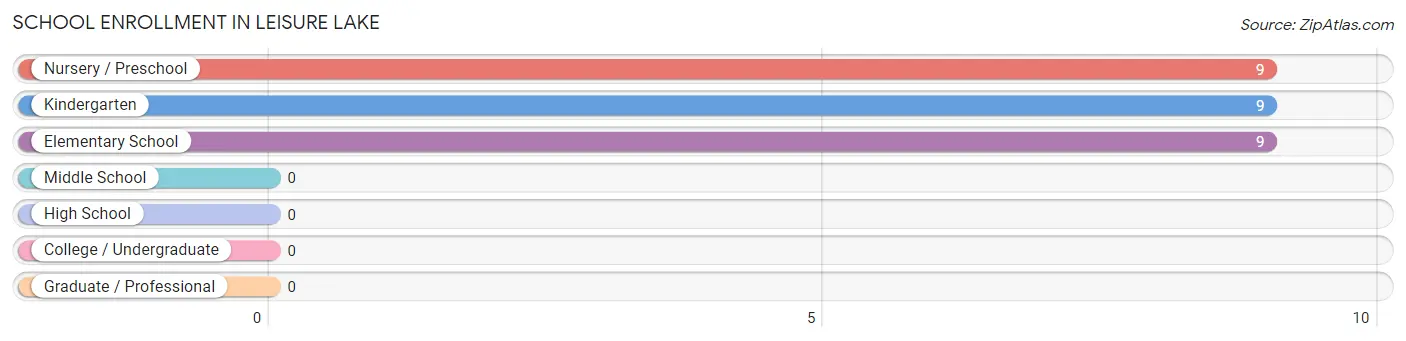
| School Level | # Students | % Students |
| Nursery / Preschool | 9 | 33.3% |
| Kindergarten | 9 | 33.3% |
| Elementary School | 9 | 33.3% |
| Middle School | 0 | 0.0% |
| High School | 0 | 0.0% |
| College / Undergraduate | 0 | 0.0% |
| Graduate / Professional | 0 | 0.0% |
| Total | 27 | 100.0% |
School Enrollment by Age by Funding Source in Leisure Lake
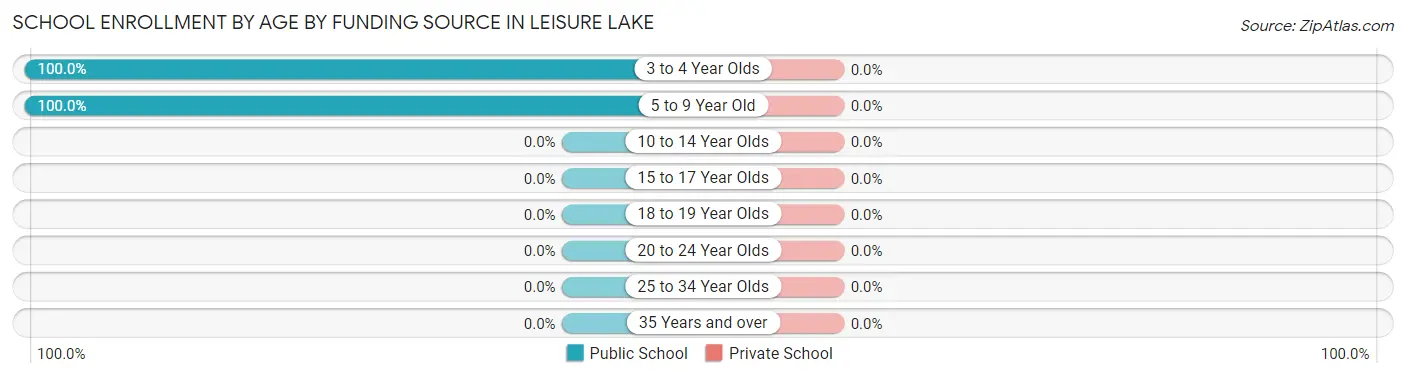
| Age Bracket | Public School | Private School |
| 3 to 4 Year Olds | 9 (100.0%) | 0 (0.0%) |
| 5 to 9 Year Old | 18 (100.0%) | 0 (0.0%) |
| 10 to 14 Year Olds | 0 (0.0%) | 0 (0.0%) |
| 15 to 17 Year Olds | 0 (0.0%) | 0 (0.0%) |
| 18 to 19 Year Olds | 0 (0.0%) | 0 (0.0%) |
| 20 to 24 Year Olds | 0 (0.0%) | 0 (0.0%) |
| 25 to 34 Year Olds | 0 (0.0%) | 0 (0.0%) |
| 35 Years and over | 0 (0.0%) | 0 (0.0%) |
| Total | 27 (100.0%) | 0 (0.0%) |
Educational Attainment by Field of Study in Leisure Lake
Education (9 | 52.9%), and bio, nature & agricultural (8 | 47.1%) are the most common fields of study among 17 individuals in Leisure Lake who have obtained a bachelor's degree or higher.
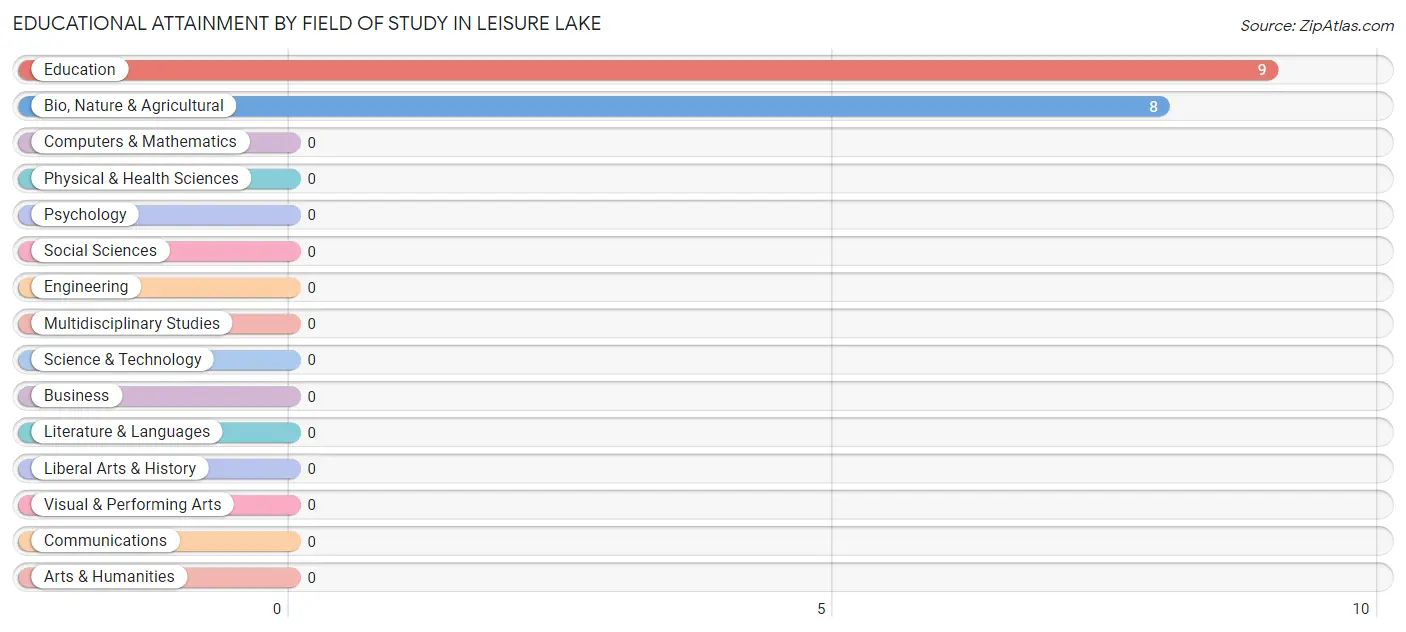
| Field of Study | # Graduates | % Graduates |
| Computers & Mathematics | 0 | 0.0% |
| Bio, Nature & Agricultural | 8 | 47.1% |
| Physical & Health Sciences | 0 | 0.0% |
| Psychology | 0 | 0.0% |
| Social Sciences | 0 | 0.0% |
| Engineering | 0 | 0.0% |
| Multidisciplinary Studies | 0 | 0.0% |
| Science & Technology | 0 | 0.0% |
| Business | 0 | 0.0% |
| Education | 9 | 52.9% |
| Literature & Languages | 0 | 0.0% |
| Liberal Arts & History | 0 | 0.0% |
| Visual & Performing Arts | 0 | 0.0% |
| Communications | 0 | 0.0% |
| Arts & Humanities | 0 | 0.0% |
| Total | 17 | 100.0% |
Transportation & Commute in Leisure Lake
Vehicle Availability by Sex in Leisure Lake
The most prevalent vehicle ownership categories in Leisure Lake are males with 2 vehicles (18, accounting for 60.0%) and females with 2 vehicles (14, making up 14.0%).
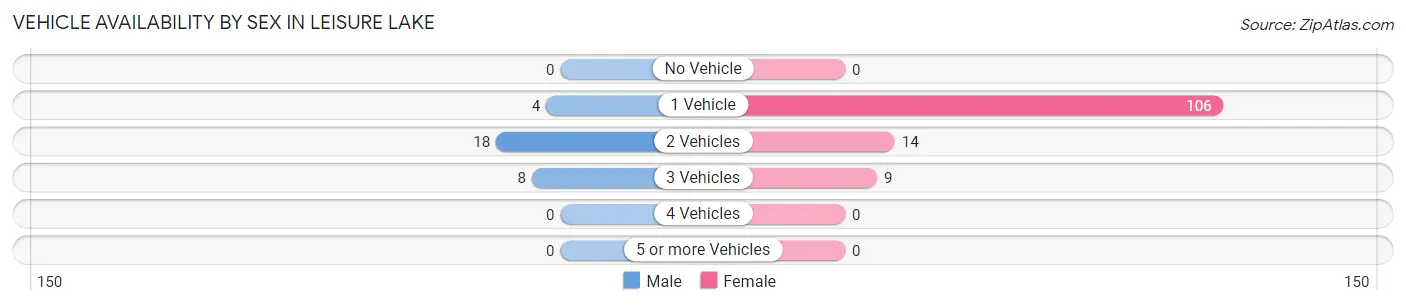
| Vehicles Available | Male | Female |
| No Vehicle | 0 (0.0%) | 0 (0.0%) |
| 1 Vehicle | 4 (13.3%) | 106 (82.2%) |
| 2 Vehicles | 18 (60.0%) | 14 (10.8%) |
| 3 Vehicles | 8 (26.7%) | 9 (7.0%) |
| 4 Vehicles | 0 (0.0%) | 0 (0.0%) |
| 5 or more Vehicles | 0 (0.0%) | 0 (0.0%) |
| Total | 30 (100.0%) | 129 (100.0%) |
Commute Time in Leisure Lake
The most frequently occuring commute durations in Leisure Lake are 30 to 34 minutes (102 commuters, 64.1%), 20 to 24 minutes (25 commuters, 15.7%), and 45 to 59 minutes (18 commuters, 11.3%).
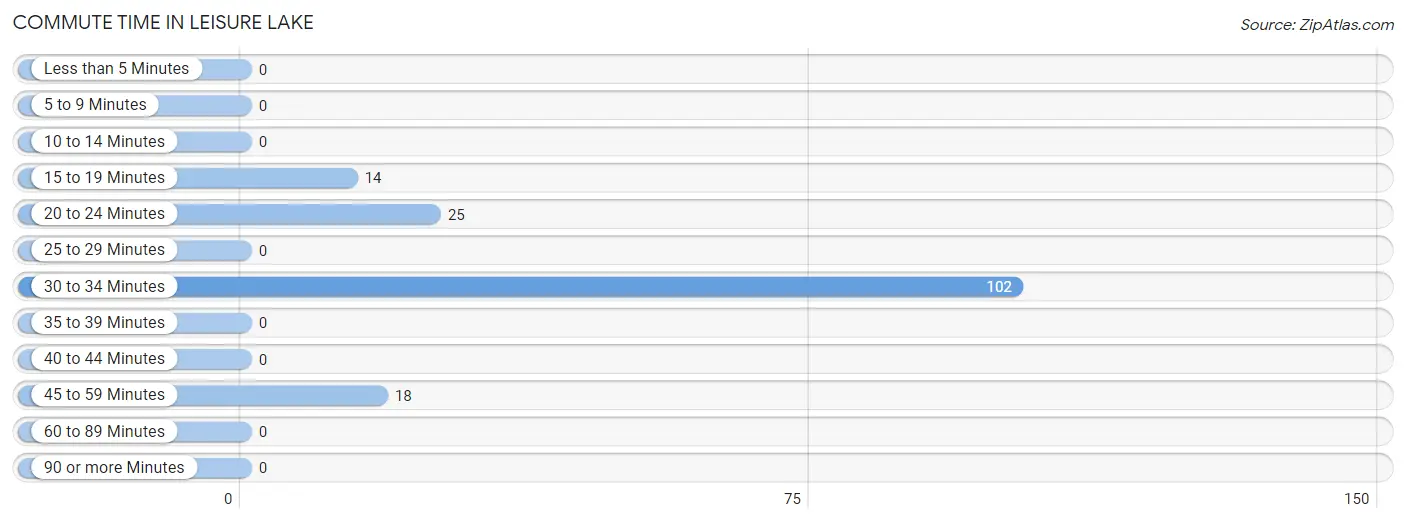
| Commute Time | # Commuters | % Commuters |
| Less than 5 Minutes | 0 | 0.0% |
| 5 to 9 Minutes | 0 | 0.0% |
| 10 to 14 Minutes | 0 | 0.0% |
| 15 to 19 Minutes | 14 | 8.8% |
| 20 to 24 Minutes | 25 | 15.7% |
| 25 to 29 Minutes | 0 | 0.0% |
| 30 to 34 Minutes | 102 | 64.1% |
| 35 to 39 Minutes | 0 | 0.0% |
| 40 to 44 Minutes | 0 | 0.0% |
| 45 to 59 Minutes | 18 | 11.3% |
| 60 to 89 Minutes | 0 | 0.0% |
| 90 or more Minutes | 0 | 0.0% |
Commute Time by Sex in Leisure Lake
The most common commute times in Leisure Lake are 20 to 24 minutes (19 commuters, 63.3%) for males and 30 to 34 minutes (96 commuters, 74.4%) for females.
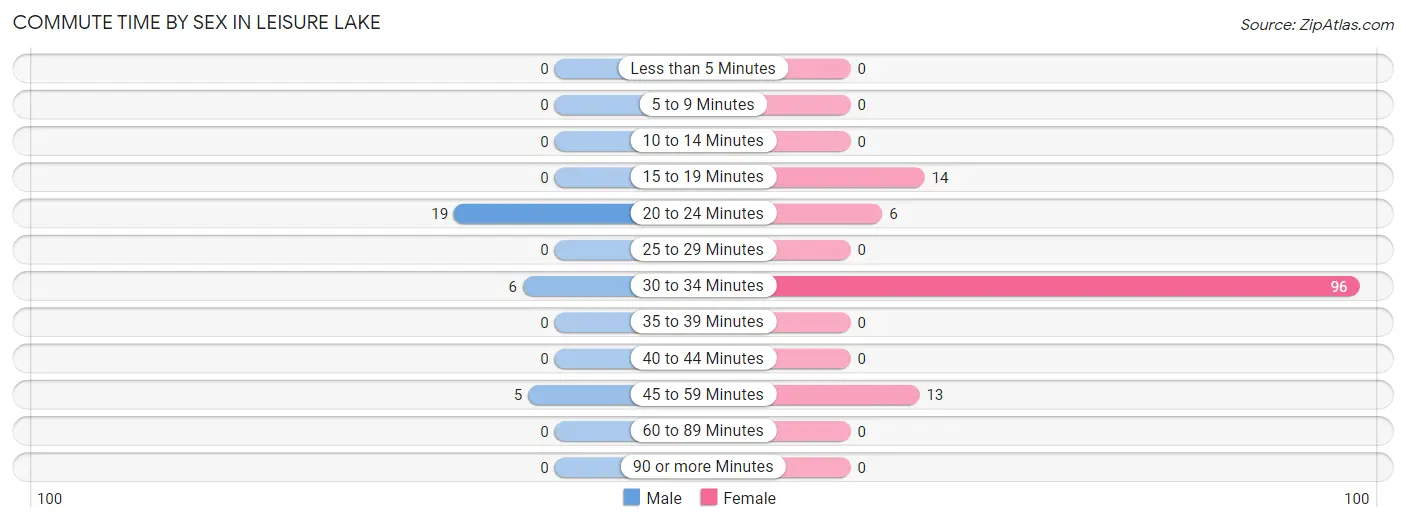
| Commute Time | Male | Female |
| Less than 5 Minutes | 0 (0.0%) | 0 (0.0%) |
| 5 to 9 Minutes | 0 (0.0%) | 0 (0.0%) |
| 10 to 14 Minutes | 0 (0.0%) | 0 (0.0%) |
| 15 to 19 Minutes | 0 (0.0%) | 14 (10.8%) |
| 20 to 24 Minutes | 19 (63.3%) | 6 (4.6%) |
| 25 to 29 Minutes | 0 (0.0%) | 0 (0.0%) |
| 30 to 34 Minutes | 6 (20.0%) | 96 (74.4%) |
| 35 to 39 Minutes | 0 (0.0%) | 0 (0.0%) |
| 40 to 44 Minutes | 0 (0.0%) | 0 (0.0%) |
| 45 to 59 Minutes | 5 (16.7%) | 13 (10.1%) |
| 60 to 89 Minutes | 0 (0.0%) | 0 (0.0%) |
| 90 or more Minutes | 0 (0.0%) | 0 (0.0%) |
Time of Departure to Work by Sex in Leisure Lake
The most frequent times of departure to work in Leisure Lake are 7:00 AM to 7:29 AM (8, 26.7%) for males and 12:00 AM to 4:59 AM (93, 72.1%) for females.
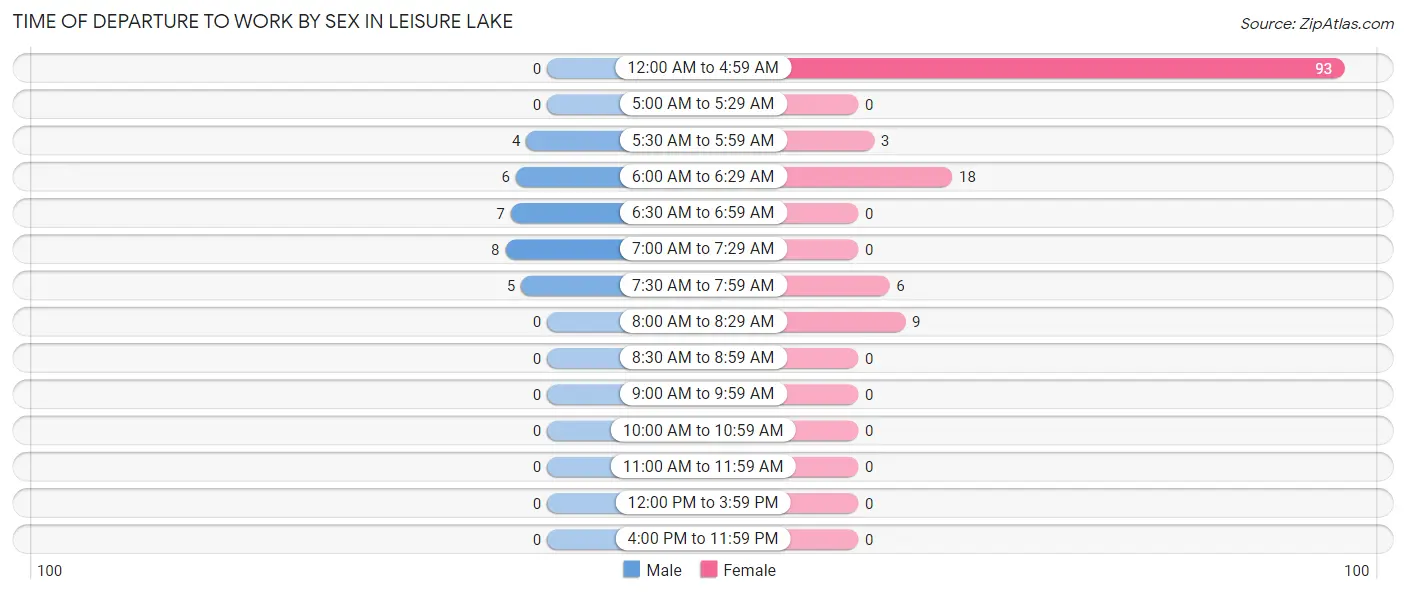
| Time of Departure | Male | Female |
| 12:00 AM to 4:59 AM | 0 (0.0%) | 93 (72.1%) |
| 5:00 AM to 5:29 AM | 0 (0.0%) | 0 (0.0%) |
| 5:30 AM to 5:59 AM | 4 (13.3%) | 3 (2.3%) |
| 6:00 AM to 6:29 AM | 6 (20.0%) | 18 (14.0%) |
| 6:30 AM to 6:59 AM | 7 (23.3%) | 0 (0.0%) |
| 7:00 AM to 7:29 AM | 8 (26.7%) | 0 (0.0%) |
| 7:30 AM to 7:59 AM | 5 (16.7%) | 6 (4.6%) |
| 8:00 AM to 8:29 AM | 0 (0.0%) | 9 (7.0%) |
| 8:30 AM to 8:59 AM | 0 (0.0%) | 0 (0.0%) |
| 9:00 AM to 9:59 AM | 0 (0.0%) | 0 (0.0%) |
| 10:00 AM to 10:59 AM | 0 (0.0%) | 0 (0.0%) |
| 11:00 AM to 11:59 AM | 0 (0.0%) | 0 (0.0%) |
| 12:00 PM to 3:59 PM | 0 (0.0%) | 0 (0.0%) |
| 4:00 PM to 11:59 PM | 0 (0.0%) | 0 (0.0%) |
| Total | 30 (100.0%) | 129 (100.0%) |
Housing Occupancy in Leisure Lake
Occupancy by Ownership in Leisure Lake
Of the total 141 dwellings in Leisure Lake, owner-occupied units account for 136 (96.5%), while renter-occupied units make up 5 (3.5%).
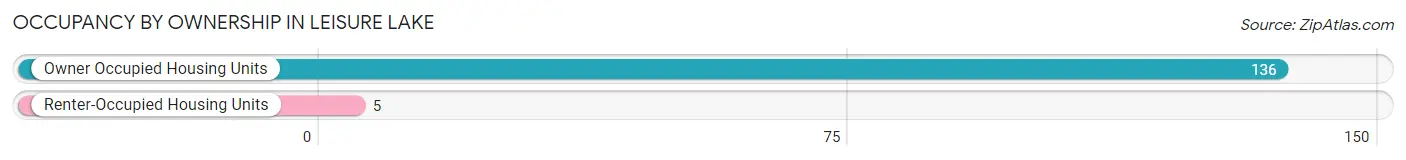
| Occupancy | # Housing Units | % Housing Units |
| Owner Occupied Housing Units | 136 | 96.5% |
| Renter-Occupied Housing Units | 5 | 3.5% |
| Total Occupied Housing Units | 141 | 100.0% |
Occupancy by Household Size in Leisure Lake
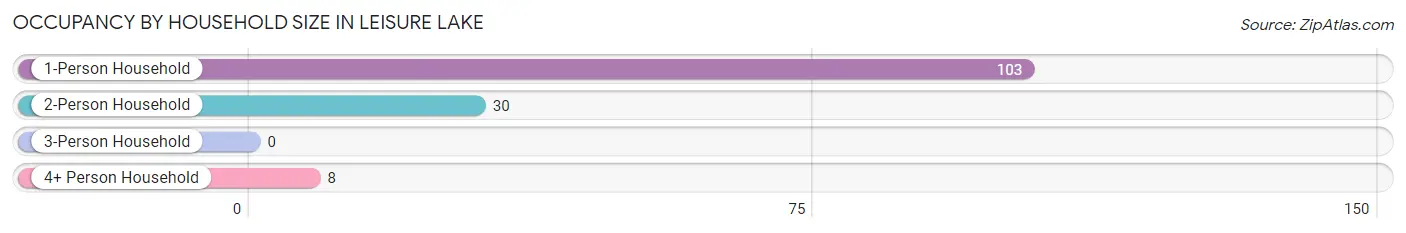
| Household Size | # Housing Units | % Housing Units |
| 1-Person Household | 103 | 73.1% |
| 2-Person Household | 30 | 21.3% |
| 3-Person Household | 0 | 0.0% |
| 4+ Person Household | 8 | 5.7% |
| Total Housing Units | 141 | 100.0% |
Occupancy by Ownership by Household Size in Leisure Lake
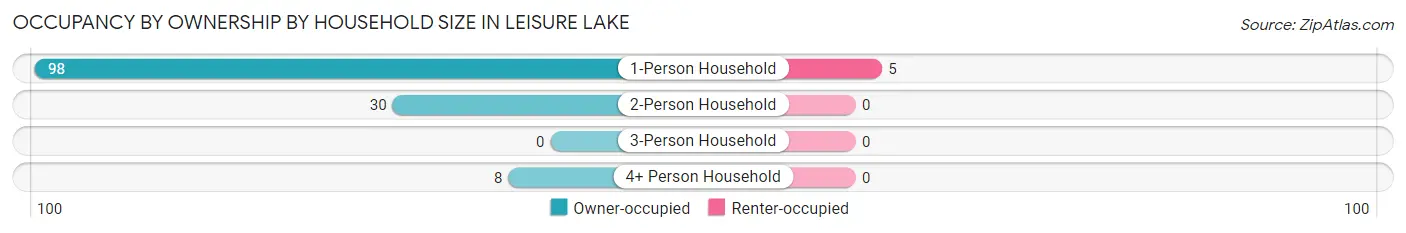
| Household Size | Owner-occupied | Renter-occupied |
| 1-Person Household | 98 (95.2%) | 5 (4.9%) |
| 2-Person Household | 30 (100.0%) | 0 (0.0%) |
| 3-Person Household | 0 (0.0%) | 0 (0.0%) |
| 4+ Person Household | 8 (100.0%) | 0 (0.0%) |
| Total Housing Units | 136 (96.5%) | 5 (3.5%) |
Occupancy by Educational Attainment in Leisure Lake
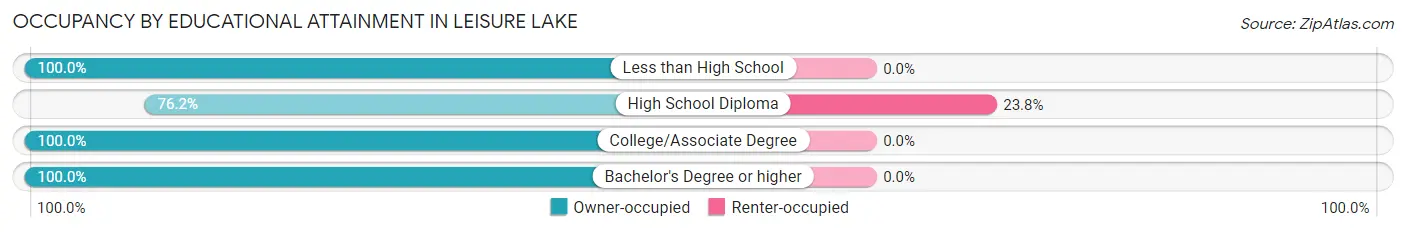
| Household Size | Owner-occupied | Renter-occupied |
| Less than High School | 106 (100.0%) | 0 (0.0%) |
| High School Diploma | 16 (76.2%) | 5 (23.8%) |
| College/Associate Degree | 5 (100.0%) | 0 (0.0%) |
| Bachelor's Degree or higher | 9 (100.0%) | 0 (0.0%) |
Occupancy by Age of Householder in Leisure Lake
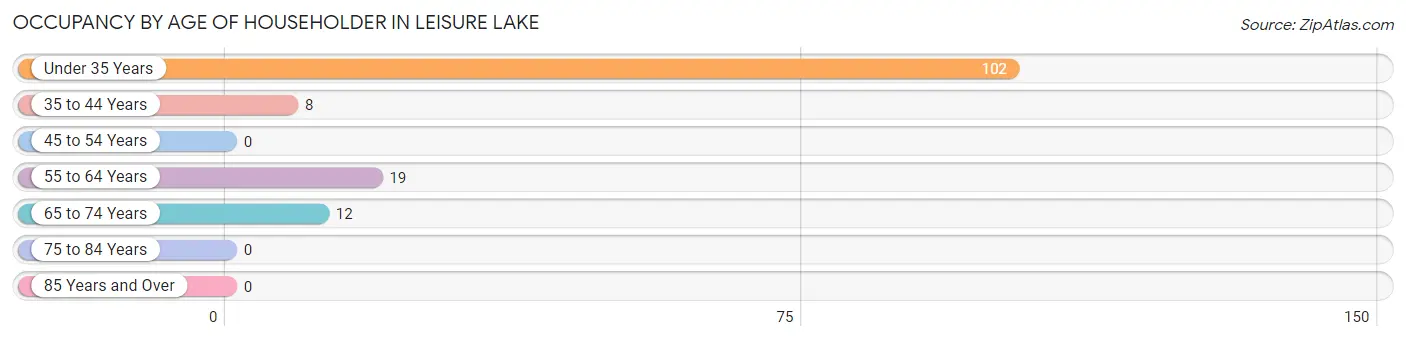
| Age Bracket | # Households | % Households |
| Under 35 Years | 102 | 72.3% |
| 35 to 44 Years | 8 | 5.7% |
| 45 to 54 Years | 0 | 0.0% |
| 55 to 64 Years | 19 | 13.5% |
| 65 to 74 Years | 12 | 8.5% |
| 75 to 84 Years | 0 | 0.0% |
| 85 Years and Over | 0 | 0.0% |
| Total | 141 | 100.0% |
Housing Finances in Leisure Lake
Median Income by Occupancy in Leisure Lake
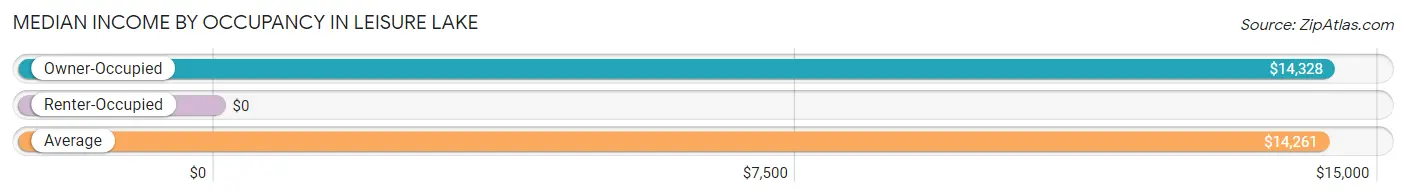
| Occupancy Type | # Households | Median Income |
| Owner-Occupied | 136 (96.5%) | $14,328 |
| Renter-Occupied | 5 (3.5%) | $0 |
| Average | 141 (100.0%) | $14,261 |
Occupancy by Householder Income Bracket in Leisure Lake
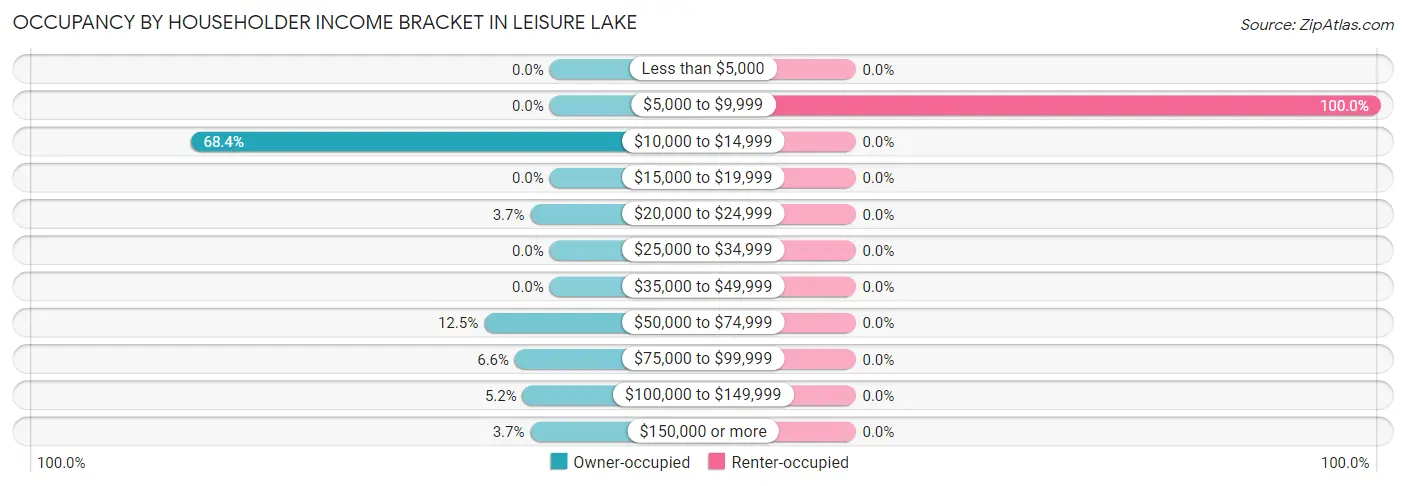
| Income Bracket | Owner-occupied | Renter-occupied |
| Less than $5,000 | 0 (0.0%) | 0 (0.0%) |
| $5,000 to $9,999 | 0 (0.0%) | 5 (100.0%) |
| $10,000 to $14,999 | 93 (68.4%) | 0 (0.0%) |
| $15,000 to $19,999 | 0 (0.0%) | 0 (0.0%) |
| $20,000 to $24,999 | 5 (3.7%) | 0 (0.0%) |
| $25,000 to $34,999 | 0 (0.0%) | 0 (0.0%) |
| $35,000 to $49,999 | 0 (0.0%) | 0 (0.0%) |
| $50,000 to $74,999 | 17 (12.5%) | 0 (0.0%) |
| $75,000 to $99,999 | 9 (6.6%) | 0 (0.0%) |
| $100,000 to $149,999 | 7 (5.1%) | 0 (0.0%) |
| $150,000 or more | 5 (3.7%) | 0 (0.0%) |
| Total | 136 (100.0%) | 5 (100.0%) |
Monthly Housing Cost Tiers in Leisure Lake
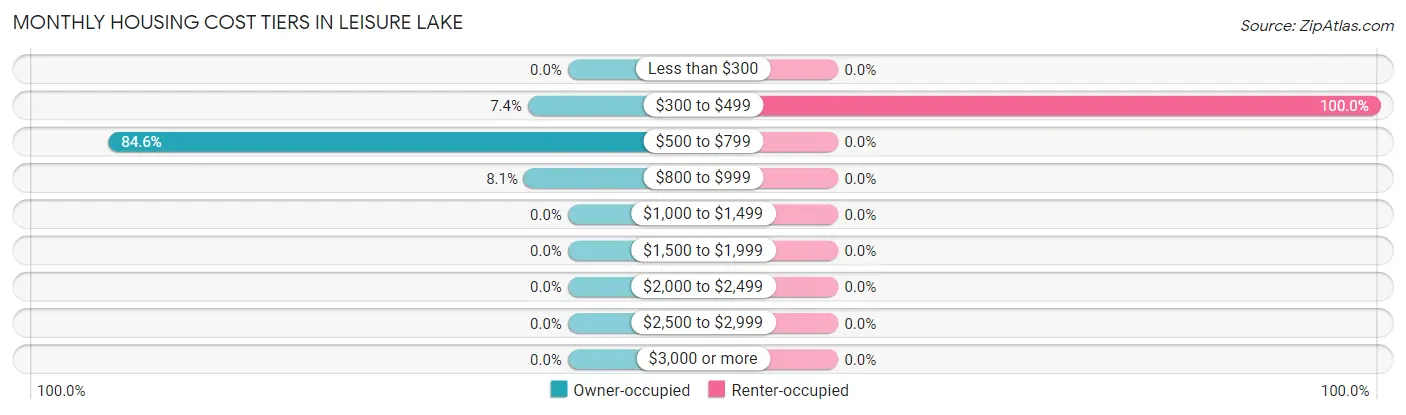
| Monthly Cost | Owner-occupied | Renter-occupied |
| Less than $300 | 0 (0.0%) | 0 (0.0%) |
| $300 to $499 | 10 (7.3%) | 5 (100.0%) |
| $500 to $799 | 115 (84.6%) | 0 (0.0%) |
| $800 to $999 | 11 (8.1%) | 0 (0.0%) |
| $1,000 to $1,499 | 0 (0.0%) | 0 (0.0%) |
| $1,500 to $1,999 | 0 (0.0%) | 0 (0.0%) |
| $2,000 to $2,499 | 0 (0.0%) | 0 (0.0%) |
| $2,500 to $2,999 | 0 (0.0%) | 0 (0.0%) |
| $3,000 or more | 0 (0.0%) | 0 (0.0%) |
| Total | 136 (100.0%) | 5 (100.0%) |
Physical Housing Characteristics in Leisure Lake
Housing Structures in Leisure Lake
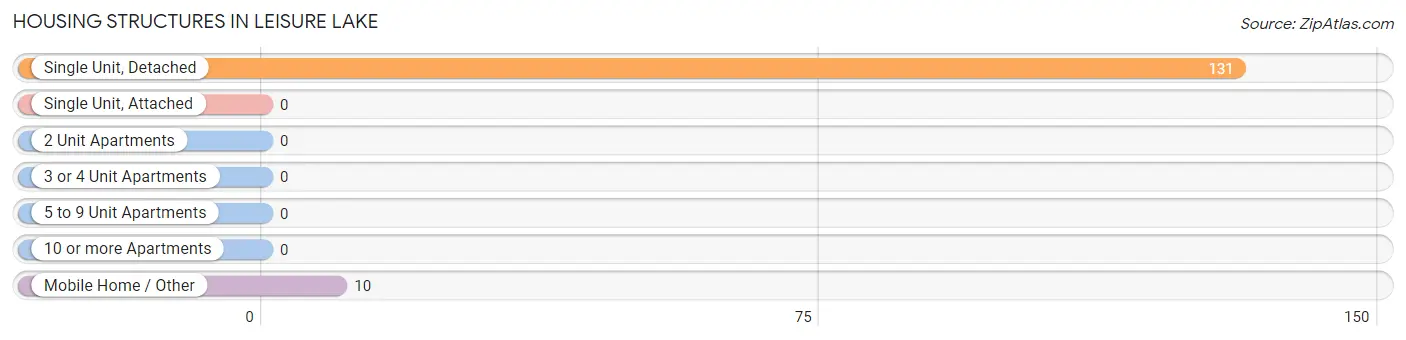
| Structure Type | # Housing Units | % Housing Units |
| Single Unit, Detached | 131 | 92.9% |
| Single Unit, Attached | 0 | 0.0% |
| 2 Unit Apartments | 0 | 0.0% |
| 3 or 4 Unit Apartments | 0 | 0.0% |
| 5 to 9 Unit Apartments | 0 | 0.0% |
| 10 or more Apartments | 0 | 0.0% |
| Mobile Home / Other | 10 | 7.1% |
| Total | 141 | 100.0% |
Housing Structures by Occupancy in Leisure Lake
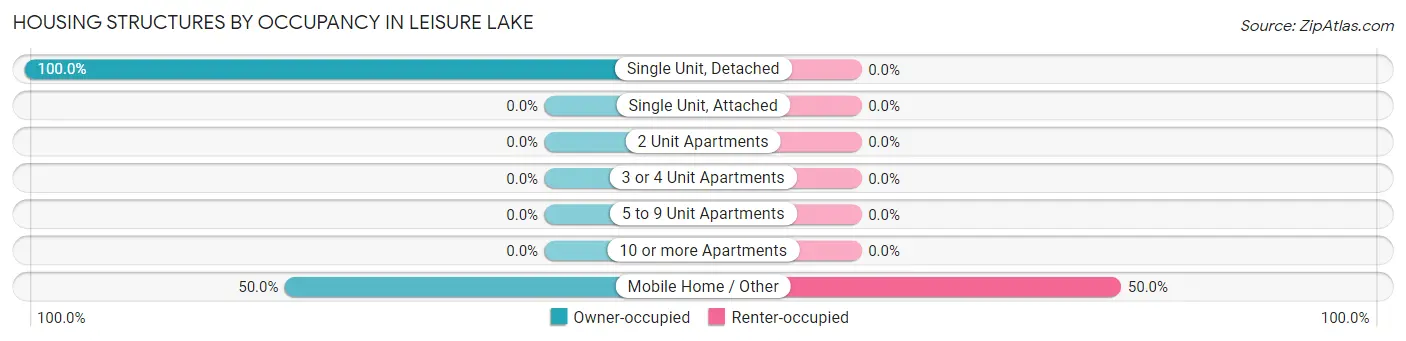
| Structure Type | Owner-occupied | Renter-occupied |
| Single Unit, Detached | 131 (100.0%) | 0 (0.0%) |
| Single Unit, Attached | 0 (0.0%) | 0 (0.0%) |
| 2 Unit Apartments | 0 (0.0%) | 0 (0.0%) |
| 3 or 4 Unit Apartments | 0 (0.0%) | 0 (0.0%) |
| 5 to 9 Unit Apartments | 0 (0.0%) | 0 (0.0%) |
| 10 or more Apartments | 0 (0.0%) | 0 (0.0%) |
| Mobile Home / Other | 5 (50.0%) | 5 (50.0%) |
| Total | 136 (96.5%) | 5 (3.5%) |
Housing Structures by Number of Rooms in Leisure Lake
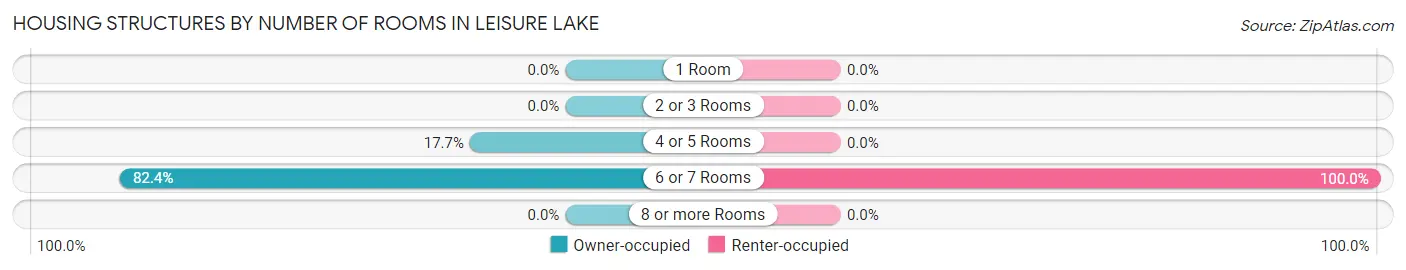
| Number of Rooms | Owner-occupied | Renter-occupied |
| 1 Room | 0 (0.0%) | 0 (0.0%) |
| 2 or 3 Rooms | 0 (0.0%) | 0 (0.0%) |
| 4 or 5 Rooms | 24 (17.6%) | 0 (0.0%) |
| 6 or 7 Rooms | 112 (82.4%) | 5 (100.0%) |
| 8 or more Rooms | 0 (0.0%) | 0 (0.0%) |
| Total | 136 (100.0%) | 5 (100.0%) |
Housing Structure by Heating Type in Leisure Lake
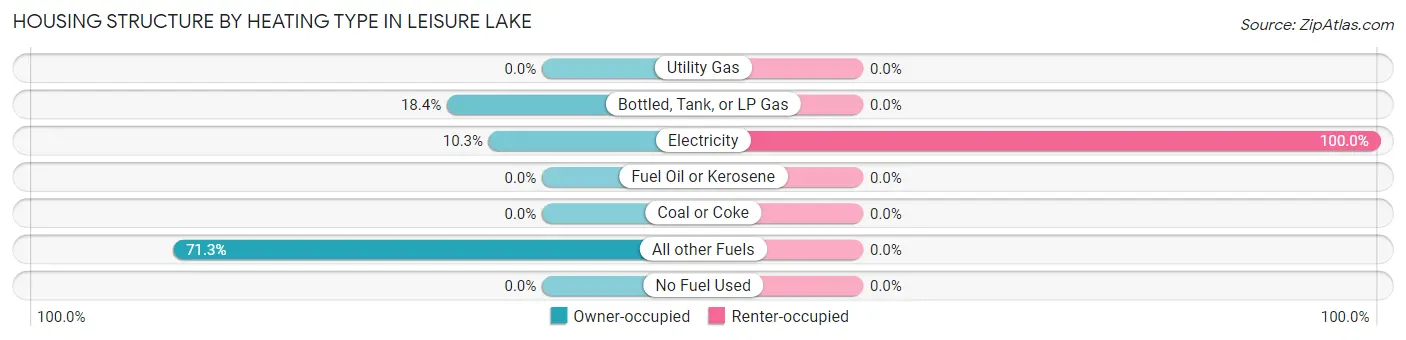
| Heating Type | Owner-occupied | Renter-occupied |
| Utility Gas | 0 (0.0%) | 0 (0.0%) |
| Bottled, Tank, or LP Gas | 25 (18.4%) | 0 (0.0%) |
| Electricity | 14 (10.3%) | 5 (100.0%) |
| Fuel Oil or Kerosene | 0 (0.0%) | 0 (0.0%) |
| Coal or Coke | 0 (0.0%) | 0 (0.0%) |
| All other Fuels | 97 (71.3%) | 0 (0.0%) |
| No Fuel Used | 0 (0.0%) | 0 (0.0%) |
| Total | 136 (100.0%) | 5 (100.0%) |
Household Vehicle Usage in Leisure Lake
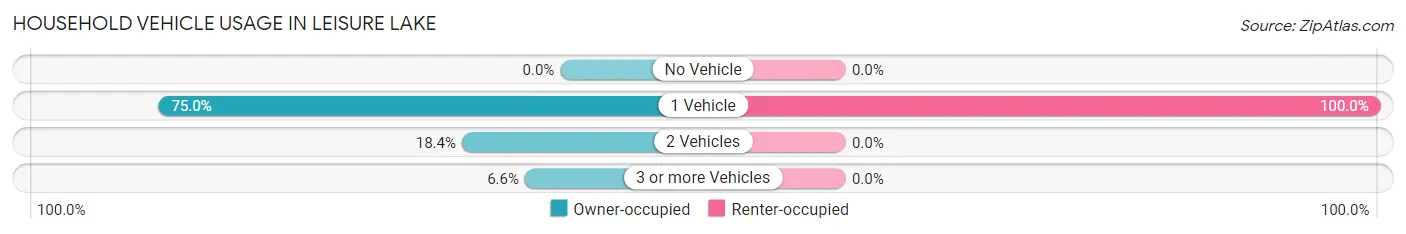
| Vehicles per Household | Owner-occupied | Renter-occupied |
| No Vehicle | 0 (0.0%) | 0 (0.0%) |
| 1 Vehicle | 102 (75.0%) | 5 (100.0%) |
| 2 Vehicles | 25 (18.4%) | 0 (0.0%) |
| 3 or more Vehicles | 9 (6.6%) | 0 (0.0%) |
| Total | 136 (100.0%) | 5 (100.0%) |
Real Estate & Mortgages in Leisure Lake
Real Estate and Mortgage Overview in Leisure Lake
| Characteristic | Without Mortgage | With Mortgage |
| Housing Units | 15 | 121 |
| Median Property Value | $55,000 | $75,300 |
| Median Household Income | - | - |
| Monthly Housing Costs | $475 | $0 |
| Real Estate Taxes | $1,125 | $0 |
Property Value by Mortgage Status in Leisure Lake
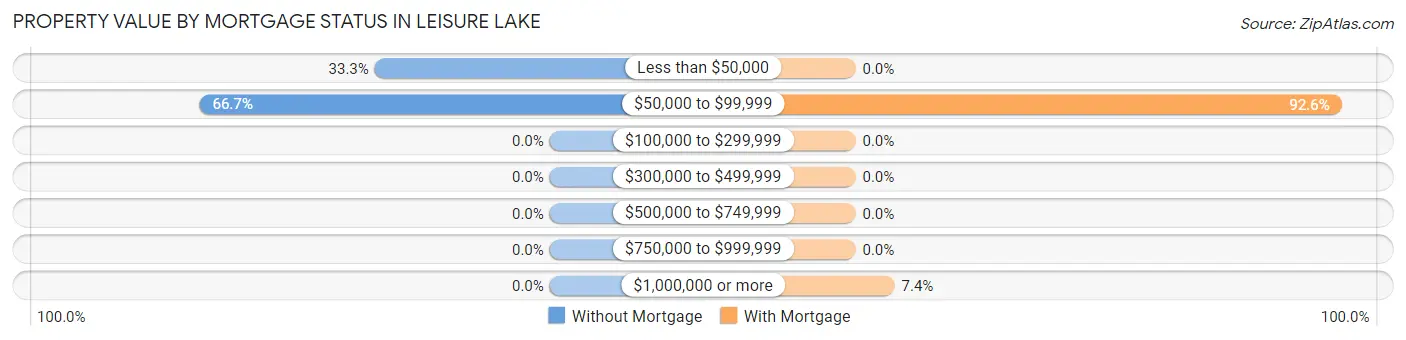
| Property Value | Without Mortgage | With Mortgage |
| Less than $50,000 | 5 (33.3%) | 0 (0.0%) |
| $50,000 to $99,999 | 10 (66.7%) | 112 (92.6%) |
| $100,000 to $299,999 | 0 (0.0%) | 0 (0.0%) |
| $300,000 to $499,999 | 0 (0.0%) | 0 (0.0%) |
| $500,000 to $749,999 | 0 (0.0%) | 0 (0.0%) |
| $750,000 to $999,999 | 0 (0.0%) | 0 (0.0%) |
| $1,000,000 or more | 0 (0.0%) | 9 (7.4%) |
| Total | 15 (100.0%) | 121 (100.0%) |
Household Income by Mortgage Status in Leisure Lake
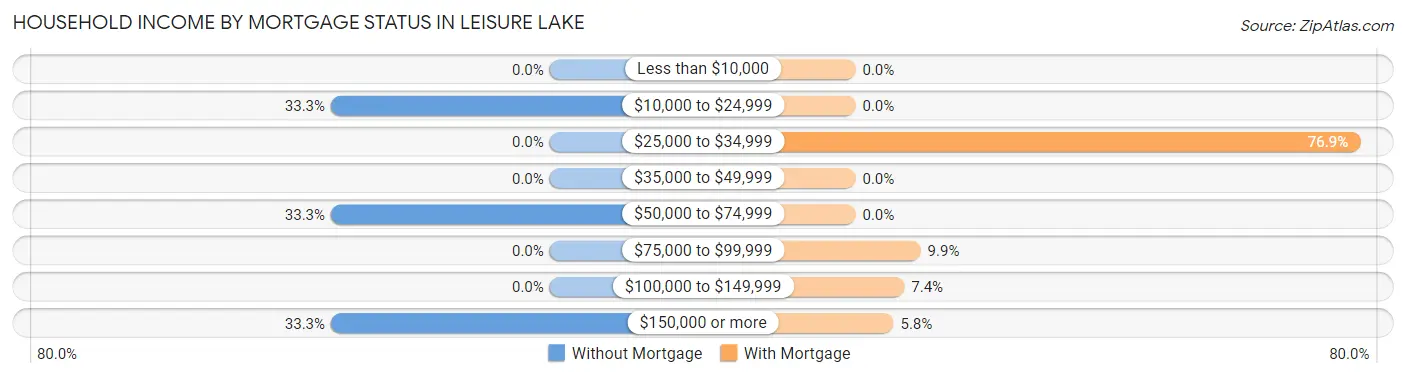
| Household Income | Without Mortgage | With Mortgage |
| Less than $10,000 | 0 (0.0%) | 0 (0.0%) |
| $10,000 to $24,999 | 5 (33.3%) | 0 (0.0%) |
| $25,000 to $34,999 | 0 (0.0%) | 93 (76.9%) |
| $35,000 to $49,999 | 0 (0.0%) | 0 (0.0%) |
| $50,000 to $74,999 | 5 (33.3%) | 0 (0.0%) |
| $75,000 to $99,999 | 0 (0.0%) | 12 (9.9%) |
| $100,000 to $149,999 | 0 (0.0%) | 9 (7.4%) |
| $150,000 or more | 5 (33.3%) | 7 (5.8%) |
| Total | 15 (100.0%) | 121 (100.0%) |
Property Value to Household Income Ratio in Leisure Lake
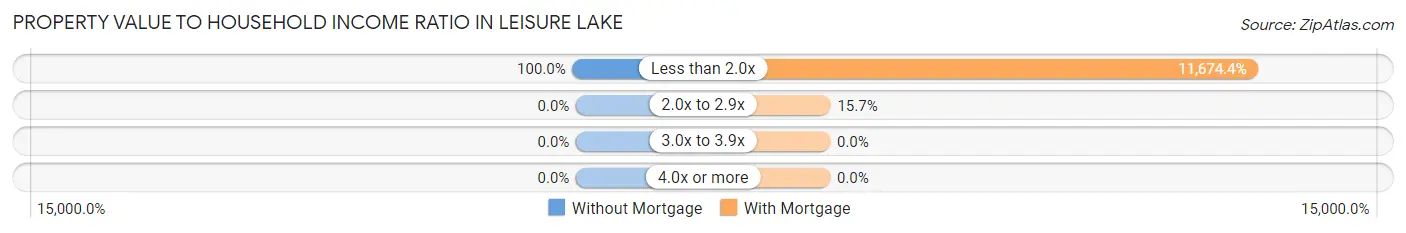
| Value-to-Income Ratio | Without Mortgage | With Mortgage |
| Less than 2.0x | 15 (100.0%) | 14,126 (11,674.4%) |
| 2.0x to 2.9x | 0 (0.0%) | 19 (15.7%) |
| 3.0x to 3.9x | 0 (0.0%) | 0 (0.0%) |
| 4.0x or more | 0 (0.0%) | 0 (0.0%) |
| Total | 15 (100.0%) | 121 (100.0%) |
Real Estate Taxes by Mortgage Status in Leisure Lake
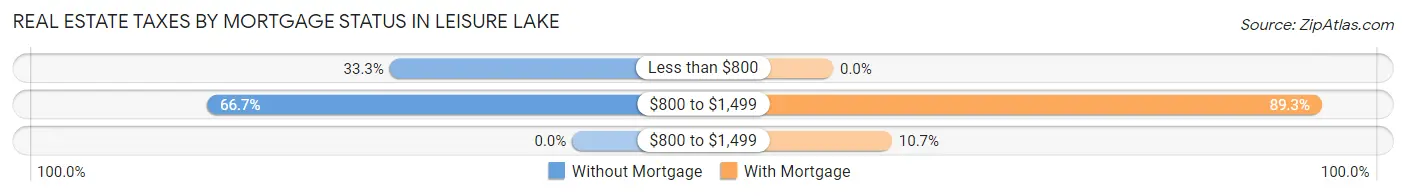
| Property Taxes | Without Mortgage | With Mortgage |
| Less than $800 | 5 (33.3%) | 0 (0.0%) |
| $800 to $1,499 | 10 (66.7%) | 108 (89.3%) |
| $800 to $1,499 | 0 (0.0%) | 13 (10.7%) |
| Total | 15 (100.0%) | 121 (100.0%) |
Health & Disability in Leisure Lake
Health Insurance Coverage by Age in Leisure Lake
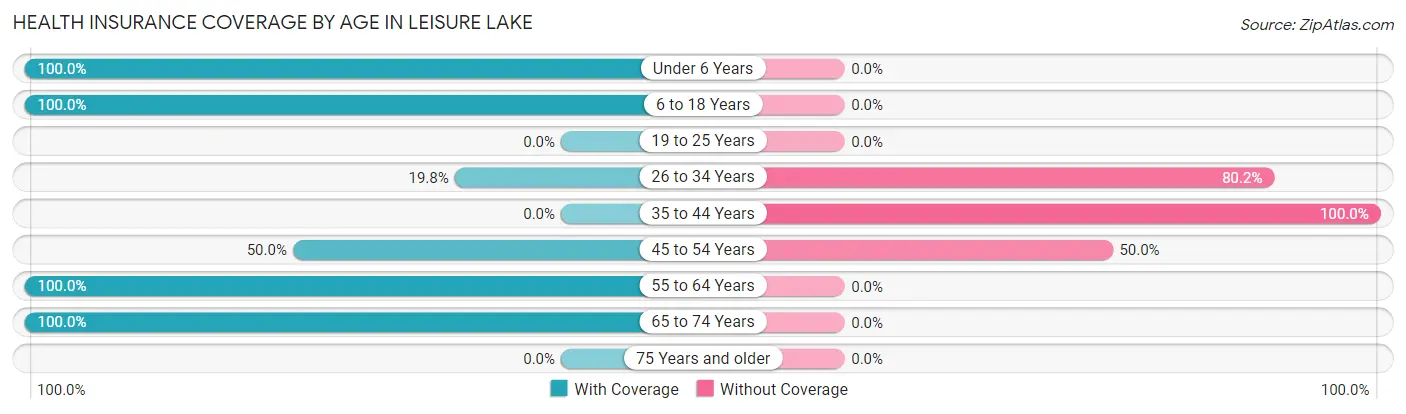
| Age Bracket | With Coverage | Without Coverage |
| Under 6 Years | 9 (100.0%) | 0 (0.0%) |
| 6 to 18 Years | 18 (100.0%) | 0 (0.0%) |
| 19 to 25 Years | 0 (0.0%) | 0 (0.0%) |
| 26 to 34 Years | 23 (19.8%) | 93 (80.2%) |
| 35 to 44 Years | 0 (0.0%) | 8 (100.0%) |
| 45 to 54 Years | 3 (50.0%) | 3 (50.0%) |
| 55 to 64 Years | 30 (100.0%) | 0 (0.0%) |
| 65 to 74 Years | 12 (100.0%) | 0 (0.0%) |
| 75 Years and older | 0 (0.0%) | 0 (0.0%) |
| Total | 95 (47.7%) | 104 (52.3%) |
Health Insurance Coverage by Citizenship Status in Leisure Lake
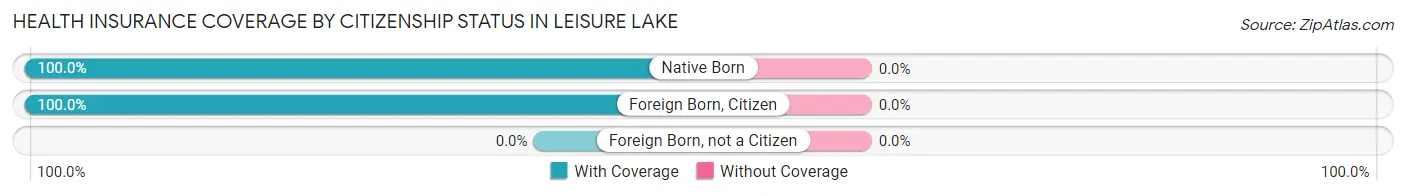
| Citizenship Status | With Coverage | Without Coverage |
| Native Born | 9 (100.0%) | 0 (0.0%) |
| Foreign Born, Citizen | 18 (100.0%) | 0 (0.0%) |
| Foreign Born, not a Citizen | 0 (0.0%) | 0 (0.0%) |
Health Insurance Coverage by Household Income in Leisure Lake
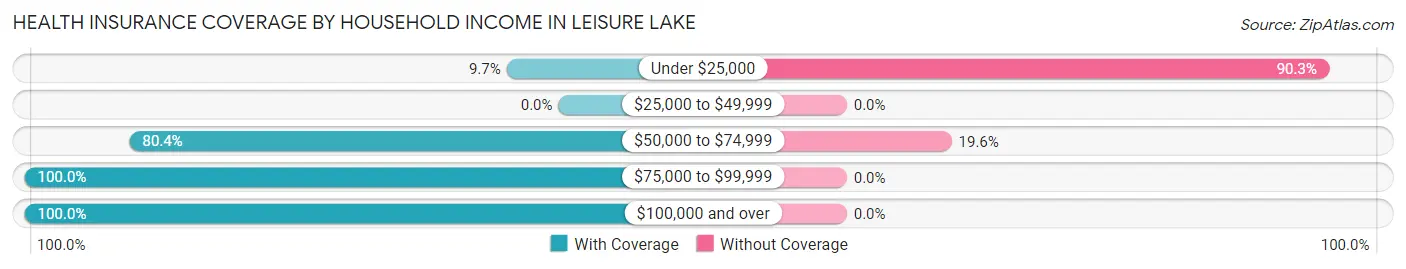
| Household Income | With Coverage | Without Coverage |
| Under $25,000 | 10 (9.7%) | 93 (90.3%) |
| $25,000 to $49,999 | 0 (0.0%) | 0 (0.0%) |
| $50,000 to $74,999 | 45 (80.4%) | 11 (19.6%) |
| $75,000 to $99,999 | 17 (100.0%) | 0 (0.0%) |
| $100,000 and over | 23 (100.0%) | 0 (0.0%) |
Public vs Private Health Insurance Coverage by Age in Leisure Lake
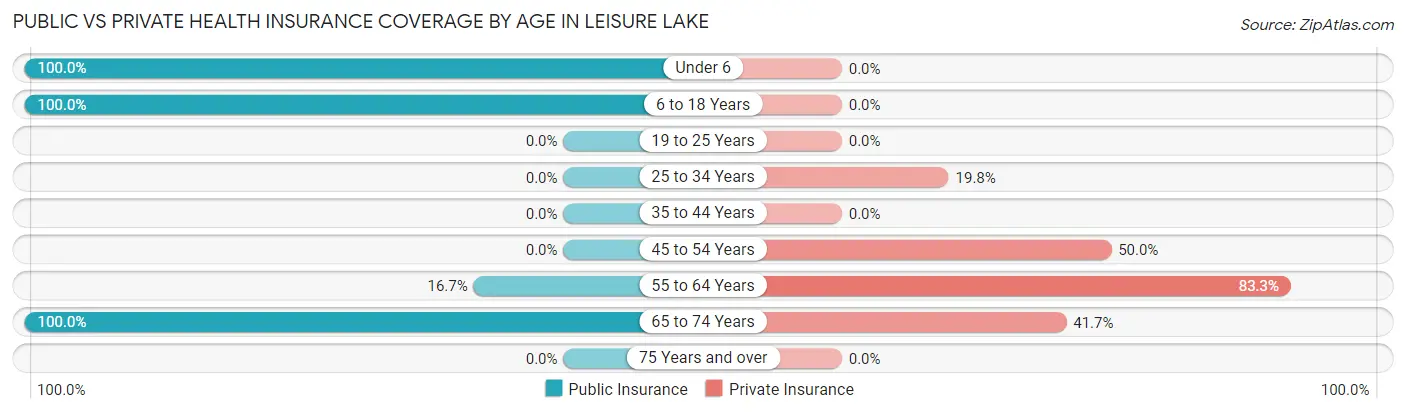
| Age Bracket | Public Insurance | Private Insurance |
| Under 6 | 9 (100.0%) | 0 (0.0%) |
| 6 to 18 Years | 18 (100.0%) | 0 (0.0%) |
| 19 to 25 Years | 0 (0.0%) | 0 (0.0%) |
| 25 to 34 Years | 0 (0.0%) | 23 (19.8%) |
| 35 to 44 Years | 0 (0.0%) | 0 (0.0%) |
| 45 to 54 Years | 0 (0.0%) | 3 (50.0%) |
| 55 to 64 Years | 5 (16.7%) | 25 (83.3%) |
| 65 to 74 Years | 12 (100.0%) | 5 (41.7%) |
| 75 Years and over | 0 (0.0%) | 0 (0.0%) |
| Total | 44 (22.1%) | 56 (28.1%) |
Disability Status by Sex by Age in Leisure Lake
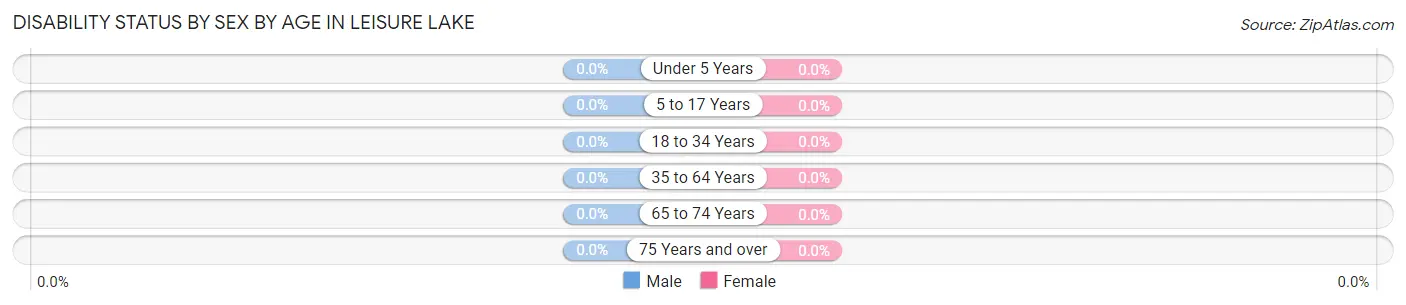
| Age Bracket | Male | Female |
| Under 5 Years | 0 (0.0%) | 0 (0.0%) |
| 5 to 17 Years | 0 (0.0%) | 0 (0.0%) |
| 18 to 34 Years | 0 (0.0%) | 0 (0.0%) |
| 35 to 64 Years | 0 (0.0%) | 0 (0.0%) |
| 65 to 74 Years | 0 (0.0%) | 0 (0.0%) |
| 75 Years and over | 0 (0.0%) | 0 (0.0%) |
Disability Class by Sex by Age in Leisure Lake
Disability Class: Hearing Difficulty
| Age Bracket | Male | Female |
| Under 5 Years | 0 (0.0%) | 0 (0.0%) |
| 5 to 17 Years | 0 (0.0%) | 0 (0.0%) |
| 18 to 34 Years | 0 (0.0%) | 0 (0.0%) |
| 35 to 64 Years | 0 (0.0%) | 0 (0.0%) |
| 65 to 74 Years | 0 (0.0%) | 0 (0.0%) |
| 75 Years and over | 0 (0.0%) | 0 (0.0%) |
Disability Class: Vision Difficulty
| Age Bracket | Male | Female |
| Under 5 Years | 0 (0.0%) | 0 (0.0%) |
| 5 to 17 Years | 0 (0.0%) | 0 (0.0%) |
| 18 to 34 Years | 0 (0.0%) | 0 (0.0%) |
| 35 to 64 Years | 0 (0.0%) | 0 (0.0%) |
| 65 to 74 Years | 0 (0.0%) | 0 (0.0%) |
| 75 Years and over | 0 (0.0%) | 0 (0.0%) |
Disability Class: Cognitive Difficulty
| Age Bracket | Male | Female |
| 5 to 17 Years | 0 (0.0%) | 0 (0.0%) |
| 18 to 34 Years | 0 (0.0%) | 0 (0.0%) |
| 35 to 64 Years | 0 (0.0%) | 0 (0.0%) |
| 65 to 74 Years | 0 (0.0%) | 0 (0.0%) |
| 75 Years and over | 0 (0.0%) | 0 (0.0%) |
Disability Class: Ambulatory Difficulty
| Age Bracket | Male | Female |
| 5 to 17 Years | 0 (0.0%) | 0 (0.0%) |
| 18 to 34 Years | 0 (0.0%) | 0 (0.0%) |
| 35 to 64 Years | 0 (0.0%) | 0 (0.0%) |
| 65 to 74 Years | 0 (0.0%) | 0 (0.0%) |
| 75 Years and over | 0 (0.0%) | 0 (0.0%) |
Disability Class: Self-Care Difficulty

| Age Bracket | Male | Female |
| 5 to 17 Years | 0 (0.0%) | 0 (0.0%) |
| 18 to 34 Years | 0 (0.0%) | 0 (0.0%) |
| 35 to 64 Years | 0 (0.0%) | 0 (0.0%) |
| 65 to 74 Years | 0 (0.0%) | 0 (0.0%) |
| 75 Years and over | 0 (0.0%) | 0 (0.0%) |
Technology Access in Leisure Lake
Computing Device Access in Leisure Lake
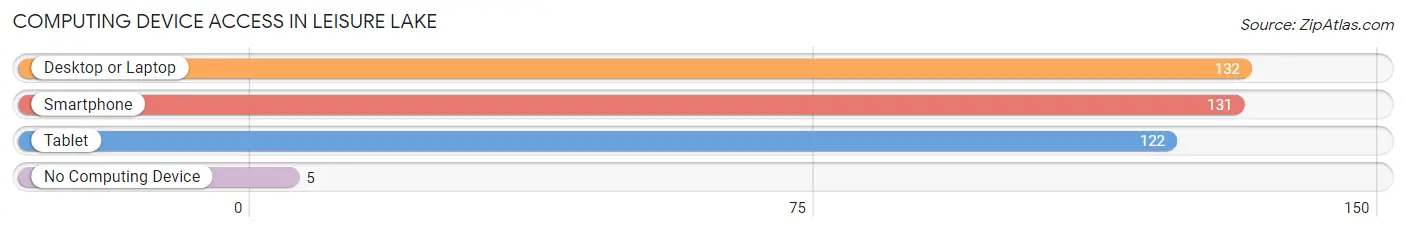
| Device Type | # Households | % Households |
| Desktop or Laptop | 132 | 93.6% |
| Smartphone | 131 | 92.9% |
| Tablet | 122 | 86.5% |
| No Computing Device | 5 | 3.5% |
| Total | 141 | 100.0% |
Internet Access in Leisure Lake
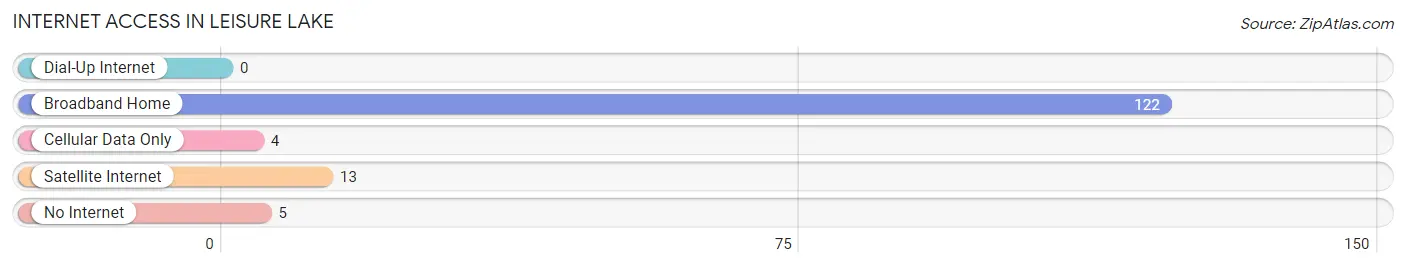
| Internet Type | # Households | % Households |
| Dial-Up Internet | 0 | 0.0% |
| Broadband Home | 122 | 86.5% |
| Cellular Data Only | 4 | 2.8% |
| Satellite Internet | 13 | 9.2% |
| No Internet | 5 | 3.5% |
| Total | 141 | 100.0% |
Leisure Lake Summary
Leisure Lake, Missouri is a small unincorporated community located in the southeastern corner of the state, in Stoddard County. It is situated on the banks of the Leisure Lake, a man-made lake created in the early 1900s. The lake is a popular destination for fishing, swimming, and boating.
History
Leisure Lake was first settled in the late 1800s by a group of settlers from the nearby town of Dexter. The settlers were attracted to the area by the abundance of natural resources, including timber, fish, and game. The lake was created in the early 1900s by damming a nearby creek. The lake was named after the settlers who had settled in the area.
In the early 1900s, the area around Leisure Lake was a popular destination for hunting and fishing. The lake was stocked with bass, catfish, and other game fish. The area also had a thriving timber industry, with several sawmills located in the area.
In the 1950s, the area around Leisure Lake began to develop as a recreational destination. The lake was stocked with largemouth bass, and a number of resorts and campgrounds were built around the lake. The area also became a popular destination for boating and water skiing.
Geography
Leisure Lake is located in the southeastern corner of Missouri, in Stoddard County. The lake is situated on the banks of the Leisure Lake, a man-made lake created in the early 1900s. The lake is approximately 1,000 acres in size and is surrounded by wooded hills and bluffs. The lake is fed by several small creeks and streams, and is a popular destination for fishing, swimming, and boating.
The area around Leisure Lake is mostly rural, with a few small towns and villages located nearby. The nearest major city is Cape Girardeau, which is located about 25 miles to the north.
Economy
The economy of Leisure Lake is largely based on tourism and recreation. The lake is a popular destination for fishing, swimming, and boating, and there are several resorts and campgrounds located around the lake. The area also has a thriving timber industry, with several sawmills located in the area.
In addition to tourism and recreation, the area around Leisure Lake is also home to several small businesses, including restaurants, convenience stores, and gas stations.
Demographics
As of the 2010 census, the population of Leisure Lake was 1,072. The population is mostly white (97.2%), with a small percentage of African Americans (1.2%) and Hispanics (1.6%). The median household income in Leisure Lake is $37,500, and the median age is 44. The unemployment rate in Leisure Lake is 5.2%, which is slightly higher than the national average.
Common Questions
What is Per Capita Income in Leisure Lake?
Per Capita income in Leisure Lake is $27,541.
What is the Median Family Income in Leisure Lake?
Median Family Income in Leisure Lake is $93,611.
What is the Median Household income in Leisure Lake?
Median Household Income in Leisure Lake is $14,261.
What is Income or Wage Gap in Leisure Lake?
Income or Wage Gap in Leisure Lake is 73.6%.
Women in Leisure Lake earn 26.4 cents for every dollar earned by a man.
What is Inequality or Gini Index in Leisure Lake?
Inequality or Gini Index in Leisure Lake is 0.54.
What is the Total Population of Leisure Lake?
Total Population of Leisure Lake is 199.
What is the Total Male Population of Leisure Lake?
Total Male Population of Leisure Lake is 62.
What is the Total Female Population of Leisure Lake?
Total Female Population of Leisure Lake is 137.
What is the Ratio of Males per 100 Females in Leisure Lake?
There are 45.26 Males per 100 Females in Leisure Lake.
What is the Ratio of Females per 100 Males in Leisure Lake?
There are 220.97 Females per 100 Males in Leisure Lake.
What is the Median Population Age in Leisure Lake?
Median Population Age in Leisure Lake is 33.5 Years.
What is the Average Family Size in Leisure Lake
Average Family Size in Leisure Lake is 2.6 People.
What is the Average Household Size in Leisure Lake
Average Household Size in Leisure Lake is 1.4 People.
How Large is the Labor Force in Leisure Lake?
There are 169 People in the Labor Forcein in Leisure Lake.
What is the Percentage of People in the Labor Force in Leisure Lake?
98.3% of People are in the Labor Force in Leisure Lake.