Zip Codes with the Highest Percentage of Families with Income Above $200,000 in Kansas City, MO
RELATED REPORTS & OPTIONS
Family Income | $200k+
Kansas City
Compare Zip Codes
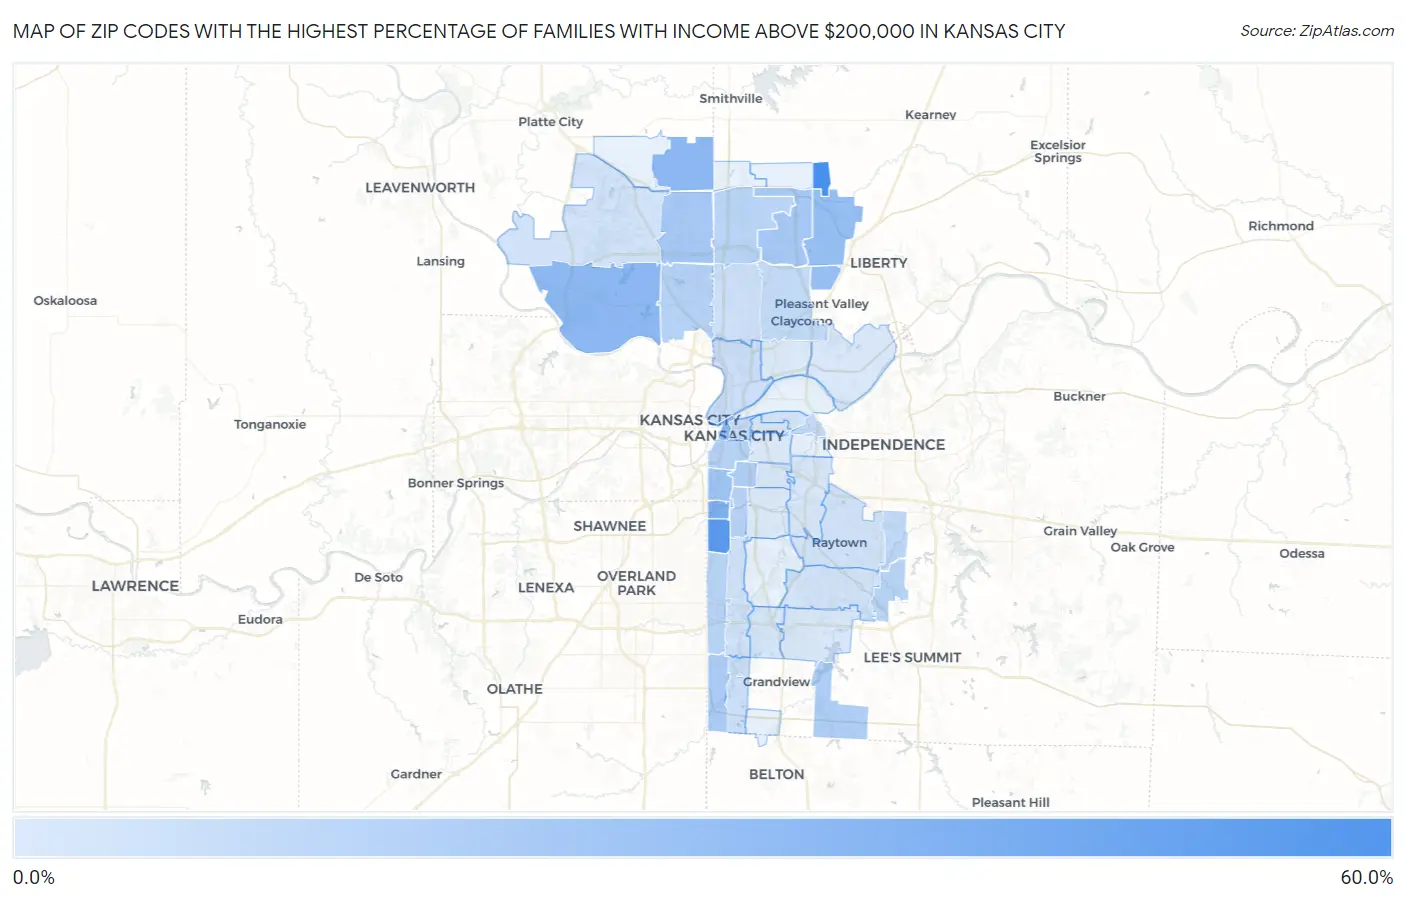
Map of Zip Codes with the Highest Percentage of Families with Income Above $200,000 in Kansas City
0.70%
56.8%
Zip Codes with the Highest Percentage of Families with Income Above $200,000 in Kansas City, MO
| Zip Code | Families with Income > $200k | vs State | vs National | |
| 1. | 64167 | 56.8% | 10.1%(+46.7)#5 | 14.8%(+42.0)#391 |
| 2. | 64113 | 49.4% | 10.1%(+39.3)#8 | 14.8%(+34.6)#698 |
| 3. | 64112 | 33.5% | 10.1%(+23.4)#23 | 14.8%(+18.7)#2,028 |
| 4. | 64164 | 28.0% | 10.1%(+17.9)#30 | 14.8%(+13.2)#2,873 |
| 5. | 64152 | 27.6% | 10.1%(+17.5)#32 | 14.8%(+12.8)#2,928 |
| 6. | 64105 | 27.5% | 10.1%(+17.4)#33 | 14.8%(+12.7)#2,958 |
| 7. | 64157 | 24.2% | 10.1%(+14.1)#44 | 14.8%(+9.40)#3,657 |
| 8. | 64158 | 23.9% | 10.1%(+13.8)#47 | 14.8%(+9.10)#3,740 |
| 9. | 64111 | 21.2% | 10.1%(+11.1)#55 | 14.8%(+6.40)#4,446 |
| 10. | 64154 | 18.7% | 10.1%(+8.60)#72 | 14.8%(+3.90)#5,289 |
| 11. | 64156 | 18.5% | 10.1%(+8.40)#74 | 14.8%(+3.70)#5,372 |
| 12. | 64145 | 15.9% | 10.1%(+5.80)#88 | 14.8%(+1.10)#6,507 |
| 13. | 64149 | 15.6% | 10.1%(+5.50)#93 | 14.8%(+0.800)#6,671 |
| 14. | 64109 | 14.3% | 10.1%(+4.20)#110 | 14.8%(-0.500)#7,389 |
| 15. | 64151 | 12.8% | 10.1%(+2.70)#129 | 14.8%(-2.00)#8,361 |
| 16. | 64108 | 12.7% | 10.1%(+2.60)#133 | 14.8%(-2.10)#8,435 |
| 17. | 64110 | 12.4% | 10.1%(+2.30)#138 | 14.8%(-2.40)#8,658 |
| 18. | 64114 | 11.3% | 10.1%(+1.20)#152 | 14.8%(-3.50)#9,537 |
| 19. | 64155 | 11.2% | 10.1%(+1.10)#153 | 14.8%(-3.60)#9,620 |
| 20. | 64139 | 11.2% | 10.1%(+1.10)#154 | 14.8%(-3.60)#9,664 |
| 21. | 64136 | 9.6% | 10.1%(-0.500)#185 | 14.8%(-5.20)#11,271 |
| 22. | 64125 | 8.8% | 10.1%(-1.30)#209 | 14.8%(-6.00)#12,189 |
| 23. | 64119 | 8.3% | 10.1%(-1.80)#219 | 14.8%(-6.50)#12,770 |
| 24. | 64106 | 7.1% | 10.1%(-3.00)#269 | 14.8%(-7.70)#14,512 |
| 25. | 64116 | 6.4% | 10.1%(-3.70)#314 | 14.8%(-8.40)#15,710 |
| 26. | 64118 | 5.4% | 10.1%(-4.70)#364 | 14.8%(-9.40)#17,566 |
| 27. | 64146 | 5.3% | 10.1%(-4.80)#375 | 14.8%(-9.50)#17,930 |
| 28. | 64153 | 4.5% | 10.1%(-5.60)#431 | 14.8%(-10.3)#19,428 |
| 29. | 64133 | 4.2% | 10.1%(-5.90)#443 | 14.8%(-10.6)#19,986 |
| 30. | 64131 | 4.0% | 10.1%(-6.10)#458 | 14.8%(-10.8)#20,412 |
| 31. | 64138 | 3.9% | 10.1%(-6.20)#467 | 14.8%(-10.9)#20,628 |
| 32. | 64123 | 3.6% | 10.1%(-6.50)#490 | 14.8%(-11.2)#21,284 |
| 33. | 64137 | 2.5% | 10.1%(-7.60)#580 | 14.8%(-12.3)#23,519 |
| 34. | 64134 | 2.3% | 10.1%(-7.80)#608 | 14.8%(-12.5)#23,901 |
| 35. | 64128 | 2.2% | 10.1%(-7.90)#618 | 14.8%(-12.6)#24,110 |
| 36. | 64129 | 2.1% | 10.1%(-8.00)#630 | 14.8%(-12.7)#24,303 |
| 37. | 64161 | 2.1% | 10.1%(-8.00)#640 | 14.8%(-12.7)#24,431 |
| 38. | 64124 | 1.8% | 10.1%(-8.30)#659 | 14.8%(-13.0)#24,806 |
| 39. | 64127 | 1.0% | 10.1%(-9.10)#722 | 14.8%(-13.8)#26,084 |
| 40. | 64117 | 0.90% | 10.1%(-9.20)#732 | 14.8%(-13.9)#26,220 |
| 41. | 64130 | 0.70% | 10.1%(-9.40)#751 | 14.8%(-14.1)#26,466 |
1
Common Questions
What are the Top 10 Zip Codes with the Highest Percentage of Families with Income Above $200,000 in Kansas City, MO?
Top 10 Zip Codes with the Highest Percentage of Families with Income Above $200,000 in Kansas City, MO are:
What zip code has the Highest Percentage of Families with Income Above $200,000 in Kansas City, MO?
64167 has the Highest Percentage of Families with Income Above $200,000 in Kansas City, MO with 56.8%.
What is the Percentage of Families with Income Above $200,000 in Kansas City, MO?
Percentage of Families with Income Above $200,000 in Kansas City is 9.9%.
What is the Percentage of Families with Income Above $200,000 in Missouri?
Percentage of Families with Income Above $200,000 in Missouri is 10.1%.
What is the Percentage of Families with Income Above $200,000 in the United States?
Percentage of Families with Income Above $200,000 in the United States is 14.8%.