Lake Lotawana, MO Map & Demographics
Lake Lotawana Map
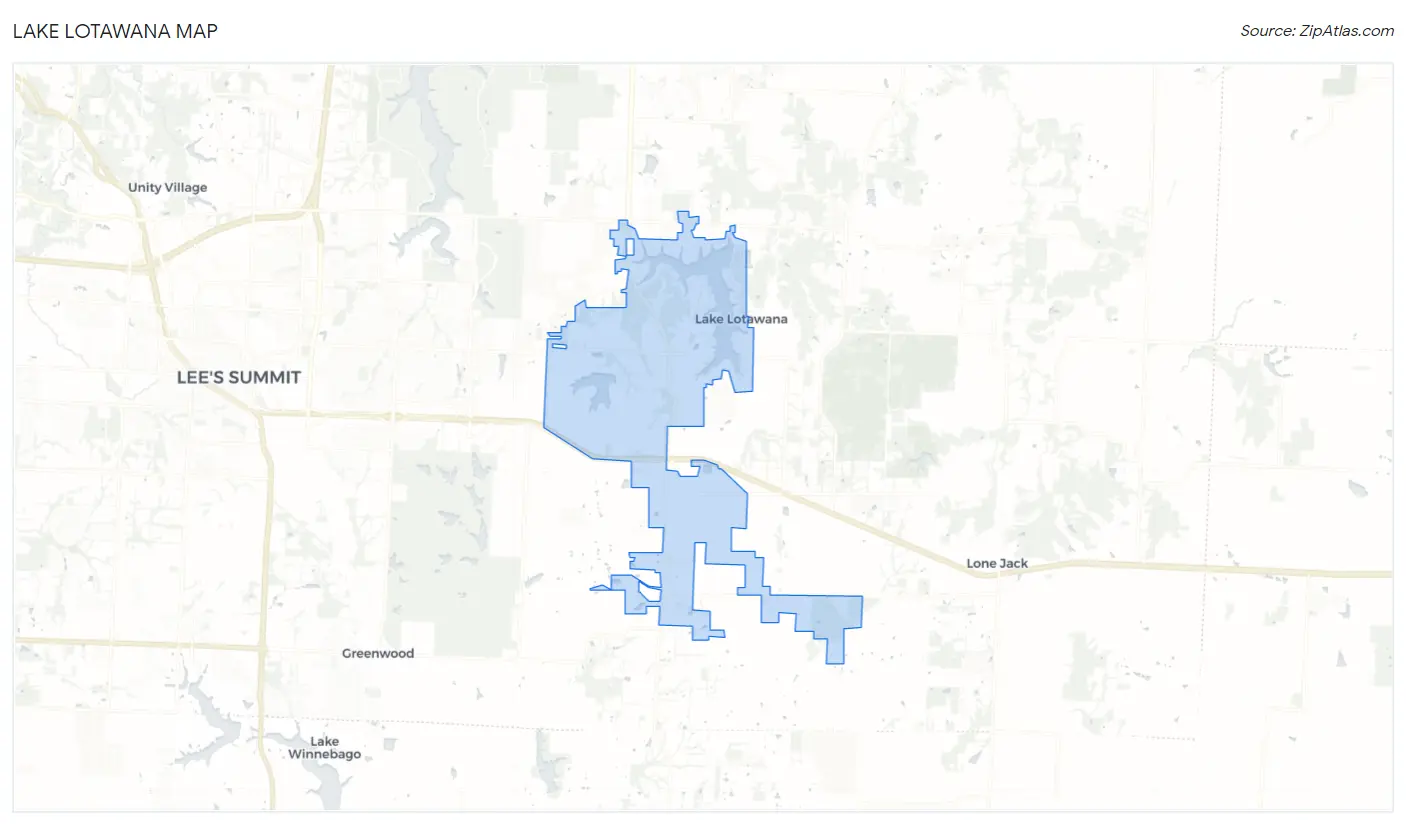
Lake Lotawana Overview
$75,223
PER CAPITA INCOME
$168,889
AVG FAMILY INCOME
$156,146
AVG HOUSEHOLD INCOME
36.9%
WAGE / INCOME GAP [ % ]
63.1¢/ $1
WAGE / INCOME GAP [ $ ]
0.44
INEQUALITY / GINI INDEX
3,017
TOTAL POPULATION
1,719
MALE POPULATION
1,298
FEMALE POPULATION
132.43
MALES / 100 FEMALES
75.51
FEMALES / 100 MALES
46.9
MEDIAN AGE
3.1
AVG FAMILY SIZE
2.7
AVG HOUSEHOLD SIZE
1,703
LABOR FORCE [ PEOPLE ]
70.7%
PERCENT IN LABOR FORCE
3.7%
UNEMPLOYMENT RATE
Lake Lotawana Area Codes
Income in Lake Lotawana
Income Overview in Lake Lotawana
Per Capita Income in Lake Lotawana is $75,223, while median incomes of families and households are $168,889 and $156,146 respectively.
| Characteristic | Number | Measure |
| Per Capita Income | 3,017 | $75,223 |
| Median Family Income | 872 | $168,889 |
| Mean Family Income | 872 | $221,530 |
| Median Household Income | 1,116 | $156,146 |
| Mean Household Income | 1,116 | $197,684 |
| Income Deficit | 872 | $0 |
| Wage / Income Gap (%) | 3,017 | 36.91% |
| Wage / Income Gap ($) | 3,017 | 63.09¢ per $1 |
| Gini / Inequality Index | 3,017 | 0.44 |
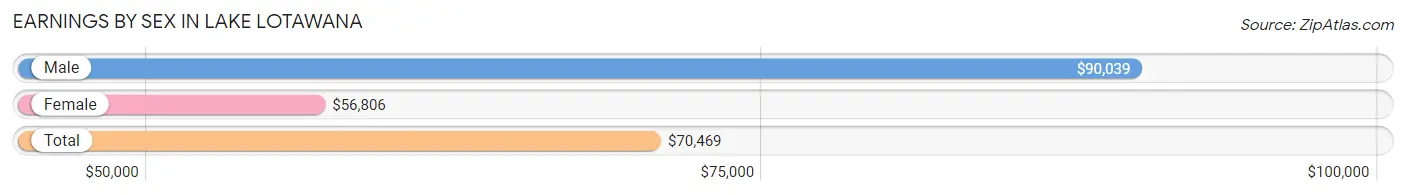
Earnings by Sex in Lake Lotawana
Average Earnings in Lake Lotawana are $70,469, $90,039 for men and $56,806 for women, a difference of 36.9%.
| Sex | Number | Average Earnings |
| Male | 917 (53.8%) | $90,039 |
| Female | 788 (46.2%) | $56,806 |
| Total | 1,705 (100.0%) | $70,469 |
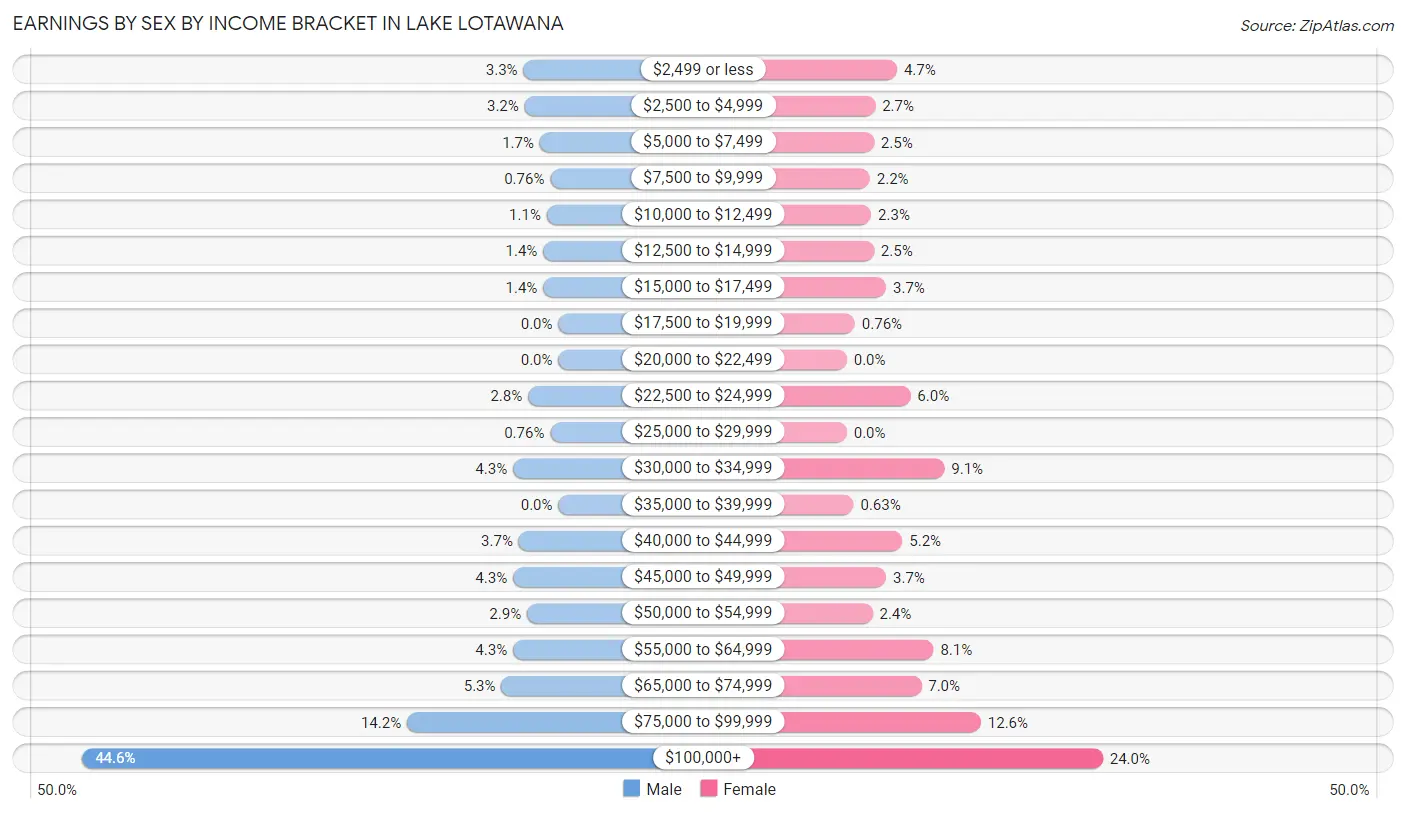
Earnings by Sex by Income Bracket in Lake Lotawana
The most common earnings brackets in Lake Lotawana are $100,000+ for men (409 | 44.6%) and $100,000+ for women (189 | 24.0%).
| Income | Male | Female |
| $2,499 or less | 30 (3.3%) | 37 (4.7%) |
| $2,500 to $4,999 | 29 (3.2%) | 21 (2.7%) |
| $5,000 to $7,499 | 16 (1.7%) | 20 (2.5%) |
| $7,500 to $9,999 | 7 (0.8%) | 17 (2.2%) |
| $10,000 to $12,499 | 10 (1.1%) | 18 (2.3%) |
| $12,500 to $14,999 | 13 (1.4%) | 20 (2.5%) |
| $15,000 to $17,499 | 13 (1.4%) | 29 (3.7%) |
| $17,500 to $19,999 | 0 (0.0%) | 6 (0.8%) |
| $20,000 to $22,499 | 0 (0.0%) | 0 (0.0%) |
| $22,500 to $24,999 | 26 (2.8%) | 47 (6.0%) |
| $25,000 to $29,999 | 7 (0.8%) | 0 (0.0%) |
| $30,000 to $34,999 | 39 (4.3%) | 72 (9.1%) |
| $35,000 to $39,999 | 0 (0.0%) | 5 (0.6%) |
| $40,000 to $44,999 | 34 (3.7%) | 41 (5.2%) |
| $45,000 to $49,999 | 39 (4.3%) | 29 (3.7%) |
| $50,000 to $54,999 | 27 (2.9%) | 19 (2.4%) |
| $55,000 to $64,999 | 39 (4.3%) | 64 (8.1%) |
| $65,000 to $74,999 | 49 (5.3%) | 55 (7.0%) |
| $75,000 to $99,999 | 130 (14.2%) | 99 (12.6%) |
| $100,000+ | 409 (44.6%) | 189 (24.0%) |
| Total | 917 (100.0%) | 788 (100.0%) |
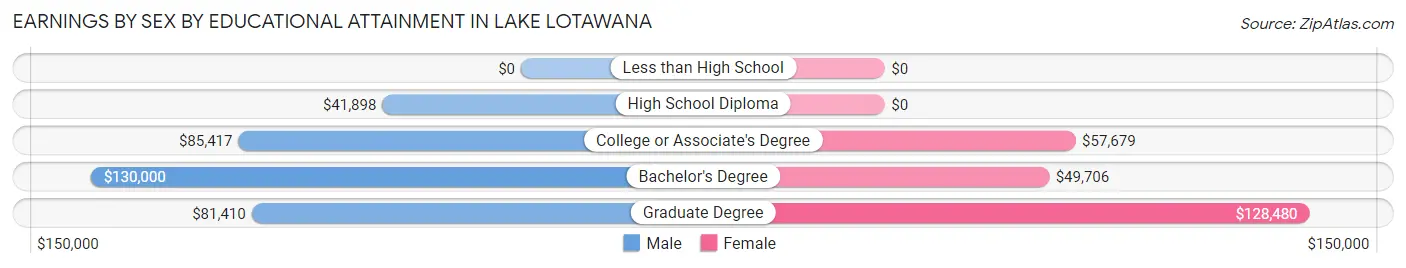
Earnings by Sex by Educational Attainment in Lake Lotawana
Average earnings in Lake Lotawana are $92,383 for men and $65,625 for women, a difference of 29.0%. Men with an educational attainment of bachelor's degree enjoy the highest average annual earnings of $130,000, while those with high school diploma education earn the least with $41,898. Women with an educational attainment of graduate degree earn the most with the average annual earnings of $128,480, while those with bachelor's degree education have the smallest earnings of $49,706.
| Educational Attainment | Male Income | Female Income |
| Less than High School | - | - |
| High School Diploma | $41,898 | $0 |
| College or Associate's Degree | $85,417 | $57,679 |
| Bachelor's Degree | $130,000 | $49,706 |
| Graduate Degree | $81,410 | $128,480 |
| Total | $92,383 | $65,625 |
Family Income in Lake Lotawana
Family Income Brackets in Lake Lotawana
According to the Lake Lotawana family income data, there are 338 families falling into the $200,000+ income range, which is the most common income bracket and makes up 38.8% of all families. Conversely, the $25,000 to $34,999 income bracket is the least frequent group with only 4 families (0.5%) belonging to this category.
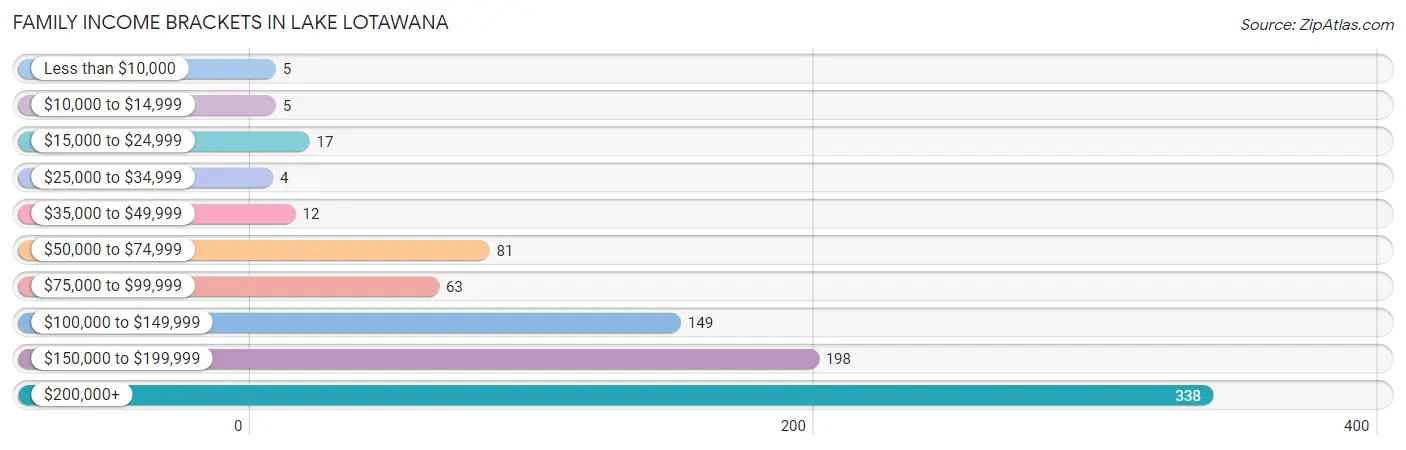
| Income Bracket | # Families | % Families |
| Less than $10,000 | 5 | 0.6% |
| $10,000 to $14,999 | 5 | 0.6% |
| $15,000 to $24,999 | 17 | 1.9% |
| $25,000 to $34,999 | 4 | 0.5% |
| $35,000 to $49,999 | 12 | 1.4% |
| $50,000 to $74,999 | 81 | 9.3% |
| $75,000 to $99,999 | 63 | 7.2% |
| $100,000 to $149,999 | 149 | 17.1% |
| $150,000 to $199,999 | 198 | 22.7% |
| $200,000+ | 338 | 38.8% |
Family Income by Famaliy Size in Lake Lotawana
5-person families (65 | 7.4%) account for the highest median family income in Lake Lotawana with $250,001 per family, while 2-person families (461 | 52.9%) have the highest median income of $73,625 per family member.
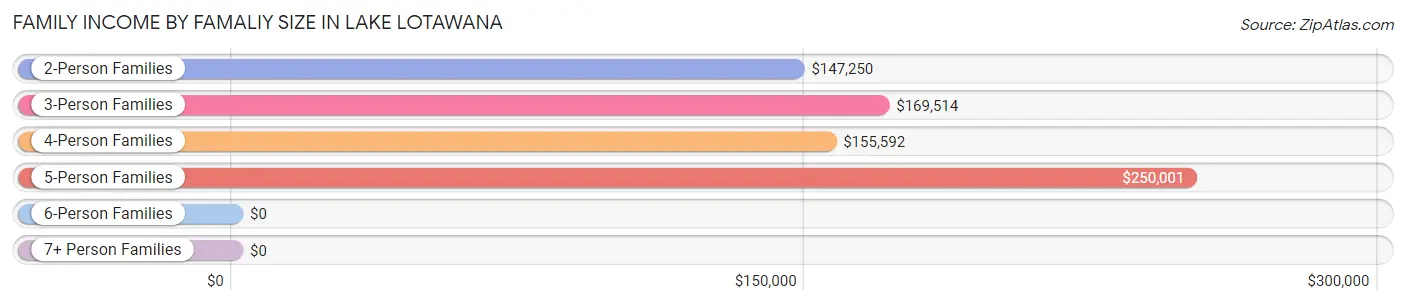
| Income Bracket | # Families | Median Income |
| 2-Person Families | 461 (52.9%) | $147,250 |
| 3-Person Families | 144 (16.5%) | $169,514 |
| 4-Person Families | 163 (18.7%) | $155,592 |
| 5-Person Families | 65 (7.4%) | $250,001 |
| 6-Person Families | 0 (0.0%) | $0 |
| 7+ Person Families | 39 (4.5%) | $0 |
| Total | 872 (100.0%) | $168,889 |
Family Income by Number of Earners in Lake Lotawana
The median family income in Lake Lotawana is $168,889, with families comprising 3+ earners (100) having the highest median family income of $220,909, while families with no earners (107) have the lowest median family income of $69,306, accounting for 11.5% and 12.3% of families, respectively.
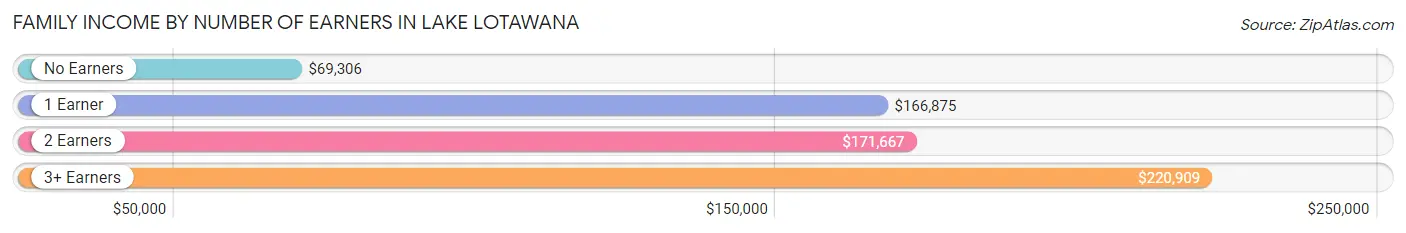
| Number of Earners | # Families | Median Income |
| No Earners | 107 (12.3%) | $69,306 |
| 1 Earner | 193 (22.1%) | $166,875 |
| 2 Earners | 472 (54.1%) | $171,667 |
| 3+ Earners | 100 (11.5%) | $220,909 |
| Total | 872 (100.0%) | $168,889 |
Household Income in Lake Lotawana
Household Income Brackets in Lake Lotawana
With 385 households falling in the category, the $200,000+ income range is the most frequent in Lake Lotawana, accounting for 34.5% of all households. In contrast, only 4 households (0.4%) fall into the $10,000 to $14,999 income bracket, making it the least populous group.
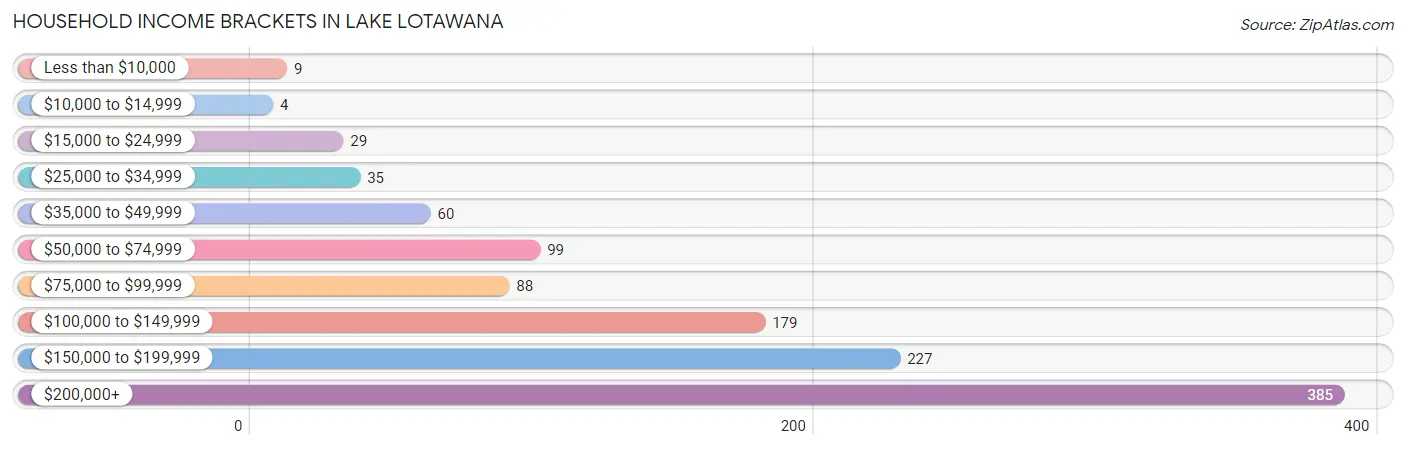
| Income Bracket | # Households | % Households |
| Less than $10,000 | 9 | 0.8% |
| $10,000 to $14,999 | 4 | 0.4% |
| $15,000 to $24,999 | 29 | 2.6% |
| $25,000 to $34,999 | 35 | 3.1% |
| $35,000 to $49,999 | 60 | 5.4% |
| $50,000 to $74,999 | 99 | 8.9% |
| $75,000 to $99,999 | 88 | 7.9% |
| $100,000 to $149,999 | 179 | 16.0% |
| $150,000 to $199,999 | 227 | 20.3% |
| $200,000+ | 385 | 34.5% |
Household Income by Householder Age in Lake Lotawana
The median household income in Lake Lotawana is $156,146, with the highest median household income of $182,533 found in the 45 to 64 years age bracket for the primary householder. A total of 581 households (52.1%) fall into this category.
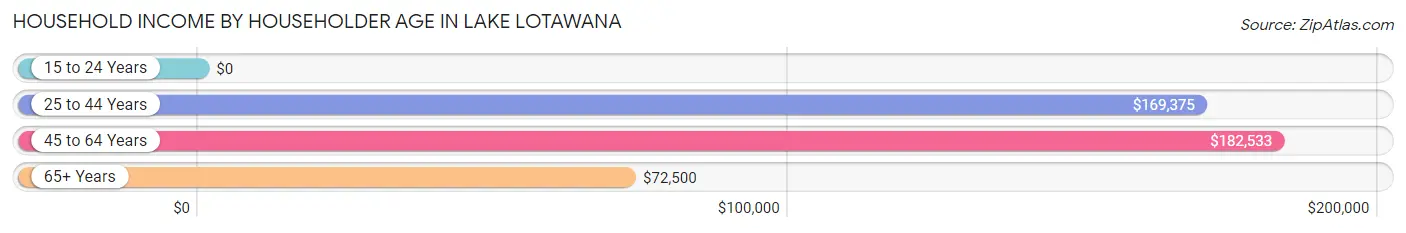
| Income Bracket | # Households | Median Income |
| 15 to 24 Years | 0 (0.0%) | $0 |
| 25 to 44 Years | 287 (25.7%) | $169,375 |
| 45 to 64 Years | 581 (52.1%) | $182,533 |
| 65+ Years | 248 (22.2%) | $72,500 |
| Total | 1,116 (100.0%) | $156,146 |
Poverty in Lake Lotawana
Income Below Poverty by Sex and Age in Lake Lotawana
With 0.7% poverty level for males and 2.5% for females among the residents of Lake Lotawana, 75 year old and over males and 25 to 34 year old females are the most vulnerable to poverty, with 5 males (4.7%) and 14 females (13.6%) in their respective age groups living below the poverty level.
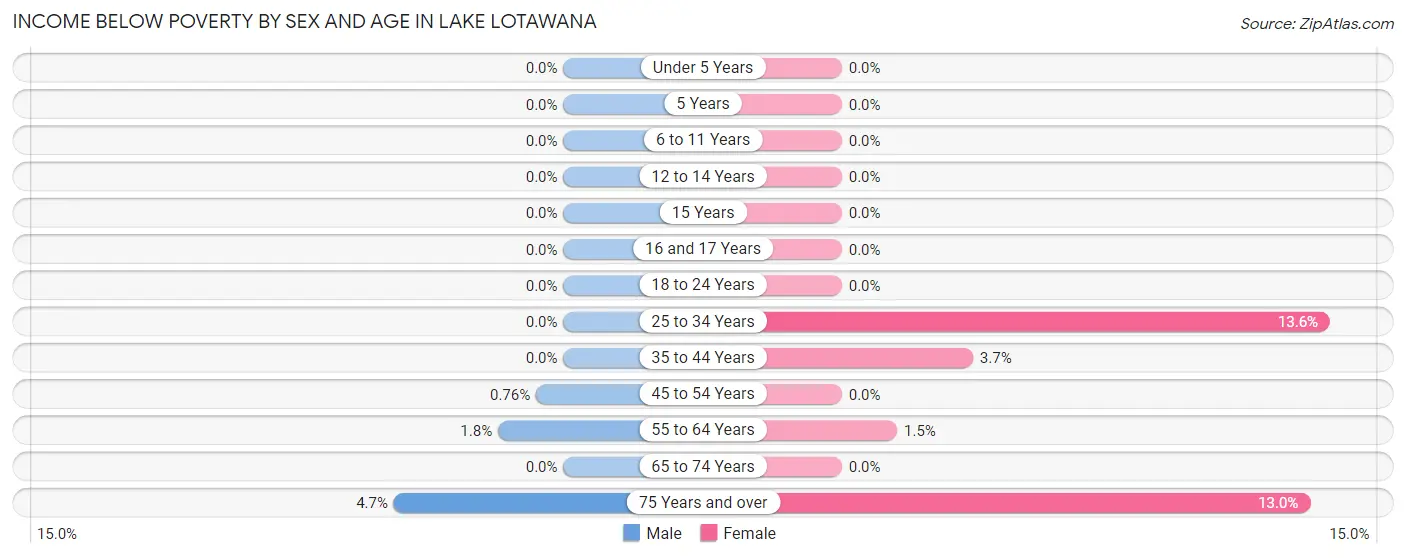
| Age Bracket | Male | Female |
| Under 5 Years | 0 (0.0%) | 0 (0.0%) |
| 5 Years | 0 (0.0%) | 0 (0.0%) |
| 6 to 11 Years | 0 (0.0%) | 0 (0.0%) |
| 12 to 14 Years | 0 (0.0%) | 0 (0.0%) |
| 15 Years | 0 (0.0%) | 0 (0.0%) |
| 16 and 17 Years | 0 (0.0%) | 0 (0.0%) |
| 18 to 24 Years | 0 (0.0%) | 0 (0.0%) |
| 25 to 34 Years | 0 (0.0%) | 14 (13.6%) |
| 35 to 44 Years | 0 (0.0%) | 5 (3.6%) |
| 45 to 54 Years | 2 (0.8%) | 0 (0.0%) |
| 55 to 64 Years | 5 (1.8%) | 5 (1.5%) |
| 65 to 74 Years | 0 (0.0%) | 0 (0.0%) |
| 75 Years and over | 5 (4.7%) | 9 (13.0%) |
| Total | 12 (0.7%) | 33 (2.5%) |
Income Above Poverty by Sex and Age in Lake Lotawana
According to the poverty statistics in Lake Lotawana, males aged under 5 years and females aged under 5 years are the age groups that are most secure financially, with 100.0% of males and 100.0% of females in these age groups living above the poverty line.
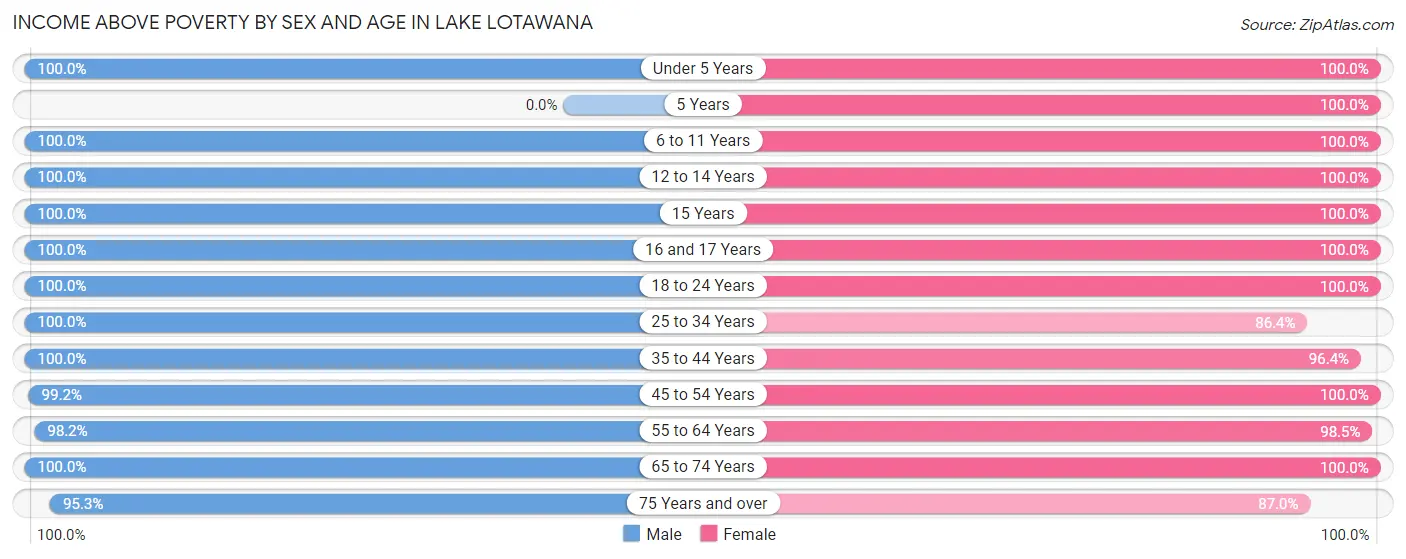
| Age Bracket | Male | Female |
| Under 5 Years | 190 (100.0%) | 67 (100.0%) |
| 5 Years | 0 (0.0%) | 6 (100.0%) |
| 6 to 11 Years | 190 (100.0%) | 46 (100.0%) |
| 12 to 14 Years | 19 (100.0%) | 62 (100.0%) |
| 15 Years | 8 (100.0%) | 20 (100.0%) |
| 16 and 17 Years | 58 (100.0%) | 13 (100.0%) |
| 18 to 24 Years | 98 (100.0%) | 97 (100.0%) |
| 25 to 34 Years | 160 (100.0%) | 89 (86.4%) |
| 35 to 44 Years | 195 (100.0%) | 132 (96.4%) |
| 45 to 54 Years | 261 (99.2%) | 218 (100.0%) |
| 55 to 64 Years | 270 (98.2%) | 319 (98.5%) |
| 65 to 74 Years | 157 (100.0%) | 136 (100.0%) |
| 75 Years and over | 101 (95.3%) | 60 (87.0%) |
| Total | 1,707 (99.3%) | 1,265 (97.5%) |
Income Below Poverty Among Married-Couple Families in Lake Lotawana
The poverty statistics for married-couple families in Lake Lotawana show that 1.3% or 10 of the total 791 families live below the poverty line. Families with no children have the highest poverty rate of 2.2%, comprising of 10 families. On the other hand, families with 1 or 2 children have the lowest poverty rate of 0.0%, which includes 0 families.
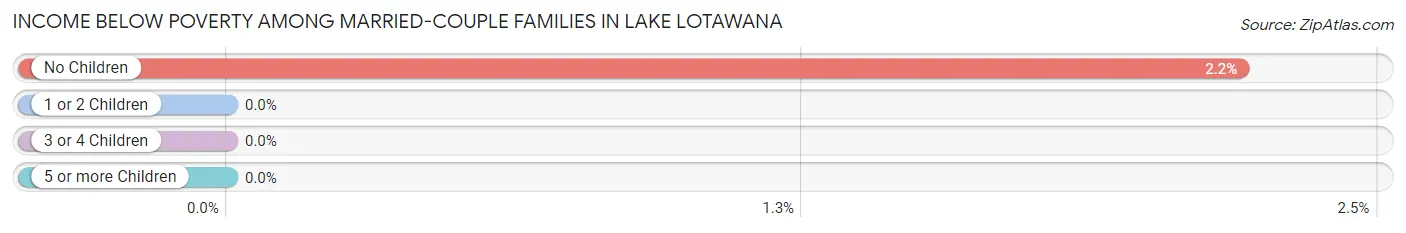
| Children | Above Poverty | Below Poverty |
| No Children | 445 (97.8%) | 10 (2.2%) |
| 1 or 2 Children | 284 (100.0%) | 0 (0.0%) |
| 3 or 4 Children | 52 (100.0%) | 0 (0.0%) |
| 5 or more Children | 0 (0.0%) | 0 (0.0%) |
| Total | 781 (98.7%) | 10 (1.3%) |
Income Below Poverty Among Single-Parent Households in Lake Lotawana
| Children | Single Father | Single Mother |
| No Children | 0 (0.0%) | 0 (0.0%) |
| 1 or 2 Children | 0 (0.0%) | 0 (0.0%) |
| 3 or 4 Children | 0 (0.0%) | 0 (0.0%) |
| 5 or more Children | 0 (0.0%) | 0 (0.0%) |
| Total | 0 (0.0%) | 0 (0.0%) |
Income Below Poverty Among Married-Couple vs Single-Parent Households in Lake Lotawana
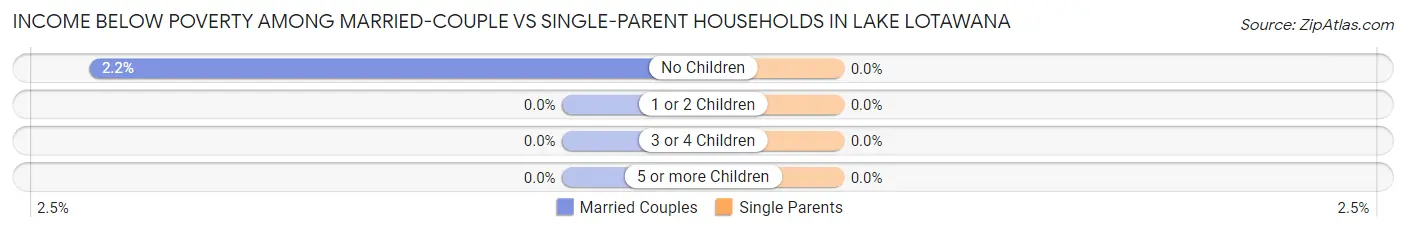
| Children | Married-Couple Families | Single-Parent Households |
| No Children | 10 (2.2%) | 0 (0.0%) |
| 1 or 2 Children | 0 (0.0%) | 0 (0.0%) |
| 3 or 4 Children | 0 (0.0%) | 0 (0.0%) |
| 5 or more Children | 0 (0.0%) | 0 (0.0%) |
| Total | 10 (1.3%) | 0 (0.0%) |
Race in Lake Lotawana
The most populous races in Lake Lotawana are White / Caucasian (2,509 | 83.2%), Hispanic or Latino (309 | 10.2%), and Some other Race (225 | 7.5%).
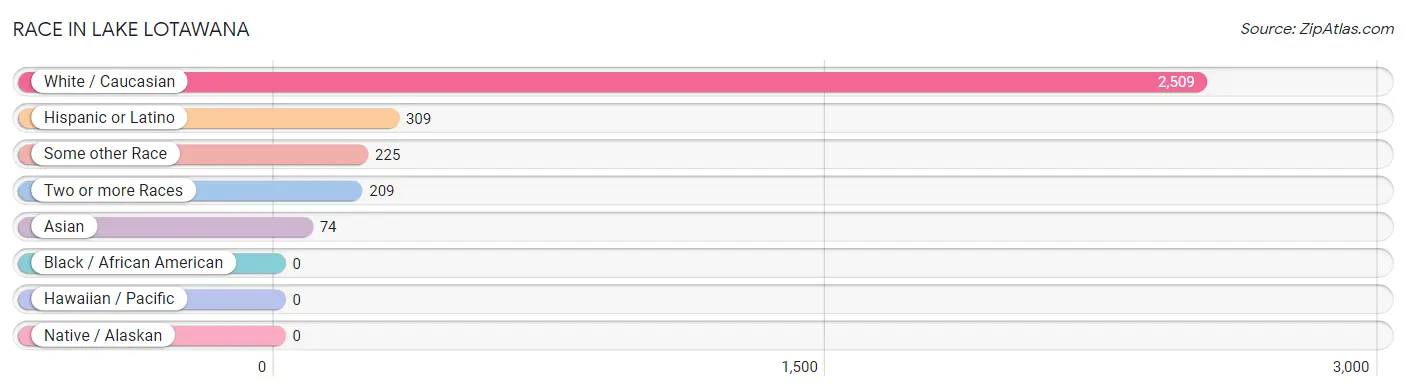
| Race | # Population | % Population |
| Asian | 74 | 2.5% |
| Black / African American | 0 | 0.0% |
| Hawaiian / Pacific | 0 | 0.0% |
| Hispanic or Latino | 309 | 10.2% |
| Native / Alaskan | 0 | 0.0% |
| White / Caucasian | 2,509 | 83.2% |
| Two or more Races | 209 | 6.9% |
| Some other Race | 225 | 7.5% |
| Total | 3,017 | 100.0% |
Ancestry in Lake Lotawana
The most populous ancestries reported in Lake Lotawana are German (895 | 29.7%), Irish (652 | 21.6%), English (363 | 12.0%), Central American (225 | 7.5%), and Guatemalan (225 | 7.5%), together accounting for 78.2% of all Lake Lotawana residents.
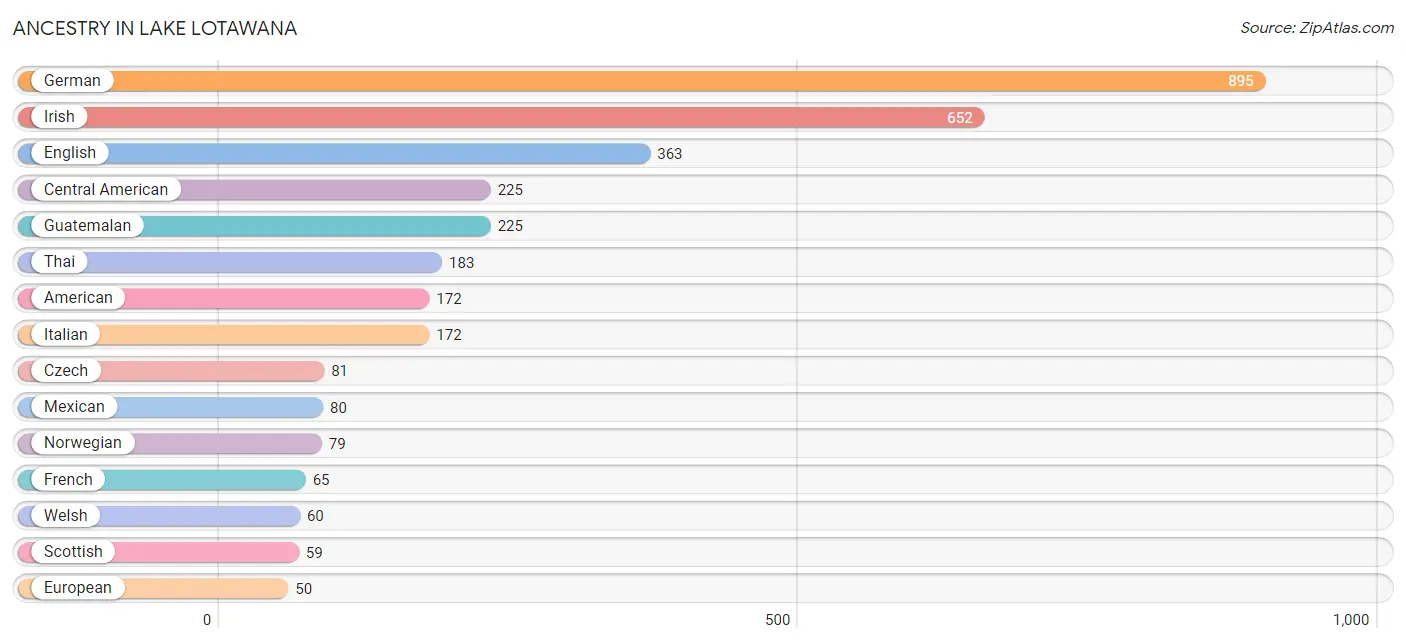
| Ancestry | # Population | % Population |
| American | 172 | 5.7% |
| British | 4 | 0.1% |
| Burmese | 29 | 1.0% |
| Central American | 225 | 7.5% |
| Cherokee | 1 | 0.0% |
| Czech | 81 | 2.7% |
| Danish | 33 | 1.1% |
| Dutch | 14 | 0.5% |
| English | 363 | 12.0% |
| European | 50 | 1.7% |
| Filipino | 6 | 0.2% |
| Finnish | 12 | 0.4% |
| French | 65 | 2.1% |
| German | 895 | 29.7% |
| Guatemalan | 225 | 7.5% |
| Irish | 652 | 21.6% |
| Italian | 172 | 5.7% |
| Mexican | 80 | 2.6% |
| Norwegian | 79 | 2.6% |
| Polish | 37 | 1.2% |
| Scandinavian | 18 | 0.6% |
| Scotch-Irish | 12 | 0.4% |
| Scottish | 59 | 2.0% |
| Slovak | 24 | 0.8% |
| Spanish | 4 | 0.1% |
| Swedish | 32 | 1.1% |
| Thai | 183 | 6.1% |
| Ukrainian | 19 | 0.6% |
| Welsh | 60 | 2.0% | View All 29 Rows |
Immigrants in Lake Lotawana
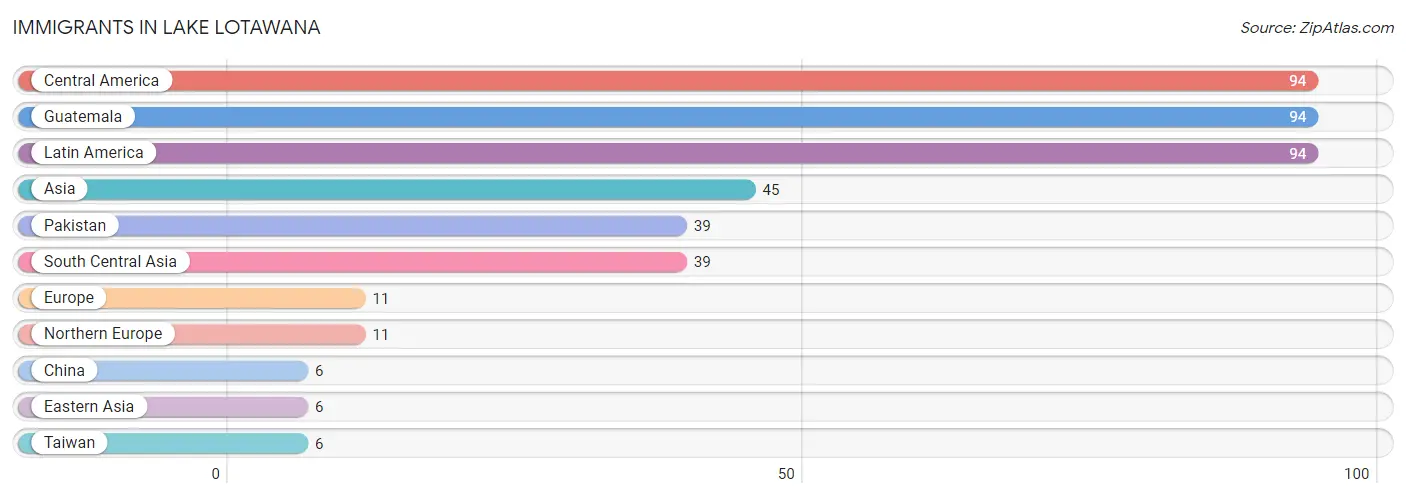
The most numerous immigrant groups reported in Lake Lotawana came from Central America (94 | 3.1%), Guatemala (94 | 3.1%), Latin America (94 | 3.1%), Asia (45 | 1.5%), and Pakistan (39 | 1.3%), together accounting for 12.1% of all Lake Lotawana residents.
| Immigration Origin | # Population | % Population |
| Asia | 45 | 1.5% |
| Central America | 94 | 3.1% |
| China | 6 | 0.2% |
| Eastern Asia | 6 | 0.2% |
| Europe | 11 | 0.4% |
| Guatemala | 94 | 3.1% |
| Latin America | 94 | 3.1% |
| Northern Europe | 11 | 0.4% |
| Pakistan | 39 | 1.3% |
| South Central Asia | 39 | 1.3% |
| Taiwan | 6 | 0.2% | View All 11 Rows |
Sex and Age in Lake Lotawana
Sex and Age in Lake Lotawana
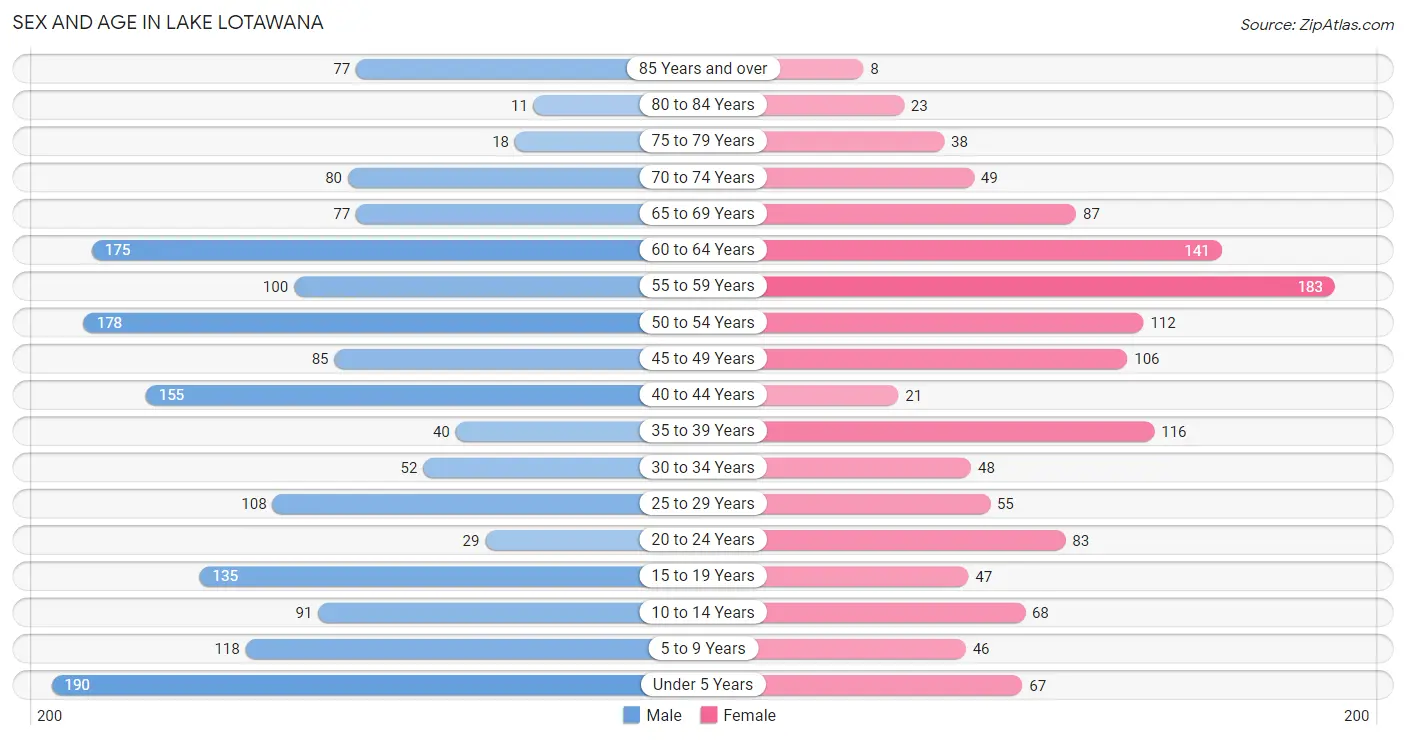
The most populous age groups in Lake Lotawana are Under 5 Years (190 | 11.1%) for men and 55 to 59 Years (183 | 14.1%) for women.
| Age Bracket | Male | Female |
| Under 5 Years | 190 (11.1%) | 67 (5.2%) |
| 5 to 9 Years | 118 (6.9%) | 46 (3.5%) |
| 10 to 14 Years | 91 (5.3%) | 68 (5.2%) |
| 15 to 19 Years | 135 (7.9%) | 47 (3.6%) |
| 20 to 24 Years | 29 (1.7%) | 83 (6.4%) |
| 25 to 29 Years | 108 (6.3%) | 55 (4.2%) |
| 30 to 34 Years | 52 (3.0%) | 48 (3.7%) |
| 35 to 39 Years | 40 (2.3%) | 116 (8.9%) |
| 40 to 44 Years | 155 (9.0%) | 21 (1.6%) |
| 45 to 49 Years | 85 (4.9%) | 106 (8.2%) |
| 50 to 54 Years | 178 (10.3%) | 112 (8.6%) |
| 55 to 59 Years | 100 (5.8%) | 183 (14.1%) |
| 60 to 64 Years | 175 (10.2%) | 141 (10.9%) |
| 65 to 69 Years | 77 (4.5%) | 87 (6.7%) |
| 70 to 74 Years | 80 (4.6%) | 49 (3.8%) |
| 75 to 79 Years | 18 (1.1%) | 38 (2.9%) |
| 80 to 84 Years | 11 (0.6%) | 23 (1.8%) |
| 85 Years and over | 77 (4.5%) | 8 (0.6%) |
| Total | 1,719 (100.0%) | 1,298 (100.0%) |
Families and Households in Lake Lotawana
Median Family Size in Lake Lotawana
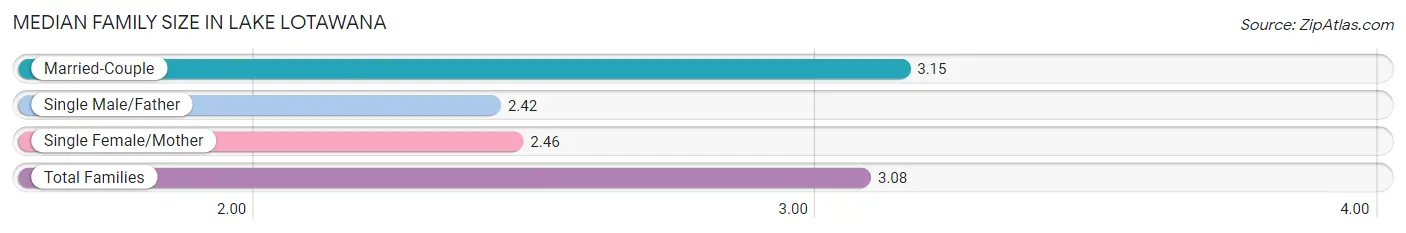
The median family size in Lake Lotawana is 3.08 persons per family, with married-couple families (791 | 90.7%) accounting for the largest median family size of 3.15 persons per family. On the other hand, single male/father families (31 | 3.6%) represent the smallest median family size with 2.42 persons per family.
| Family Type | # Families | Family Size |
| Married-Couple | 791 (90.7%) | 3.15 |
| Single Male/Father | 31 (3.6%) | 2.42 |
| Single Female/Mother | 50 (5.7%) | 2.46 |
| Total Families | 872 (100.0%) | 3.08 |
Median Household Size in Lake Lotawana
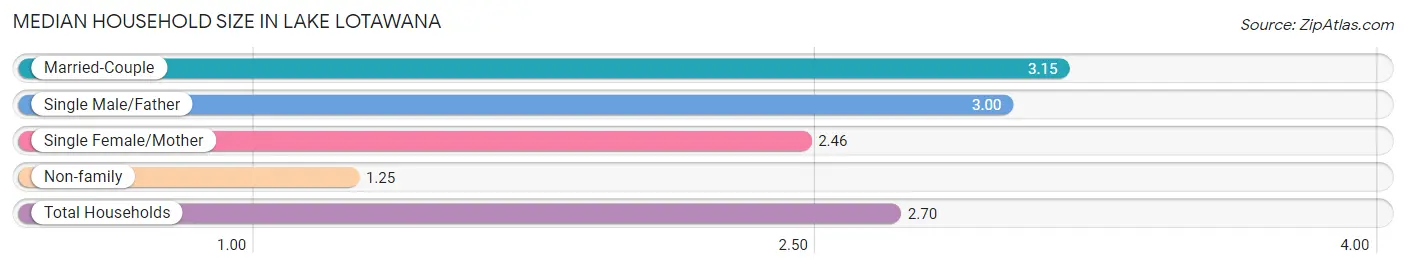
The median household size in Lake Lotawana is 2.70 persons per household, with married-couple households (791 | 70.9%) accounting for the largest median household size of 3.15 persons per household. non-family households (244 | 21.9%) represent the smallest median household size with 1.25 persons per household.
| Household Type | # Households | Household Size |
| Married-Couple | 791 (70.9%) | 3.15 |
| Single Male/Father | 31 (2.8%) | 3.00 |
| Single Female/Mother | 50 (4.5%) | 2.46 |
| Non-family | 244 (21.9%) | 1.25 |
| Total Households | 1,116 (100.0%) | 2.70 |
Household Size by Marriage Status in Lake Lotawana
Out of a total of 1,116 households in Lake Lotawana, 872 (78.1%) are family households, while 244 (21.9%) are nonfamily households. The most numerous type of family households are 2-person households, comprising 436, and the most common type of nonfamily households are 1-person households, comprising 214.
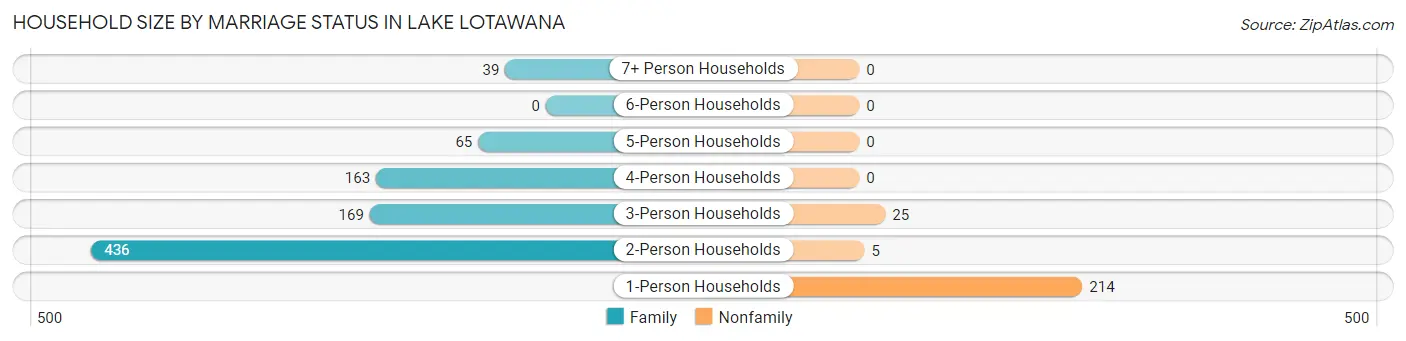
| Household Size | Family Households | Nonfamily Households |
| 1-Person Households | - | 214 (19.2%) |
| 2-Person Households | 436 (39.1%) | 5 (0.4%) |
| 3-Person Households | 169 (15.1%) | 25 (2.2%) |
| 4-Person Households | 163 (14.6%) | 0 (0.0%) |
| 5-Person Households | 65 (5.8%) | 0 (0.0%) |
| 6-Person Households | 0 (0.0%) | 0 (0.0%) |
| 7+ Person Households | 39 (3.5%) | 0 (0.0%) |
| Total | 872 (78.1%) | 244 (21.9%) |
Female Fertility in Lake Lotawana
Fertility by Age in Lake Lotawana
Average fertility rate in Lake Lotawana is 124.0 births per 1,000 women. Women in the age bracket of 20 to 34 years have the highest fertility rate with 247.0 births per 1,000 women. Women in the age bracket of 20 to 34 years acount for 75.4% of all women with births.
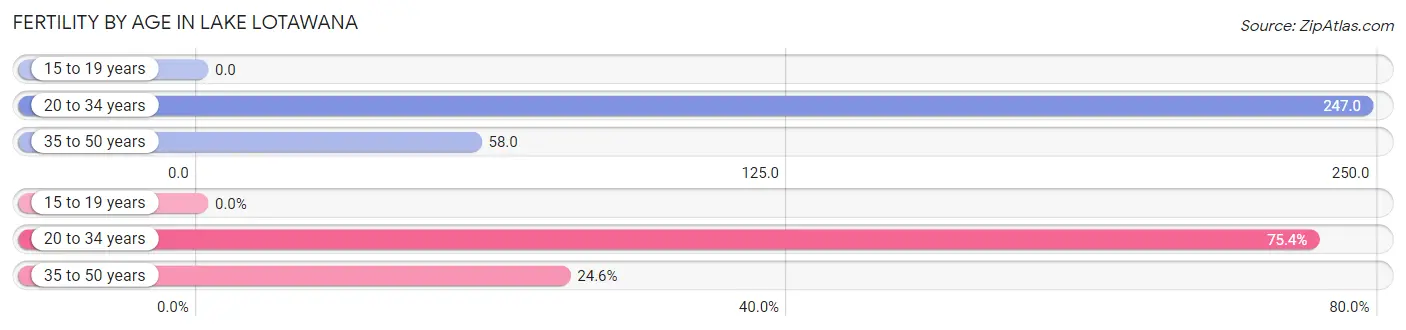
| Age Bracket | Women with Births | Births / 1,000 Women |
| 15 to 19 years | 0 (0.0%) | 0.0 |
| 20 to 34 years | 46 (75.4%) | 247.0 |
| 35 to 50 years | 15 (24.6%) | 58.0 |
| Total | 61 (100.0%) | 124.0 |
Fertility by Age by Marriage Status in Lake Lotawana
80.3% of women with births (61) in Lake Lotawana are married. The highest percentage of unmarried women with births falls into 35 to 50 years age bracket with 80.0% of them unmarried at the time of birth, while the lowest percentage of unmarried women with births belong to 20 to 34 years age bracket with 0.0% of them unmarried.
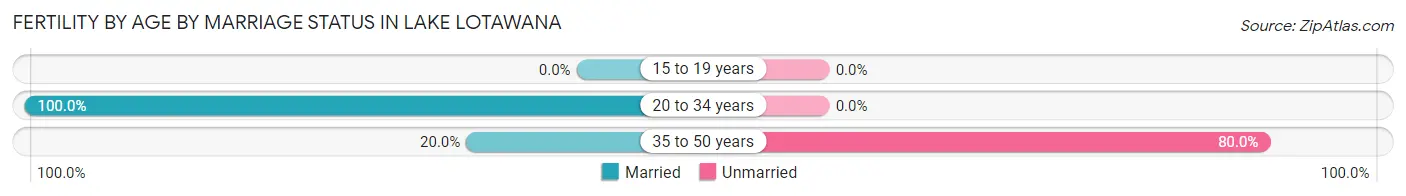
| Age Bracket | Married | Unmarried |
| 15 to 19 years | 0 (0.0%) | 0 (0.0%) |
| 20 to 34 years | 46 (100.0%) | 0 (0.0%) |
| 35 to 50 years | 3 (20.0%) | 12 (80.0%) |
| Total | 49 (80.3%) | 12 (19.7%) |
Fertility by Education in Lake Lotawana
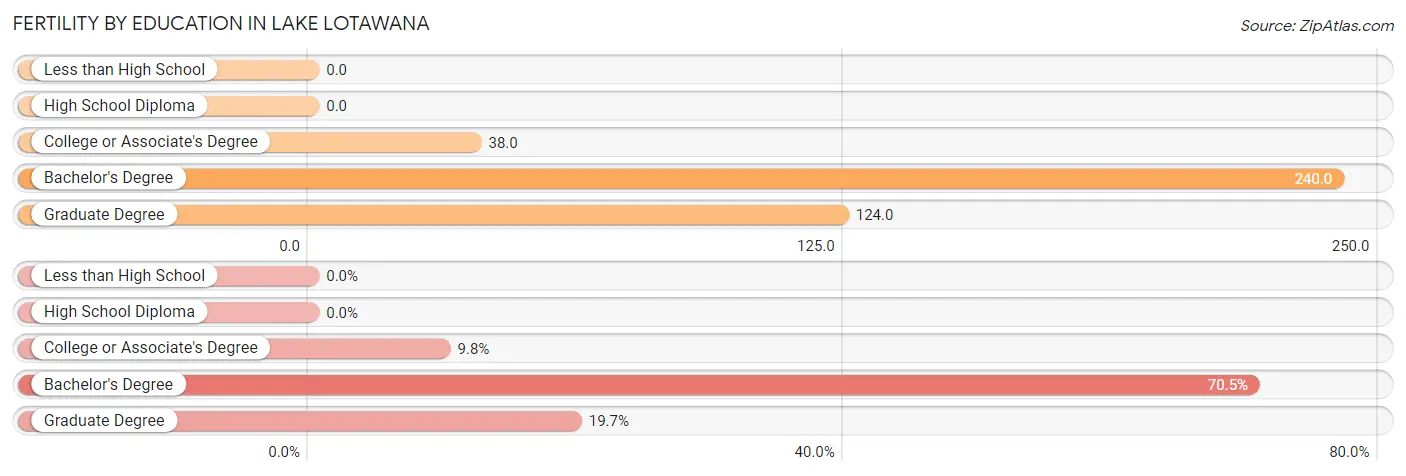
| Educational Attainment | Women with Births | Births / 1,000 Women |
| Less than High School | 0 (0.0%) | 0.0 |
| High School Diploma | 0 (0.0%) | 0.0 |
| College or Associate's Degree | 6 (9.8%) | 38.0 |
| Bachelor's Degree | 43 (70.5%) | 240.0 |
| Graduate Degree | 12 (19.7%) | 124.0 |
| Total | 61 (100.0%) | 124.0 |
Fertility by Education by Marriage Status in Lake Lotawana
19.7% of women with births in Lake Lotawana are unmarried. Women with the educational attainment of college or associate's degree are most likely to be married with 100.0% of them married at childbirth, while women with the educational attainment of graduate degree are least likely to be married with 100.0% of them unmarried at childbirth.
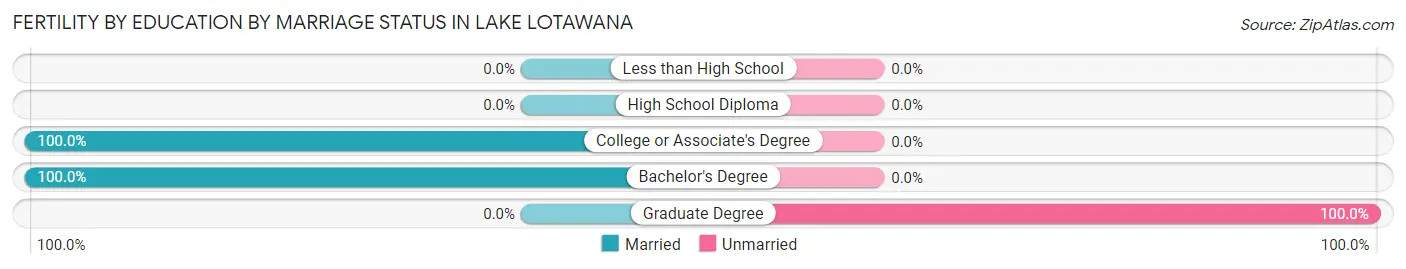
| Educational Attainment | Married | Unmarried |
| Less than High School | 0 (0.0%) | 0 (0.0%) |
| High School Diploma | 0 (0.0%) | 0 (0.0%) |
| College or Associate's Degree | 6 (100.0%) | 0 (0.0%) |
| Bachelor's Degree | 43 (100.0%) | 0 (0.0%) |
| Graduate Degree | 0 (0.0%) | 12 (100.0%) |
| Total | 49 (80.3%) | 12 (19.7%) |
Employment Characteristics in Lake Lotawana
Employment by Class of Employer in Lake Lotawana
Among the 1,597 employed individuals in Lake Lotawana, private company employees (997 | 62.4%), self-employed (not incorporated) (194 | 12.1%), and self-employed (incorporated) (158 | 9.9%) make up the most common classes of employment.
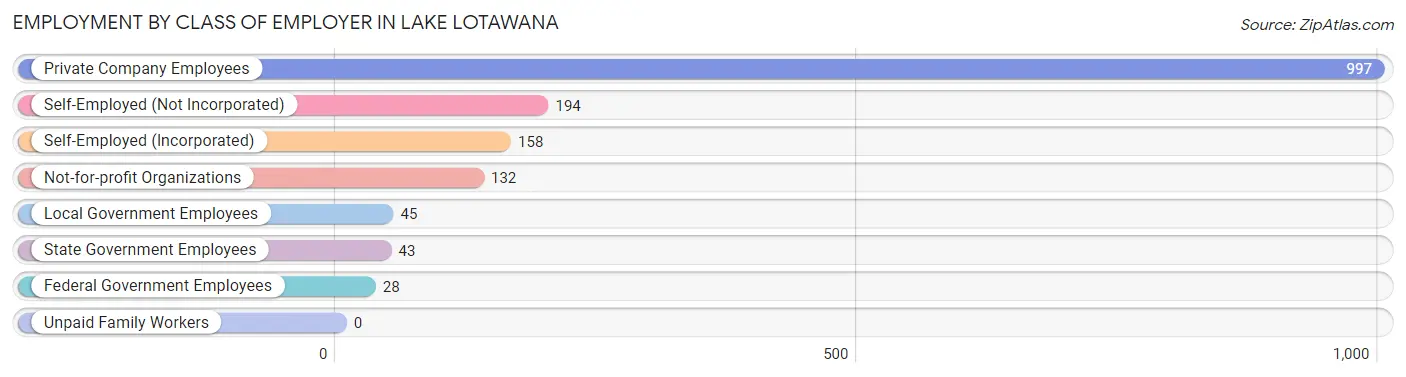
| Employer Class | # Employees | % Employees |
| Private Company Employees | 997 | 62.4% |
| Self-Employed (Incorporated) | 158 | 9.9% |
| Self-Employed (Not Incorporated) | 194 | 12.1% |
| Not-for-profit Organizations | 132 | 8.3% |
| Local Government Employees | 45 | 2.8% |
| State Government Employees | 43 | 2.7% |
| Federal Government Employees | 28 | 1.8% |
| Unpaid Family Workers | 0 | 0.0% |
| Total | 1,597 | 100.0% |
Employment Status by Age in Lake Lotawana
According to the labor force statistics for Lake Lotawana, out of the total population over 16 years of age (2,409), 70.7% or 1,703 individuals are in the labor force, with 3.7% or 63 of them unemployed. The age group with the highest labor force participation rate is 45 to 54 years, with 95.4% or 459 individuals in the labor force. Within the labor force, the 16 to 19 years age range has the highest percentage of unemployed individuals, with 41.5% or 39 of them being unemployed.
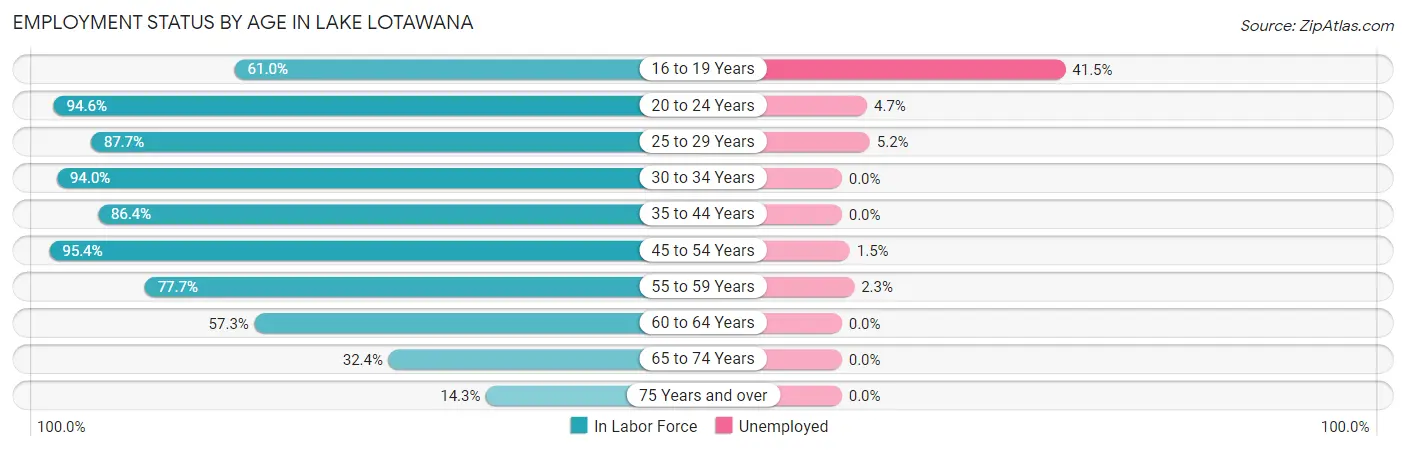
| Age Bracket | In Labor Force | Unemployed |
| 16 to 19 Years | 94 (61.0%) | 39 (41.5%) |
| 20 to 24 Years | 106 (94.6%) | 5 (4.7%) |
| 25 to 29 Years | 143 (87.7%) | 7 (5.2%) |
| 30 to 34 Years | 94 (94.0%) | 0 (0.0%) |
| 35 to 44 Years | 287 (86.4%) | 0 (0.0%) |
| 45 to 54 Years | 459 (95.4%) | 7 (1.5%) |
| 55 to 59 Years | 220 (77.7%) | 5 (2.3%) |
| 60 to 64 Years | 181 (57.3%) | 0 (0.0%) |
| 65 to 74 Years | 95 (32.4%) | 0 (0.0%) |
| 75 Years and over | 25 (14.3%) | 0 (0.0%) |
| Total | 1,703 (70.7%) | 63 (3.7%) |
Employment Status by Educational Attainment in Lake Lotawana
According to labor force statistics for Lake Lotawana, 82.6% of individuals (1,384) out of the total population between 25 and 64 years of age (1,675) are in the labor force, with 1.4% or 19 of them being unemployed. The group with the highest labor force participation rate are those with the educational attainment of college / associate degree, with 88.7% or 298 individuals in the labor force. Within the labor force, individuals with less than high school education have the highest percentage of unemployment, with 26.9% or 7 of them being unemployed.
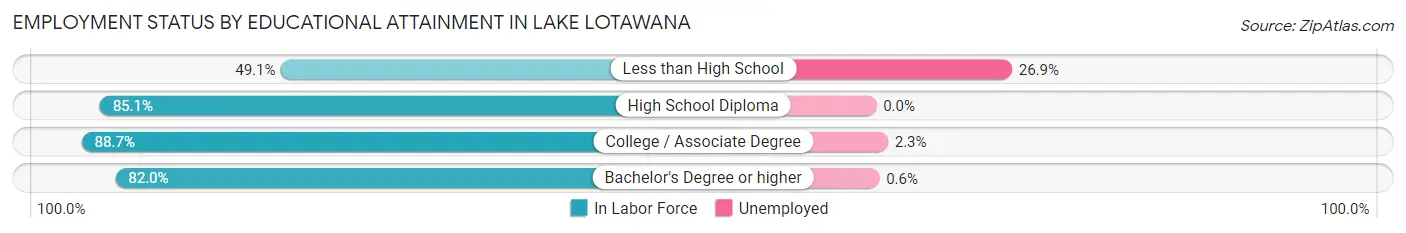
| Educational Attainment | In Labor Force | Unemployed |
| Less than High School | 26 (49.1%) | 14 (26.9%) |
| High School Diploma | 160 (85.1%) | 0 (0.0%) |
| College / Associate Degree | 298 (88.7%) | 8 (2.3%) |
| Bachelor's Degree or higher | 900 (82.0%) | 7 (0.6%) |
| Total | 1,384 (82.6%) | 23 (1.4%) |
Employment Occupations by Sex in Lake Lotawana
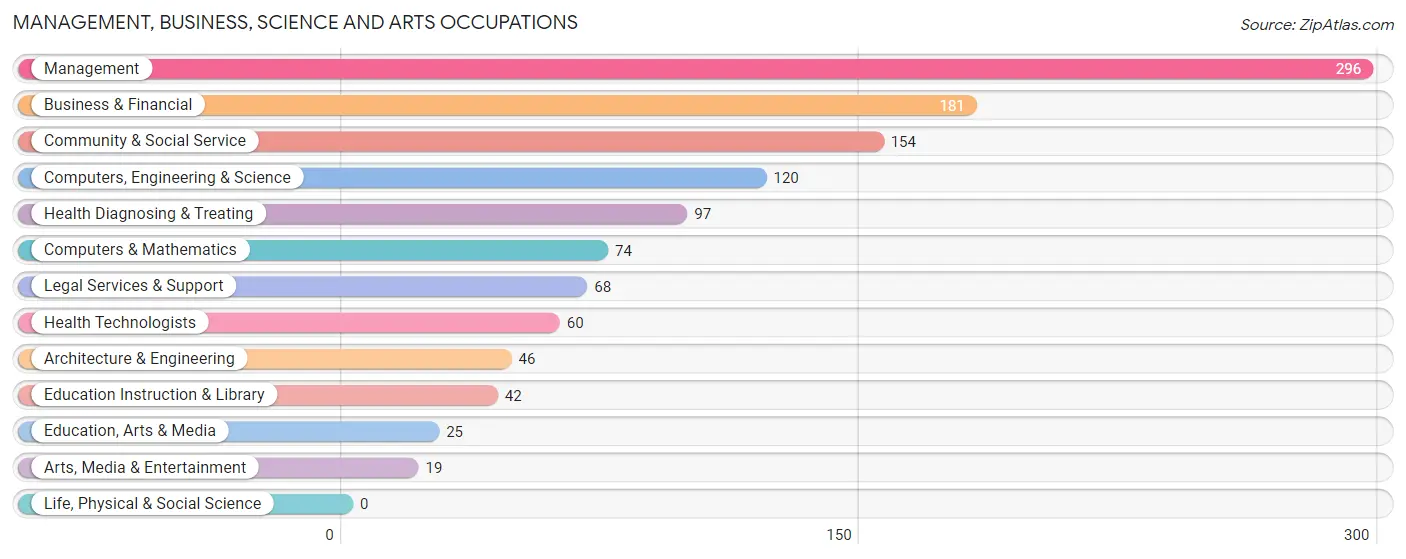
Management, Business, Science and Arts Occupations
The most common Management, Business, Science and Arts occupations in Lake Lotawana are Management (296 | 18.1%), Business & Financial (181 | 11.1%), Community & Social Service (154 | 9.4%), Computers, Engineering & Science (120 | 7.3%), and Health Diagnosing & Treating (97 | 5.9%).
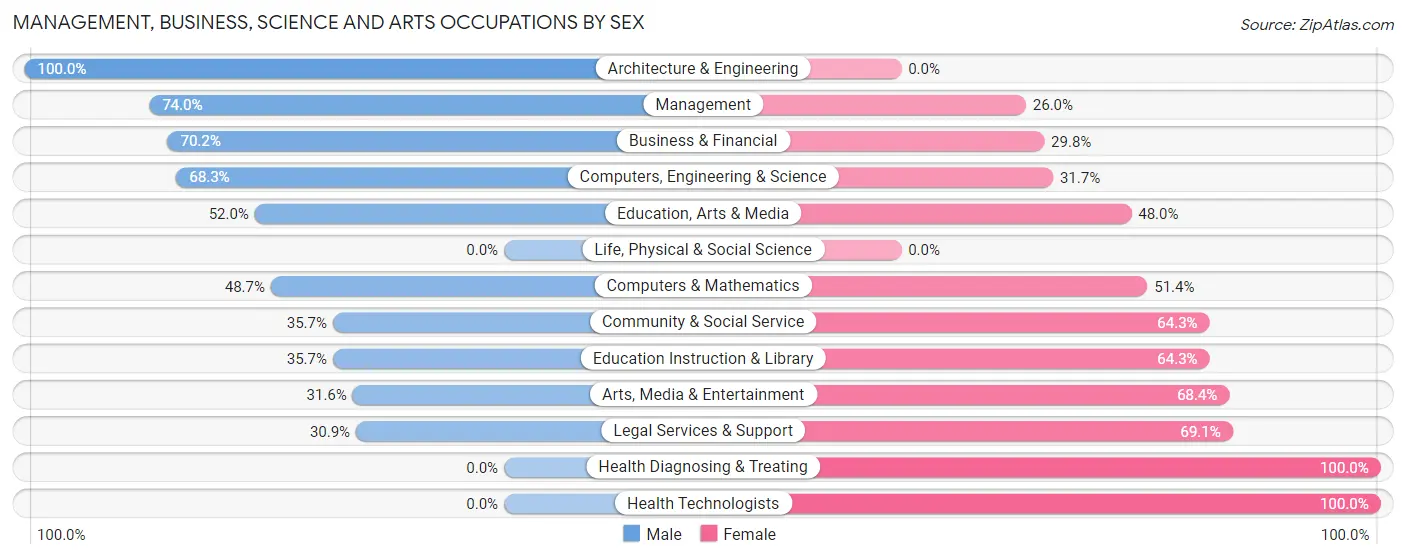
Management, Business, Science and Arts Occupations by Sex
Within the Management, Business, Science and Arts occupations in Lake Lotawana, the most male-oriented occupations are Architecture & Engineering (100.0%), Management (74.0%), and Business & Financial (70.2%), while the most female-oriented occupations are Health Diagnosing & Treating (100.0%), Health Technologists (100.0%), and Legal Services & Support (69.1%).
| Occupation | Male | Female |
| Management | 219 (74.0%) | 77 (26.0%) |
| Business & Financial | 127 (70.2%) | 54 (29.8%) |
| Computers, Engineering & Science | 82 (68.3%) | 38 (31.7%) |
| Computers & Mathematics | 36 (48.6%) | 38 (51.3%) |
| Architecture & Engineering | 46 (100.0%) | 0 (0.0%) |
| Life, Physical & Social Science | 0 (0.0%) | 0 (0.0%) |
| Community & Social Service | 55 (35.7%) | 99 (64.3%) |
| Education, Arts & Media | 13 (52.0%) | 12 (48.0%) |
| Legal Services & Support | 21 (30.9%) | 47 (69.1%) |
| Education Instruction & Library | 15 (35.7%) | 27 (64.3%) |
| Arts, Media & Entertainment | 6 (31.6%) | 13 (68.4%) |
| Health Diagnosing & Treating | 0 (0.0%) | 97 (100.0%) |
| Health Technologists | 0 (0.0%) | 60 (100.0%) |
| Total (Category) | 483 (57.0%) | 365 (43.0%) |
| Total (Overall) | 857 (52.5%) | 776 (47.5%) |
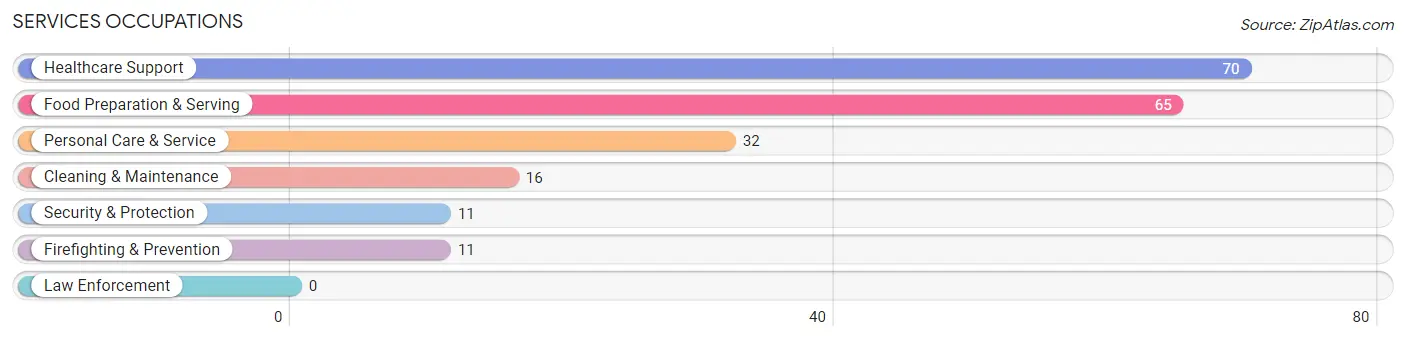
Services Occupations
The most common Services occupations in Lake Lotawana are Healthcare Support (70 | 4.3%), Food Preparation & Serving (65 | 4.0%), Personal Care & Service (32 | 2.0%), Cleaning & Maintenance (16 | 1.0%), and Security & Protection (11 | 0.7%).
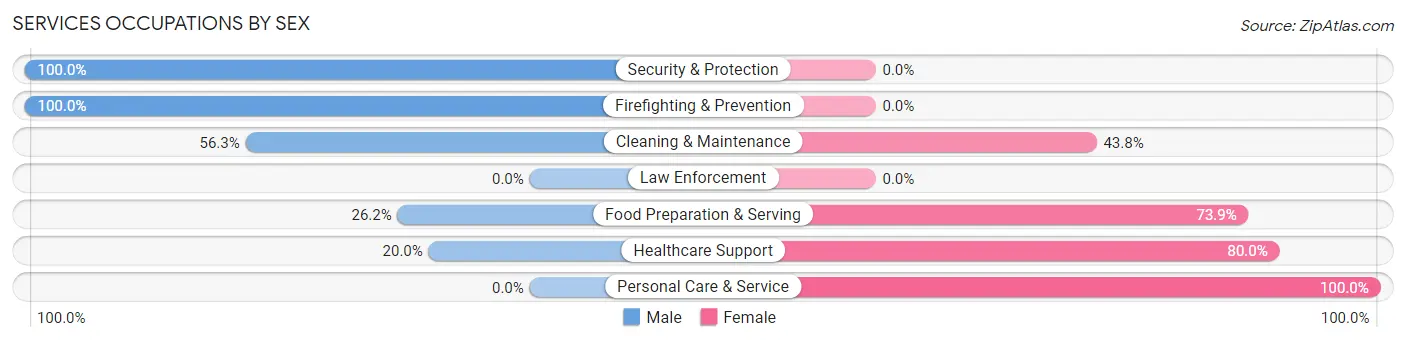
Services Occupations by Sex
Within the Services occupations in Lake Lotawana, the most male-oriented occupations are Security & Protection (100.0%), Firefighting & Prevention (100.0%), and Cleaning & Maintenance (56.2%), while the most female-oriented occupations are Personal Care & Service (100.0%), Healthcare Support (80.0%), and Food Preparation & Serving (73.9%).
| Occupation | Male | Female |
| Healthcare Support | 14 (20.0%) | 56 (80.0%) |
| Security & Protection | 11 (100.0%) | 0 (0.0%) |
| Firefighting & Prevention | 11 (100.0%) | 0 (0.0%) |
| Law Enforcement | 0 (0.0%) | 0 (0.0%) |
| Food Preparation & Serving | 17 (26.2%) | 48 (73.9%) |
| Cleaning & Maintenance | 9 (56.2%) | 7 (43.8%) |
| Personal Care & Service | 0 (0.0%) | 32 (100.0%) |
| Total (Category) | 51 (26.3%) | 143 (73.7%) |
| Total (Overall) | 857 (52.5%) | 776 (47.5%) |
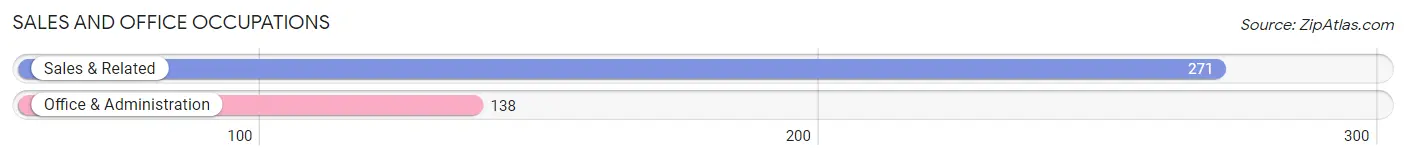
Sales and Office Occupations
The most common Sales and Office occupations in Lake Lotawana are Sales & Related (271 | 16.6%), and Office & Administration (138 | 8.5%).
Sales and Office Occupations by Sex
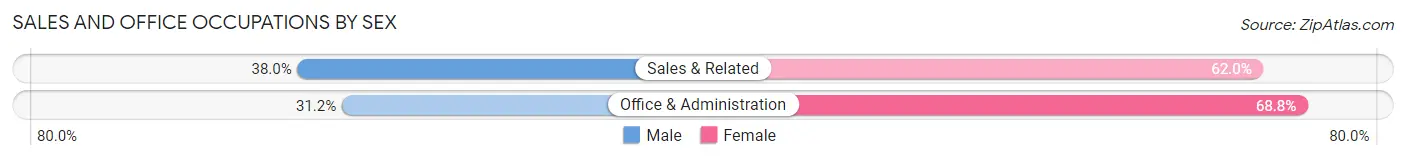
| Occupation | Male | Female |
| Sales & Related | 103 (38.0%) | 168 (62.0%) |
| Office & Administration | 43 (31.2%) | 95 (68.8%) |
| Total (Category) | 146 (35.7%) | 263 (64.3%) |
| Total (Overall) | 857 (52.5%) | 776 (47.5%) |
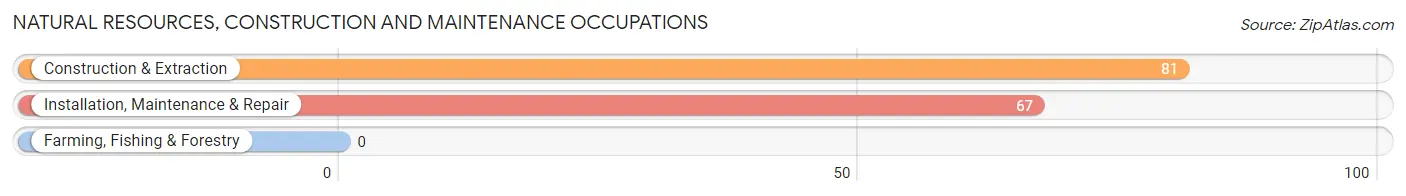
Natural Resources, Construction and Maintenance Occupations
The most common Natural Resources, Construction and Maintenance occupations in Lake Lotawana are Construction & Extraction (81 | 5.0%), and Installation, Maintenance & Repair (67 | 4.1%).
Natural Resources, Construction and Maintenance Occupations by Sex
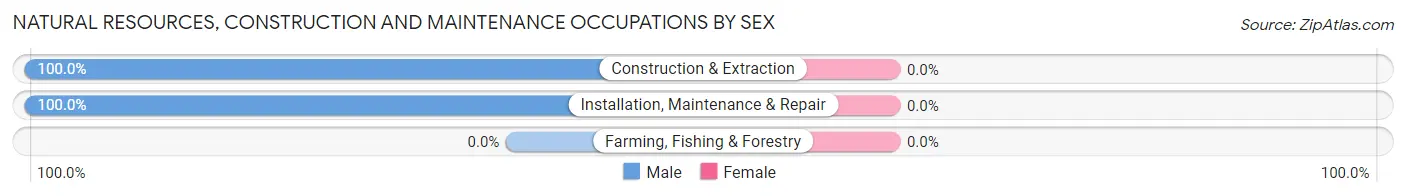
| Occupation | Male | Female |
| Farming, Fishing & Forestry | 0 (0.0%) | 0 (0.0%) |
| Construction & Extraction | 81 (100.0%) | 0 (0.0%) |
| Installation, Maintenance & Repair | 67 (100.0%) | 0 (0.0%) |
| Total (Category) | 148 (100.0%) | 0 (0.0%) |
| Total (Overall) | 857 (52.5%) | 776 (47.5%) |
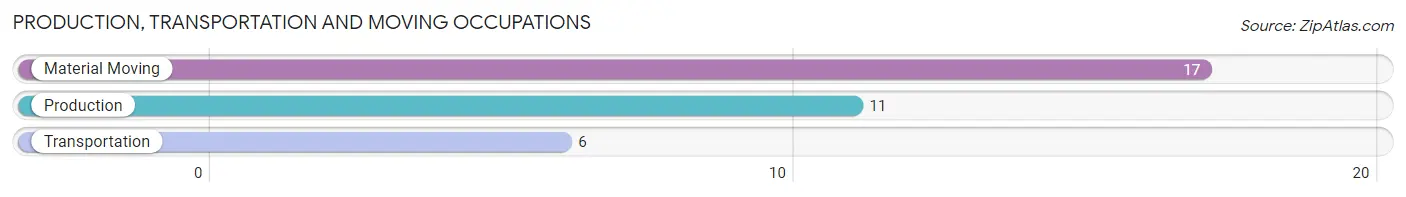
Production, Transportation and Moving Occupations
The most common Production, Transportation and Moving occupations in Lake Lotawana are Material Moving (17 | 1.0%), Production (11 | 0.7%), and Transportation (6 | 0.4%).
Production, Transportation and Moving Occupations by Sex
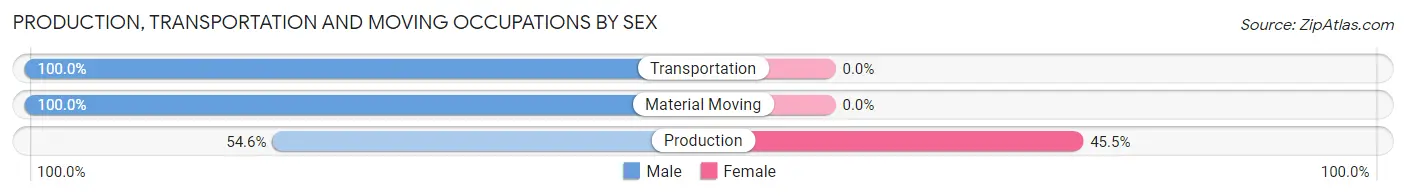
| Occupation | Male | Female |
| Production | 6 (54.5%) | 5 (45.5%) |
| Transportation | 6 (100.0%) | 0 (0.0%) |
| Material Moving | 17 (100.0%) | 0 (0.0%) |
| Total (Category) | 29 (85.3%) | 5 (14.7%) |
| Total (Overall) | 857 (52.5%) | 776 (47.5%) |
Employment Industries by Sex in Lake Lotawana
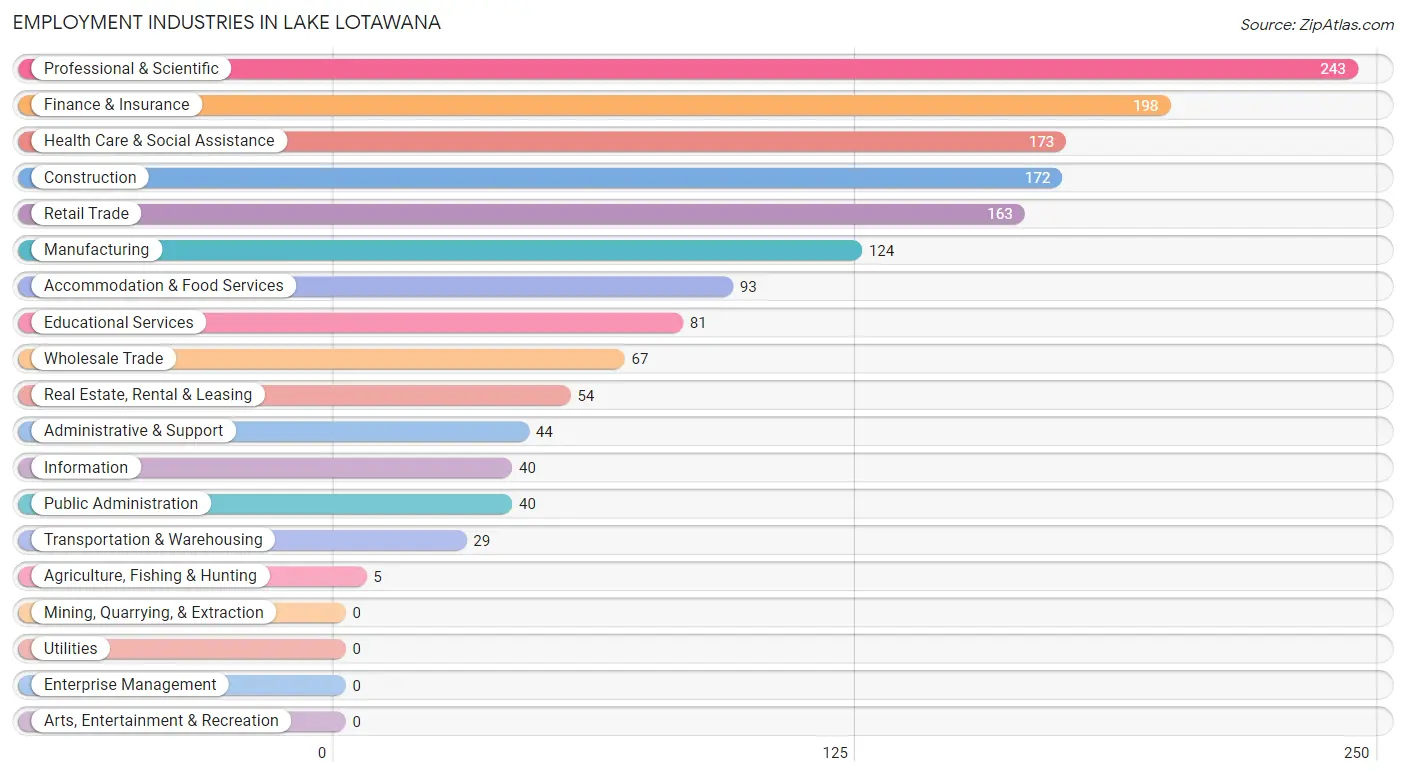
Employment Industries in Lake Lotawana
The major employment industries in Lake Lotawana include Professional & Scientific (243 | 14.9%), Finance & Insurance (198 | 12.1%), Health Care & Social Assistance (173 | 10.6%), Construction (172 | 10.5%), and Retail Trade (163 | 10.0%).
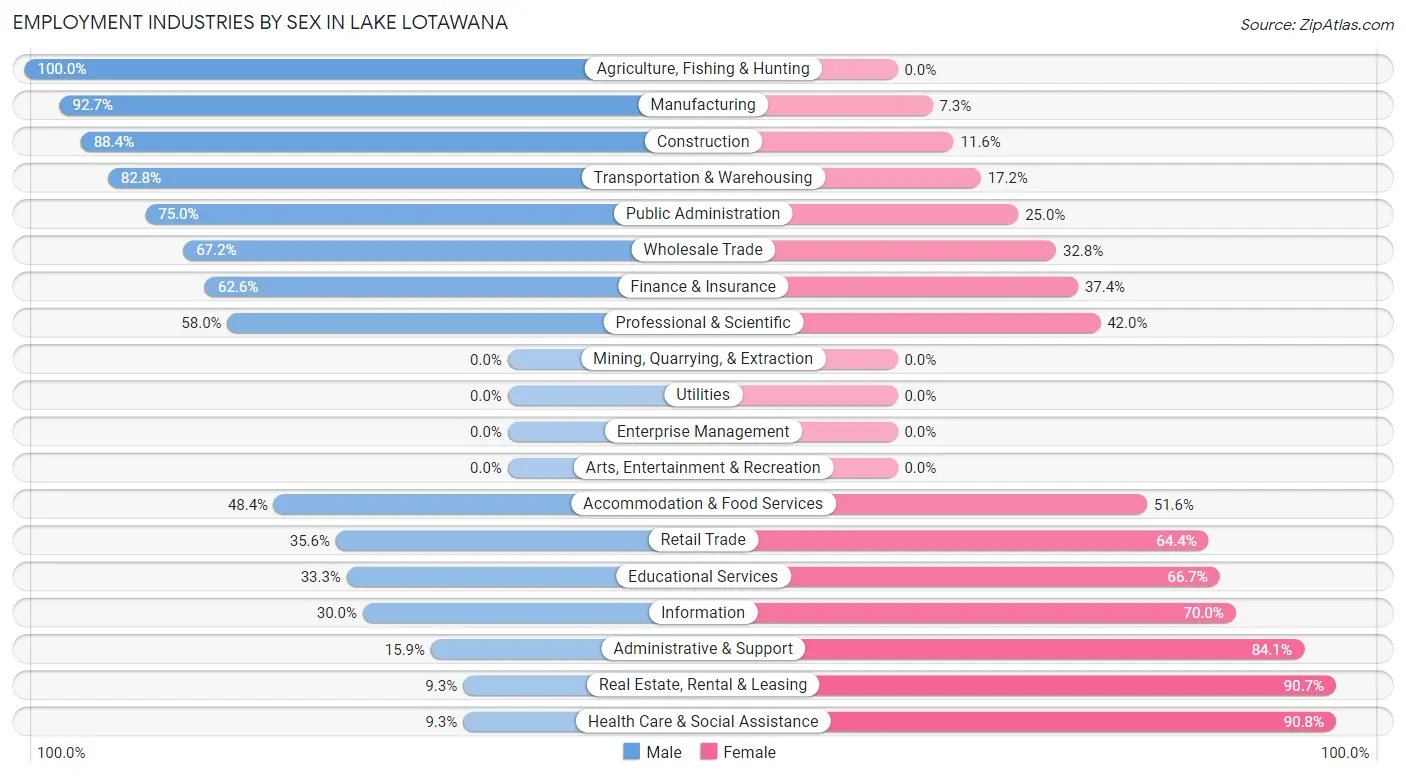
Employment Industries by Sex in Lake Lotawana
The Lake Lotawana industries that see more men than women are Agriculture, Fishing & Hunting (100.0%), Manufacturing (92.7%), and Construction (88.4%), whereas the industries that tend to have a higher number of women are Health Care & Social Assistance (90.7%), Real Estate, Rental & Leasing (90.7%), and Administrative & Support (84.1%).
| Industry | Male | Female |
| Agriculture, Fishing & Hunting | 5 (100.0%) | 0 (0.0%) |
| Mining, Quarrying, & Extraction | 0 (0.0%) | 0 (0.0%) |
| Construction | 152 (88.4%) | 20 (11.6%) |
| Manufacturing | 115 (92.7%) | 9 (7.3%) |
| Wholesale Trade | 45 (67.2%) | 22 (32.8%) |
| Retail Trade | 58 (35.6%) | 105 (64.4%) |
| Transportation & Warehousing | 24 (82.8%) | 5 (17.2%) |
| Utilities | 0 (0.0%) | 0 (0.0%) |
| Information | 12 (30.0%) | 28 (70.0%) |
| Finance & Insurance | 124 (62.6%) | 74 (37.4%) |
| Real Estate, Rental & Leasing | 5 (9.3%) | 49 (90.7%) |
| Professional & Scientific | 141 (58.0%) | 102 (42.0%) |
| Enterprise Management | 0 (0.0%) | 0 (0.0%) |
| Administrative & Support | 7 (15.9%) | 37 (84.1%) |
| Educational Services | 27 (33.3%) | 54 (66.7%) |
| Health Care & Social Assistance | 16 (9.2%) | 157 (90.7%) |
| Arts, Entertainment & Recreation | 0 (0.0%) | 0 (0.0%) |
| Accommodation & Food Services | 45 (48.4%) | 48 (51.6%) |
| Public Administration | 30 (75.0%) | 10 (25.0%) |
| Total | 857 (52.5%) | 776 (47.5%) |
Education in Lake Lotawana
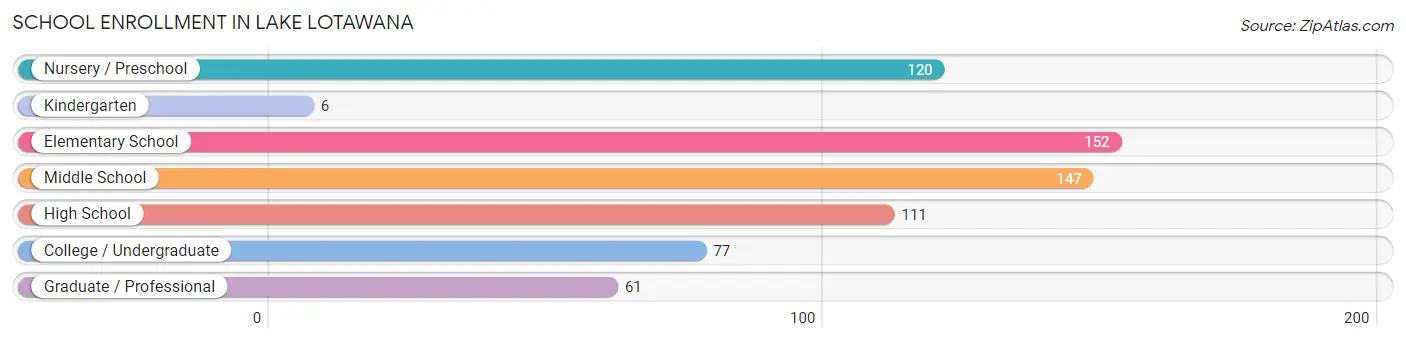
School Enrollment in Lake Lotawana
The most common levels of schooling among the 674 students in Lake Lotawana are elementary school (152 | 22.6%), middle school (147 | 21.8%), and nursery / preschool (120 | 17.8%).
| School Level | # Students | % Students |
| Nursery / Preschool | 120 | 17.8% |
| Kindergarten | 6 | 0.9% |
| Elementary School | 152 | 22.6% |
| Middle School | 147 | 21.8% |
| High School | 111 | 16.5% |
| College / Undergraduate | 77 | 11.4% |
| Graduate / Professional | 61 | 9.0% |
| Total | 674 | 100.0% |
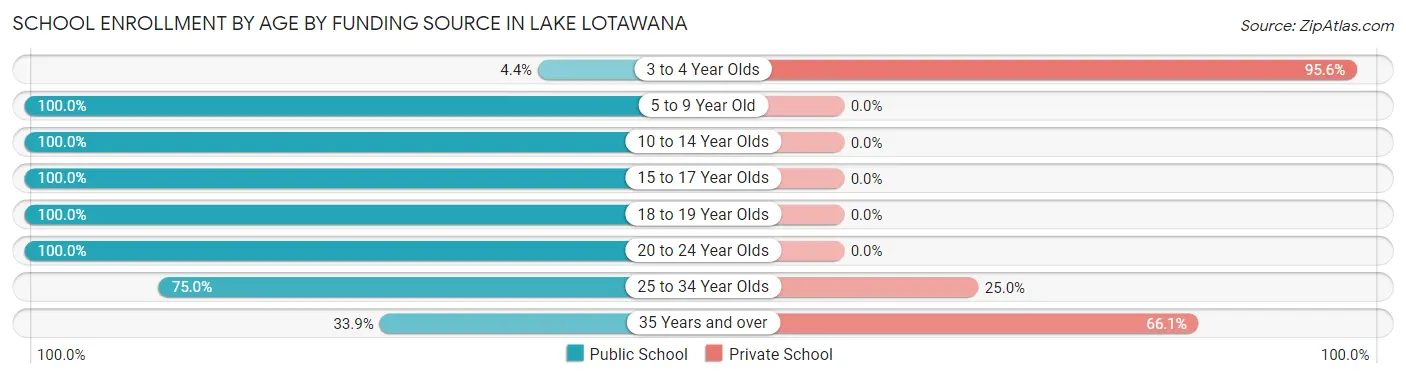
School Enrollment by Age by Funding Source in Lake Lotawana
Out of a total of 674 students who are enrolled in schools in Lake Lotawana, 156 (23.1%) attend a private institution, while the remaining 518 (76.9%) are enrolled in public schools. The age group of 3 to 4 year olds has the highest likelihood of being enrolled in private schools, with 109 (95.6% in the age bracket) enrolled. Conversely, the age group of 5 to 9 year old has the lowest likelihood of being enrolled in a private school, with 164 (100.0% in the age bracket) attending a public institution.
| Age Bracket | Public School | Private School |
| 3 to 4 Year Olds | 5 (4.4%) | 109 (95.6%) |
| 5 to 9 Year Old | 164 (100.0%) | 0 (0.0%) |
| 10 to 14 Year Olds | 159 (100.0%) | 0 (0.0%) |
| 15 to 17 Year Olds | 99 (100.0%) | 0 (0.0%) |
| 18 to 19 Year Olds | 30 (100.0%) | 0 (0.0%) |
| 20 to 24 Year Olds | 17 (100.0%) | 0 (0.0%) |
| 25 to 34 Year Olds | 24 (75.0%) | 8 (25.0%) |
| 35 Years and over | 20 (33.9%) | 39 (66.1%) |
| Total | 518 (76.9%) | 156 (23.1%) |
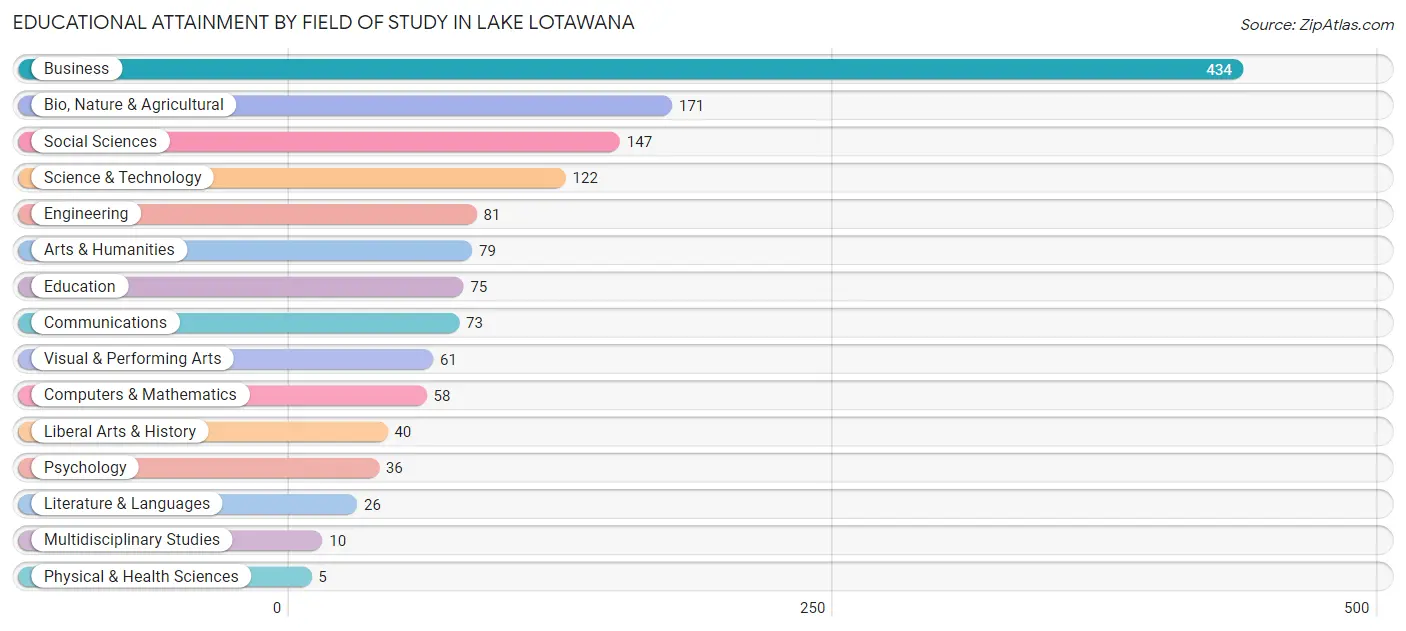
Educational Attainment by Field of Study in Lake Lotawana
Business (434 | 30.6%), bio, nature & agricultural (171 | 12.1%), social sciences (147 | 10.4%), science & technology (122 | 8.6%), and engineering (81 | 5.7%) are the most common fields of study among 1,418 individuals in Lake Lotawana who have obtained a bachelor's degree or higher.
| Field of Study | # Graduates | % Graduates |
| Computers & Mathematics | 58 | 4.1% |
| Bio, Nature & Agricultural | 171 | 12.1% |
| Physical & Health Sciences | 5 | 0.4% |
| Psychology | 36 | 2.5% |
| Social Sciences | 147 | 10.4% |
| Engineering | 81 | 5.7% |
| Multidisciplinary Studies | 10 | 0.7% |
| Science & Technology | 122 | 8.6% |
| Business | 434 | 30.6% |
| Education | 75 | 5.3% |
| Literature & Languages | 26 | 1.8% |
| Liberal Arts & History | 40 | 2.8% |
| Visual & Performing Arts | 61 | 4.3% |
| Communications | 73 | 5.1% |
| Arts & Humanities | 79 | 5.6% |
| Total | 1,418 | 100.0% |
Transportation & Commute in Lake Lotawana
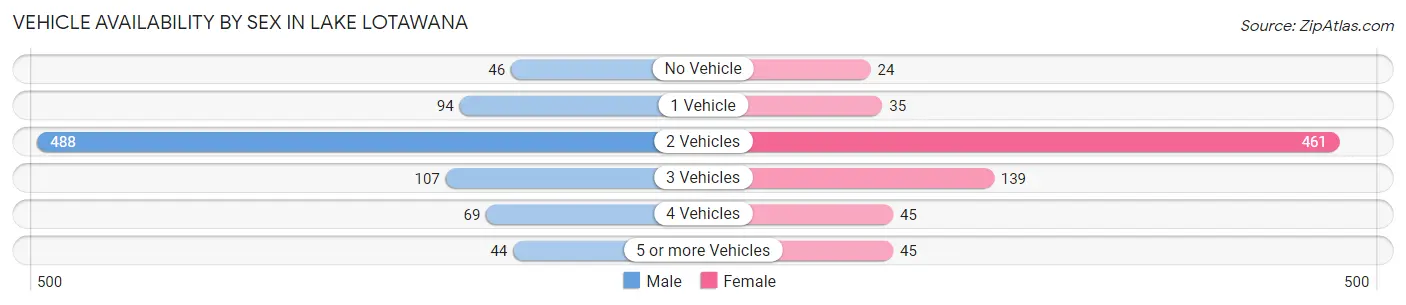
Vehicle Availability by Sex in Lake Lotawana
The most prevalent vehicle ownership categories in Lake Lotawana are males with 2 vehicles (488, accounting for 57.6%) and females with 2 vehicles (461, making up 65.1%).
| Vehicles Available | Male | Female |
| No Vehicle | 46 (5.4%) | 24 (3.2%) |
| 1 Vehicle | 94 (11.1%) | 35 (4.7%) |
| 2 Vehicles | 488 (57.6%) | 461 (61.6%) |
| 3 Vehicles | 107 (12.6%) | 139 (18.6%) |
| 4 Vehicles | 69 (8.1%) | 45 (6.0%) |
| 5 or more Vehicles | 44 (5.2%) | 45 (6.0%) |
| Total | 848 (100.0%) | 749 (100.0%) |
Commute Time in Lake Lotawana
The most frequently occuring commute durations in Lake Lotawana are 30 to 34 minutes (344 commuters, 27.2%), 45 to 59 minutes (186 commuters, 14.7%), and 15 to 19 minutes (117 commuters, 9.2%).
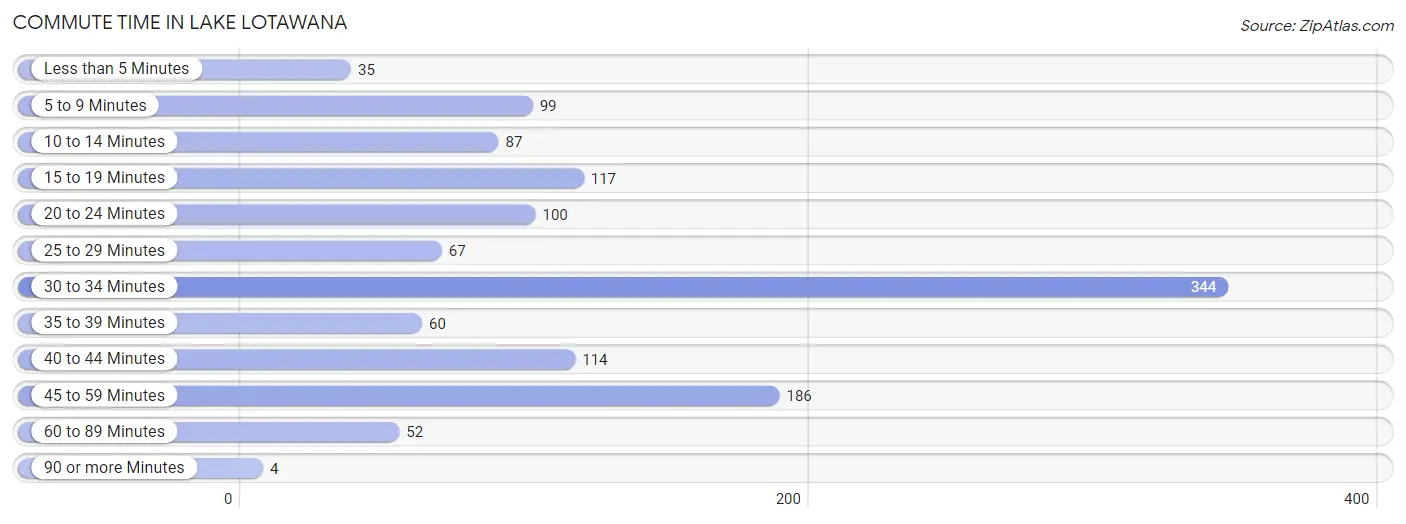
| Commute Time | # Commuters | % Commuters |
| Less than 5 Minutes | 35 | 2.8% |
| 5 to 9 Minutes | 99 | 7.8% |
| 10 to 14 Minutes | 87 | 6.9% |
| 15 to 19 Minutes | 117 | 9.2% |
| 20 to 24 Minutes | 100 | 7.9% |
| 25 to 29 Minutes | 67 | 5.3% |
| 30 to 34 Minutes | 344 | 27.2% |
| 35 to 39 Minutes | 60 | 4.7% |
| 40 to 44 Minutes | 114 | 9.0% |
| 45 to 59 Minutes | 186 | 14.7% |
| 60 to 89 Minutes | 52 | 4.1% |
| 90 or more Minutes | 4 | 0.3% |
Commute Time by Sex in Lake Lotawana
The most common commute times in Lake Lotawana are 30 to 34 minutes (248 commuters, 34.4%) for males and 45 to 59 minutes (118 commuters, 21.7%) for females.
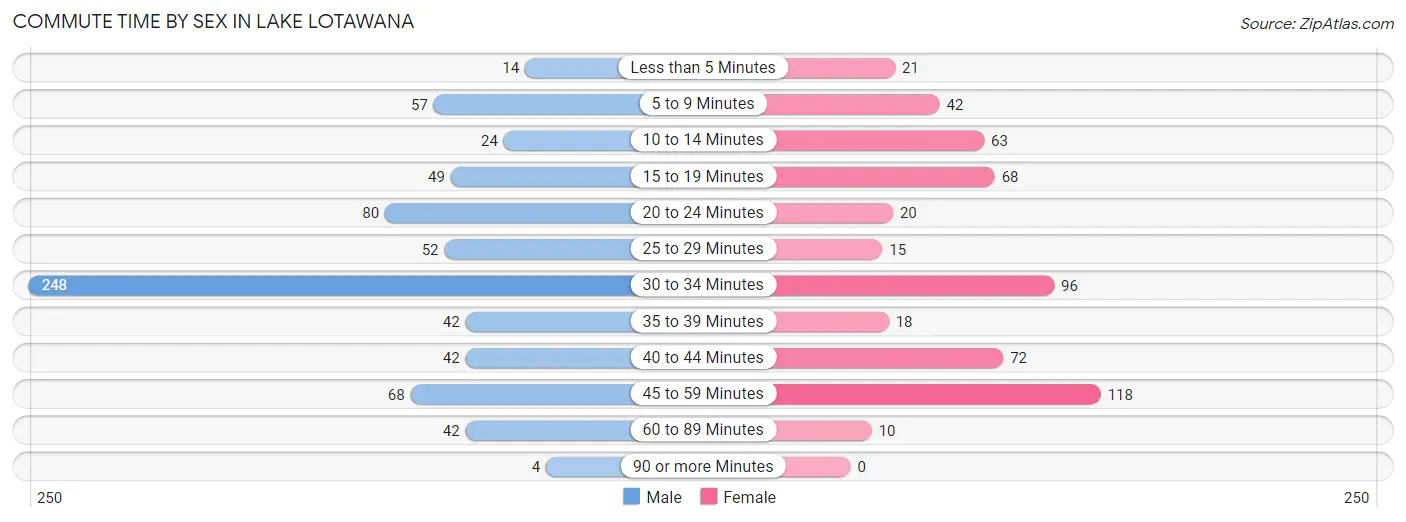
| Commute Time | Male | Female |
| Less than 5 Minutes | 14 (1.9%) | 21 (3.9%) |
| 5 to 9 Minutes | 57 (7.9%) | 42 (7.7%) |
| 10 to 14 Minutes | 24 (3.3%) | 63 (11.6%) |
| 15 to 19 Minutes | 49 (6.8%) | 68 (12.5%) |
| 20 to 24 Minutes | 80 (11.1%) | 20 (3.7%) |
| 25 to 29 Minutes | 52 (7.2%) | 15 (2.8%) |
| 30 to 34 Minutes | 248 (34.4%) | 96 (17.7%) |
| 35 to 39 Minutes | 42 (5.8%) | 18 (3.3%) |
| 40 to 44 Minutes | 42 (5.8%) | 72 (13.3%) |
| 45 to 59 Minutes | 68 (9.4%) | 118 (21.7%) |
| 60 to 89 Minutes | 42 (5.8%) | 10 (1.8%) |
| 90 or more Minutes | 4 (0.5%) | 0 (0.0%) |
Time of Departure to Work by Sex in Lake Lotawana
The most frequent times of departure to work in Lake Lotawana are 6:00 AM to 6:29 AM (120, 16.6%) for males and 10:00 AM to 10:59 AM (102, 18.8%) for females.
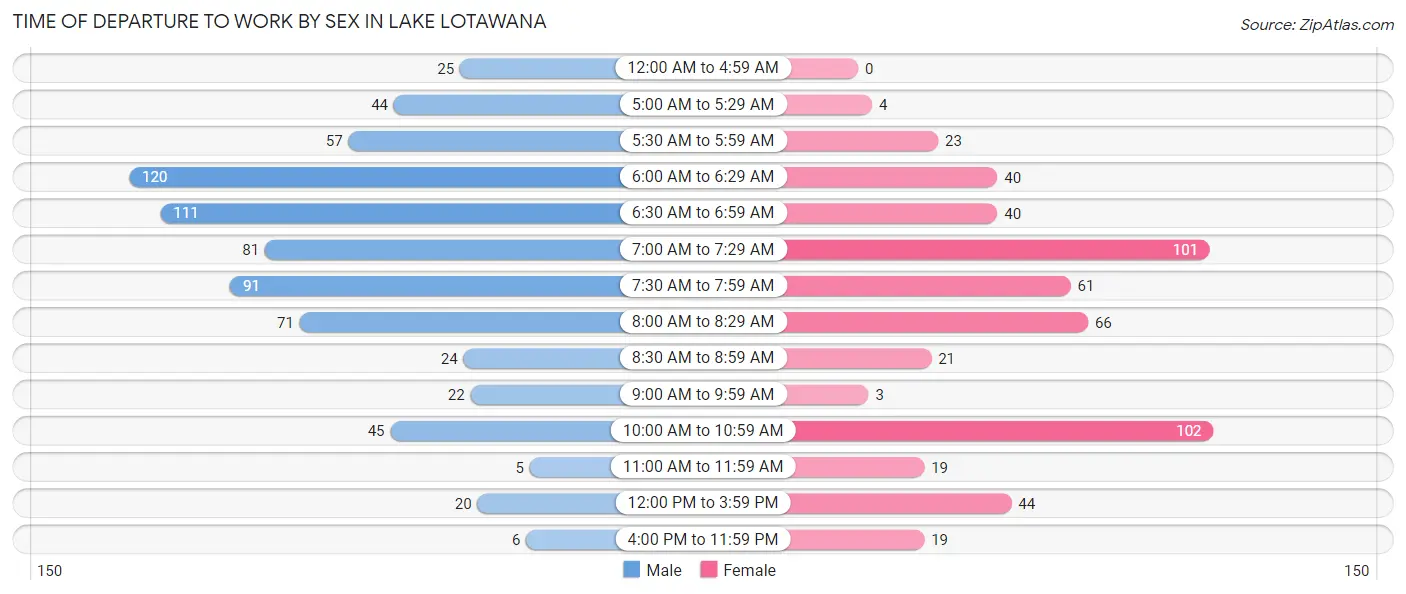
| Time of Departure | Male | Female |
| 12:00 AM to 4:59 AM | 25 (3.5%) | 0 (0.0%) |
| 5:00 AM to 5:29 AM | 44 (6.1%) | 4 (0.7%) |
| 5:30 AM to 5:59 AM | 57 (7.9%) | 23 (4.2%) |
| 6:00 AM to 6:29 AM | 120 (16.6%) | 40 (7.4%) |
| 6:30 AM to 6:59 AM | 111 (15.4%) | 40 (7.4%) |
| 7:00 AM to 7:29 AM | 81 (11.2%) | 101 (18.6%) |
| 7:30 AM to 7:59 AM | 91 (12.6%) | 61 (11.2%) |
| 8:00 AM to 8:29 AM | 71 (9.8%) | 66 (12.1%) |
| 8:30 AM to 8:59 AM | 24 (3.3%) | 21 (3.9%) |
| 9:00 AM to 9:59 AM | 22 (3.0%) | 3 (0.5%) |
| 10:00 AM to 10:59 AM | 45 (6.2%) | 102 (18.8%) |
| 11:00 AM to 11:59 AM | 5 (0.7%) | 19 (3.5%) |
| 12:00 PM to 3:59 PM | 20 (2.8%) | 44 (8.1%) |
| 4:00 PM to 11:59 PM | 6 (0.8%) | 19 (3.5%) |
| Total | 722 (100.0%) | 543 (100.0%) |
Housing Occupancy in Lake Lotawana
Occupancy by Ownership in Lake Lotawana
Of the total 1,116 dwellings in Lake Lotawana, owner-occupied units account for 998 (89.4%), while renter-occupied units make up 118 (10.6%).
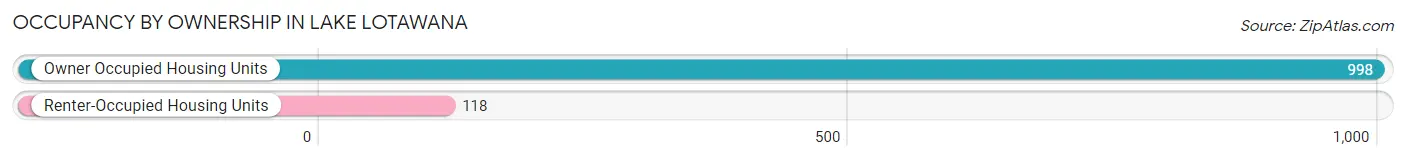
| Occupancy | # Housing Units | % Housing Units |
| Owner Occupied Housing Units | 998 | 89.4% |
| Renter-Occupied Housing Units | 118 | 10.6% |
| Total Occupied Housing Units | 1,116 | 100.0% |
Occupancy by Household Size in Lake Lotawana
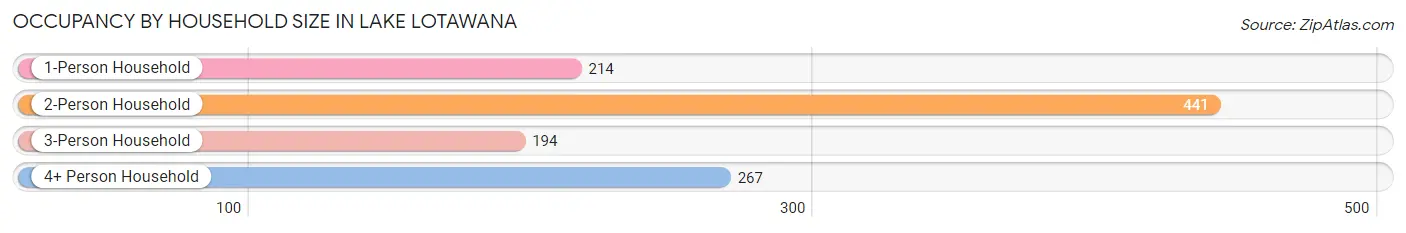
| Household Size | # Housing Units | % Housing Units |
| 1-Person Household | 214 | 19.2% |
| 2-Person Household | 441 | 39.5% |
| 3-Person Household | 194 | 17.4% |
| 4+ Person Household | 267 | 23.9% |
| Total Housing Units | 1,116 | 100.0% |
Occupancy by Ownership by Household Size in Lake Lotawana
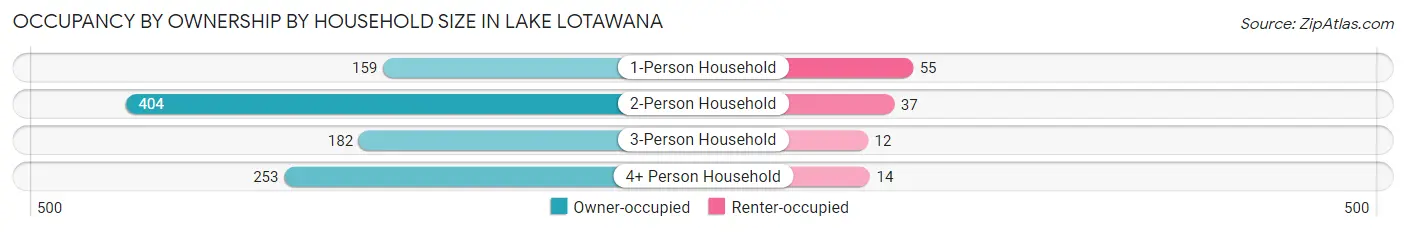
| Household Size | Owner-occupied | Renter-occupied |
| 1-Person Household | 159 (74.3%) | 55 (25.7%) |
| 2-Person Household | 404 (91.6%) | 37 (8.4%) |
| 3-Person Household | 182 (93.8%) | 12 (6.2%) |
| 4+ Person Household | 253 (94.8%) | 14 (5.2%) |
| Total Housing Units | 998 (89.4%) | 118 (10.6%) |
Occupancy by Educational Attainment in Lake Lotawana
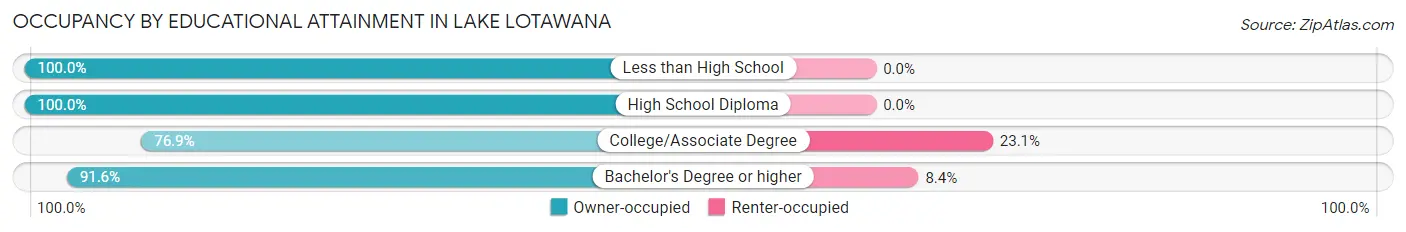
| Household Size | Owner-occupied | Renter-occupied |
| Less than High School | 20 (100.0%) | 0 (0.0%) |
| High School Diploma | 114 (100.0%) | 0 (0.0%) |
| College/Associate Degree | 186 (76.9%) | 56 (23.1%) |
| Bachelor's Degree or higher | 678 (91.6%) | 62 (8.4%) |
Occupancy by Age of Householder in Lake Lotawana
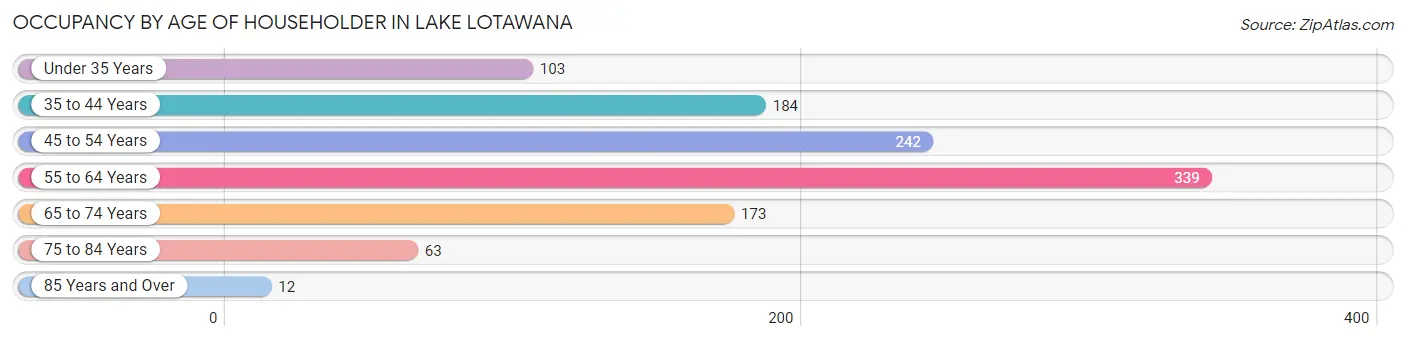
| Age Bracket | # Households | % Households |
| Under 35 Years | 103 | 9.2% |
| 35 to 44 Years | 184 | 16.5% |
| 45 to 54 Years | 242 | 21.7% |
| 55 to 64 Years | 339 | 30.4% |
| 65 to 74 Years | 173 | 15.5% |
| 75 to 84 Years | 63 | 5.7% |
| 85 Years and Over | 12 | 1.1% |
| Total | 1,116 | 100.0% |
Housing Finances in Lake Lotawana
Median Income by Occupancy in Lake Lotawana
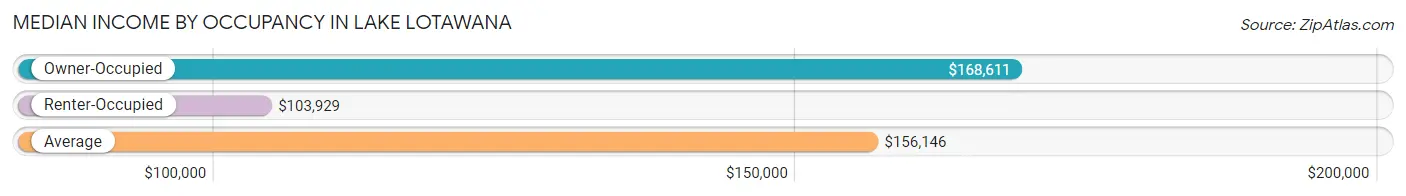
| Occupancy Type | # Households | Median Income |
| Owner-Occupied | 998 (89.4%) | $168,611 |
| Renter-Occupied | 118 (10.6%) | $103,929 |
| Average | 1,116 (100.0%) | $156,146 |
Occupancy by Householder Income Bracket in Lake Lotawana
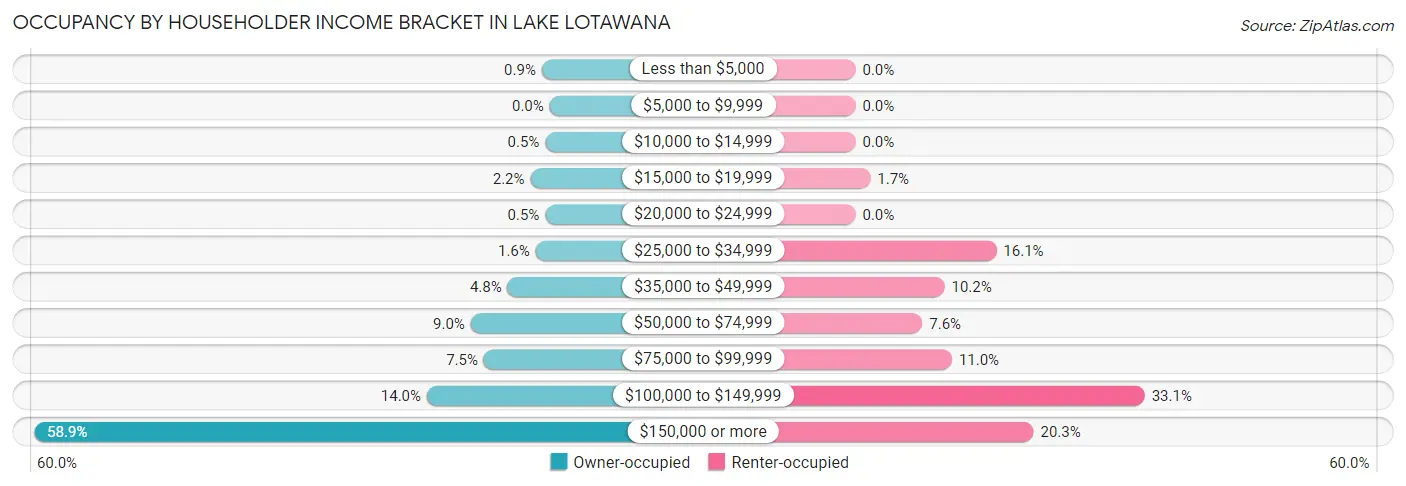
| Income Bracket | Owner-occupied | Renter-occupied |
| Less than $5,000 | 9 (0.9%) | 0 (0.0%) |
| $5,000 to $9,999 | 0 (0.0%) | 0 (0.0%) |
| $10,000 to $14,999 | 5 (0.5%) | 0 (0.0%) |
| $15,000 to $19,999 | 22 (2.2%) | 2 (1.7%) |
| $20,000 to $24,999 | 5 (0.5%) | 0 (0.0%) |
| $25,000 to $34,999 | 16 (1.6%) | 19 (16.1%) |
| $35,000 to $49,999 | 48 (4.8%) | 12 (10.2%) |
| $50,000 to $74,999 | 90 (9.0%) | 9 (7.6%) |
| $75,000 to $99,999 | 75 (7.5%) | 13 (11.0%) |
| $100,000 to $149,999 | 140 (14.0%) | 39 (33.1%) |
| $150,000 or more | 588 (58.9%) | 24 (20.3%) |
| Total | 998 (100.0%) | 118 (100.0%) |
Monthly Housing Cost Tiers in Lake Lotawana
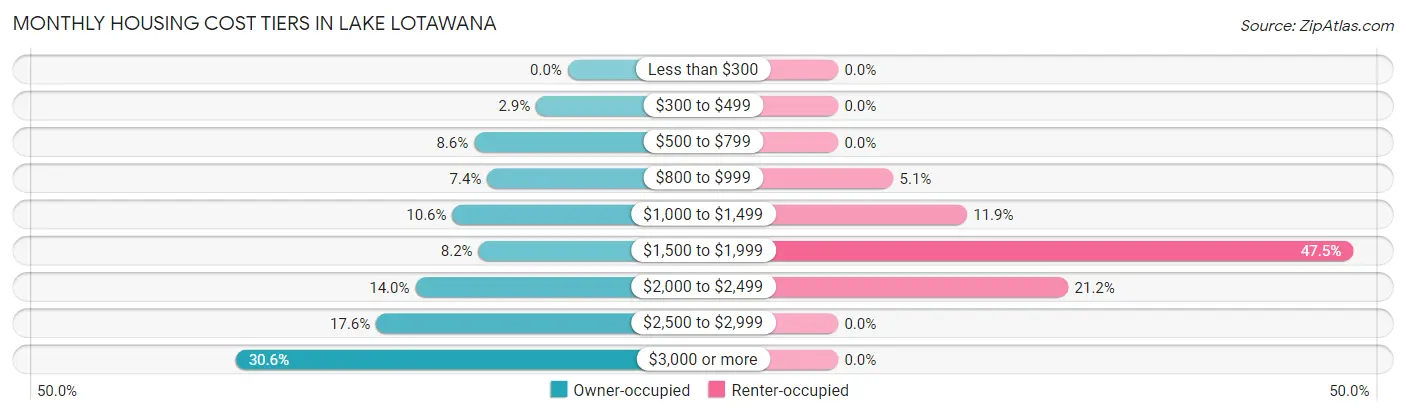
| Monthly Cost | Owner-occupied | Renter-occupied |
| Less than $300 | 0 (0.0%) | 0 (0.0%) |
| $300 to $499 | 29 (2.9%) | 0 (0.0%) |
| $500 to $799 | 86 (8.6%) | 0 (0.0%) |
| $800 to $999 | 74 (7.4%) | 6 (5.1%) |
| $1,000 to $1,499 | 106 (10.6%) | 14 (11.9%) |
| $1,500 to $1,999 | 82 (8.2%) | 56 (47.5%) |
| $2,000 to $2,499 | 140 (14.0%) | 25 (21.2%) |
| $2,500 to $2,999 | 176 (17.6%) | 0 (0.0%) |
| $3,000 or more | 305 (30.6%) | 0 (0.0%) |
| Total | 998 (100.0%) | 118 (100.0%) |
Physical Housing Characteristics in Lake Lotawana
Housing Structures in Lake Lotawana
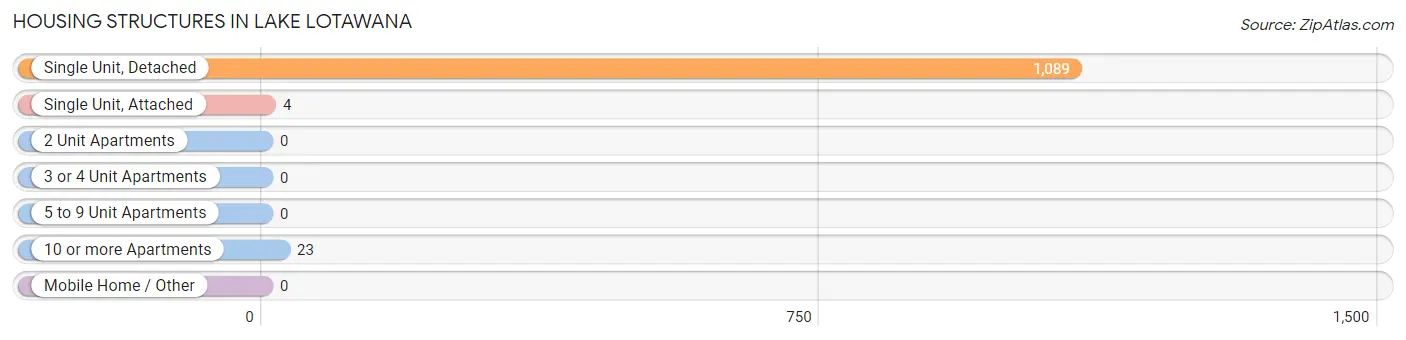
| Structure Type | # Housing Units | % Housing Units |
| Single Unit, Detached | 1,089 | 97.6% |
| Single Unit, Attached | 4 | 0.4% |
| 2 Unit Apartments | 0 | 0.0% |
| 3 or 4 Unit Apartments | 0 | 0.0% |
| 5 to 9 Unit Apartments | 0 | 0.0% |
| 10 or more Apartments | 23 | 2.1% |
| Mobile Home / Other | 0 | 0.0% |
| Total | 1,116 | 100.0% |
Housing Structures by Occupancy in Lake Lotawana
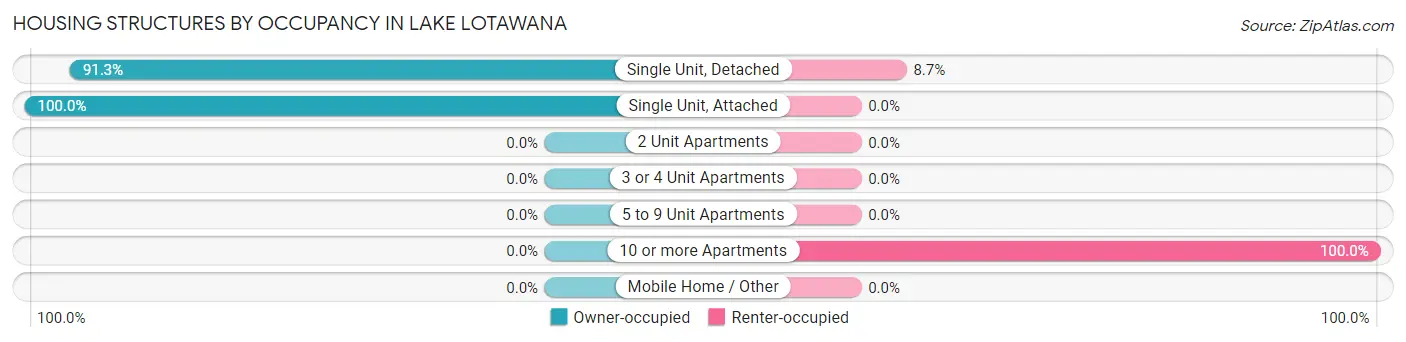
| Structure Type | Owner-occupied | Renter-occupied |
| Single Unit, Detached | 994 (91.3%) | 95 (8.7%) |
| Single Unit, Attached | 4 (100.0%) | 0 (0.0%) |
| 2 Unit Apartments | 0 (0.0%) | 0 (0.0%) |
| 3 or 4 Unit Apartments | 0 (0.0%) | 0 (0.0%) |
| 5 to 9 Unit Apartments | 0 (0.0%) | 0 (0.0%) |
| 10 or more Apartments | 0 (0.0%) | 23 (100.0%) |
| Mobile Home / Other | 0 (0.0%) | 0 (0.0%) |
| Total | 998 (89.4%) | 118 (10.6%) |
Housing Structures by Number of Rooms in Lake Lotawana
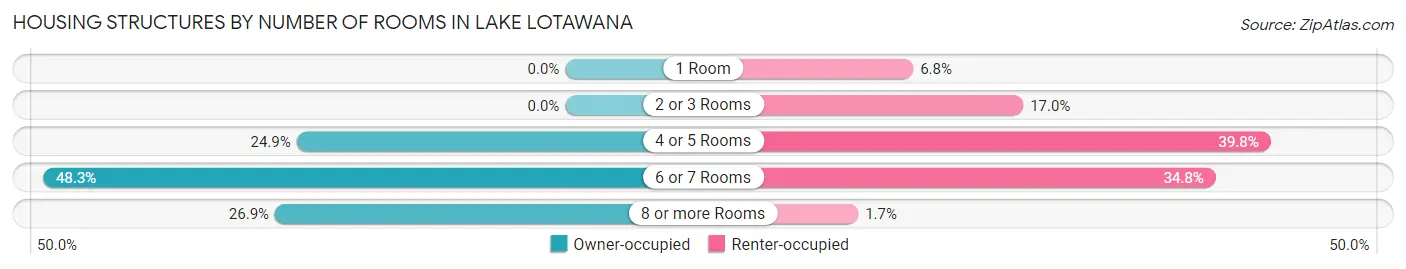
| Number of Rooms | Owner-occupied | Renter-occupied |
| 1 Room | 0 (0.0%) | 8 (6.8%) |
| 2 or 3 Rooms | 0 (0.0%) | 20 (17.0%) |
| 4 or 5 Rooms | 248 (24.8%) | 47 (39.8%) |
| 6 or 7 Rooms | 482 (48.3%) | 41 (34.7%) |
| 8 or more Rooms | 268 (26.9%) | 2 (1.7%) |
| Total | 998 (100.0%) | 118 (100.0%) |
Housing Structure by Heating Type in Lake Lotawana
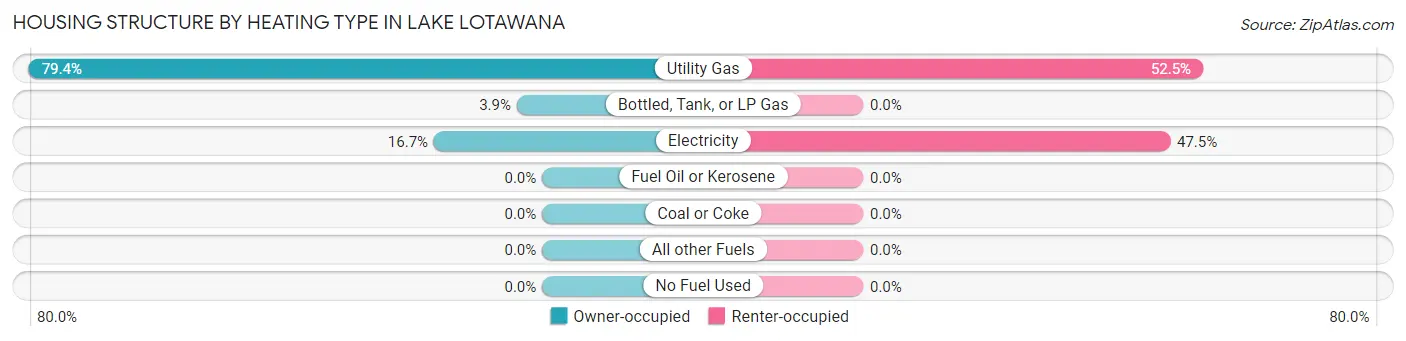
| Heating Type | Owner-occupied | Renter-occupied |
| Utility Gas | 792 (79.4%) | 62 (52.5%) |
| Bottled, Tank, or LP Gas | 39 (3.9%) | 0 (0.0%) |
| Electricity | 167 (16.7%) | 56 (47.5%) |
| Fuel Oil or Kerosene | 0 (0.0%) | 0 (0.0%) |
| Coal or Coke | 0 (0.0%) | 0 (0.0%) |
| All other Fuels | 0 (0.0%) | 0 (0.0%) |
| No Fuel Used | 0 (0.0%) | 0 (0.0%) |
| Total | 998 (100.0%) | 118 (100.0%) |
Household Vehicle Usage in Lake Lotawana
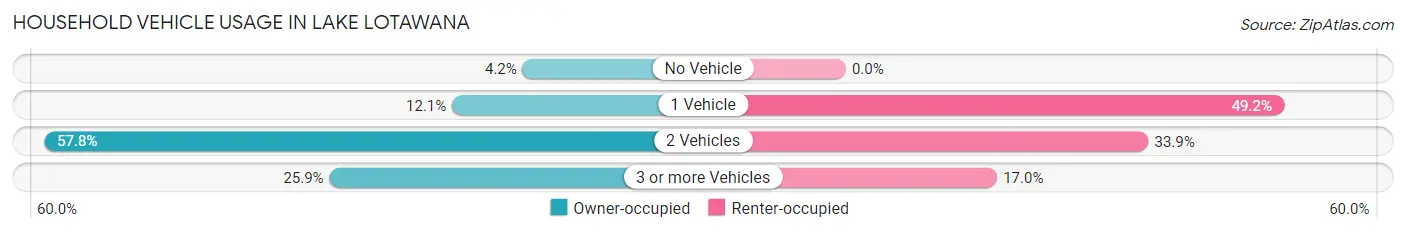
| Vehicles per Household | Owner-occupied | Renter-occupied |
| No Vehicle | 42 (4.2%) | 0 (0.0%) |
| 1 Vehicle | 121 (12.1%) | 58 (49.1%) |
| 2 Vehicles | 577 (57.8%) | 40 (33.9%) |
| 3 or more Vehicles | 258 (25.9%) | 20 (17.0%) |
| Total | 998 (100.0%) | 118 (100.0%) |
Real Estate & Mortgages in Lake Lotawana
Real Estate and Mortgage Overview in Lake Lotawana
| Characteristic | Without Mortgage | With Mortgage |
| Housing Units | 312 | 686 |
| Median Property Value | $574,700 | $502,600 |
| Median Household Income | $87,381 | $462 |
| Monthly Housing Costs | $942 | $301 |
| Real Estate Taxes | $4,726 | $4 |
Property Value by Mortgage Status in Lake Lotawana
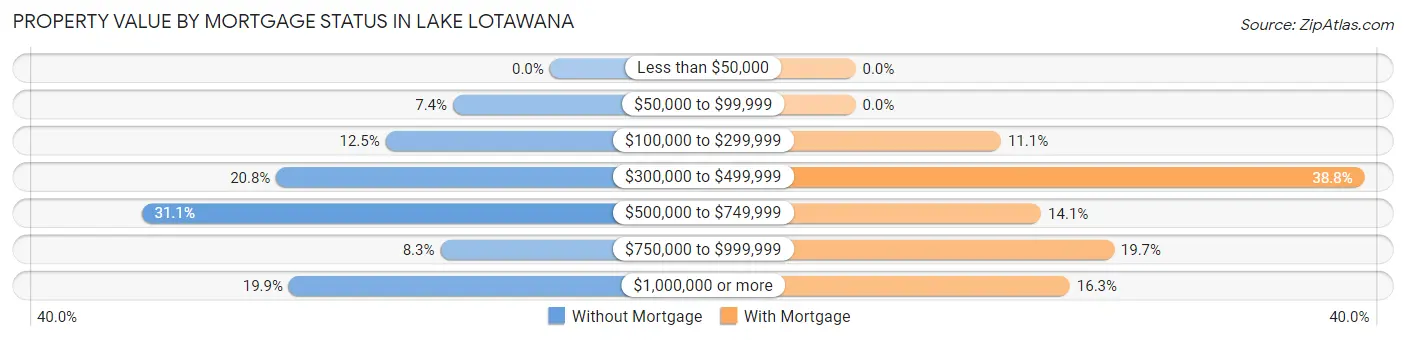
| Property Value | Without Mortgage | With Mortgage |
| Less than $50,000 | 0 (0.0%) | 0 (0.0%) |
| $50,000 to $99,999 | 23 (7.4%) | 0 (0.0%) |
| $100,000 to $299,999 | 39 (12.5%) | 76 (11.1%) |
| $300,000 to $499,999 | 65 (20.8%) | 266 (38.8%) |
| $500,000 to $749,999 | 97 (31.1%) | 97 (14.1%) |
| $750,000 to $999,999 | 26 (8.3%) | 135 (19.7%) |
| $1,000,000 or more | 62 (19.9%) | 112 (16.3%) |
| Total | 312 (100.0%) | 686 (100.0%) |
Household Income by Mortgage Status in Lake Lotawana
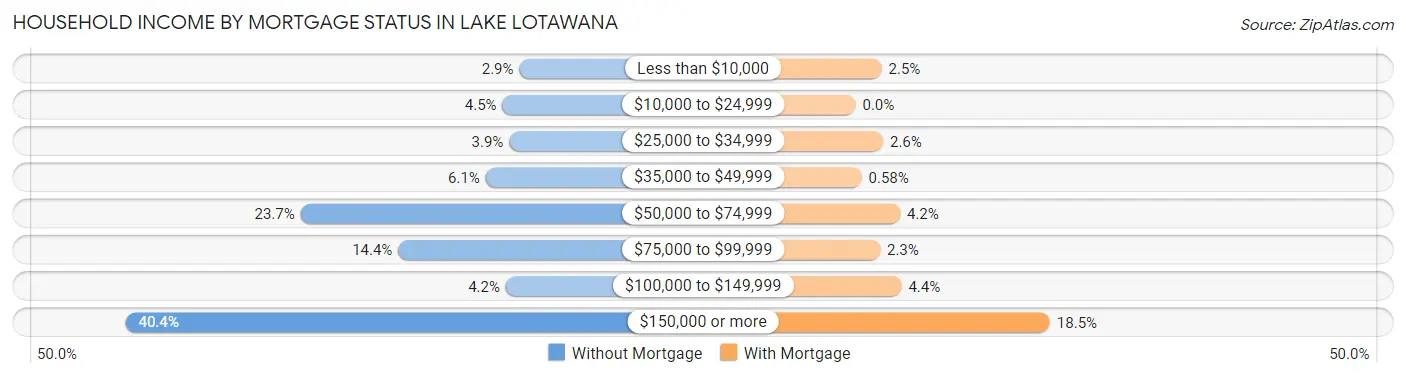
| Household Income | Without Mortgage | With Mortgage |
| Less than $10,000 | 9 (2.9%) | 17 (2.5%) |
| $10,000 to $24,999 | 14 (4.5%) | 0 (0.0%) |
| $25,000 to $34,999 | 12 (3.8%) | 18 (2.6%) |
| $35,000 to $49,999 | 19 (6.1%) | 4 (0.6%) |
| $50,000 to $74,999 | 74 (23.7%) | 29 (4.2%) |
| $75,000 to $99,999 | 45 (14.4%) | 16 (2.3%) |
| $100,000 to $149,999 | 13 (4.2%) | 30 (4.4%) |
| $150,000 or more | 126 (40.4%) | 127 (18.5%) |
| Total | 312 (100.0%) | 686 (100.0%) |
Property Value to Household Income Ratio in Lake Lotawana
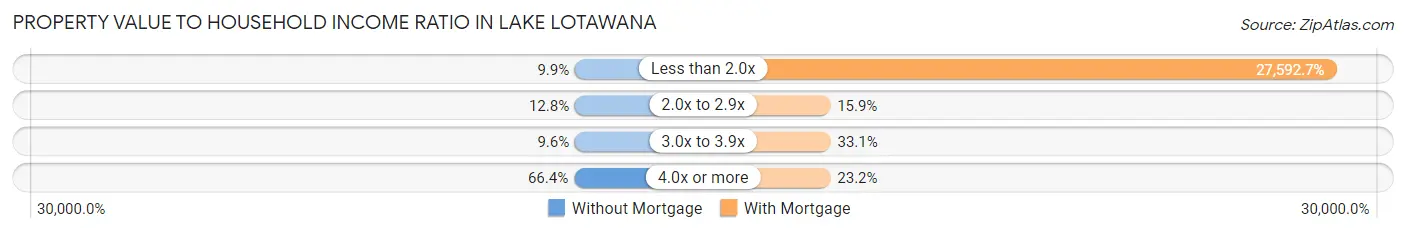
| Value-to-Income Ratio | Without Mortgage | With Mortgage |
| Less than 2.0x | 31 (9.9%) | 189,286 (27,592.7%) |
| 2.0x to 2.9x | 40 (12.8%) | 109 (15.9%) |
| 3.0x to 3.9x | 30 (9.6%) | 227 (33.1%) |
| 4.0x or more | 207 (66.3%) | 159 (23.2%) |
| Total | 312 (100.0%) | 686 (100.0%) |
Real Estate Taxes by Mortgage Status in Lake Lotawana
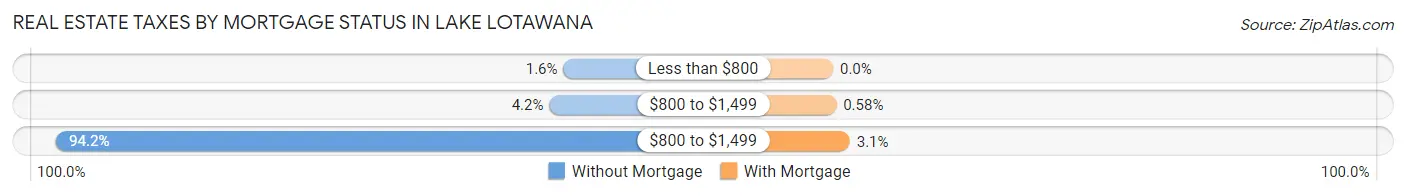
| Property Taxes | Without Mortgage | With Mortgage |
| Less than $800 | 5 (1.6%) | 0 (0.0%) |
| $800 to $1,499 | 13 (4.2%) | 4 (0.6%) |
| $800 to $1,499 | 294 (94.2%) | 21 (3.1%) |
| Total | 312 (100.0%) | 686 (100.0%) |
Health & Disability in Lake Lotawana
Health Insurance Coverage by Age in Lake Lotawana
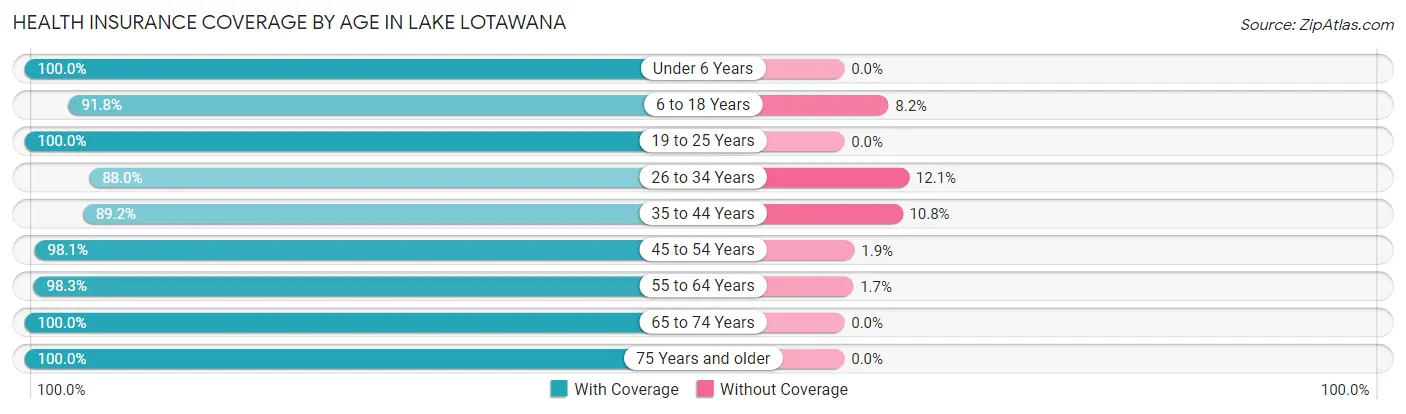
| Age Bracket | With Coverage | Without Coverage |
| Under 6 Years | 263 (100.0%) | 0 (0.0%) |
| 6 to 18 Years | 458 (91.8%) | 41 (8.2%) |
| 19 to 25 Years | 143 (100.0%) | 0 (0.0%) |
| 26 to 34 Years | 197 (87.9%) | 27 (12.0%) |
| 35 to 44 Years | 296 (89.2%) | 36 (10.8%) |
| 45 to 54 Years | 472 (98.1%) | 9 (1.9%) |
| 55 to 64 Years | 589 (98.3%) | 10 (1.7%) |
| 65 to 74 Years | 293 (100.0%) | 0 (0.0%) |
| 75 Years and older | 175 (100.0%) | 0 (0.0%) |
| Total | 2,886 (95.9%) | 123 (4.1%) |
Health Insurance Coverage by Citizenship Status in Lake Lotawana
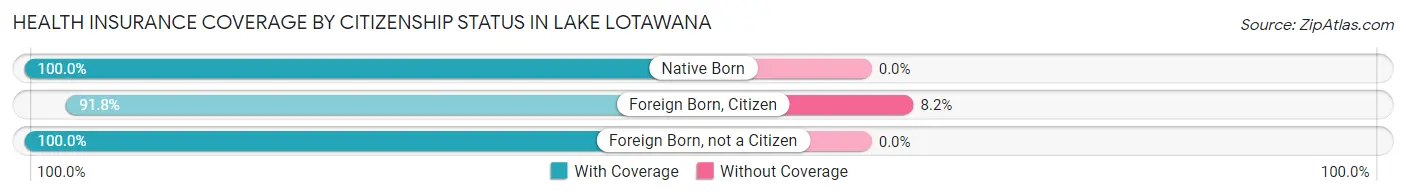
| Citizenship Status | With Coverage | Without Coverage |
| Native Born | 263 (100.0%) | 0 (0.0%) |
| Foreign Born, Citizen | 458 (91.8%) | 41 (8.2%) |
| Foreign Born, not a Citizen | 143 (100.0%) | 0 (0.0%) |
Health Insurance Coverage by Household Income in Lake Lotawana
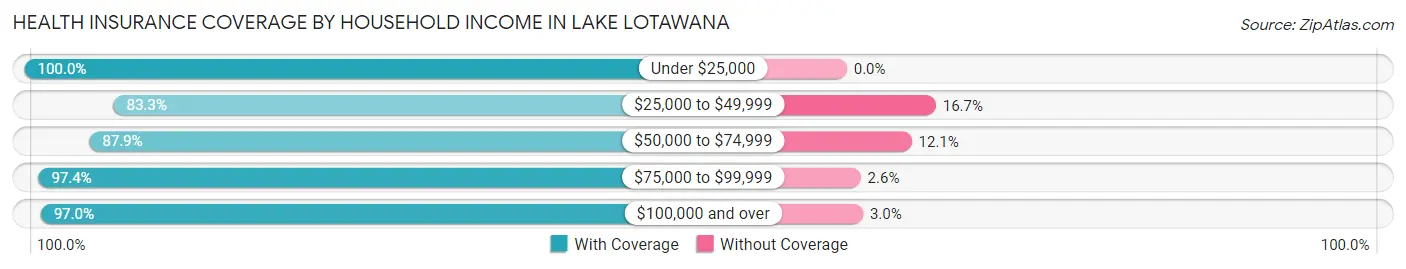
| Household Income | With Coverage | Without Coverage |
| Under $25,000 | 58 (100.0%) | 0 (0.0%) |
| $25,000 to $49,999 | 95 (83.3%) | 19 (16.7%) |
| $50,000 to $74,999 | 181 (87.9%) | 25 (12.1%) |
| $75,000 to $99,999 | 187 (97.4%) | 5 (2.6%) |
| $100,000 and over | 2,365 (97.0%) | 74 (3.0%) |
Public vs Private Health Insurance Coverage by Age in Lake Lotawana
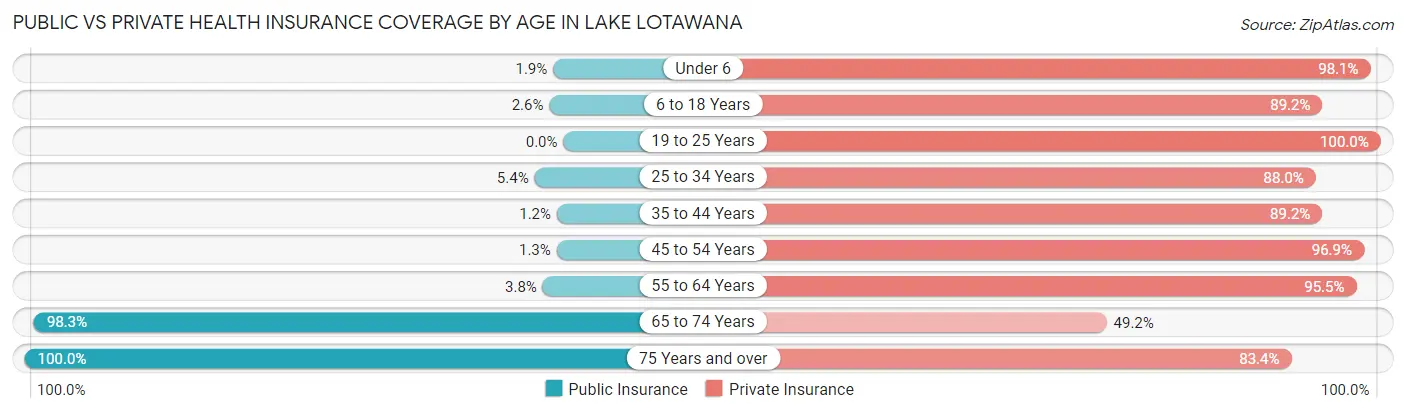
| Age Bracket | Public Insurance | Private Insurance |
| Under 6 | 5 (1.9%) | 258 (98.1%) |
| 6 to 18 Years | 13 (2.6%) | 445 (89.2%) |
| 19 to 25 Years | 0 (0.0%) | 143 (100.0%) |
| 25 to 34 Years | 12 (5.4%) | 197 (87.9%) |
| 35 to 44 Years | 4 (1.2%) | 296 (89.2%) |
| 45 to 54 Years | 6 (1.3%) | 466 (96.9%) |
| 55 to 64 Years | 23 (3.8%) | 572 (95.5%) |
| 65 to 74 Years | 288 (98.3%) | 144 (49.1%) |
| 75 Years and over | 175 (100.0%) | 146 (83.4%) |
| Total | 526 (17.5%) | 2,667 (88.6%) |
Disability Status by Sex by Age in Lake Lotawana
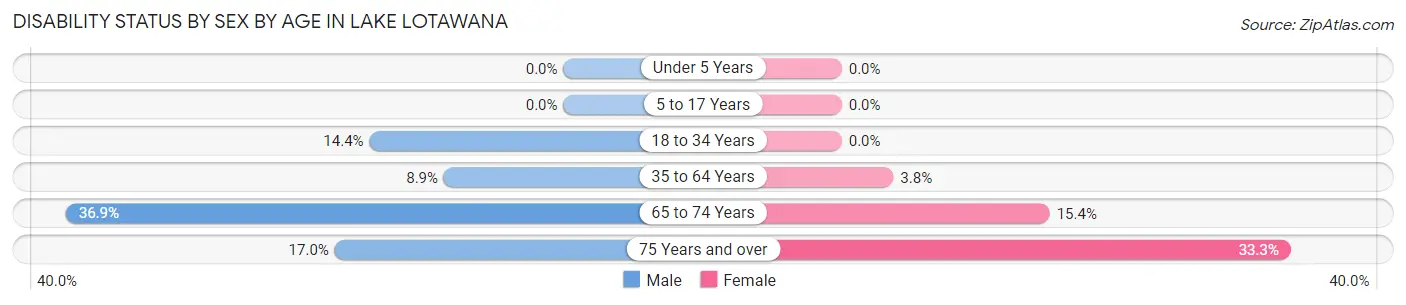
| Age Bracket | Male | Female |
| Under 5 Years | 0 (0.0%) | 0 (0.0%) |
| 5 to 17 Years | 0 (0.0%) | 0 (0.0%) |
| 18 to 34 Years | 36 (14.4%) | 0 (0.0%) |
| 35 to 64 Years | 65 (8.9%) | 26 (3.8%) |
| 65 to 74 Years | 58 (36.9%) | 21 (15.4%) |
| 75 Years and over | 18 (17.0%) | 23 (33.3%) |
Disability Class by Sex by Age in Lake Lotawana
Disability Class: Hearing Difficulty
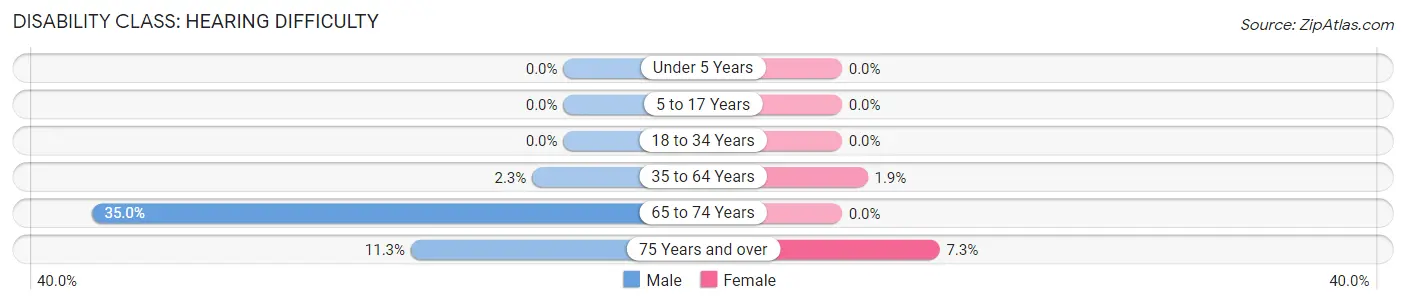
| Age Bracket | Male | Female |
| Under 5 Years | 0 (0.0%) | 0 (0.0%) |
| 5 to 17 Years | 0 (0.0%) | 0 (0.0%) |
| 18 to 34 Years | 0 (0.0%) | 0 (0.0%) |
| 35 to 64 Years | 17 (2.3%) | 13 (1.9%) |
| 65 to 74 Years | 55 (35.0%) | 0 (0.0%) |
| 75 Years and over | 12 (11.3%) | 5 (7.2%) |
Disability Class: Vision Difficulty
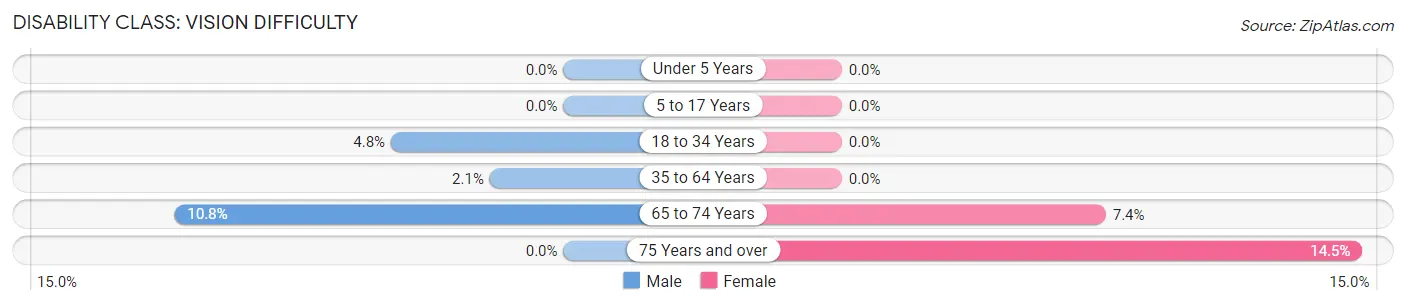
| Age Bracket | Male | Female |
| Under 5 Years | 0 (0.0%) | 0 (0.0%) |
| 5 to 17 Years | 0 (0.0%) | 0 (0.0%) |
| 18 to 34 Years | 12 (4.8%) | 0 (0.0%) |
| 35 to 64 Years | 15 (2.1%) | 0 (0.0%) |
| 65 to 74 Years | 17 (10.8%) | 10 (7.3%) |
| 75 Years and over | 0 (0.0%) | 10 (14.5%) |
Disability Class: Cognitive Difficulty
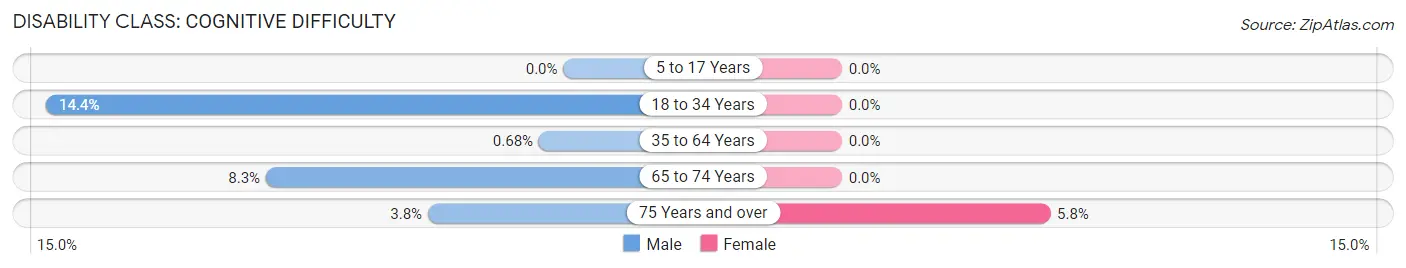
| Age Bracket | Male | Female |
| 5 to 17 Years | 0 (0.0%) | 0 (0.0%) |
| 18 to 34 Years | 36 (14.4%) | 0 (0.0%) |
| 35 to 64 Years | 5 (0.7%) | 0 (0.0%) |
| 65 to 74 Years | 13 (8.3%) | 0 (0.0%) |
| 75 Years and over | 4 (3.8%) | 4 (5.8%) |
Disability Class: Ambulatory Difficulty
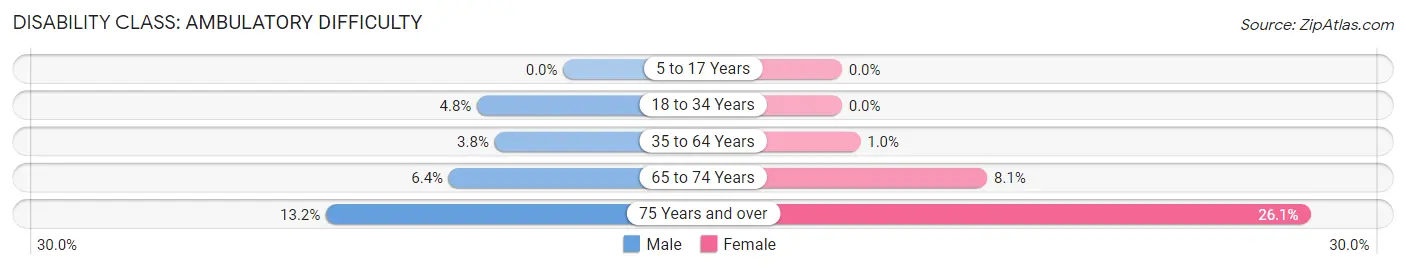
| Age Bracket | Male | Female |
| 5 to 17 Years | 0 (0.0%) | 0 (0.0%) |
| 18 to 34 Years | 12 (4.8%) | 0 (0.0%) |
| 35 to 64 Years | 28 (3.8%) | 7 (1.0%) |
| 65 to 74 Years | 10 (6.4%) | 11 (8.1%) |
| 75 Years and over | 14 (13.2%) | 18 (26.1%) |
Disability Class: Self-Care Difficulty
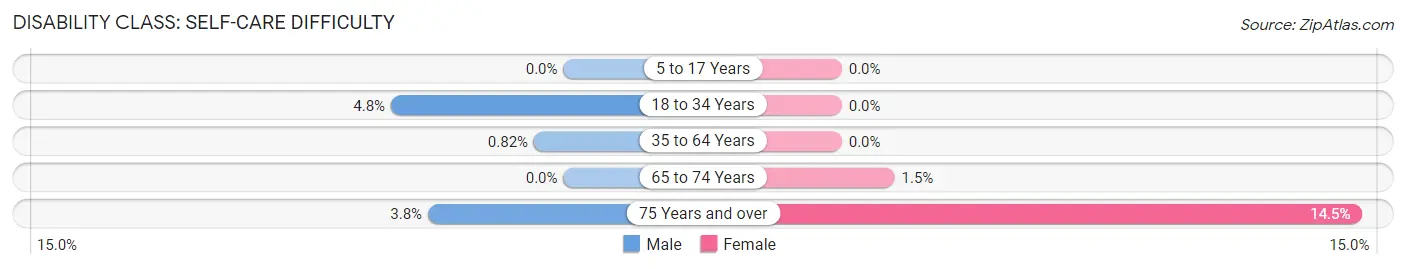
| Age Bracket | Male | Female |
| 5 to 17 Years | 0 (0.0%) | 0 (0.0%) |
| 18 to 34 Years | 12 (4.8%) | 0 (0.0%) |
| 35 to 64 Years | 6 (0.8%) | 0 (0.0%) |
| 65 to 74 Years | 0 (0.0%) | 2 (1.5%) |
| 75 Years and over | 4 (3.8%) | 10 (14.5%) |
Technology Access in Lake Lotawana
Computing Device Access in Lake Lotawana
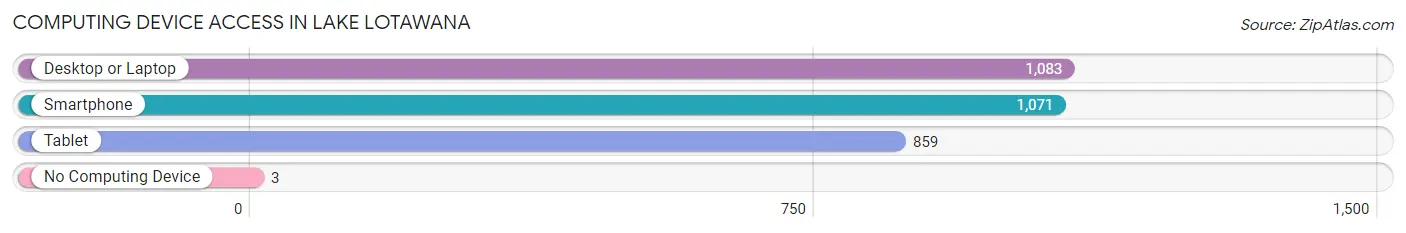
| Device Type | # Households | % Households |
| Desktop or Laptop | 1,083 | 97.0% |
| Smartphone | 1,071 | 96.0% |
| Tablet | 859 | 77.0% |
| No Computing Device | 3 | 0.3% |
| Total | 1,116 | 100.0% |
Internet Access in Lake Lotawana
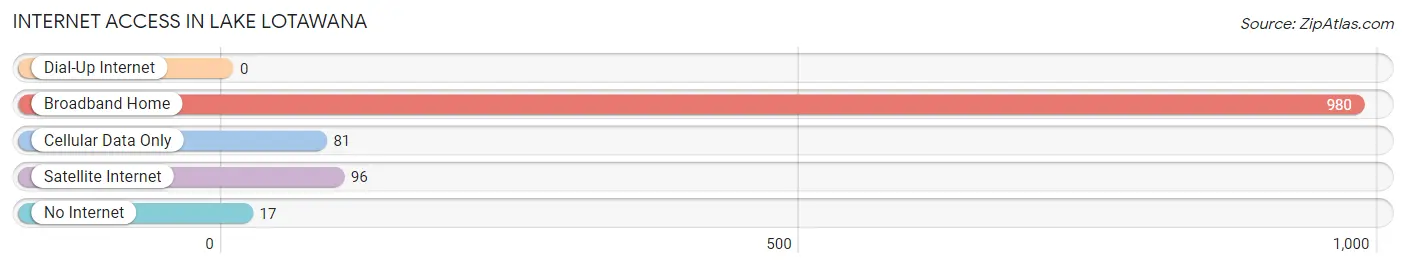
| Internet Type | # Households | % Households |
| Dial-Up Internet | 0 | 0.0% |
| Broadband Home | 980 | 87.8% |
| Cellular Data Only | 81 | 7.3% |
| Satellite Internet | 96 | 8.6% |
| No Internet | 17 | 1.5% |
| Total | 1,116 | 100.0% |
Lake Lotawana Summary
Lotawana, Missouri is a small city located in the eastern part of Jackson County, Missouri. It is situated on the shore of Lake Lotawana, a man-made lake that was created in the early 1900s. The city is located approximately 20 miles southeast of Kansas City, Missouri and is part of the Kansas City metropolitan area.
History
The area that is now Lotawana was originally inhabited by the Osage Indians. The first white settlers arrived in the area in the early 1800s. The area was originally known as “The Narrows” due to its narrow strip of land between the Missouri and Kansas Rivers. In the late 1800s, the area was developed as a resort community. The first hotel was built in 1891 and the first post office was established in 1895.
In the early 1900s, the area was developed as a summer resort community. The Lake Lotawana Improvement Association was formed in 1909 and the lake was created in 1911. The lake was created by damming the Little Blue River and was named after the Osage Indian Chief Lotawana. The lake was used for recreational activities such as fishing, swimming, and boating.
In the 1920s, the area began to develop as a residential community. The first homes were built in the area in the late 1920s and early 1930s. The city was officially incorporated in 1945.
Geography
Lotawana is located in the eastern part of Jackson County, Missouri. It is situated on the shore of Lake Lotawana, a man-made lake that was created in the early 1900s. The city is located approximately 20 miles southeast of Kansas City, Missouri and is part of the Kansas City metropolitan area.
The city has a total area of 1.3 square miles, all of which is land. The city is located in a hilly area and is surrounded by forests and rolling hills. The city is located near the Little Blue River and is home to several parks and recreational areas.
Economy
The economy of Lotawana is largely based on tourism and recreation. The city is home to several parks and recreational areas, including Lake Lotawana, which is a popular destination for fishing, swimming, and boating. The city is also home to several restaurants, bars, and shops.
The city is also home to several small businesses, including a grocery store, a hardware store, and a gas station. The city is also home to several manufacturing companies, including a plastics manufacturer and a metal fabrication company.
Demographics
As of the 2010 census, the population of Lotawana was 2,845. The racial makeup of the city was 97.3% White, 0.7% African American, 0.2% Native American, 0.3% Asian, 0.1% Pacific Islander, 0.3% from other races, and 1.2% from two or more races. Hispanic or Latino of any race were 1.3% of the population.
The median household income in Lotawana was $50,938 and the median family income was $60,938. The per capita income for the city was $25,938. About 4.3% of families and 5.7% of the population were below the poverty line, including 6.3% of those under age 18 and 4.3% of those age 65 or over.
Common Questions
What is Per Capita Income in Lake Lotawana?
Per Capita income in Lake Lotawana is $75,223.
What is the Median Family Income in Lake Lotawana?
Median Family Income in Lake Lotawana is $168,889.
What is the Median Household income in Lake Lotawana?
Median Household Income in Lake Lotawana is $156,146.
What is Income or Wage Gap in Lake Lotawana?
Income or Wage Gap in Lake Lotawana is 36.9%.
Women in Lake Lotawana earn 63.1 cents for every dollar earned by a man.
What is Inequality or Gini Index in Lake Lotawana?
Inequality or Gini Index in Lake Lotawana is 0.44.
What is the Total Population of Lake Lotawana?
Total Population of Lake Lotawana is 3,017.
What is the Total Male Population of Lake Lotawana?
Total Male Population of Lake Lotawana is 1,719.
What is the Total Female Population of Lake Lotawana?
Total Female Population of Lake Lotawana is 1,298.
What is the Ratio of Males per 100 Females in Lake Lotawana?
There are 132.43 Males per 100 Females in Lake Lotawana.
What is the Ratio of Females per 100 Males in Lake Lotawana?
There are 75.51 Females per 100 Males in Lake Lotawana.
What is the Median Population Age in Lake Lotawana?
Median Population Age in Lake Lotawana is 46.9 Years.
What is the Average Family Size in Lake Lotawana
Average Family Size in Lake Lotawana is 3.1 People.
What is the Average Household Size in Lake Lotawana
Average Household Size in Lake Lotawana is 2.7 People.
How Large is the Labor Force in Lake Lotawana?
There are 1,703 People in the Labor Forcein in Lake Lotawana.
What is the Percentage of People in the Labor Force in Lake Lotawana?
70.7% of People are in the Labor Force in Lake Lotawana.
What is the Unemployment Rate in Lake Lotawana?
Unemployment Rate in Lake Lotawana is 3.7%.