Coney Island, MO Map & Demographics
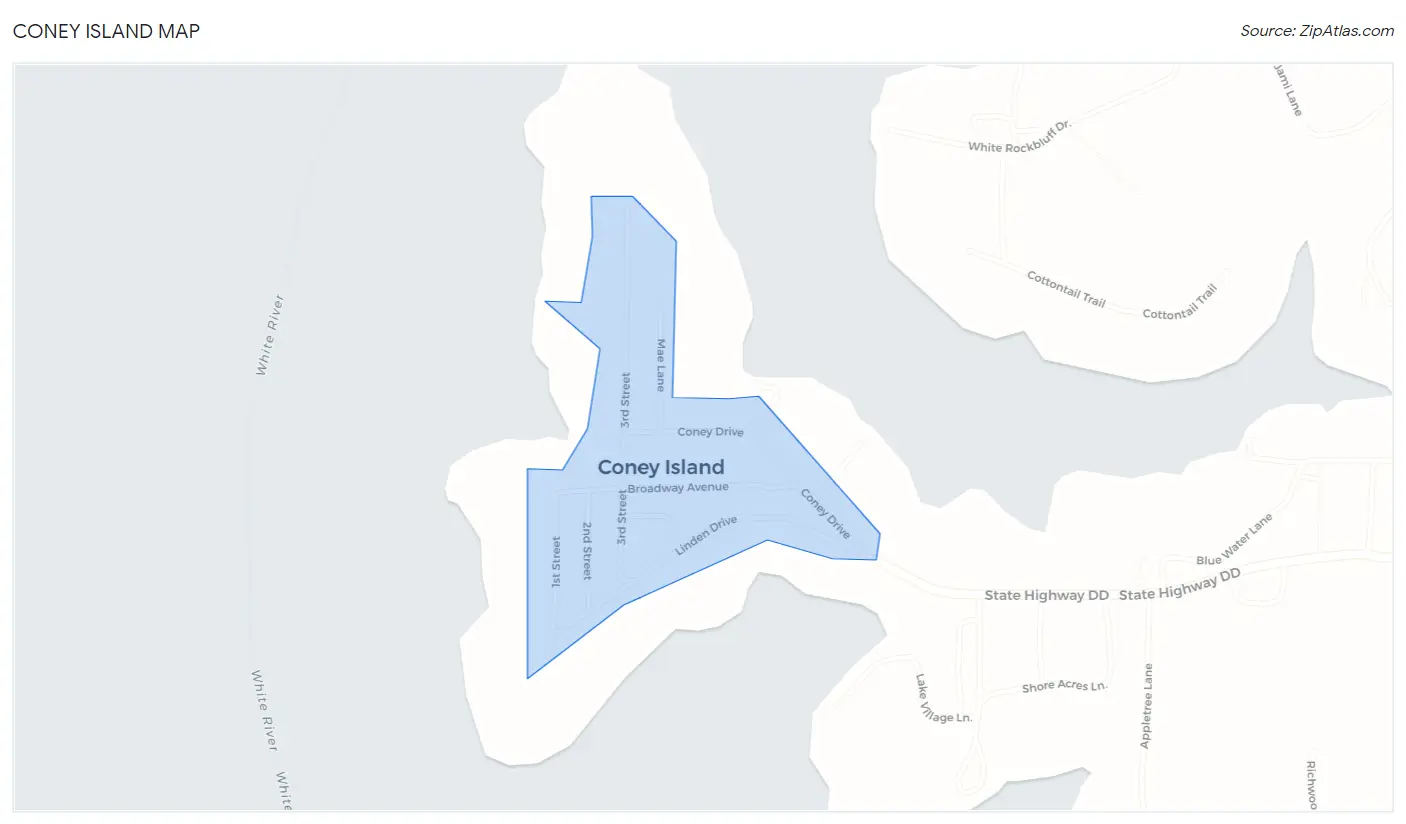
Coney Island Map
Coney Island Overview
$42,429
PER CAPITA INCOME
$69,375
AVG FAMILY INCOME
$53,750
AVG HOUSEHOLD INCOME
0.47
INEQUALITY / GINI INDEX
38
TOTAL POPULATION
21
MALE POPULATION
17
FEMALE POPULATION
123.53
MALES / 100 FEMALES
80.95
FEMALES / 100 MALES
66.0
MEDIAN AGE
2.5
AVG FAMILY SIZE
2.1
AVG HOUSEHOLD SIZE
15
LABOR FORCE [ PEOPLE ]
41.7%
PERCENT IN LABOR FORCE
13.3%
UNEMPLOYMENT RATE
Income in Coney Island
Income Overview in Coney Island
Per Capita Income in Coney Island is $42,429, while median incomes of families and households are $69,375 and $53,750 respectively.
| Characteristic | Number | Measure |
| Per Capita Income | 38 | $42,429 |
| Median Family Income | 13 | $69,375 |
| Mean Family Income | 13 | $120,985 |
| Median Household Income | 18 | $53,750 |
| Mean Household Income | 18 | $96,961 |
| Income Deficit | 13 | $0 |
| Wage / Income Gap (%) | 38 | 0.00% |
| Wage / Income Gap ($) | 38 | 100.00¢ per $1 |
| Gini / Inequality Index | 38 | 0.47 |
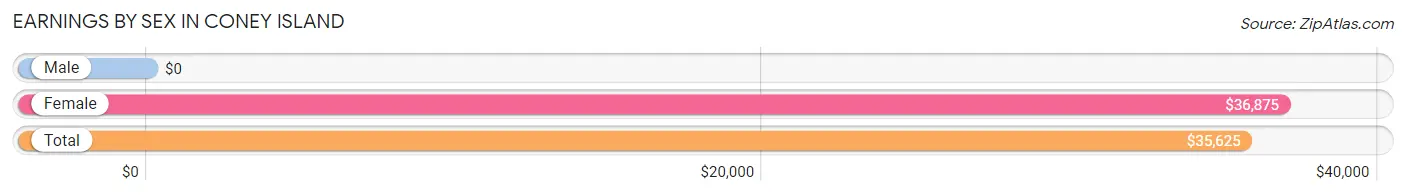
Earnings by Sex in Coney Island
| Sex | Number | Average Earnings |
| Male | 8 (61.5%) | $0 |
| Female | 5 (38.5%) | $36,875 |
| Total | 13 (100.0%) | $35,625 |
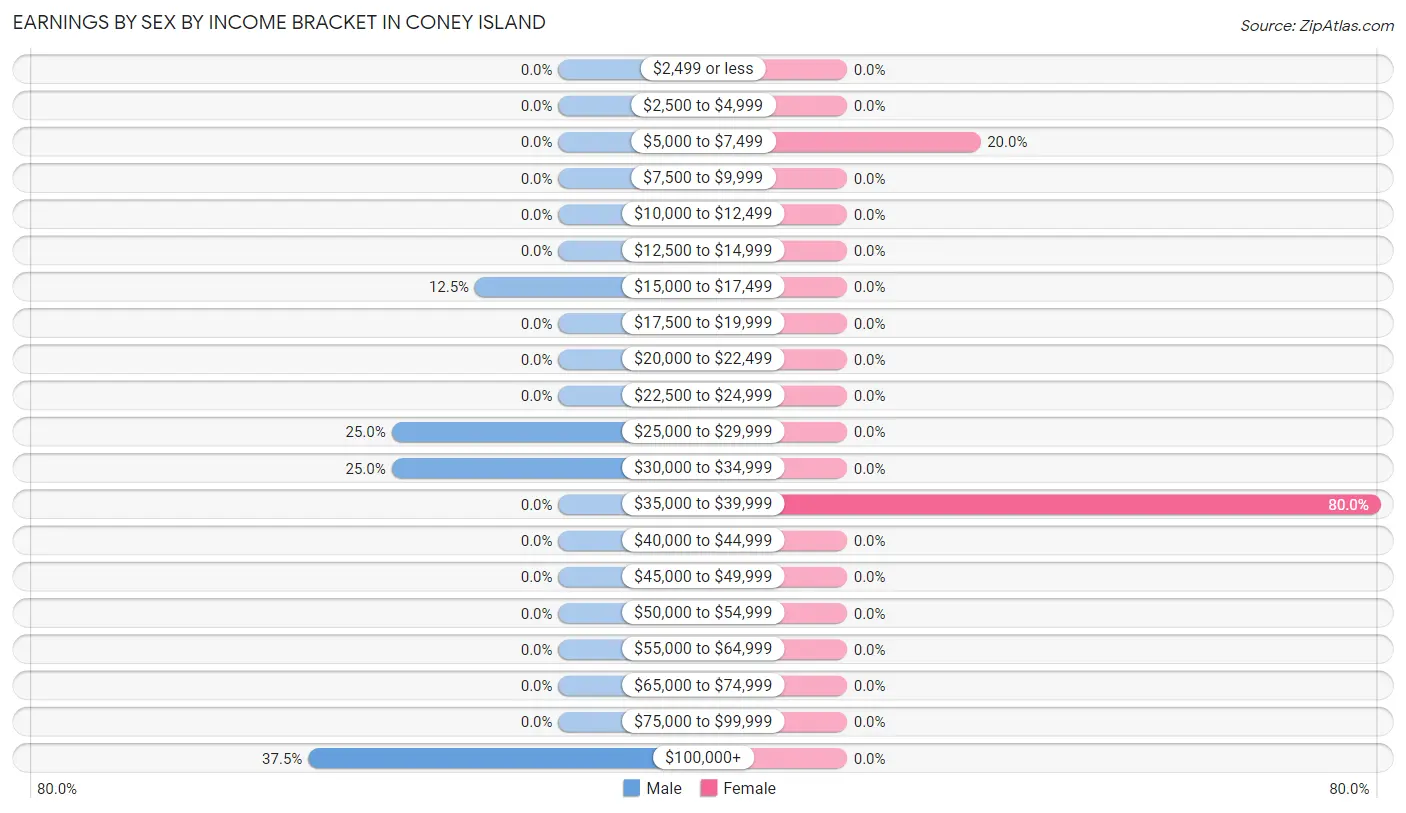
Earnings by Sex by Income Bracket in Coney Island
The most common earnings brackets in Coney Island are $100,000+ for men (3 | 37.5%) and $35,000 to $39,999 for women (4 | 80.0%).
| Income | Male | Female |
| $2,499 or less | 0 (0.0%) | 0 (0.0%) |
| $2,500 to $4,999 | 0 (0.0%) | 0 (0.0%) |
| $5,000 to $7,499 | 0 (0.0%) | 1 (20.0%) |
| $7,500 to $9,999 | 0 (0.0%) | 0 (0.0%) |
| $10,000 to $12,499 | 0 (0.0%) | 0 (0.0%) |
| $12,500 to $14,999 | 0 (0.0%) | 0 (0.0%) |
| $15,000 to $17,499 | 1 (12.5%) | 0 (0.0%) |
| $17,500 to $19,999 | 0 (0.0%) | 0 (0.0%) |
| $20,000 to $22,499 | 0 (0.0%) | 0 (0.0%) |
| $22,500 to $24,999 | 0 (0.0%) | 0 (0.0%) |
| $25,000 to $29,999 | 2 (25.0%) | 0 (0.0%) |
| $30,000 to $34,999 | 2 (25.0%) | 0 (0.0%) |
| $35,000 to $39,999 | 0 (0.0%) | 4 (80.0%) |
| $40,000 to $44,999 | 0 (0.0%) | 0 (0.0%) |
| $45,000 to $49,999 | 0 (0.0%) | 0 (0.0%) |
| $50,000 to $54,999 | 0 (0.0%) | 0 (0.0%) |
| $55,000 to $64,999 | 0 (0.0%) | 0 (0.0%) |
| $65,000 to $74,999 | 0 (0.0%) | 0 (0.0%) |
| $75,000 to $99,999 | 0 (0.0%) | 0 (0.0%) |
| $100,000+ | 3 (37.5%) | 0 (0.0%) |
| Total | 8 (100.0%) | 5 (100.0%) |
Earnings by Sex by Educational Attainment in Coney Island
| Educational Attainment | Male Income | Female Income |
| Less than High School | - | - |
| High School Diploma | - | - |
| College or Associate's Degree | - | - |
| Bachelor's Degree | - | - |
| Graduate Degree | - | - |
| Total | - | - |
Family Income in Coney Island
Family Income Brackets in Coney Island
According to the Coney Island family income data, there are 4 families falling into the $200,000+ income range, which is the most common income bracket and makes up 30.8% of all families.
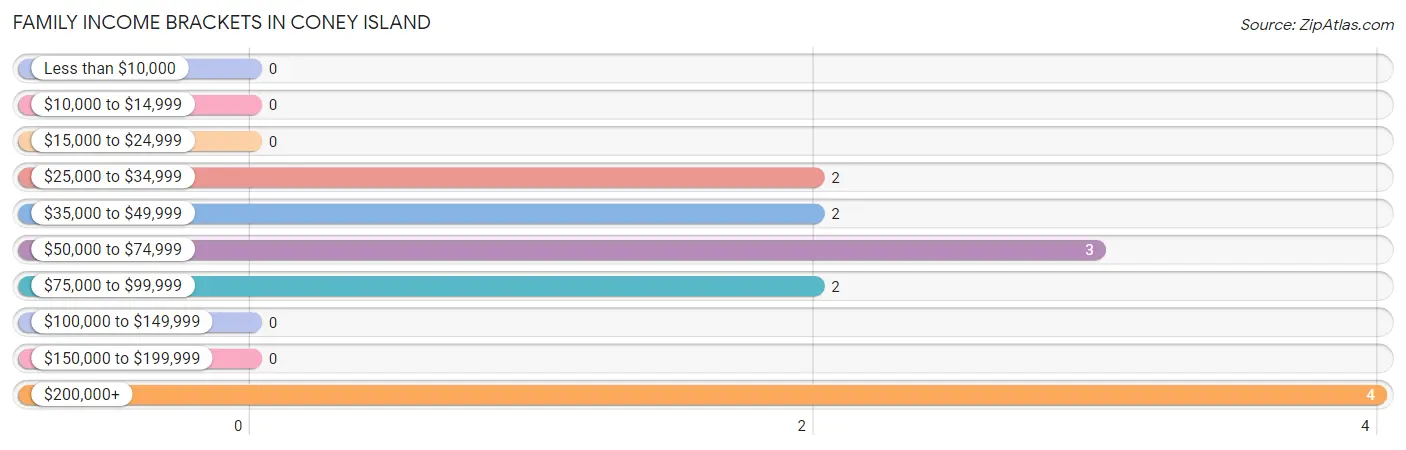
| Income Bracket | # Families | % Families |
| Less than $10,000 | 0 | 0.0% |
| $10,000 to $14,999 | 0 | 0.0% |
| $15,000 to $24,999 | 0 | 0.0% |
| $25,000 to $34,999 | 2 | 15.4% |
| $35,000 to $49,999 | 2 | 15.4% |
| $50,000 to $74,999 | 3 | 23.1% |
| $75,000 to $99,999 | 2 | 15.4% |
| $100,000 to $149,999 | 0 | 0.0% |
| $150,000 to $199,999 | 0 | 0.0% |
| $200,000+ | 4 | 30.8% |
Family Income by Famaliy Size in Coney Island
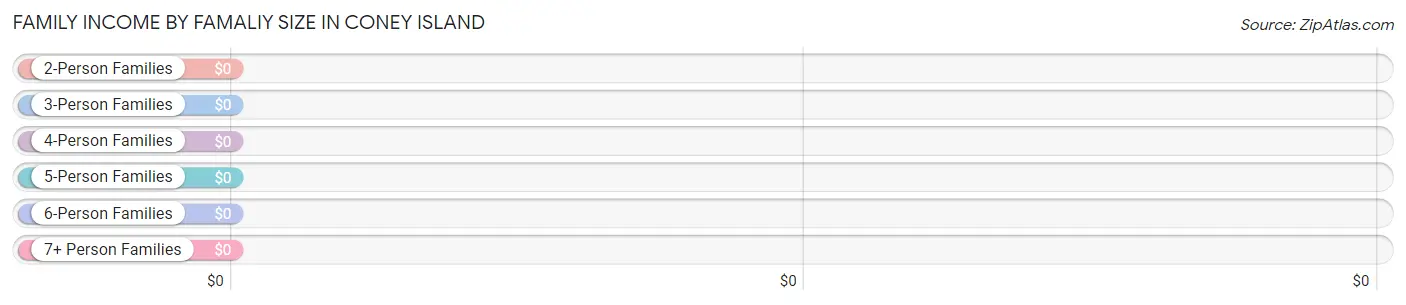
| Income Bracket | # Families | Median Income |
| 2-Person Families | 7 (53.8%) | $0 |
| 3-Person Families | 6 (46.2%) | $0 |
| 4-Person Families | 0 (0.0%) | $0 |
| 5-Person Families | 0 (0.0%) | $0 |
| 6-Person Families | 0 (0.0%) | $0 |
| 7+ Person Families | 0 (0.0%) | $0 |
| Total | 13 (100.0%) | $69,375 |
Family Income by Number of Earners in Coney Island
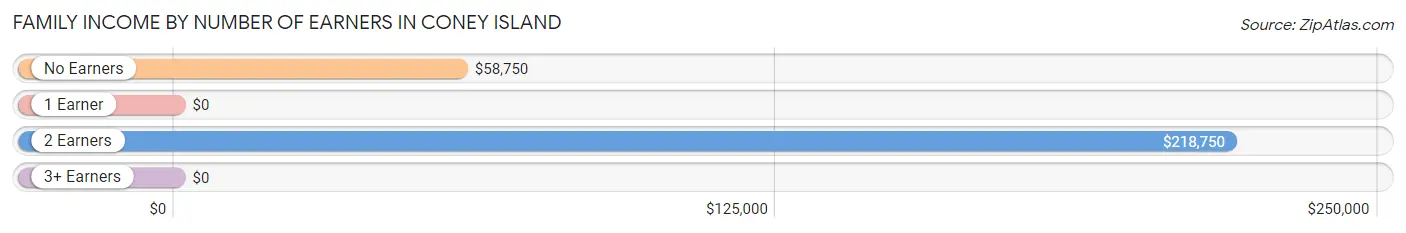
| Number of Earners | # Families | Median Income |
| No Earners | 5 (38.5%) | $58,750 |
| 1 Earner | 2 (15.4%) | $0 |
| 2 Earners | 6 (46.2%) | $218,750 |
| 3+ Earners | 0 (0.0%) | $0 |
| Total | 13 (100.0%) | $69,375 |
Household Income in Coney Island
Household Income Brackets in Coney Island
With 5 households falling in the category, the $25,000 to $34,999 income range is the most frequent in Coney Island, accounting for 27.8% of all households.
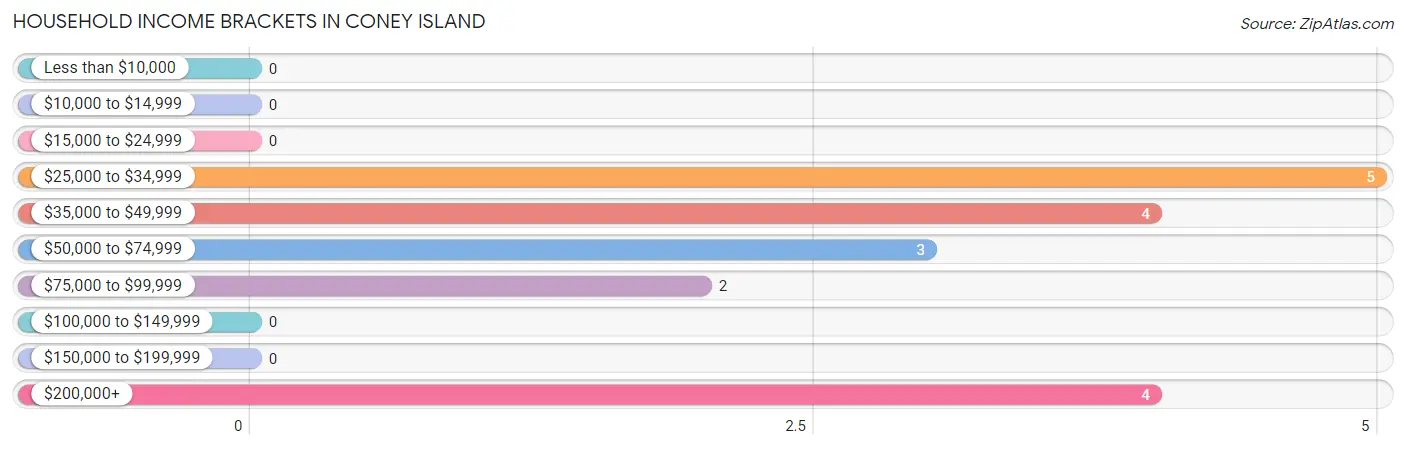
| Income Bracket | # Households | % Households |
| Less than $10,000 | 0 | 0.0% |
| $10,000 to $14,999 | 0 | 0.0% |
| $15,000 to $24,999 | 0 | 0.0% |
| $25,000 to $34,999 | 5 | 27.8% |
| $35,000 to $49,999 | 4 | 22.2% |
| $50,000 to $74,999 | 3 | 16.7% |
| $75,000 to $99,999 | 2 | 11.1% |
| $100,000 to $149,999 | 0 | 0.0% |
| $150,000 to $199,999 | 0 | 0.0% |
| $200,000+ | 4 | 22.2% |
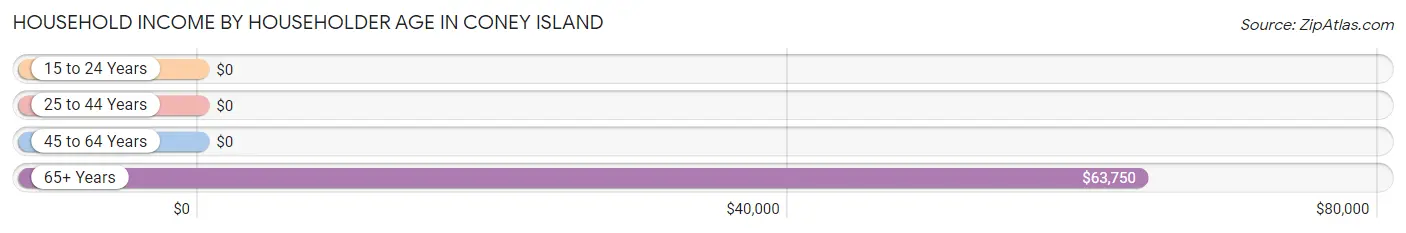
Household Income by Householder Age in Coney Island
The median household income in Coney Island is $53,750, with the highest median household income of $63,750 found in the 65+ years age bracket for the primary householder. A total of 12 households (66.7%) fall into this category.
| Income Bracket | # Households | Median Income |
| 15 to 24 Years | 0 (0.0%) | $0 |
| 25 to 44 Years | 0 (0.0%) | $0 |
| 45 to 64 Years | 6 (33.3%) | $0 |
| 65+ Years | 12 (66.7%) | $63,750 |
| Total | 18 (100.0%) | $53,750 |
Poverty in Coney Island
Income Below Poverty by Sex and Age in Coney Island
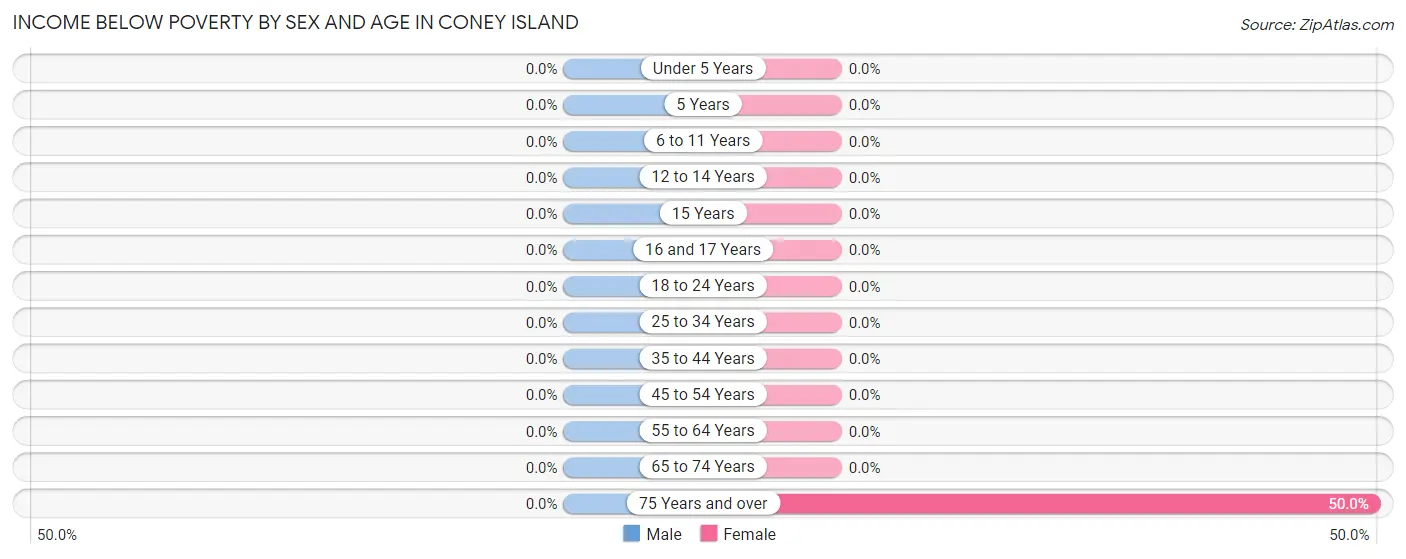
| Age Bracket | Male | Female |
| Under 5 Years | 0 (0.0%) | 0 (0.0%) |
| 5 Years | 0 (0.0%) | 0 (0.0%) |
| 6 to 11 Years | 0 (0.0%) | 0 (0.0%) |
| 12 to 14 Years | 0 (0.0%) | 0 (0.0%) |
| 15 Years | 0 (0.0%) | 0 (0.0%) |
| 16 and 17 Years | 0 (0.0%) | 0 (0.0%) |
| 18 to 24 Years | 0 (0.0%) | 0 (0.0%) |
| 25 to 34 Years | 0 (0.0%) | 0 (0.0%) |
| 35 to 44 Years | 0 (0.0%) | 0 (0.0%) |
| 45 to 54 Years | 0 (0.0%) | 0 (0.0%) |
| 55 to 64 Years | 0 (0.0%) | 0 (0.0%) |
| 65 to 74 Years | 0 (0.0%) | 0 (0.0%) |
| 75 Years and over | 0 (0.0%) | 1 (50.0%) |
| Total | 0 (0.0%) | 1 (5.9%) |
Income Above Poverty by Sex and Age in Coney Island
According to the poverty statistics in Coney Island, males aged 12 to 14 years and females aged 18 to 24 years are the age groups that are most secure financially, with 100.0% of males and 100.0% of females in these age groups living above the poverty line.
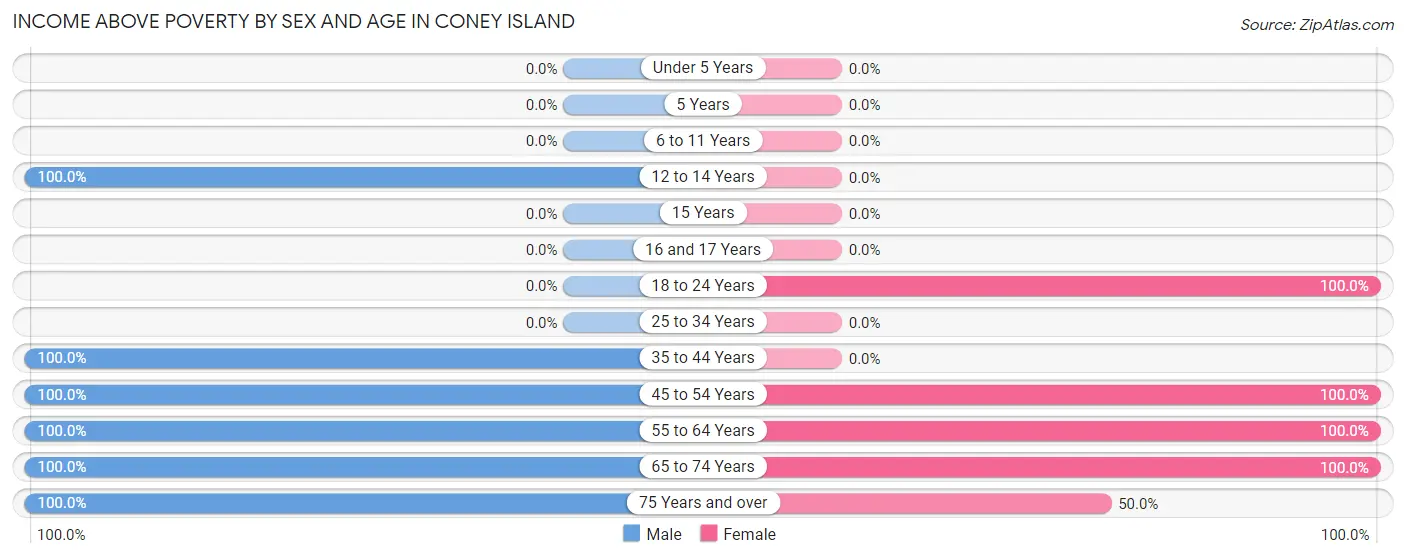
| Age Bracket | Male | Female |
| Under 5 Years | 0 (0.0%) | 0 (0.0%) |
| 5 Years | 0 (0.0%) | 0 (0.0%) |
| 6 to 11 Years | 0 (0.0%) | 0 (0.0%) |
| 12 to 14 Years | 2 (100.0%) | 0 (0.0%) |
| 15 Years | 0 (0.0%) | 0 (0.0%) |
| 16 and 17 Years | 0 (0.0%) | 0 (0.0%) |
| 18 to 24 Years | 0 (0.0%) | 2 (100.0%) |
| 25 to 34 Years | 0 (0.0%) | 0 (0.0%) |
| 35 to 44 Years | 3 (100.0%) | 0 (0.0%) |
| 45 to 54 Years | 1 (100.0%) | 2 (100.0%) |
| 55 to 64 Years | 4 (100.0%) | 4 (100.0%) |
| 65 to 74 Years | 9 (100.0%) | 7 (100.0%) |
| 75 Years and over | 2 (100.0%) | 1 (50.0%) |
| Total | 21 (100.0%) | 16 (94.1%) |
Income Below Poverty Among Married-Couple Families in Coney Island
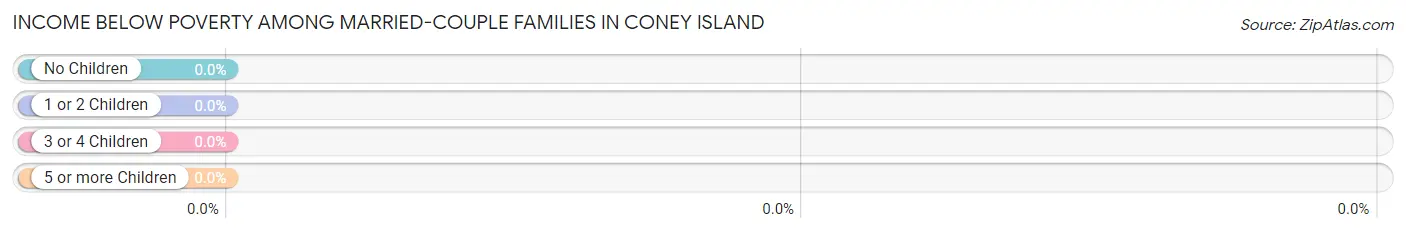
| Children | Above Poverty | Below Poverty |
| No Children | 11 (100.0%) | 0 (0.0%) |
| 1 or 2 Children | 2 (100.0%) | 0 (0.0%) |
| 3 or 4 Children | 0 (0.0%) | 0 (0.0%) |
| 5 or more Children | 0 (0.0%) | 0 (0.0%) |
| Total | 13 (100.0%) | 0 (0.0%) |
Income Below Poverty Among Single-Parent Households in Coney Island
| Children | Single Father | Single Mother |
| No Children | 0 (0.0%) | 0 (0.0%) |
| 1 or 2 Children | 0 (0.0%) | 0 (0.0%) |
| 3 or 4 Children | 0 (0.0%) | 0 (0.0%) |
| 5 or more Children | 0 (0.0%) | 0 (0.0%) |
| Total | 0 (0.0%) | 0 (0.0%) |
Income Below Poverty Among Married-Couple vs Single-Parent Households in Coney Island
| Children | Married-Couple Families | Single-Parent Households |
| No Children | 0 (0.0%) | 0 (0.0%) |
| 1 or 2 Children | 0 (0.0%) | 0 (0.0%) |
| 3 or 4 Children | 0 (0.0%) | 0 (0.0%) |
| 5 or more Children | 0 (0.0%) | 0 (0.0%) |
| Total | 0 (0.0%) | 0 (0.0%) |
Race in Coney Island
The most populous races in Coney Island are , and White / Caucasian (38 | 100.0%).
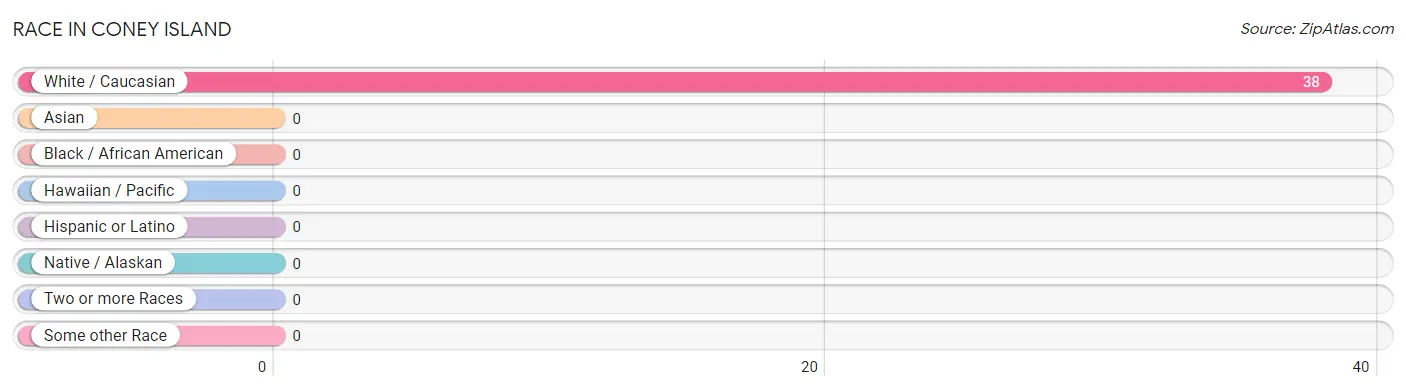
| Race | # Population | % Population |
| Asian | 0 | 0.0% |
| Black / African American | 0 | 0.0% |
| Hawaiian / Pacific | 0 | 0.0% |
| Hispanic or Latino | 0 | 0.0% |
| Native / Alaskan | 0 | 0.0% |
| White / Caucasian | 38 | 100.0% |
| Two or more Races | 0 | 0.0% |
| Some other Race | 0 | 0.0% |
| Total | 38 | 100.0% |
Ancestry in Coney Island
The most populous ancestries reported in Coney Island are German (8 | 21.0%), Polish (6 | 15.8%), Danish (4 | 10.5%), Irish (4 | 10.5%), and American (2 | 5.3%), together accounting for 63.2% of all Coney Island residents.
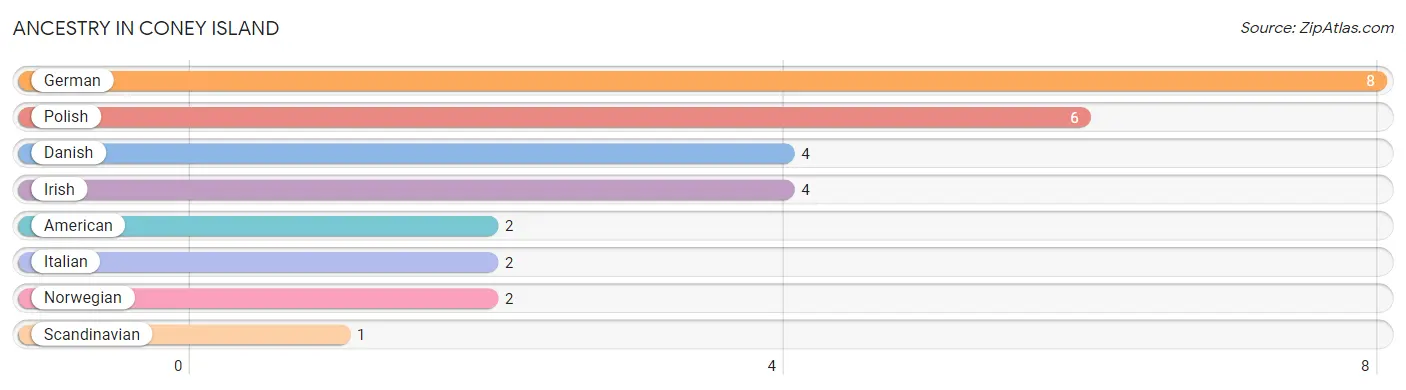
| Ancestry | # Population | % Population |
| American | 2 | 5.3% |
| Danish | 4 | 10.5% |
| German | 8 | 21.0% |
| Irish | 4 | 10.5% |
| Italian | 2 | 5.3% |
| Norwegian | 2 | 5.3% |
| Polish | 6 | 15.8% |
| Scandinavian | 1 | 2.6% | View All 8 Rows |
Immigrants in Coney Island

| Immigration Origin | # Population | % Population | View All 0 Rows |
Sex and Age in Coney Island
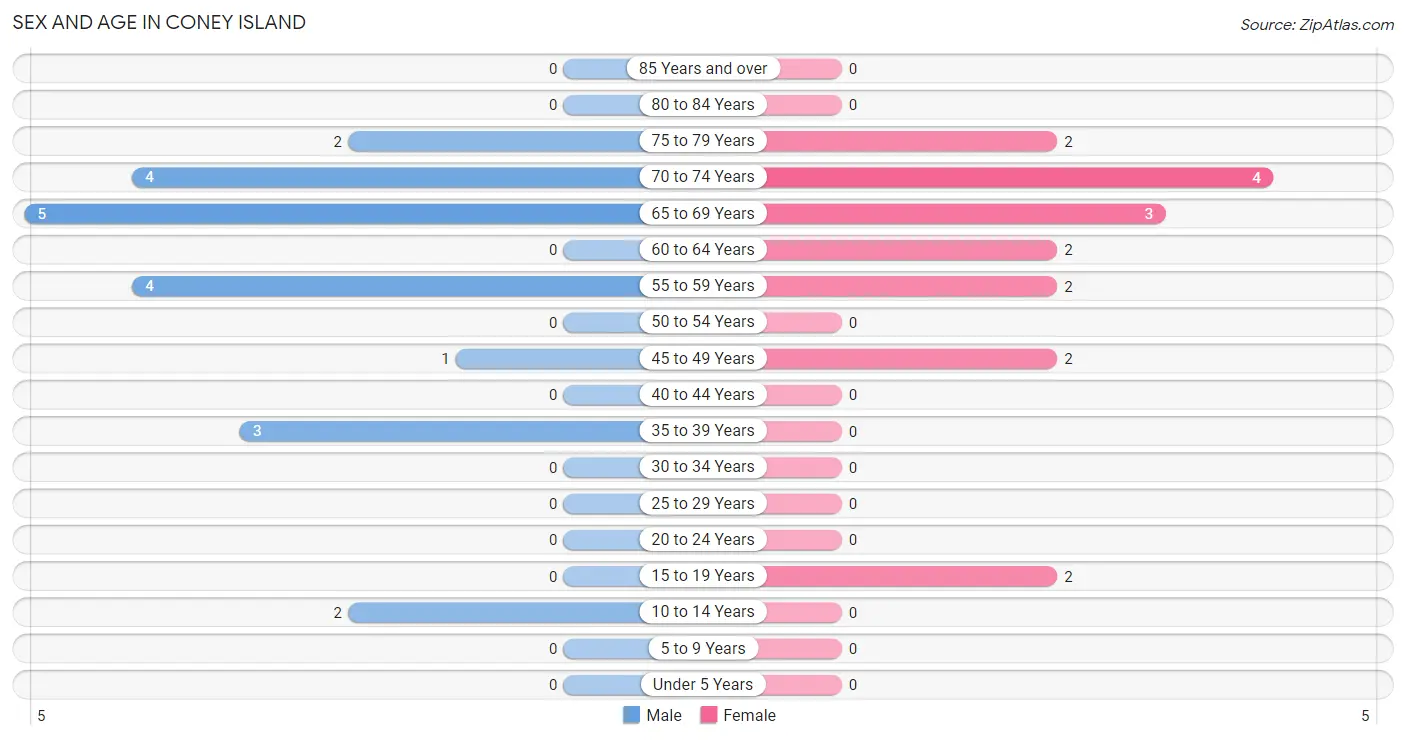
Sex and Age in Coney Island
The most populous age groups in Coney Island are 65 to 69 Years (5 | 23.8%) for men and 70 to 74 Years (4 | 23.5%) for women.
| Age Bracket | Male | Female |
| Under 5 Years | 0 (0.0%) | 0 (0.0%) |
| 5 to 9 Years | 0 (0.0%) | 0 (0.0%) |
| 10 to 14 Years | 2 (9.5%) | 0 (0.0%) |
| 15 to 19 Years | 0 (0.0%) | 2 (11.8%) |
| 20 to 24 Years | 0 (0.0%) | 0 (0.0%) |
| 25 to 29 Years | 0 (0.0%) | 0 (0.0%) |
| 30 to 34 Years | 0 (0.0%) | 0 (0.0%) |
| 35 to 39 Years | 3 (14.3%) | 0 (0.0%) |
| 40 to 44 Years | 0 (0.0%) | 0 (0.0%) |
| 45 to 49 Years | 1 (4.8%) | 2 (11.8%) |
| 50 to 54 Years | 0 (0.0%) | 0 (0.0%) |
| 55 to 59 Years | 4 (19.1%) | 2 (11.8%) |
| 60 to 64 Years | 0 (0.0%) | 2 (11.8%) |
| 65 to 69 Years | 5 (23.8%) | 3 (17.6%) |
| 70 to 74 Years | 4 (19.1%) | 4 (23.5%) |
| 75 to 79 Years | 2 (9.5%) | 2 (11.8%) |
| 80 to 84 Years | 0 (0.0%) | 0 (0.0%) |
| 85 Years and over | 0 (0.0%) | 0 (0.0%) |
| Total | 21 (100.0%) | 17 (100.0%) |
Families and Households in Coney Island
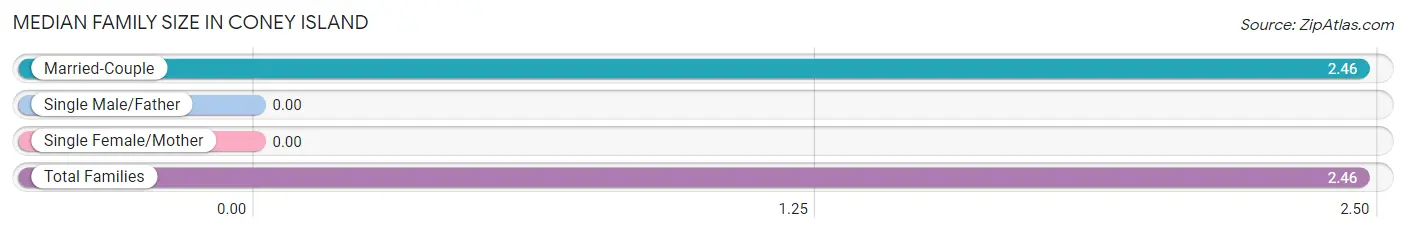
Median Family Size in Coney Island
| Family Type | # Families | Family Size |
| Married-Couple | 13 (100.0%) | 2.46 |
| Single Male/Father | 0 (0.0%) | - |
| Single Female/Mother | 0 (0.0%) | - |
| Total Families | 13 (100.0%) | 2.46 |
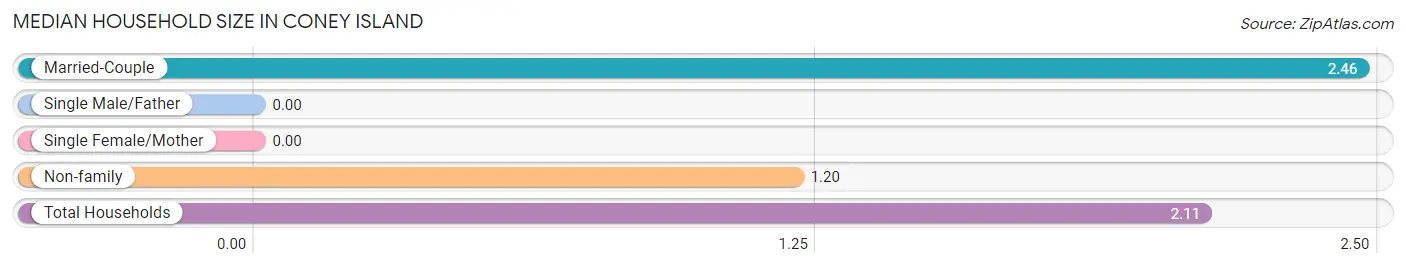
Median Household Size in Coney Island
| Household Type | # Households | Household Size |
| Married-Couple | 13 (72.2%) | 2.46 |
| Single Male/Father | 0 (0.0%) | - |
| Single Female/Mother | 0 (0.0%) | - |
| Non-family | 5 (27.8%) | 1.20 |
| Total Households | 18 (100.0%) | 2.11 |
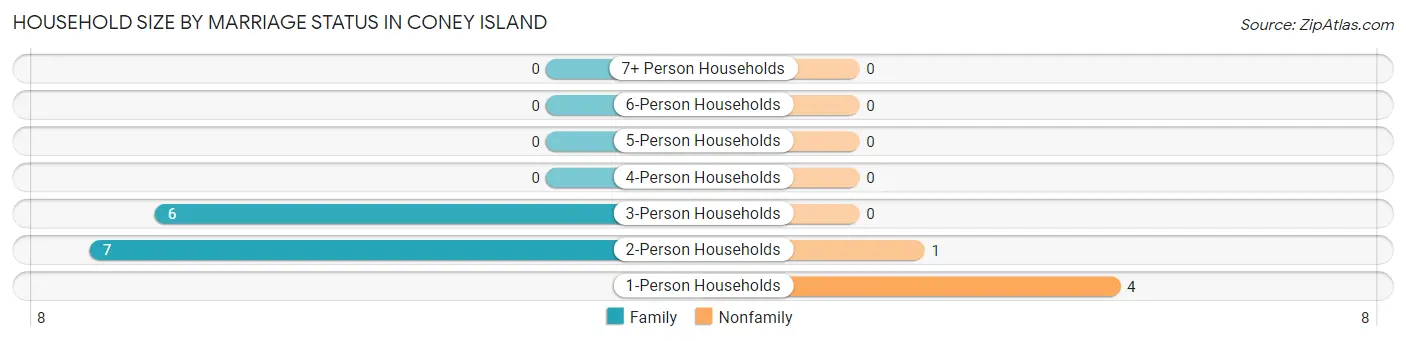
Household Size by Marriage Status in Coney Island
Out of a total of 18 households in Coney Island, 13 (72.2%) are family households, while 5 (27.8%) are nonfamily households. The most numerous type of family households are 2-person households, comprising 7, and the most common type of nonfamily households are 1-person households, comprising 4.
| Household Size | Family Households | Nonfamily Households |
| 1-Person Households | - | 4 (22.2%) |
| 2-Person Households | 7 (38.9%) | 1 (5.6%) |
| 3-Person Households | 6 (33.3%) | 0 (0.0%) |
| 4-Person Households | 0 (0.0%) | 0 (0.0%) |
| 5-Person Households | 0 (0.0%) | 0 (0.0%) |
| 6-Person Households | 0 (0.0%) | 0 (0.0%) |
| 7+ Person Households | 0 (0.0%) | 0 (0.0%) |
| Total | 13 (72.2%) | 5 (27.8%) |
Female Fertility in Coney Island
Fertility by Age in Coney Island
| Age Bracket | Women with Births | Births / 1,000 Women |
| 15 to 19 years | 0 (0.0%) | 0.0 |
| 20 to 34 years | 0 (0.0%) | 0.0 |
| 35 to 50 years | 0 (0.0%) | 0.0 |
| Total | 0 (0.0%) | 0.0 |
Fertility by Age by Marriage Status in Coney Island
| Age Bracket | Married | Unmarried |
| 15 to 19 years | 0 (0.0%) | 0 (0.0%) |
| 20 to 34 years | 0 (0.0%) | 0 (0.0%) |
| 35 to 50 years | 0 (0.0%) | 0 (0.0%) |
| Total | 0 (0.0%) | 0 (0.0%) |
Fertility by Education in Coney Island
| Educational Attainment | Women with Births | Births / 1,000 Women |
| Less than High School | 0 (0.0%) | 0.0 |
| High School Diploma | 0 (0.0%) | 0.0 |
| College or Associate's Degree | 0 (0.0%) | 0.0 |
| Bachelor's Degree | 0 (0.0%) | 0.0 |
| Graduate Degree | 0 (0.0%) | 0.0 |
| Total | 0 (0.0%) | 0.0 |
Fertility by Education by Marriage Status in Coney Island
| Educational Attainment | Married | Unmarried |
| Less than High School | 0 (0.0%) | 0 (0.0%) |
| High School Diploma | 0 (0.0%) | 0 (0.0%) |
| College or Associate's Degree | 0 (0.0%) | 0 (0.0%) |
| Bachelor's Degree | 0 (0.0%) | 0 (0.0%) |
| Graduate Degree | 0 (0.0%) | 0 (0.0%) |
| Total | 0 (0.0%) | 0 (0.0%) |
Employment Characteristics in Coney Island
Employment by Class of Employer in Coney Island
Among the 13 employed individuals in Coney Island, self-employed (not incorporated) (5 | 38.5%), private company employees (4 | 30.8%), and self-employed (incorporated) (3 | 23.1%) make up the most common classes of employment.
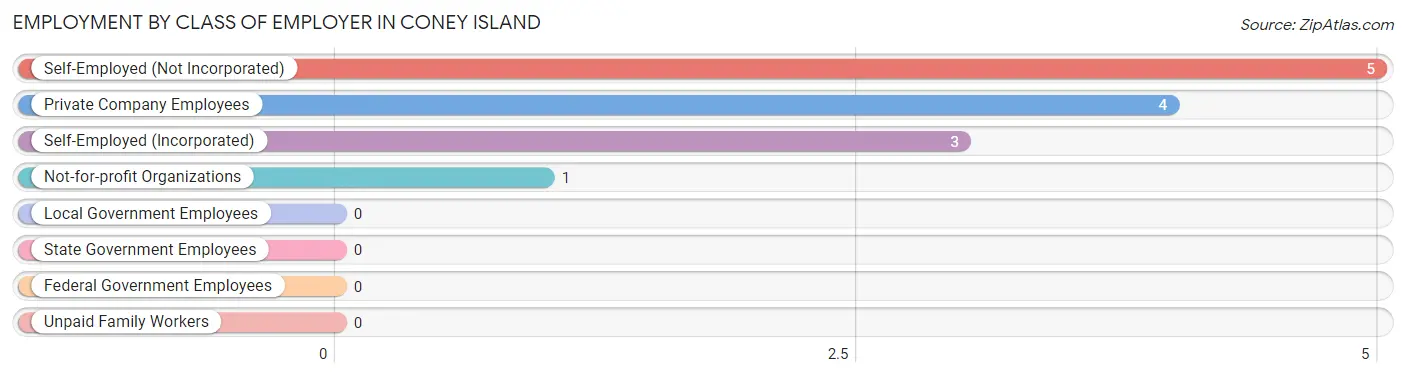
| Employer Class | # Employees | % Employees |
| Private Company Employees | 4 | 30.8% |
| Self-Employed (Incorporated) | 3 | 23.1% |
| Self-Employed (Not Incorporated) | 5 | 38.5% |
| Not-for-profit Organizations | 1 | 7.7% |
| Local Government Employees | 0 | 0.0% |
| State Government Employees | 0 | 0.0% |
| Federal Government Employees | 0 | 0.0% |
| Unpaid Family Workers | 0 | 0.0% |
| Total | 13 | 100.0% |
Employment Status by Age in Coney Island
According to the labor force statistics for Coney Island, out of the total population over 16 years of age (36), 41.7% or 15 individuals are in the labor force, with 13.3% or 2 of them unemployed. The age group with the highest labor force participation rate is 16 to 19 years, with 100.0% or 2 individuals in the labor force. Within the labor force, the 16 to 19 years age range has the highest percentage of unemployed individuals, with 100.0% or 2 of them being unemployed.
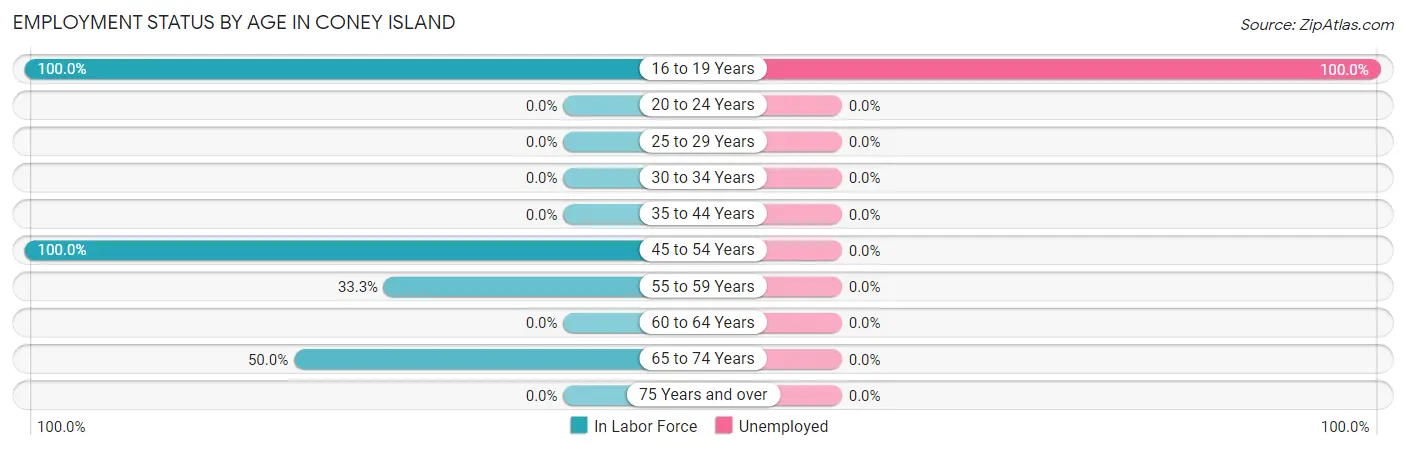
| Age Bracket | In Labor Force | Unemployed |
| 16 to 19 Years | 2 (100.0%) | 2 (100.0%) |
| 20 to 24 Years | 0 (0.0%) | 0 (0.0%) |
| 25 to 29 Years | 0 (0.0%) | 0 (0.0%) |
| 30 to 34 Years | 0 (0.0%) | 0 (0.0%) |
| 35 to 44 Years | 0 (0.0%) | 0 (0.0%) |
| 45 to 54 Years | 3 (100.0%) | 0 (0.0%) |
| 55 to 59 Years | 2 (33.3%) | 0 (0.0%) |
| 60 to 64 Years | 0 (0.0%) | 0 (0.0%) |
| 65 to 74 Years | 8 (50.0%) | 0 (0.0%) |
| 75 Years and over | 0 (0.0%) | 0 (0.0%) |
| Total | 15 (41.7%) | 2 (13.3%) |
Employment Status by Educational Attainment in Coney Island
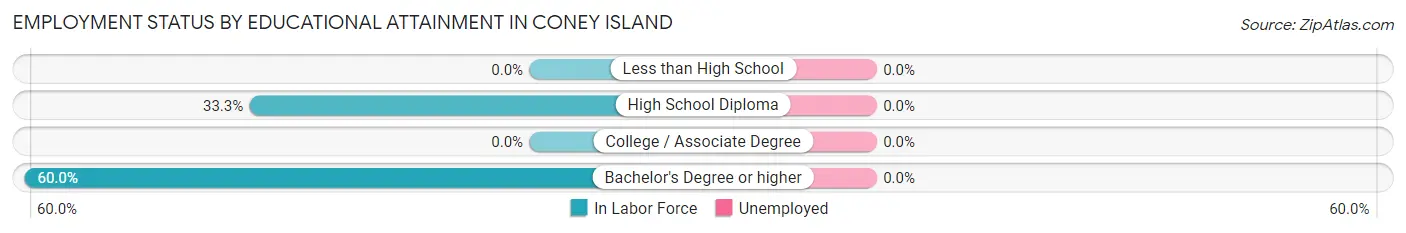
| Educational Attainment | In Labor Force | Unemployed |
| Less than High School | 0 (0.0%) | 0 (0.0%) |
| High School Diploma | 2 (33.3%) | 0 (0.0%) |
| College / Associate Degree | 0 (0.0%) | 0 (0.0%) |
| Bachelor's Degree or higher | 3 (60.0%) | 0 (0.0%) |
| Total | 5 (35.7%) | 0 (0.0%) |
Employment Occupations by Sex in Coney Island
Management, Business, Science and Arts Occupations
The most common Management, Business, Science and Arts occupations in Coney Island are , and Management (2 | 15.4%).
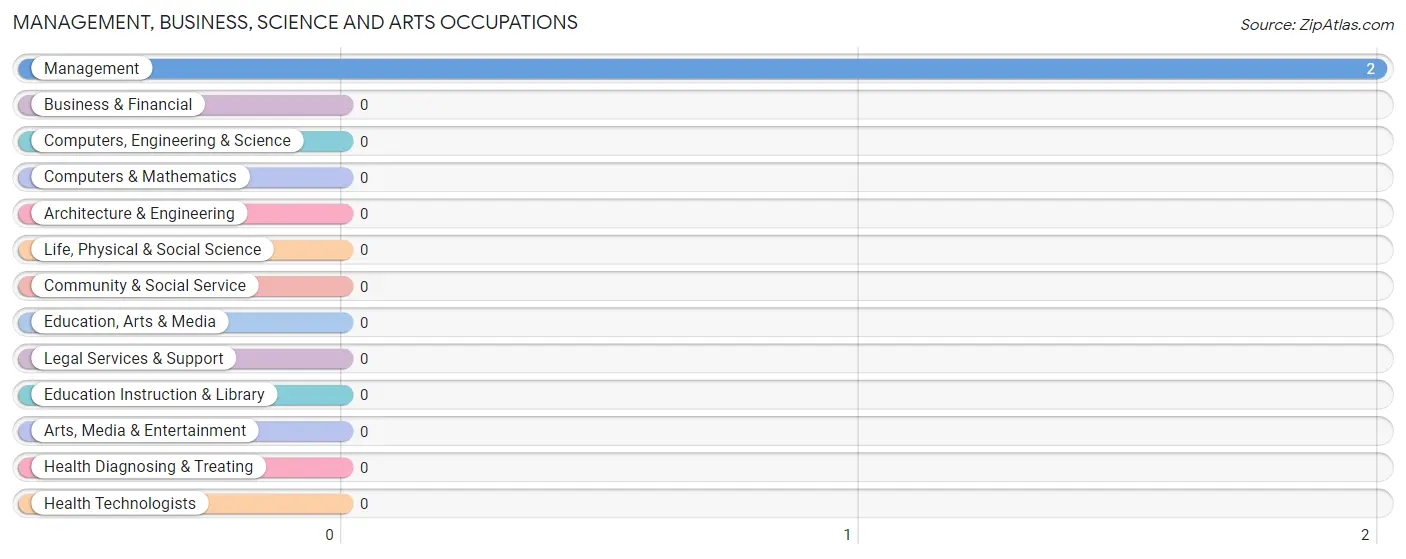
Management, Business, Science and Arts Occupations by Sex
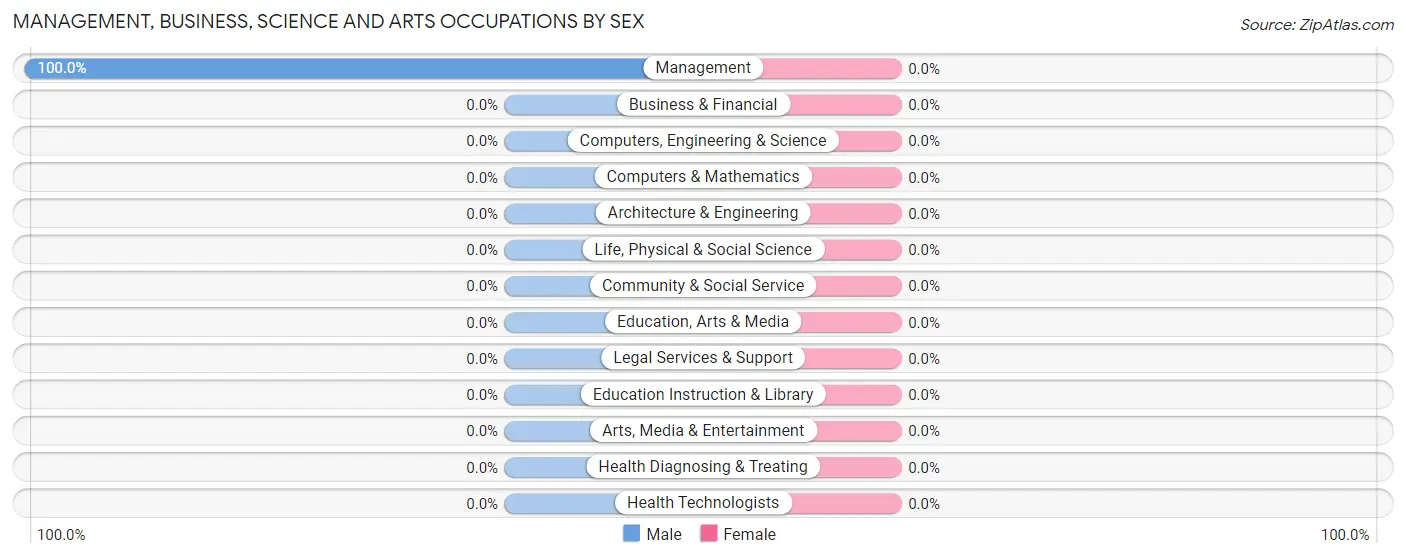
| Occupation | Male | Female |
| Management | 2 (100.0%) | 0 (0.0%) |
| Business & Financial | 0 (0.0%) | 0 (0.0%) |
| Computers, Engineering & Science | 0 (0.0%) | 0 (0.0%) |
| Computers & Mathematics | 0 (0.0%) | 0 (0.0%) |
| Architecture & Engineering | 0 (0.0%) | 0 (0.0%) |
| Life, Physical & Social Science | 0 (0.0%) | 0 (0.0%) |
| Community & Social Service | 0 (0.0%) | 0 (0.0%) |
| Education, Arts & Media | 0 (0.0%) | 0 (0.0%) |
| Legal Services & Support | 0 (0.0%) | 0 (0.0%) |
| Education Instruction & Library | 0 (0.0%) | 0 (0.0%) |
| Arts, Media & Entertainment | 0 (0.0%) | 0 (0.0%) |
| Health Diagnosing & Treating | 0 (0.0%) | 0 (0.0%) |
| Health Technologists | 0 (0.0%) | 0 (0.0%) |
| Total (Category) | 2 (100.0%) | 0 (0.0%) |
| Total (Overall) | 8 (61.5%) | 5 (38.5%) |
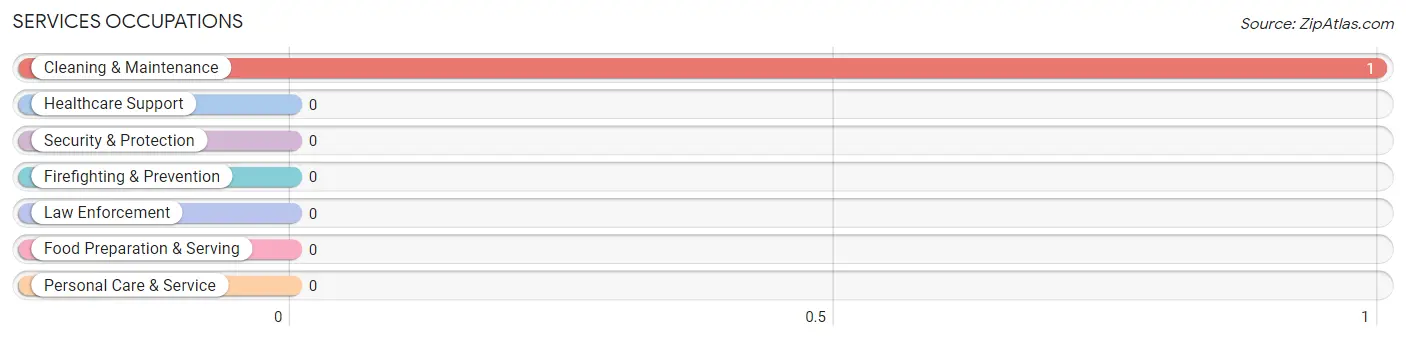
Services Occupations
The most common Services occupations in Coney Island are , and Cleaning & Maintenance (1 | 7.7%).
Services Occupations by Sex
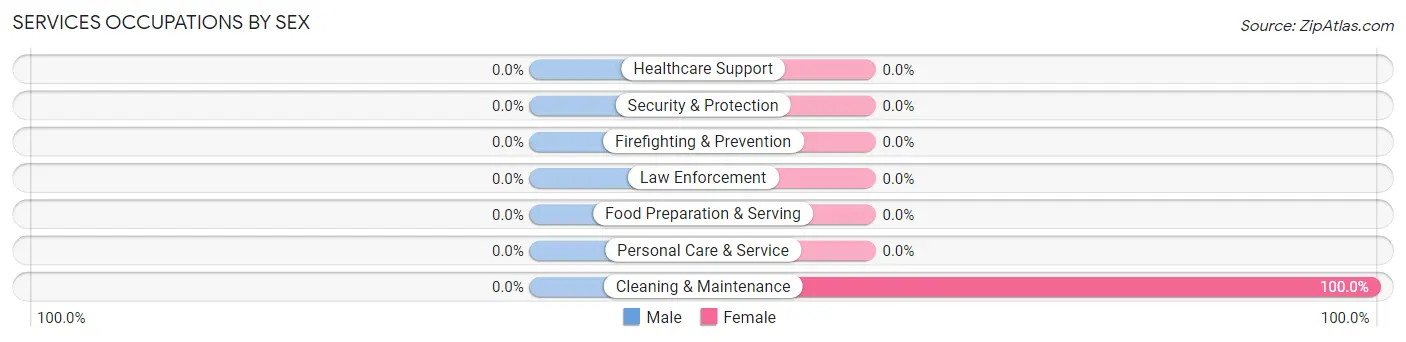
| Occupation | Male | Female |
| Healthcare Support | 0 (0.0%) | 0 (0.0%) |
| Security & Protection | 0 (0.0%) | 0 (0.0%) |
| Firefighting & Prevention | 0 (0.0%) | 0 (0.0%) |
| Law Enforcement | 0 (0.0%) | 0 (0.0%) |
| Food Preparation & Serving | 0 (0.0%) | 0 (0.0%) |
| Cleaning & Maintenance | 0 (0.0%) | 1 (100.0%) |
| Personal Care & Service | 0 (0.0%) | 0 (0.0%) |
| Total (Category) | 0 (0.0%) | 1 (100.0%) |
| Total (Overall) | 8 (61.5%) | 5 (38.5%) |
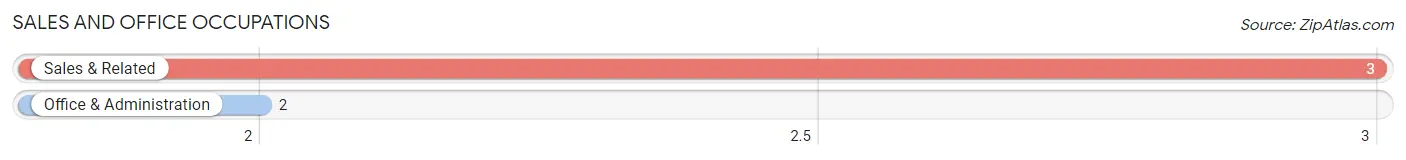
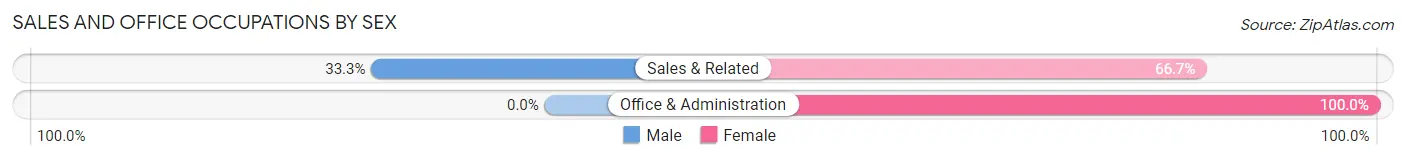
Sales and Office Occupations
The most common Sales and Office occupations in Coney Island are Sales & Related (3 | 23.1%), and Office & Administration (2 | 15.4%).
Sales and Office Occupations by Sex
| Occupation | Male | Female |
| Sales & Related | 1 (33.3%) | 2 (66.7%) |
| Office & Administration | 0 (0.0%) | 2 (100.0%) |
| Total (Category) | 1 (20.0%) | 4 (80.0%) |
| Total (Overall) | 8 (61.5%) | 5 (38.5%) |
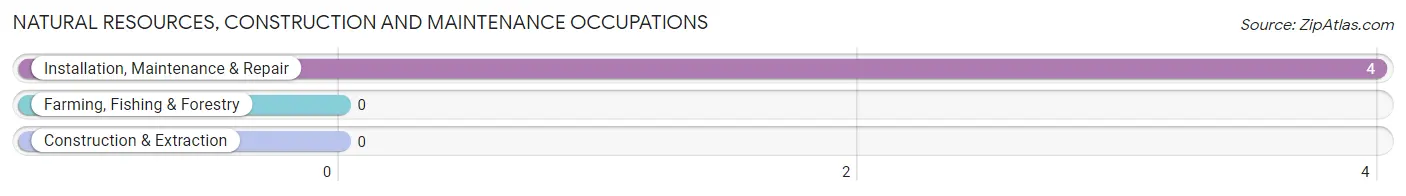
Natural Resources, Construction and Maintenance Occupations
The most common Natural Resources, Construction and Maintenance occupations in Coney Island are , and Installation, Maintenance & Repair (4 | 30.8%).
Natural Resources, Construction and Maintenance Occupations by Sex
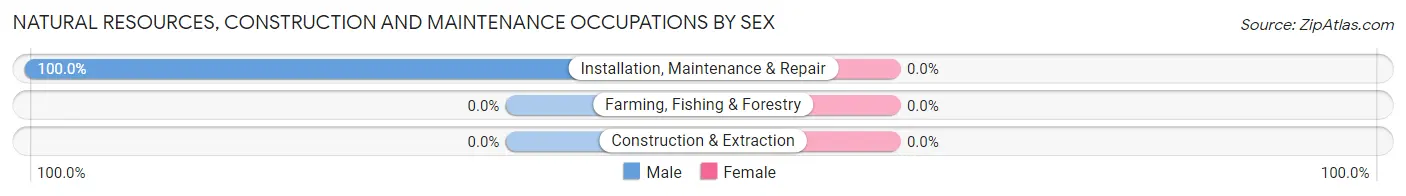
| Occupation | Male | Female |
| Farming, Fishing & Forestry | 0 (0.0%) | 0 (0.0%) |
| Construction & Extraction | 0 (0.0%) | 0 (0.0%) |
| Installation, Maintenance & Repair | 4 (100.0%) | 0 (0.0%) |
| Total (Category) | 4 (100.0%) | 0 (0.0%) |
| Total (Overall) | 8 (61.5%) | 5 (38.5%) |
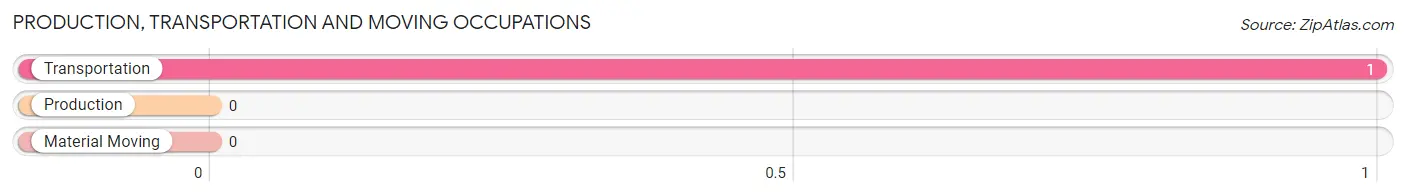
Production, Transportation and Moving Occupations
The most common Production, Transportation and Moving occupations in Coney Island are , and Transportation (1 | 7.7%).
Production, Transportation and Moving Occupations by Sex
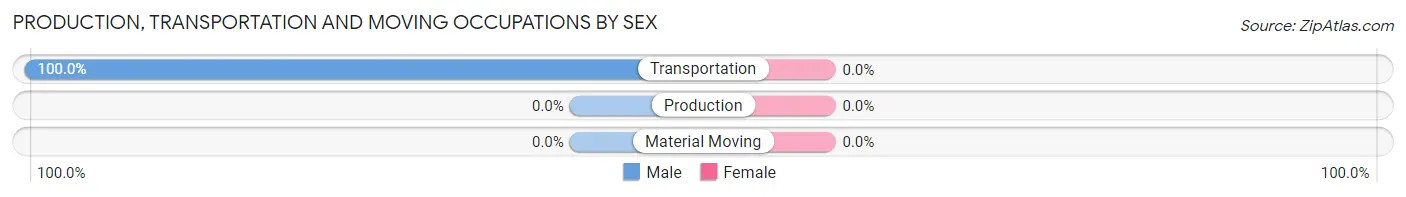
| Occupation | Male | Female |
| Production | 0 (0.0%) | 0 (0.0%) |
| Transportation | 1 (100.0%) | 0 (0.0%) |
| Material Moving | 0 (0.0%) | 0 (0.0%) |
| Total (Category) | 1 (100.0%) | 0 (0.0%) |
| Total (Overall) | 8 (61.5%) | 5 (38.5%) |
Employment Industries by Sex in Coney Island
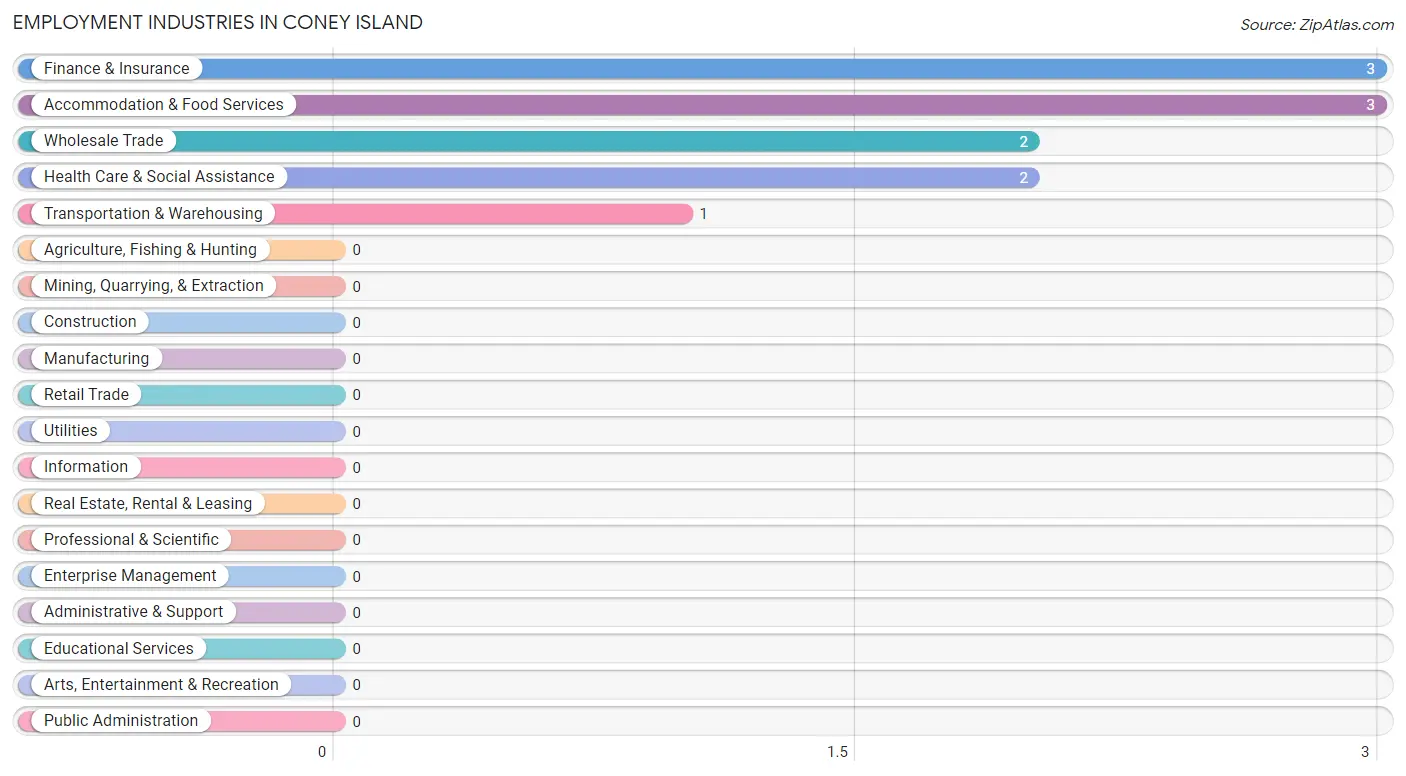
Employment Industries in Coney Island
The major employment industries in Coney Island include Finance & Insurance (3 | 23.1%), Accommodation & Food Services (3 | 23.1%), Wholesale Trade (2 | 15.4%), Health Care & Social Assistance (2 | 15.4%), and Transportation & Warehousing (1 | 7.7%).
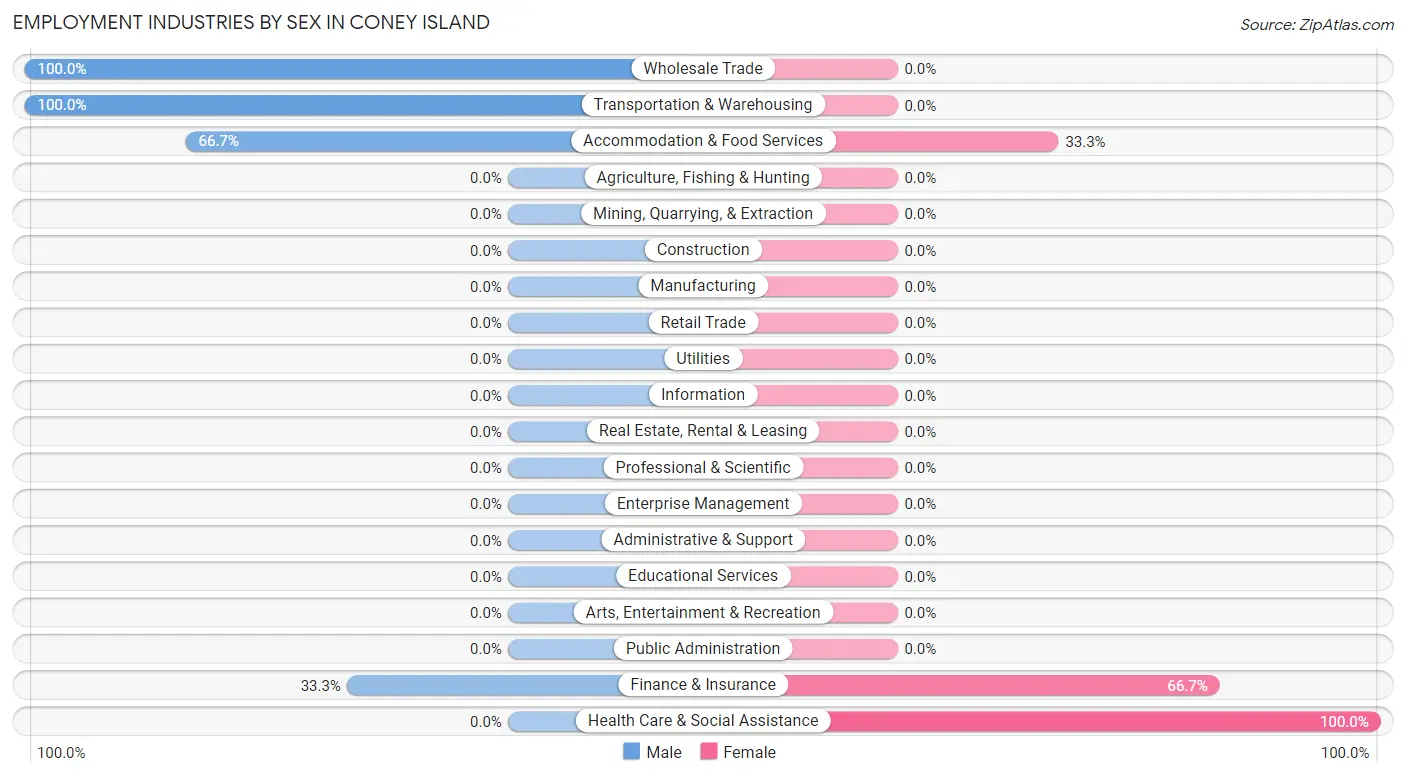
Employment Industries by Sex in Coney Island
The Coney Island industries that see more men than women are Wholesale Trade (100.0%), Transportation & Warehousing (100.0%), and Accommodation & Food Services (66.7%), whereas the industries that tend to have a higher number of women are Health Care & Social Assistance (100.0%), Finance & Insurance (66.7%), and Accommodation & Food Services (33.3%).
| Industry | Male | Female |
| Agriculture, Fishing & Hunting | 0 (0.0%) | 0 (0.0%) |
| Mining, Quarrying, & Extraction | 0 (0.0%) | 0 (0.0%) |
| Construction | 0 (0.0%) | 0 (0.0%) |
| Manufacturing | 0 (0.0%) | 0 (0.0%) |
| Wholesale Trade | 2 (100.0%) | 0 (0.0%) |
| Retail Trade | 0 (0.0%) | 0 (0.0%) |
| Transportation & Warehousing | 1 (100.0%) | 0 (0.0%) |
| Utilities | 0 (0.0%) | 0 (0.0%) |
| Information | 0 (0.0%) | 0 (0.0%) |
| Finance & Insurance | 1 (33.3%) | 2 (66.7%) |
| Real Estate, Rental & Leasing | 0 (0.0%) | 0 (0.0%) |
| Professional & Scientific | 0 (0.0%) | 0 (0.0%) |
| Enterprise Management | 0 (0.0%) | 0 (0.0%) |
| Administrative & Support | 0 (0.0%) | 0 (0.0%) |
| Educational Services | 0 (0.0%) | 0 (0.0%) |
| Health Care & Social Assistance | 0 (0.0%) | 2 (100.0%) |
| Arts, Entertainment & Recreation | 0 (0.0%) | 0 (0.0%) |
| Accommodation & Food Services | 2 (66.7%) | 1 (33.3%) |
| Public Administration | 0 (0.0%) | 0 (0.0%) |
| Total | 8 (61.5%) | 5 (38.5%) |
Education in Coney Island
School Enrollment in Coney Island
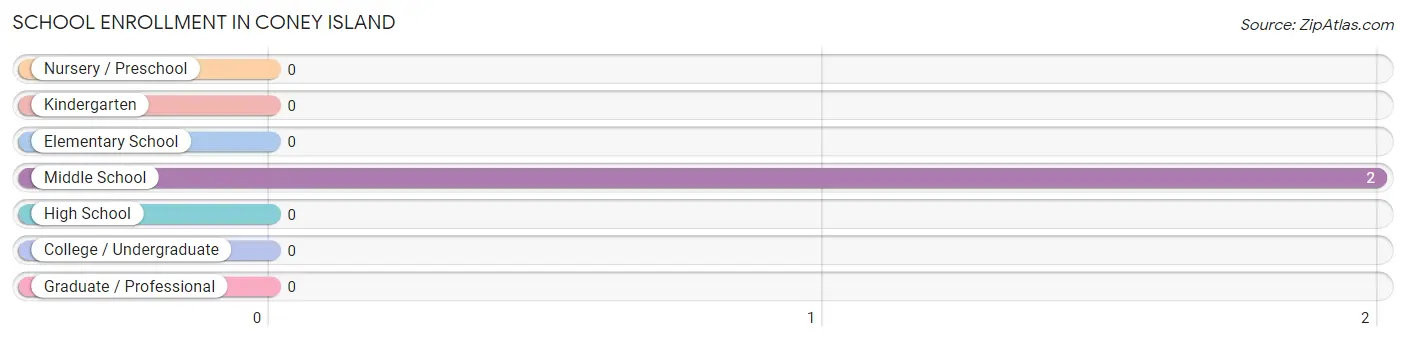
| School Level | # Students | % Students |
| Nursery / Preschool | 0 | 0.0% |
| Kindergarten | 0 | 0.0% |
| Elementary School | 0 | 0.0% |
| Middle School | 2 | 100.0% |
| High School | 0 | 0.0% |
| College / Undergraduate | 0 | 0.0% |
| Graduate / Professional | 0 | 0.0% |
| Total | 2 | 100.0% |
School Enrollment by Age by Funding Source in Coney Island
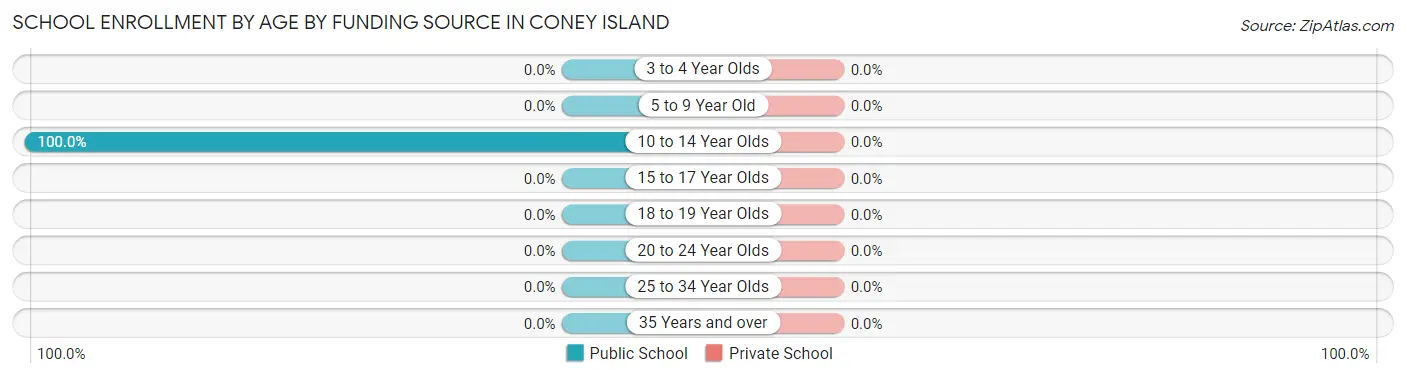
| Age Bracket | Public School | Private School |
| 3 to 4 Year Olds | 0 (0.0%) | 0 (0.0%) |
| 5 to 9 Year Old | 0 (0.0%) | 0 (0.0%) |
| 10 to 14 Year Olds | 2 (100.0%) | 0 (0.0%) |
| 15 to 17 Year Olds | 0 (0.0%) | 0 (0.0%) |
| 18 to 19 Year Olds | 0 (0.0%) | 0 (0.0%) |
| 20 to 24 Year Olds | 0 (0.0%) | 0 (0.0%) |
| 25 to 34 Year Olds | 0 (0.0%) | 0 (0.0%) |
| 35 Years and over | 0 (0.0%) | 0 (0.0%) |
| Total | 2 (100.0%) | 0 (0.0%) |
Educational Attainment by Field of Study in Coney Island
Education (3 | 42.9%), science & technology (2 | 28.6%), and business (2 | 28.6%) are the most common fields of study among 7 individuals in Coney Island who have obtained a bachelor's degree or higher.
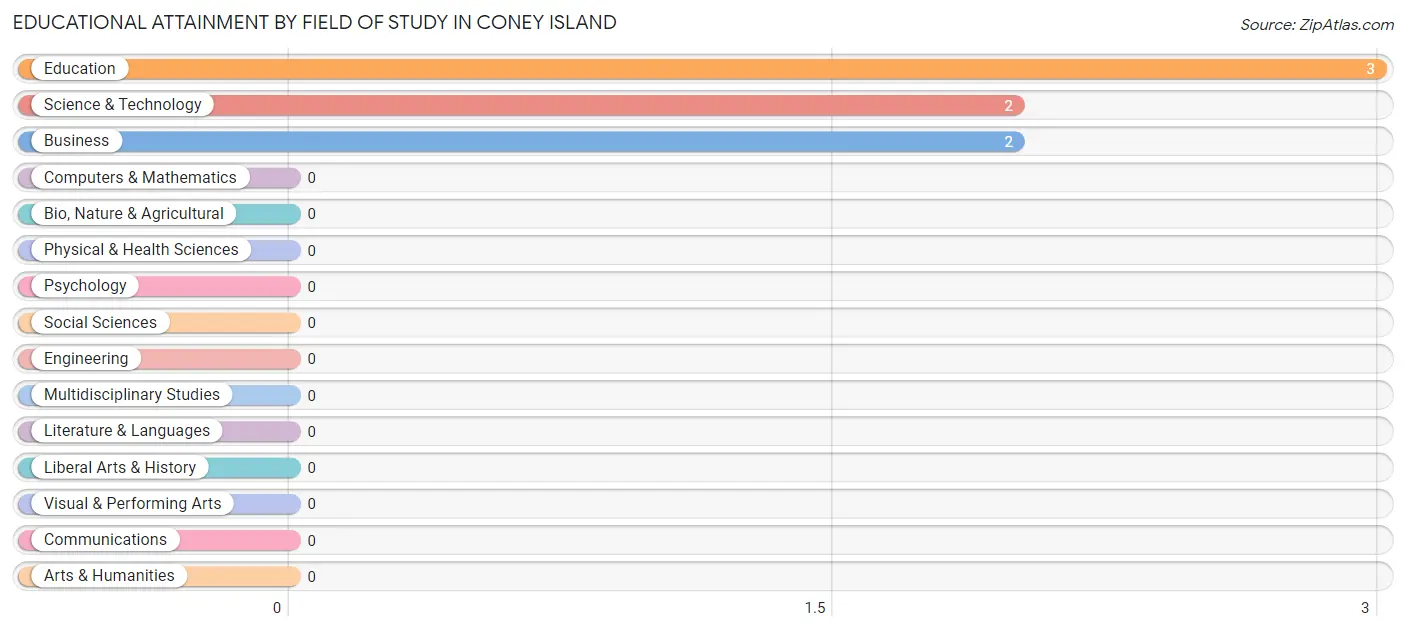
| Field of Study | # Graduates | % Graduates |
| Computers & Mathematics | 0 | 0.0% |
| Bio, Nature & Agricultural | 0 | 0.0% |
| Physical & Health Sciences | 0 | 0.0% |
| Psychology | 0 | 0.0% |
| Social Sciences | 0 | 0.0% |
| Engineering | 0 | 0.0% |
| Multidisciplinary Studies | 0 | 0.0% |
| Science & Technology | 2 | 28.6% |
| Business | 2 | 28.6% |
| Education | 3 | 42.9% |
| Literature & Languages | 0 | 0.0% |
| Liberal Arts & History | 0 | 0.0% |
| Visual & Performing Arts | 0 | 0.0% |
| Communications | 0 | 0.0% |
| Arts & Humanities | 0 | 0.0% |
| Total | 7 | 100.0% |
Transportation & Commute in Coney Island
Vehicle Availability by Sex in Coney Island
The most prevalent vehicle ownership categories in Coney Island are males with 2 vehicles (4, accounting for 50.0%) and females with 2 vehicles (3, making up 80.0%).
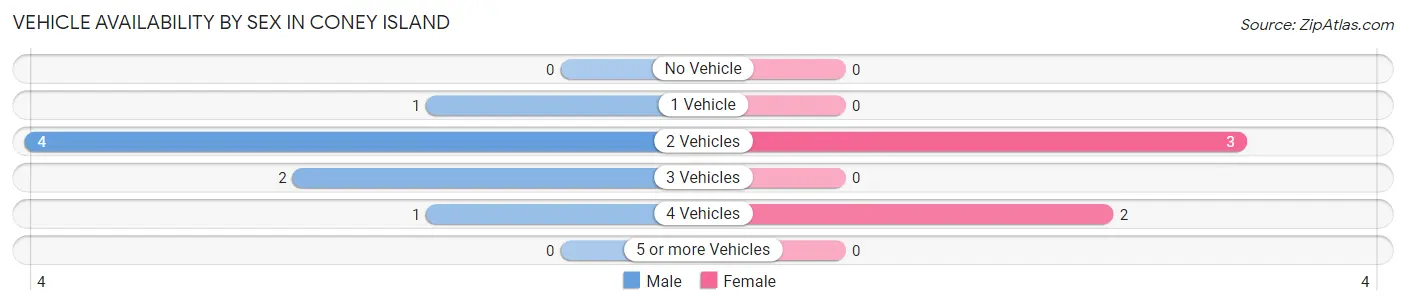
| Vehicles Available | Male | Female |
| No Vehicle | 0 (0.0%) | 0 (0.0%) |
| 1 Vehicle | 1 (12.5%) | 0 (0.0%) |
| 2 Vehicles | 4 (50.0%) | 3 (60.0%) |
| 3 Vehicles | 2 (25.0%) | 0 (0.0%) |
| 4 Vehicles | 1 (12.5%) | 2 (40.0%) |
| 5 or more Vehicles | 0 (0.0%) | 0 (0.0%) |
| Total | 8 (100.0%) | 5 (100.0%) |
Commute Time in Coney Island
The most frequently occuring commute durations in Coney Island are 25 to 29 minutes (3 commuters, 30.0%), 10 to 14 minutes (2 commuters, 20.0%), and 30 to 34 minutes (2 commuters, 20.0%).
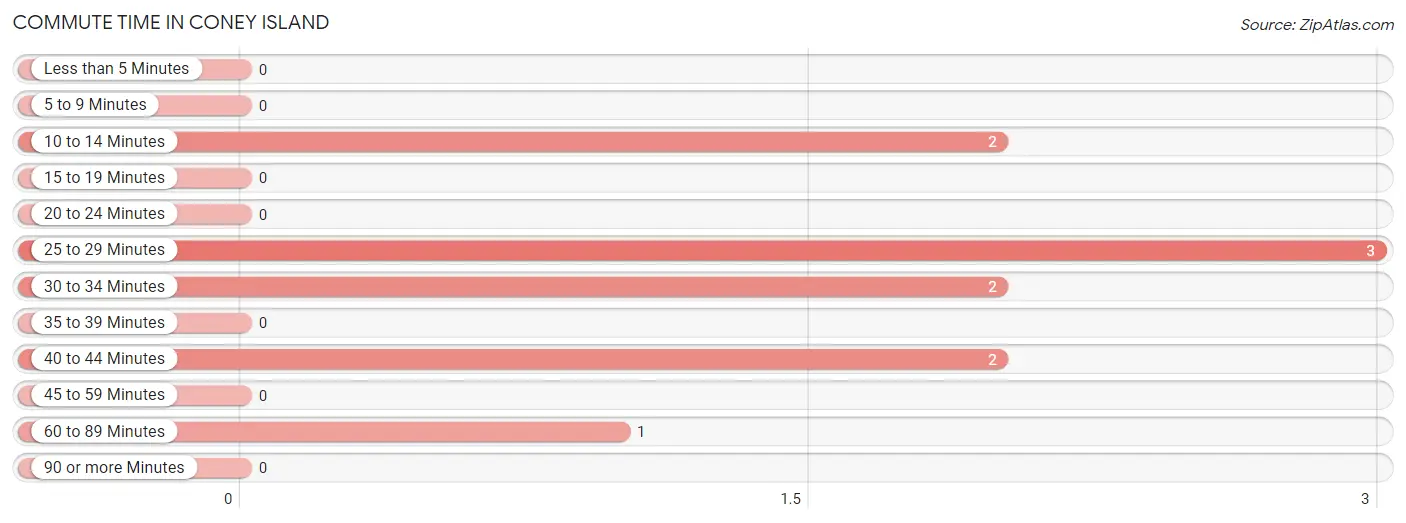
| Commute Time | # Commuters | % Commuters |
| Less than 5 Minutes | 0 | 0.0% |
| 5 to 9 Minutes | 0 | 0.0% |
| 10 to 14 Minutes | 2 | 20.0% |
| 15 to 19 Minutes | 0 | 0.0% |
| 20 to 24 Minutes | 0 | 0.0% |
| 25 to 29 Minutes | 3 | 30.0% |
| 30 to 34 Minutes | 2 | 20.0% |
| 35 to 39 Minutes | 0 | 0.0% |
| 40 to 44 Minutes | 2 | 20.0% |
| 45 to 59 Minutes | 0 | 0.0% |
| 60 to 89 Minutes | 1 | 10.0% |
| 90 or more Minutes | 0 | 0.0% |
Commute Time by Sex in Coney Island
The most common commute times in Coney Island are 30 to 34 minutes (2 commuters, 33.3%) for males and 10 to 14 minutes (2 commuters, 50.0%) for females.
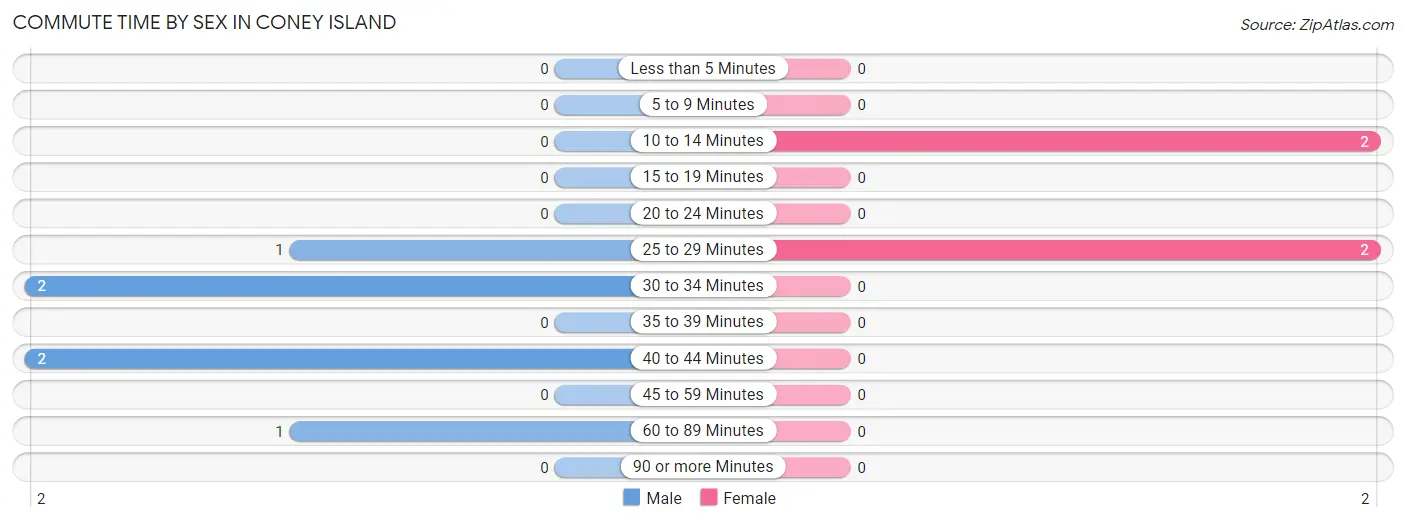
| Commute Time | Male | Female |
| Less than 5 Minutes | 0 (0.0%) | 0 (0.0%) |
| 5 to 9 Minutes | 0 (0.0%) | 0 (0.0%) |
| 10 to 14 Minutes | 0 (0.0%) | 2 (50.0%) |
| 15 to 19 Minutes | 0 (0.0%) | 0 (0.0%) |
| 20 to 24 Minutes | 0 (0.0%) | 0 (0.0%) |
| 25 to 29 Minutes | 1 (16.7%) | 2 (50.0%) |
| 30 to 34 Minutes | 2 (33.3%) | 0 (0.0%) |
| 35 to 39 Minutes | 0 (0.0%) | 0 (0.0%) |
| 40 to 44 Minutes | 2 (33.3%) | 0 (0.0%) |
| 45 to 59 Minutes | 0 (0.0%) | 0 (0.0%) |
| 60 to 89 Minutes | 1 (16.7%) | 0 (0.0%) |
| 90 or more Minutes | 0 (0.0%) | 0 (0.0%) |
Time of Departure to Work by Sex in Coney Island
The most frequent times of departure to work in Coney Island are 6:30 AM to 6:59 AM (3, 50.0%) for males and 8:00 AM to 8:29 AM (4, 100.0%) for females.
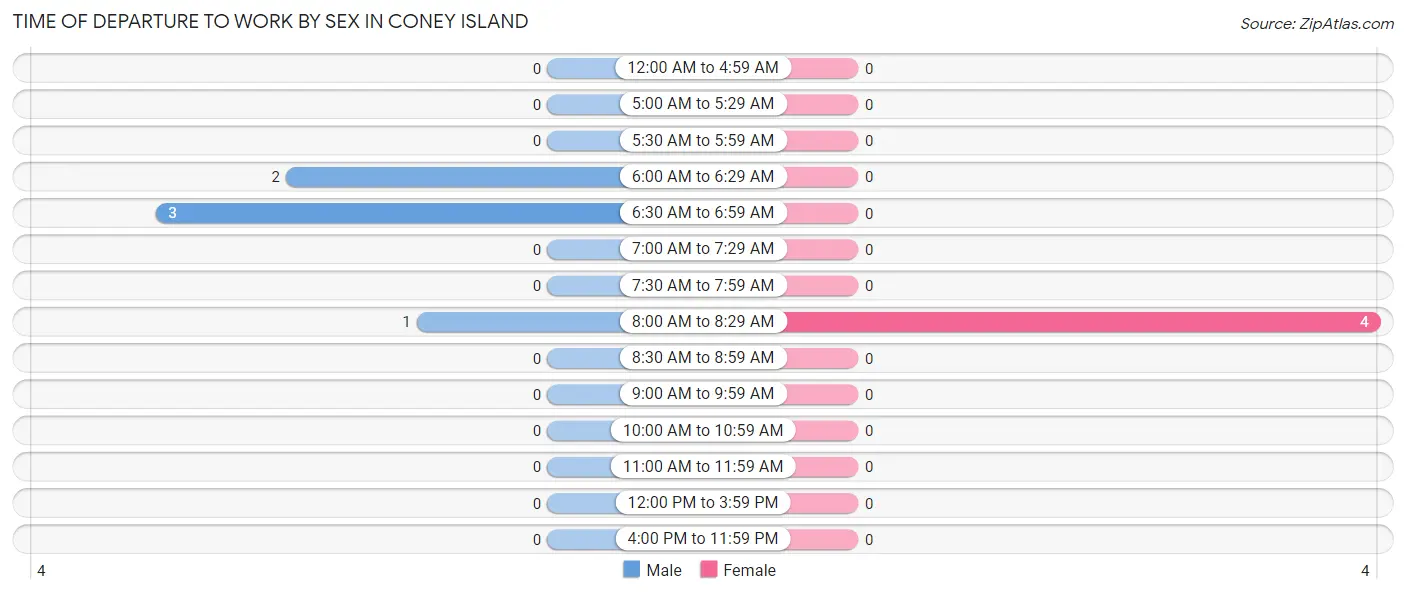
| Time of Departure | Male | Female |
| 12:00 AM to 4:59 AM | 0 (0.0%) | 0 (0.0%) |
| 5:00 AM to 5:29 AM | 0 (0.0%) | 0 (0.0%) |
| 5:30 AM to 5:59 AM | 0 (0.0%) | 0 (0.0%) |
| 6:00 AM to 6:29 AM | 2 (33.3%) | 0 (0.0%) |
| 6:30 AM to 6:59 AM | 3 (50.0%) | 0 (0.0%) |
| 7:00 AM to 7:29 AM | 0 (0.0%) | 0 (0.0%) |
| 7:30 AM to 7:59 AM | 0 (0.0%) | 0 (0.0%) |
| 8:00 AM to 8:29 AM | 1 (16.7%) | 4 (100.0%) |
| 8:30 AM to 8:59 AM | 0 (0.0%) | 0 (0.0%) |
| 9:00 AM to 9:59 AM | 0 (0.0%) | 0 (0.0%) |
| 10:00 AM to 10:59 AM | 0 (0.0%) | 0 (0.0%) |
| 11:00 AM to 11:59 AM | 0 (0.0%) | 0 (0.0%) |
| 12:00 PM to 3:59 PM | 0 (0.0%) | 0 (0.0%) |
| 4:00 PM to 11:59 PM | 0 (0.0%) | 0 (0.0%) |
| Total | 6 (100.0%) | 4 (100.0%) |
Housing Occupancy in Coney Island
Occupancy by Ownership in Coney Island
Of the total 18 dwellings in Coney Island, owner-occupied units account for 16 (88.9%), while renter-occupied units make up 2 (11.1%).
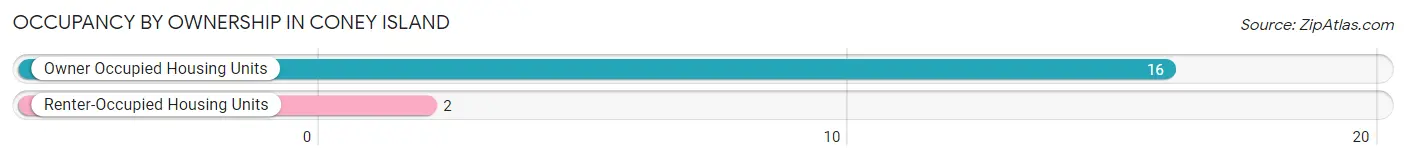
| Occupancy | # Housing Units | % Housing Units |
| Owner Occupied Housing Units | 16 | 88.9% |
| Renter-Occupied Housing Units | 2 | 11.1% |
| Total Occupied Housing Units | 18 | 100.0% |
Occupancy by Household Size in Coney Island
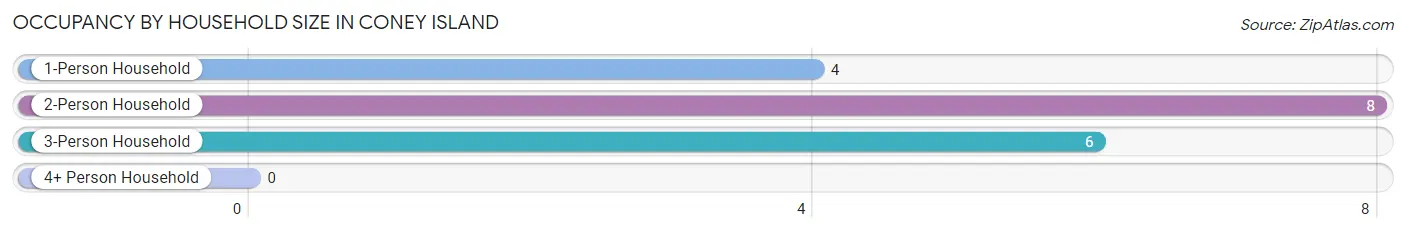
| Household Size | # Housing Units | % Housing Units |
| 1-Person Household | 4 | 22.2% |
| 2-Person Household | 8 | 44.4% |
| 3-Person Household | 6 | 33.3% |
| 4+ Person Household | 0 | 0.0% |
| Total Housing Units | 18 | 100.0% |
Occupancy by Ownership by Household Size in Coney Island
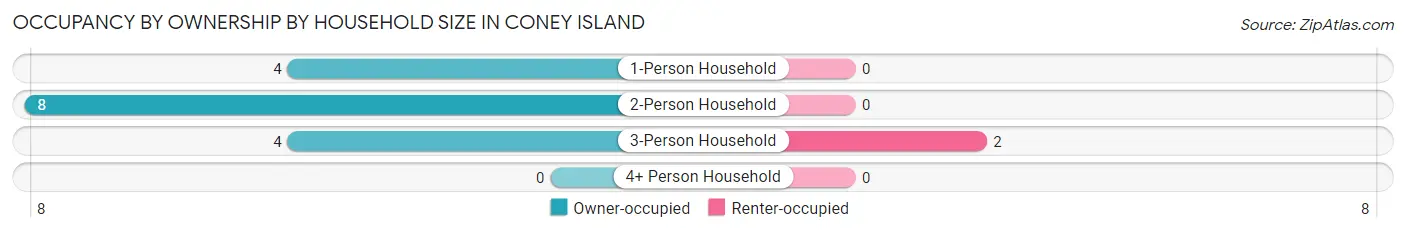
| Household Size | Owner-occupied | Renter-occupied |
| 1-Person Household | 4 (100.0%) | 0 (0.0%) |
| 2-Person Household | 8 (100.0%) | 0 (0.0%) |
| 3-Person Household | 4 (66.7%) | 2 (33.3%) |
| 4+ Person Household | 0 (0.0%) | 0 (0.0%) |
| Total Housing Units | 16 (88.9%) | 2 (11.1%) |
Occupancy by Educational Attainment in Coney Island
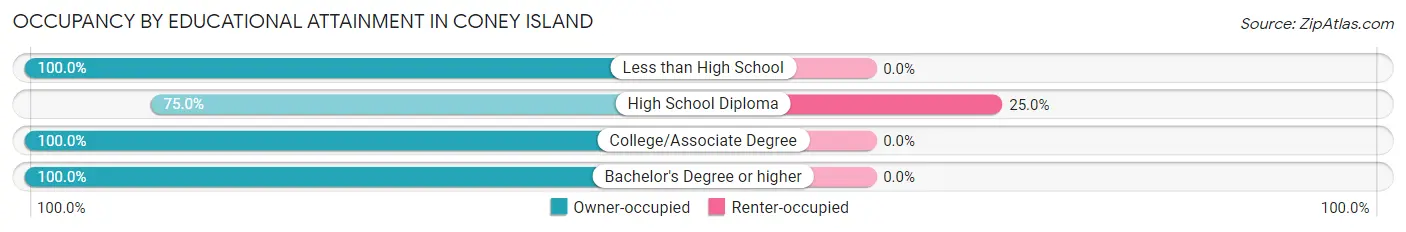
| Household Size | Owner-occupied | Renter-occupied |
| Less than High School | 1 (100.0%) | 0 (0.0%) |
| High School Diploma | 6 (75.0%) | 2 (25.0%) |
| College/Associate Degree | 3 (100.0%) | 0 (0.0%) |
| Bachelor's Degree or higher | 6 (100.0%) | 0 (0.0%) |
Occupancy by Age of Householder in Coney Island
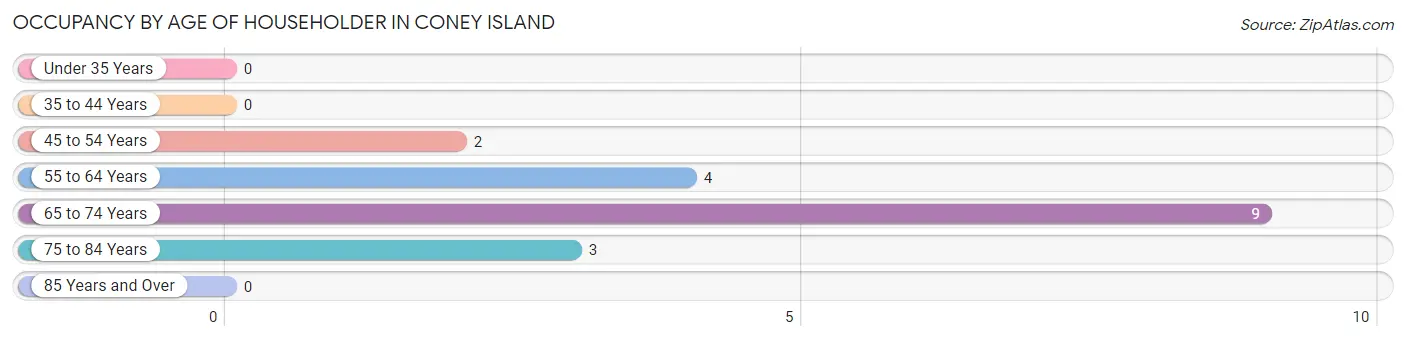
| Age Bracket | # Households | % Households |
| Under 35 Years | 0 | 0.0% |
| 35 to 44 Years | 0 | 0.0% |
| 45 to 54 Years | 2 | 11.1% |
| 55 to 64 Years | 4 | 22.2% |
| 65 to 74 Years | 9 | 50.0% |
| 75 to 84 Years | 3 | 16.7% |
| 85 Years and Over | 0 | 0.0% |
| Total | 18 | 100.0% |
Housing Finances in Coney Island
Median Income by Occupancy in Coney Island
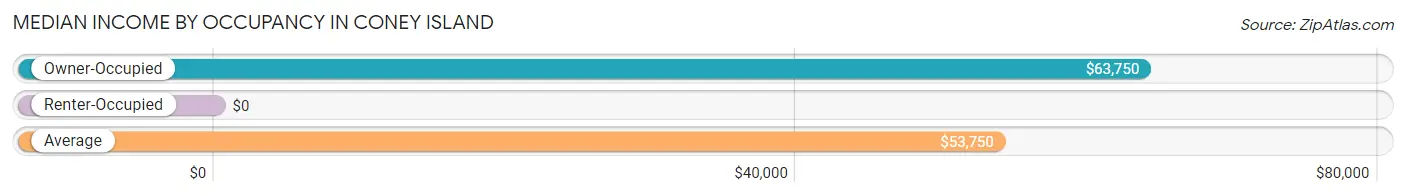
| Occupancy Type | # Households | Median Income |
| Owner-Occupied | 16 (88.9%) | $63,750 |
| Renter-Occupied | 2 (11.1%) | $0 |
| Average | 18 (100.0%) | $53,750 |
Occupancy by Householder Income Bracket in Coney Island
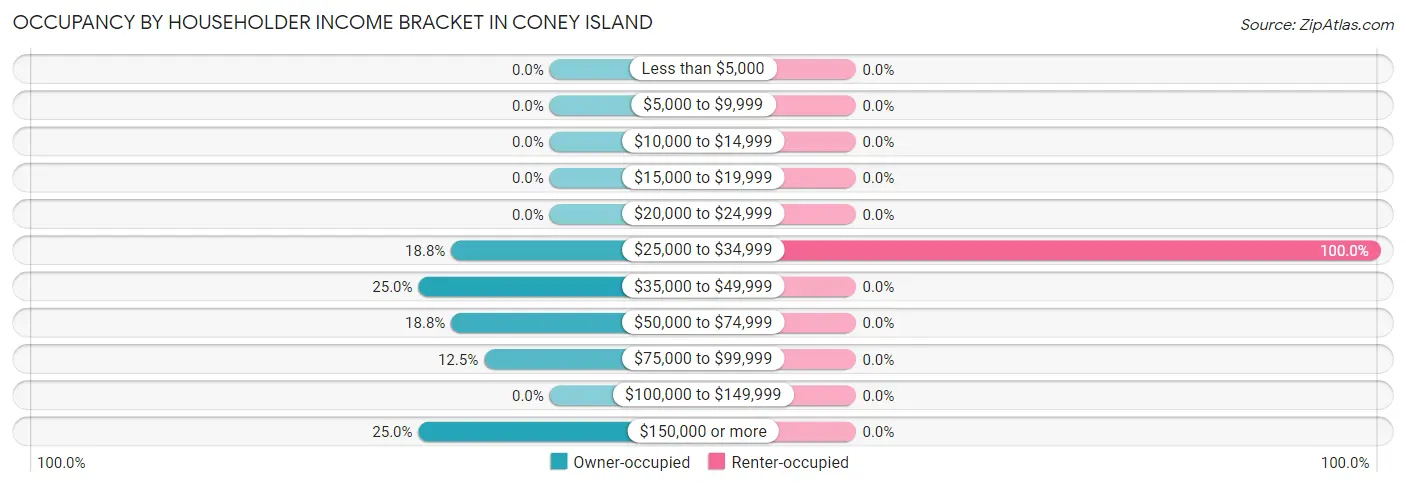
| Income Bracket | Owner-occupied | Renter-occupied |
| Less than $5,000 | 0 (0.0%) | 0 (0.0%) |
| $5,000 to $9,999 | 0 (0.0%) | 0 (0.0%) |
| $10,000 to $14,999 | 0 (0.0%) | 0 (0.0%) |
| $15,000 to $19,999 | 0 (0.0%) | 0 (0.0%) |
| $20,000 to $24,999 | 0 (0.0%) | 0 (0.0%) |
| $25,000 to $34,999 | 3 (18.8%) | 2 (100.0%) |
| $35,000 to $49,999 | 4 (25.0%) | 0 (0.0%) |
| $50,000 to $74,999 | 3 (18.8%) | 0 (0.0%) |
| $75,000 to $99,999 | 2 (12.5%) | 0 (0.0%) |
| $100,000 to $149,999 | 0 (0.0%) | 0 (0.0%) |
| $150,000 or more | 4 (25.0%) | 0 (0.0%) |
| Total | 16 (100.0%) | 2 (100.0%) |
Monthly Housing Cost Tiers in Coney Island
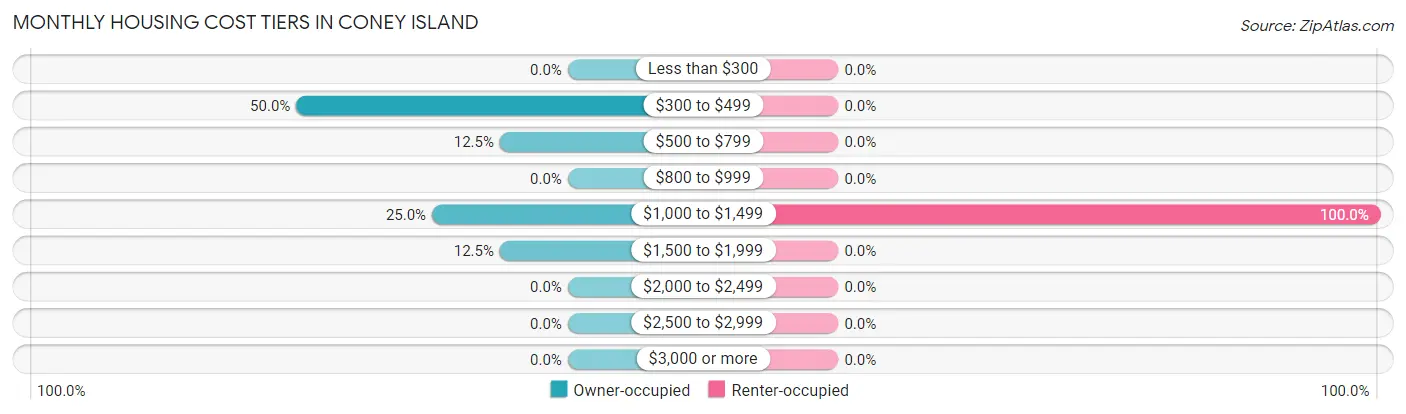
| Monthly Cost | Owner-occupied | Renter-occupied |
| Less than $300 | 0 (0.0%) | 0 (0.0%) |
| $300 to $499 | 8 (50.0%) | 0 (0.0%) |
| $500 to $799 | 2 (12.5%) | 0 (0.0%) |
| $800 to $999 | 0 (0.0%) | 0 (0.0%) |
| $1,000 to $1,499 | 4 (25.0%) | 2 (100.0%) |
| $1,500 to $1,999 | 2 (12.5%) | 0 (0.0%) |
| $2,000 to $2,499 | 0 (0.0%) | 0 (0.0%) |
| $2,500 to $2,999 | 0 (0.0%) | 0 (0.0%) |
| $3,000 or more | 0 (0.0%) | 0 (0.0%) |
| Total | 16 (100.0%) | 2 (100.0%) |
Physical Housing Characteristics in Coney Island
Housing Structures in Coney Island
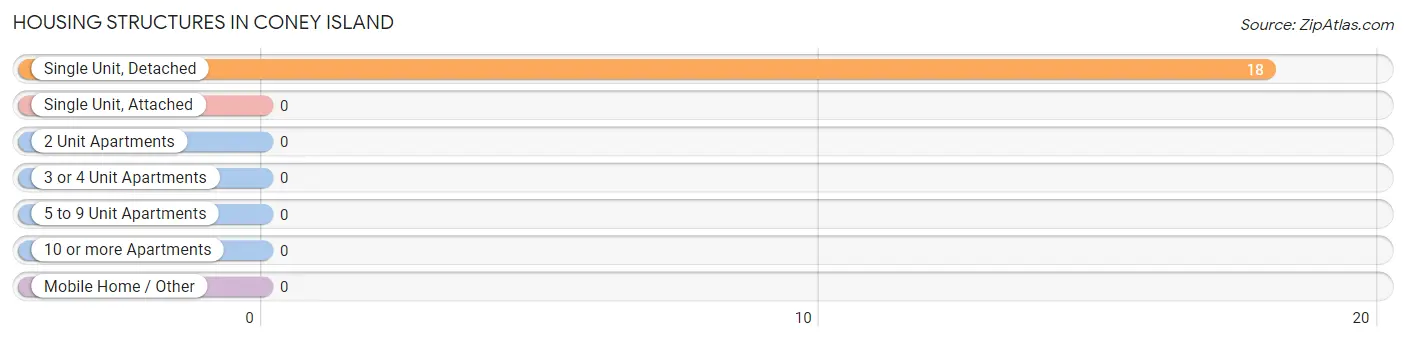
| Structure Type | # Housing Units | % Housing Units |
| Single Unit, Detached | 18 | 100.0% |
| Single Unit, Attached | 0 | 0.0% |
| 2 Unit Apartments | 0 | 0.0% |
| 3 or 4 Unit Apartments | 0 | 0.0% |
| 5 to 9 Unit Apartments | 0 | 0.0% |
| 10 or more Apartments | 0 | 0.0% |
| Mobile Home / Other | 0 | 0.0% |
| Total | 18 | 100.0% |
Housing Structures by Occupancy in Coney Island
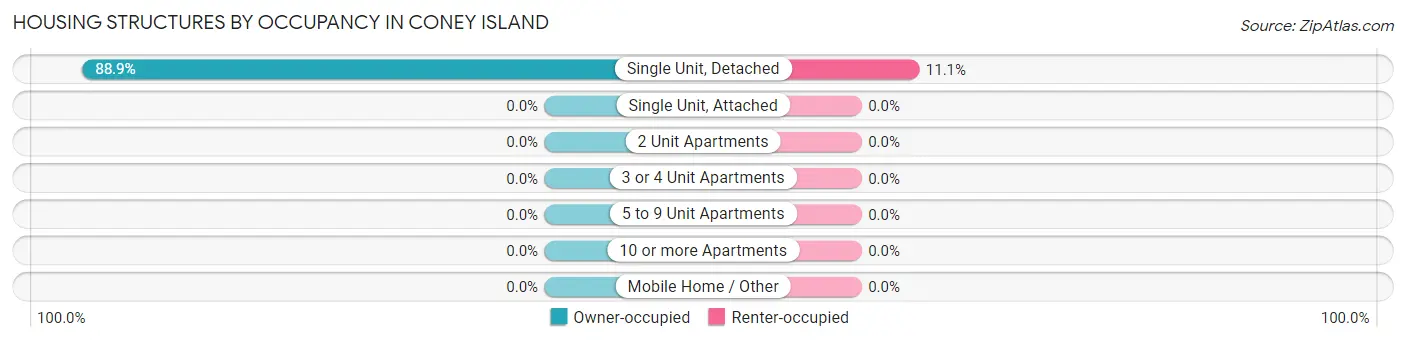
| Structure Type | Owner-occupied | Renter-occupied |
| Single Unit, Detached | 16 (88.9%) | 2 (11.1%) |
| Single Unit, Attached | 0 (0.0%) | 0 (0.0%) |
| 2 Unit Apartments | 0 (0.0%) | 0 (0.0%) |
| 3 or 4 Unit Apartments | 0 (0.0%) | 0 (0.0%) |
| 5 to 9 Unit Apartments | 0 (0.0%) | 0 (0.0%) |
| 10 or more Apartments | 0 (0.0%) | 0 (0.0%) |
| Mobile Home / Other | 0 (0.0%) | 0 (0.0%) |
| Total | 16 (88.9%) | 2 (11.1%) |
Housing Structures by Number of Rooms in Coney Island
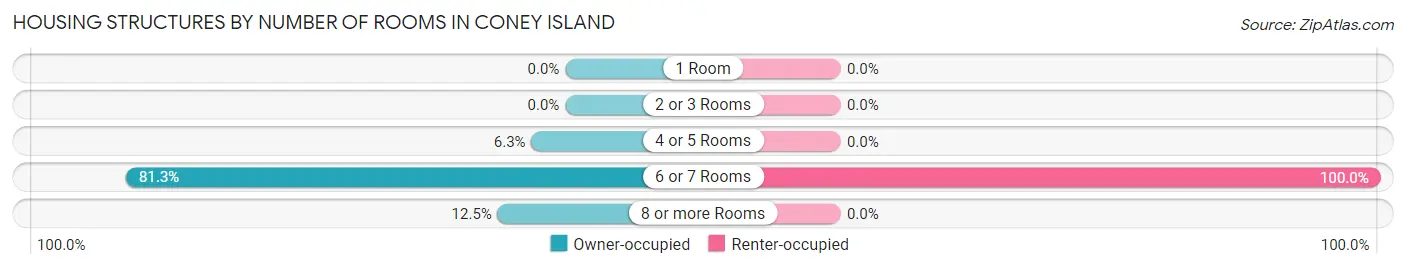
| Number of Rooms | Owner-occupied | Renter-occupied |
| 1 Room | 0 (0.0%) | 0 (0.0%) |
| 2 or 3 Rooms | 0 (0.0%) | 0 (0.0%) |
| 4 or 5 Rooms | 1 (6.2%) | 0 (0.0%) |
| 6 or 7 Rooms | 13 (81.2%) | 2 (100.0%) |
| 8 or more Rooms | 2 (12.5%) | 0 (0.0%) |
| Total | 16 (100.0%) | 2 (100.0%) |
Housing Structure by Heating Type in Coney Island
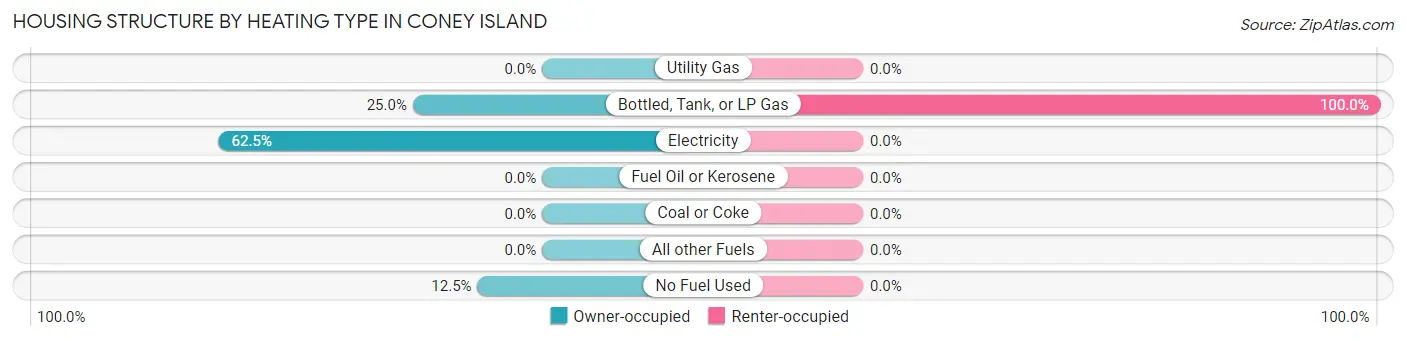
| Heating Type | Owner-occupied | Renter-occupied |
| Utility Gas | 0 (0.0%) | 0 (0.0%) |
| Bottled, Tank, or LP Gas | 4 (25.0%) | 2 (100.0%) |
| Electricity | 10 (62.5%) | 0 (0.0%) |
| Fuel Oil or Kerosene | 0 (0.0%) | 0 (0.0%) |
| Coal or Coke | 0 (0.0%) | 0 (0.0%) |
| All other Fuels | 0 (0.0%) | 0 (0.0%) |
| No Fuel Used | 2 (12.5%) | 0 (0.0%) |
| Total | 16 (100.0%) | 2 (100.0%) |
Household Vehicle Usage in Coney Island
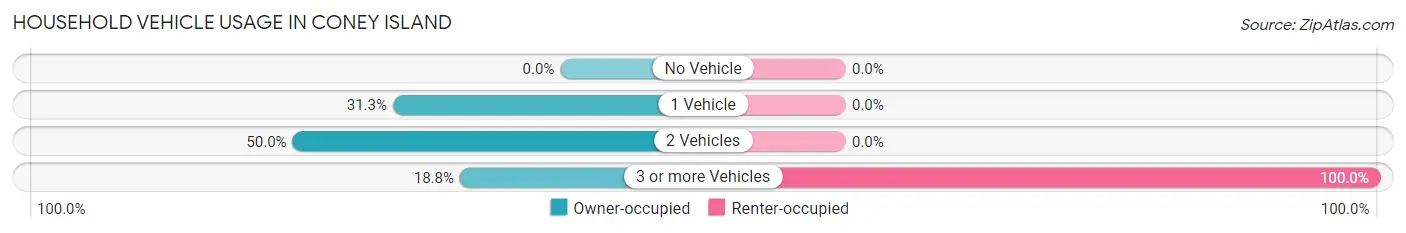
| Vehicles per Household | Owner-occupied | Renter-occupied |
| No Vehicle | 0 (0.0%) | 0 (0.0%) |
| 1 Vehicle | 5 (31.2%) | 0 (0.0%) |
| 2 Vehicles | 8 (50.0%) | 0 (0.0%) |
| 3 or more Vehicles | 3 (18.8%) | 2 (100.0%) |
| Total | 16 (100.0%) | 2 (100.0%) |
Real Estate & Mortgages in Coney Island
Real Estate and Mortgage Overview in Coney Island
| Characteristic | Without Mortgage | With Mortgage |
| Housing Units | 10 | 6 |
| Median Property Value | - | - |
| Median Household Income | $68,750 | $2 |
| Monthly Housing Costs | $440 | $0 |
| Real Estate Taxes | $1,125 | $0 |
Property Value by Mortgage Status in Coney Island
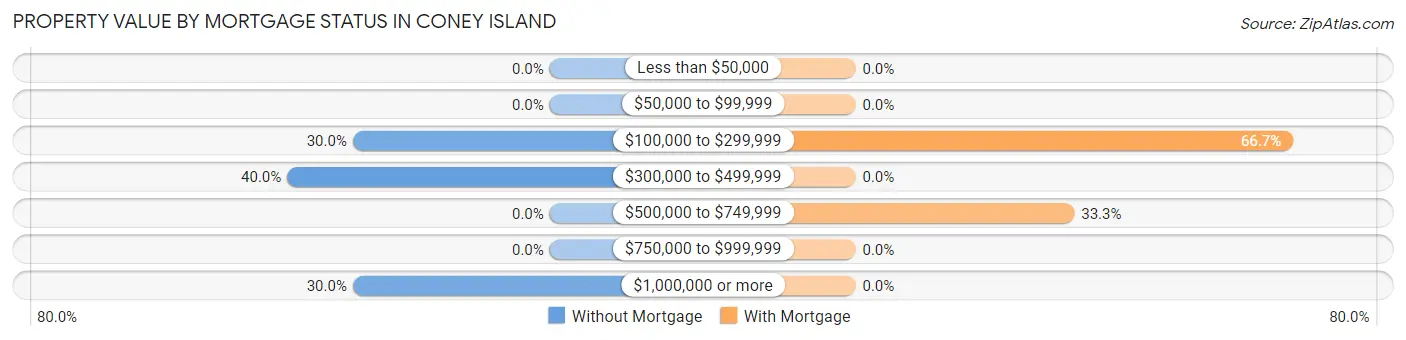
| Property Value | Without Mortgage | With Mortgage |
| Less than $50,000 | 0 (0.0%) | 0 (0.0%) |
| $50,000 to $99,999 | 0 (0.0%) | 0 (0.0%) |
| $100,000 to $299,999 | 3 (30.0%) | 4 (66.7%) |
| $300,000 to $499,999 | 4 (40.0%) | 0 (0.0%) |
| $500,000 to $749,999 | 0 (0.0%) | 2 (33.3%) |
| $750,000 to $999,999 | 0 (0.0%) | 0 (0.0%) |
| $1,000,000 or more | 3 (30.0%) | 0 (0.0%) |
| Total | 10 (100.0%) | 6 (100.0%) |
Household Income by Mortgage Status in Coney Island
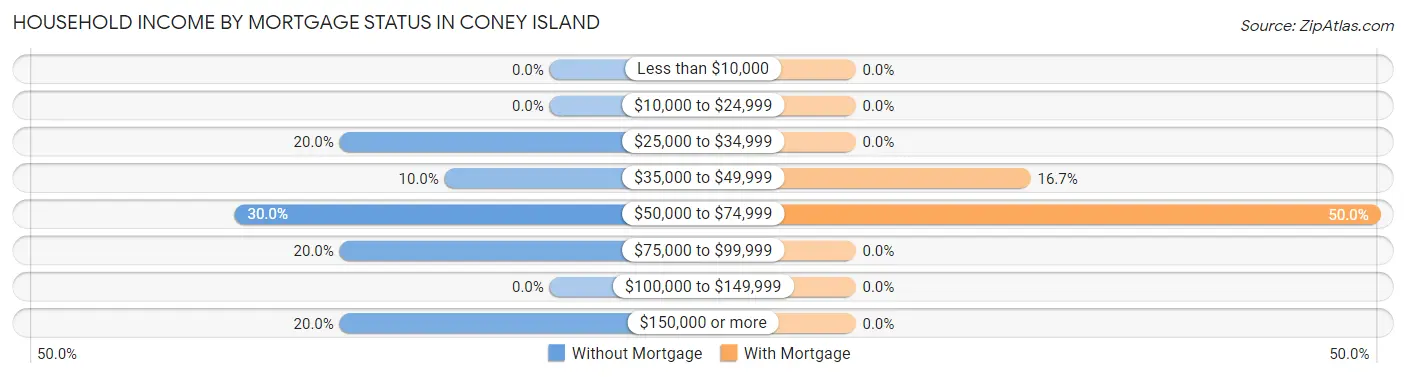
| Household Income | Without Mortgage | With Mortgage |
| Less than $10,000 | 0 (0.0%) | 0 (0.0%) |
| $10,000 to $24,999 | 0 (0.0%) | 0 (0.0%) |
| $25,000 to $34,999 | 2 (20.0%) | 0 (0.0%) |
| $35,000 to $49,999 | 1 (10.0%) | 1 (16.7%) |
| $50,000 to $74,999 | 3 (30.0%) | 3 (50.0%) |
| $75,000 to $99,999 | 2 (20.0%) | 0 (0.0%) |
| $100,000 to $149,999 | 0 (0.0%) | 0 (0.0%) |
| $150,000 or more | 2 (20.0%) | 0 (0.0%) |
| Total | 10 (100.0%) | 6 (100.0%) |
Property Value to Household Income Ratio in Coney Island
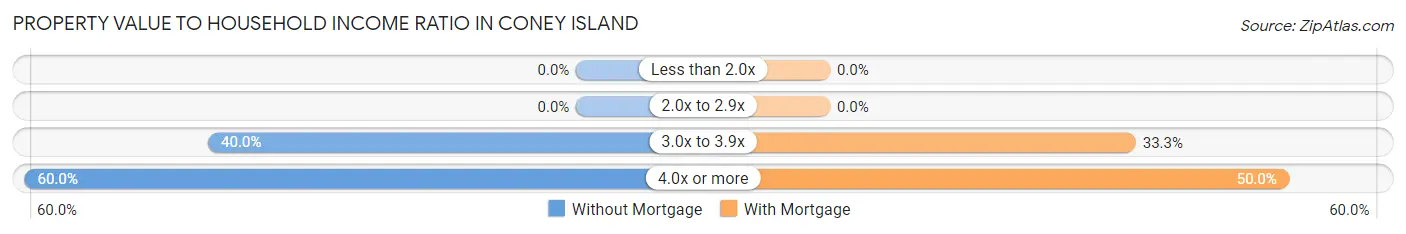
| Value-to-Income Ratio | Without Mortgage | With Mortgage |
| Less than 2.0x | 0 (0.0%) | 0 (0.0%) |
| 2.0x to 2.9x | 0 (0.0%) | 0 (0.0%) |
| 3.0x to 3.9x | 4 (40.0%) | 2 (33.3%) |
| 4.0x or more | 6 (60.0%) | 3 (50.0%) |
| Total | 10 (100.0%) | 6 (100.0%) |
Real Estate Taxes by Mortgage Status in Coney Island
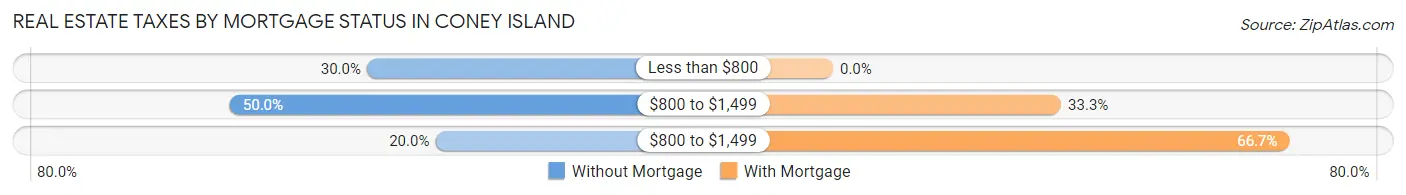
| Property Taxes | Without Mortgage | With Mortgage |
| Less than $800 | 3 (30.0%) | 0 (0.0%) |
| $800 to $1,499 | 5 (50.0%) | 2 (33.3%) |
| $800 to $1,499 | 2 (20.0%) | 4 (66.7%) |
| Total | 10 (100.0%) | 6 (100.0%) |
Health & Disability in Coney Island
Health Insurance Coverage by Age in Coney Island
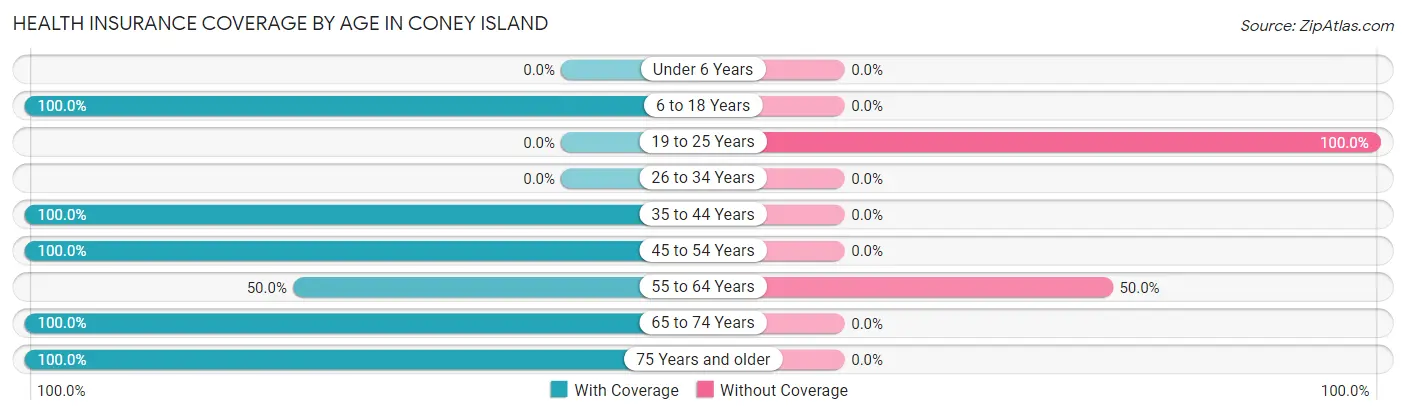
| Age Bracket | With Coverage | Without Coverage |
| Under 6 Years | 0 (0.0%) | 0 (0.0%) |
| 6 to 18 Years | 2 (100.0%) | 0 (0.0%) |
| 19 to 25 Years | 0 (0.0%) | 2 (100.0%) |
| 26 to 34 Years | 0 (0.0%) | 0 (0.0%) |
| 35 to 44 Years | 3 (100.0%) | 0 (0.0%) |
| 45 to 54 Years | 3 (100.0%) | 0 (0.0%) |
| 55 to 64 Years | 4 (50.0%) | 4 (50.0%) |
| 65 to 74 Years | 16 (100.0%) | 0 (0.0%) |
| 75 Years and older | 4 (100.0%) | 0 (0.0%) |
| Total | 32 (84.2%) | 6 (15.8%) |
Health Insurance Coverage by Citizenship Status in Coney Island
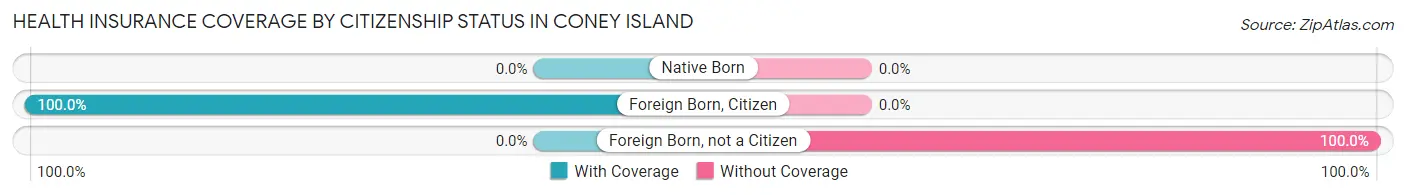
| Citizenship Status | With Coverage | Without Coverage |
| Native Born | 0 (0.0%) | 0 (0.0%) |
| Foreign Born, Citizen | 2 (100.0%) | 0 (0.0%) |
| Foreign Born, not a Citizen | 0 (0.0%) | 2 (100.0%) |
Health Insurance Coverage by Household Income in Coney Island
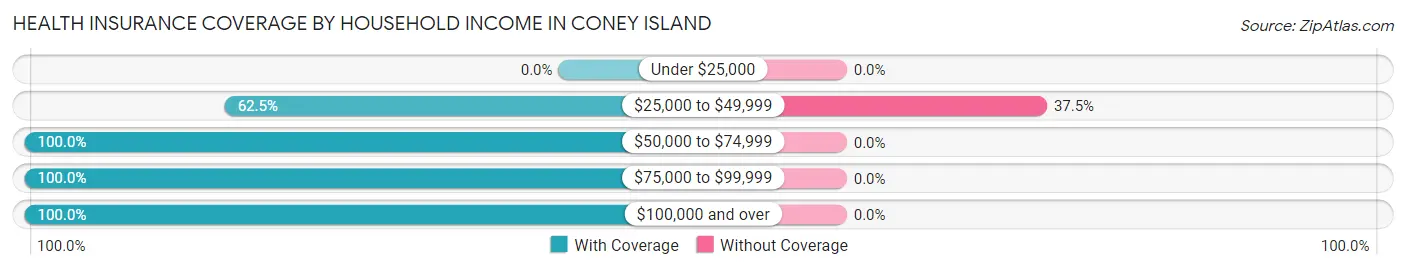
| Household Income | With Coverage | Without Coverage |
| Under $25,000 | 0 (0.0%) | 0 (0.0%) |
| $25,000 to $49,999 | 10 (62.5%) | 6 (37.5%) |
| $50,000 to $74,999 | 7 (100.0%) | 0 (0.0%) |
| $75,000 to $99,999 | 6 (100.0%) | 0 (0.0%) |
| $100,000 and over | 9 (100.0%) | 0 (0.0%) |
Public vs Private Health Insurance Coverage by Age in Coney Island
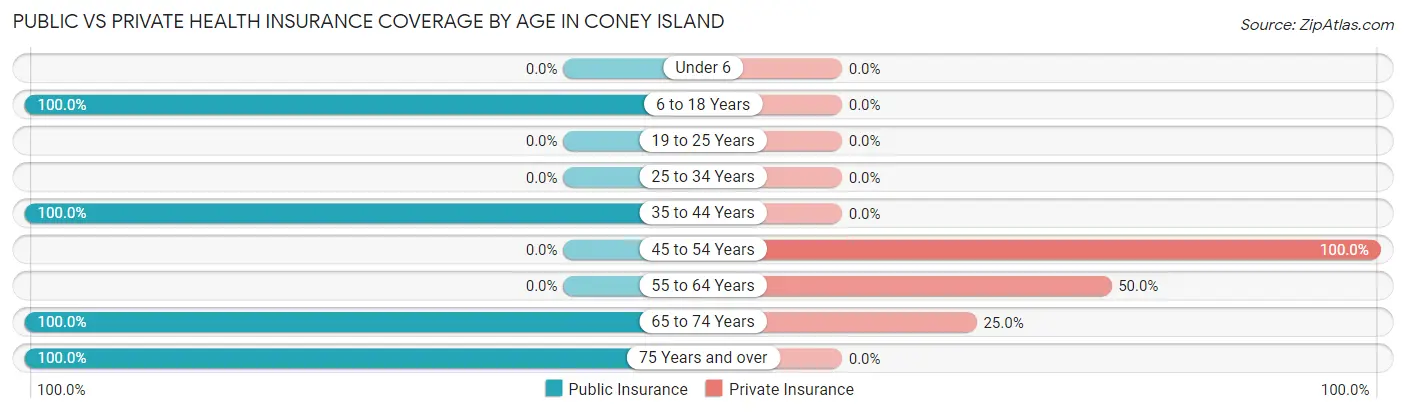
| Age Bracket | Public Insurance | Private Insurance |
| Under 6 | 0 (0.0%) | 0 (0.0%) |
| 6 to 18 Years | 2 (100.0%) | 0 (0.0%) |
| 19 to 25 Years | 0 (0.0%) | 0 (0.0%) |
| 25 to 34 Years | 0 (0.0%) | 0 (0.0%) |
| 35 to 44 Years | 3 (100.0%) | 0 (0.0%) |
| 45 to 54 Years | 0 (0.0%) | 3 (100.0%) |
| 55 to 64 Years | 0 (0.0%) | 4 (50.0%) |
| 65 to 74 Years | 16 (100.0%) | 4 (25.0%) |
| 75 Years and over | 4 (100.0%) | 0 (0.0%) |
| Total | 25 (65.8%) | 11 (28.9%) |
Disability Status by Sex by Age in Coney Island
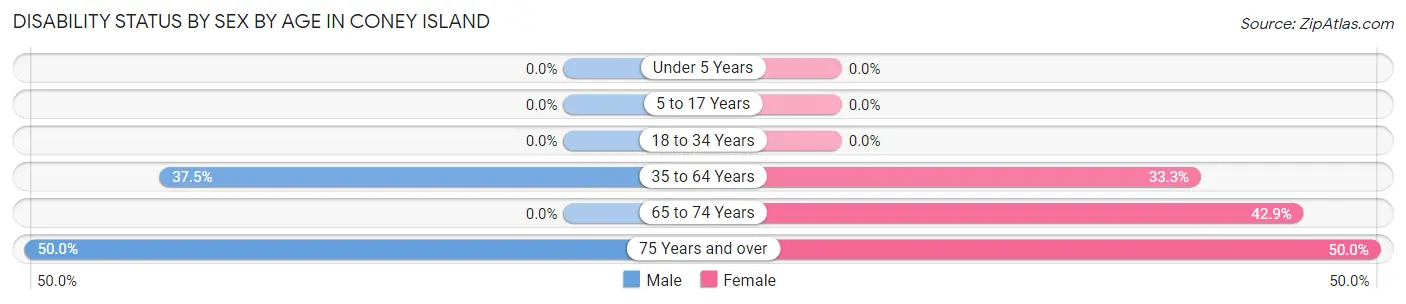
| Age Bracket | Male | Female |
| Under 5 Years | 0 (0.0%) | 0 (0.0%) |
| 5 to 17 Years | 0 (0.0%) | 0 (0.0%) |
| 18 to 34 Years | 0 (0.0%) | 0 (0.0%) |
| 35 to 64 Years | 3 (37.5%) | 2 (33.3%) |
| 65 to 74 Years | 0 (0.0%) | 3 (42.9%) |
| 75 Years and over | 1 (50.0%) | 1 (50.0%) |
Disability Class by Sex by Age in Coney Island
Disability Class: Hearing Difficulty
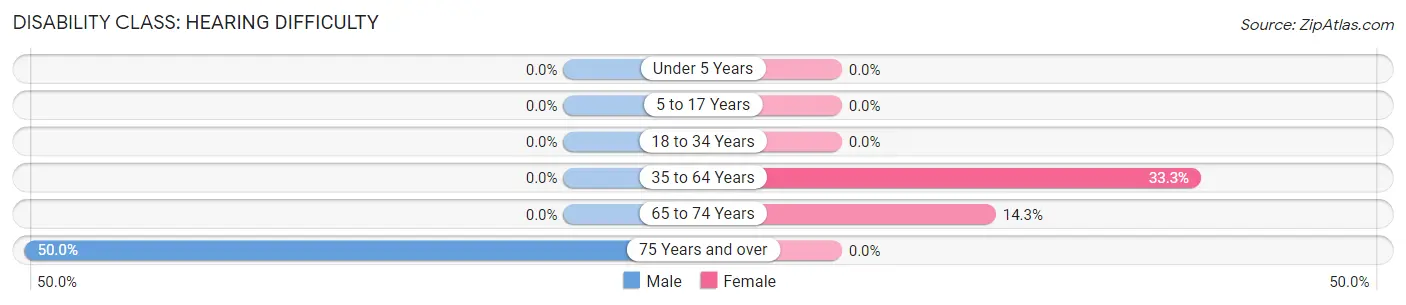
| Age Bracket | Male | Female |
| Under 5 Years | 0 (0.0%) | 0 (0.0%) |
| 5 to 17 Years | 0 (0.0%) | 0 (0.0%) |
| 18 to 34 Years | 0 (0.0%) | 0 (0.0%) |
| 35 to 64 Years | 0 (0.0%) | 2 (33.3%) |
| 65 to 74 Years | 0 (0.0%) | 1 (14.3%) |
| 75 Years and over | 1 (50.0%) | 0 (0.0%) |
Disability Class: Vision Difficulty
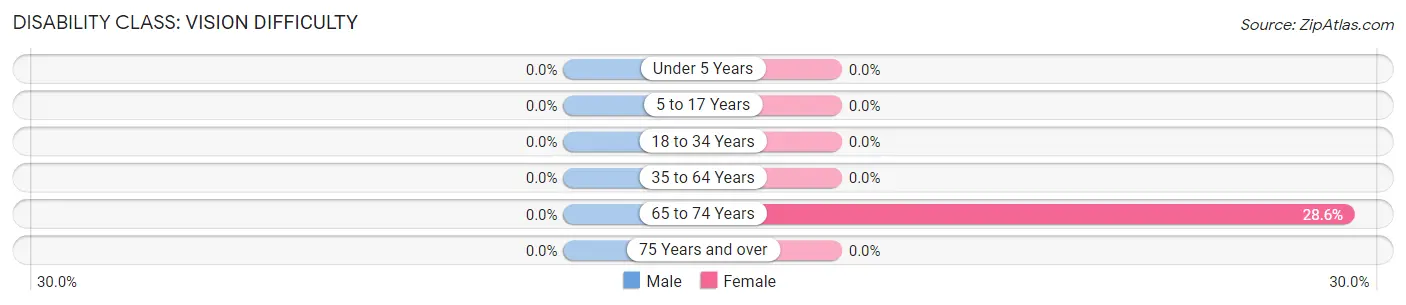
| Age Bracket | Male | Female |
| Under 5 Years | 0 (0.0%) | 0 (0.0%) |
| 5 to 17 Years | 0 (0.0%) | 0 (0.0%) |
| 18 to 34 Years | 0 (0.0%) | 0 (0.0%) |
| 35 to 64 Years | 0 (0.0%) | 0 (0.0%) |
| 65 to 74 Years | 0 (0.0%) | 2 (28.6%) |
| 75 Years and over | 0 (0.0%) | 0 (0.0%) |
Disability Class: Cognitive Difficulty
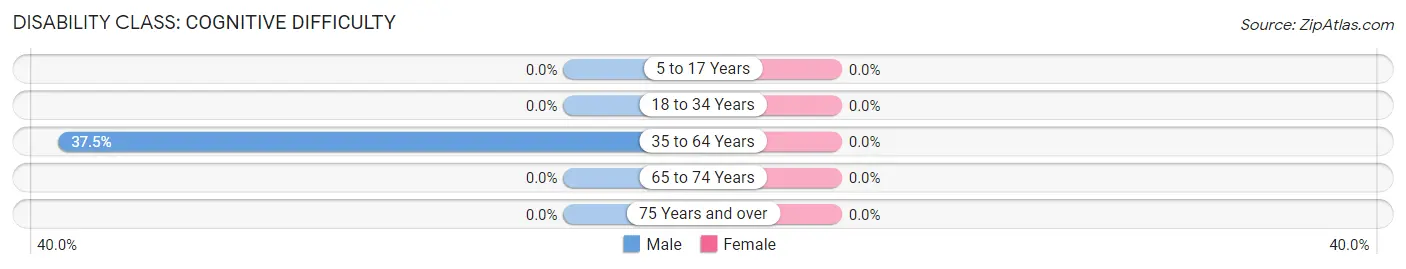
| Age Bracket | Male | Female |
| 5 to 17 Years | 0 (0.0%) | 0 (0.0%) |
| 18 to 34 Years | 0 (0.0%) | 0 (0.0%) |
| 35 to 64 Years | 3 (37.5%) | 0 (0.0%) |
| 65 to 74 Years | 0 (0.0%) | 0 (0.0%) |
| 75 Years and over | 0 (0.0%) | 0 (0.0%) |
Disability Class: Ambulatory Difficulty
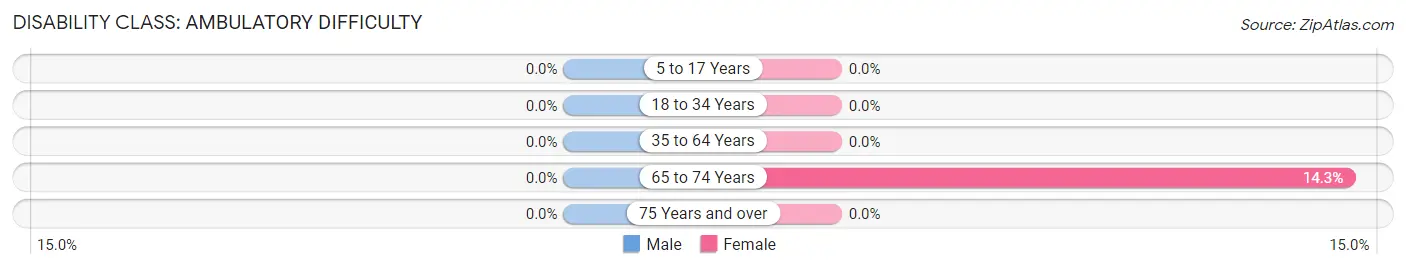
| Age Bracket | Male | Female |
| 5 to 17 Years | 0 (0.0%) | 0 (0.0%) |
| 18 to 34 Years | 0 (0.0%) | 0 (0.0%) |
| 35 to 64 Years | 0 (0.0%) | 0 (0.0%) |
| 65 to 74 Years | 0 (0.0%) | 1 (14.3%) |
| 75 Years and over | 0 (0.0%) | 0 (0.0%) |
Disability Class: Self-Care Difficulty
| Age Bracket | Male | Female |
| 5 to 17 Years | 0 (0.0%) | 0 (0.0%) |
| 18 to 34 Years | 0 (0.0%) | 0 (0.0%) |
| 35 to 64 Years | 0 (0.0%) | 0 (0.0%) |
| 65 to 74 Years | 0 (0.0%) | 0 (0.0%) |
| 75 Years and over | 0 (0.0%) | 0 (0.0%) |
Technology Access in Coney Island
Computing Device Access in Coney Island
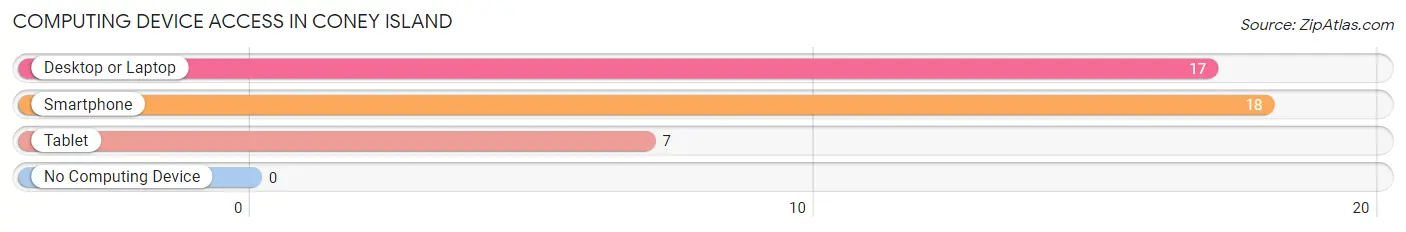
| Device Type | # Households | % Households |
| Desktop or Laptop | 17 | 94.4% |
| Smartphone | 18 | 100.0% |
| Tablet | 7 | 38.9% |
| No Computing Device | 0 | 0.0% |
| Total | 18 | 100.0% |
Internet Access in Coney Island
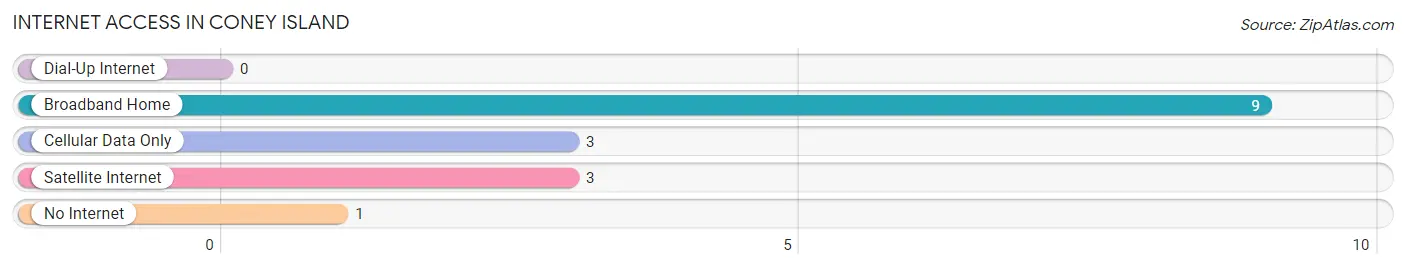
| Internet Type | # Households | % Households |
| Dial-Up Internet | 0 | 0.0% |
| Broadband Home | 9 | 50.0% |
| Cellular Data Only | 3 | 16.7% |
| Satellite Internet | 3 | 16.7% |
| No Internet | 1 | 5.6% |
| Total | 18 | 100.0% |
Coney Island Summary
Coney Island is a small unincorporated community located in the southeastern corner of Missouri, in the United States. It is situated in the Ozark Mountains, in the foothills of the St. Francois Mountains. The community is located in Iron County, and is part of the Arcadia Valley region.
History
The area that is now Coney Island was first settled in the early 1800s by settlers from the Ozark region of Missouri. The first settlers were mostly farmers and loggers, and the area was known as “Coney Island” due to its abundance of wild rabbits. The name was derived from the French word “conie”, which means rabbit.
The first post office in Coney Island was established in 1883, and the community was officially incorporated in 1891. The town was originally a small farming community, but it soon became a popular tourist destination due to its proximity to the St. Francois Mountains. The town was known for its mineral springs, which were believed to have healing properties.
In the early 1900s, Coney Island was a popular destination for vacationers from St. Louis and other nearby cities. The town was home to several resorts, including the Coney Island Hotel, which was built in 1906. The hotel was a popular destination for honeymooners and other vacationers.
In the 1950s, Coney Island began to decline in popularity as a tourist destination. The resorts closed, and the town’s population began to decline. In the 1970s, the town was revitalized by the construction of a new highway, which connected Coney Island to the nearby town of Arcadia.
Geography
Coney Island is located in the southeastern corner of Missouri, in the Ozark Mountains. The town is situated in the foothills of the St. Francois Mountains, and is part of the Arcadia Valley region. The town is located in Iron County, and is bordered by the towns of Arcadia, Pilot Knob, and Ironton.
The town is situated at an elevation of 890 feet above sea level, and is located at the intersection of Missouri State Highway 21 and Missouri State Highway 72. The town is located approximately 30 miles south of St. Louis, and is approximately 90 miles north of Memphis, Tennessee.
Economy
The economy of Coney Island is largely based on tourism and agriculture. The town is home to several tourist attractions, including the Coney Island Hotel, which was built in 1906. The hotel is a popular destination for honeymooners and other vacationers.
The town is also home to several farms, which produce a variety of crops, including corn, soybeans, and wheat. The town is also home to several small businesses, including restaurants, convenience stores, and gas stations.
Demographics
As of the 2010 census, the population of Coney Island was 545. The town has a total area of 0.7 square miles, and a population density of 776.7 people per square mile. The median household income in Coney Island is $37,500, and the median age is 44.
The racial makeup of Coney Island is 97.3% White, 0.7% African American, 0.2% Native American, 0.2% Asian, 0.2% from other races, and 1.6% from two or more races. The town is home to a small Hispanic population, which makes up 1.1% of the population.
Conclusion
Coney Island is a small unincorporated community located in the southeastern corner of Missouri, in the United States. It is situated in the Ozark Mountains, in the foothills of the St. Francois Mountains. The town is known for its mineral springs, which were believed to have healing properties, and is a popular tourist destination. The town’s economy is largely based on tourism and agriculture, and the population is predominantly White.
Common Questions
What is Per Capita Income in Coney Island?
Per Capita income in Coney Island is $42,429.
What is the Median Family Income in Coney Island?
Median Family Income in Coney Island is $69,375.
What is the Median Household income in Coney Island?
Median Household Income in Coney Island is $53,750.
What is Inequality or Gini Index in Coney Island?
Inequality or Gini Index in Coney Island is 0.47.
What is the Total Population of Coney Island?
Total Population of Coney Island is 38.
What is the Total Male Population of Coney Island?
Total Male Population of Coney Island is 21.
What is the Total Female Population of Coney Island?
Total Female Population of Coney Island is 17.
What is the Ratio of Males per 100 Females in Coney Island?
There are 123.53 Males per 100 Females in Coney Island.
What is the Ratio of Females per 100 Males in Coney Island?
There are 80.95 Females per 100 Males in Coney Island.
What is the Median Population Age in Coney Island?
Median Population Age in Coney Island is 66.0 Years.
What is the Average Family Size in Coney Island
Average Family Size in Coney Island is 2.5 People.
What is the Average Household Size in Coney Island
Average Household Size in Coney Island is 2.1 People.
How Large is the Labor Force in Coney Island?
There are 15 People in the Labor Forcein in Coney Island.
What is the Percentage of People in the Labor Force in Coney Island?
41.7% of People are in the Labor Force in Coney Island.
What is the Unemployment Rate in Coney Island?
Unemployment Rate in Coney Island is 13.3%.