Lee s Summit, MO Map & Demographics
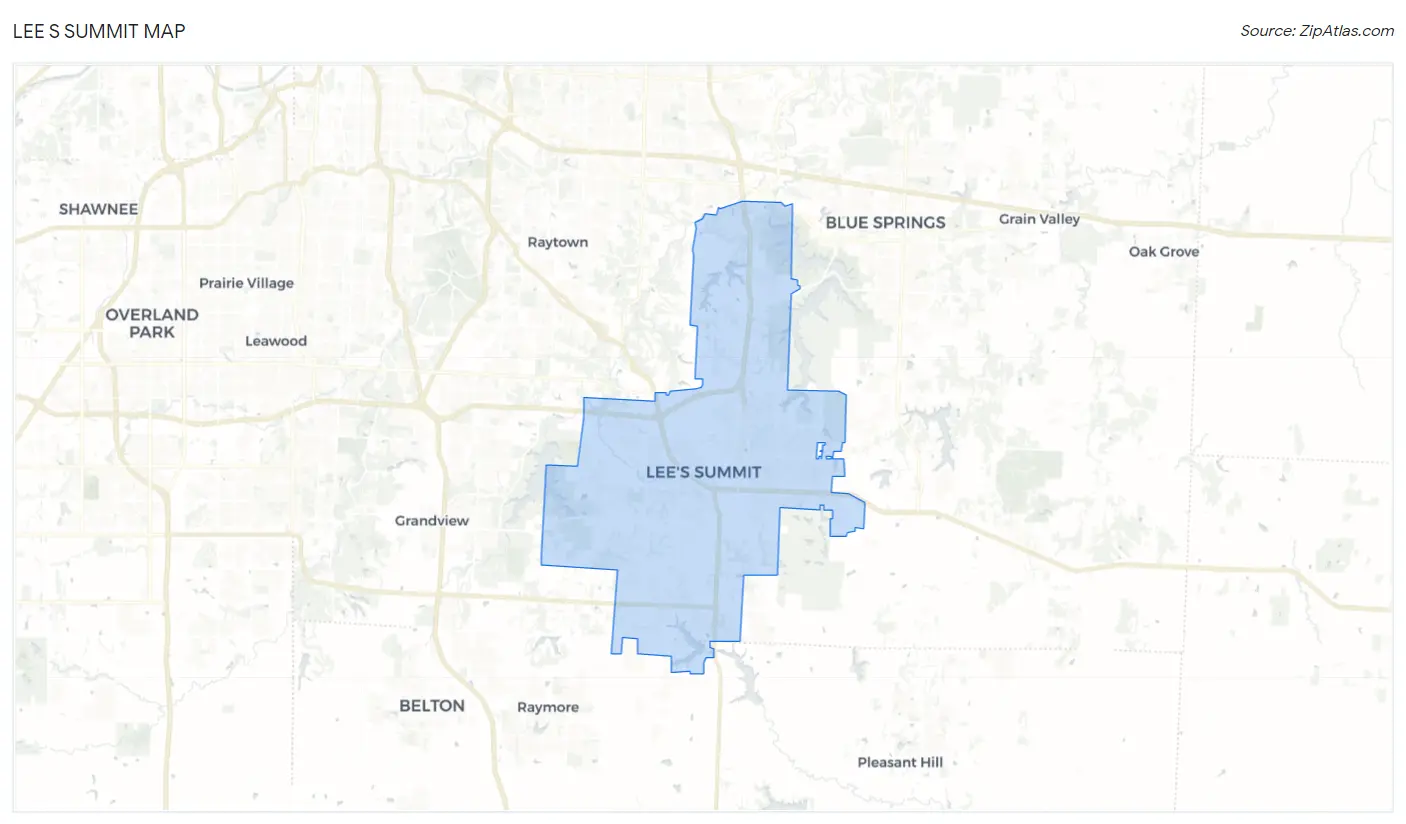
Lee s Summit Map
Lee s Summit Overview
$47,879
PER CAPITA INCOME
$122,705
AVG FAMILY INCOME
$103,447
AVG HOUSEHOLD INCOME
29.2%
WAGE / INCOME GAP [ % ]
70.8¢/ $1
WAGE / INCOME GAP [ $ ]
0.40
INEQUALITY / GINI INDEX
101,728
TOTAL POPULATION
49,523
MALE POPULATION
52,205
FEMALE POPULATION
94.86
MALES / 100 FEMALES
105.42
FEMALES / 100 MALES
38.6
MEDIAN AGE
3.1
AVG FAMILY SIZE
2.6
AVG HOUSEHOLD SIZE
55,748
LABOR FORCE [ PEOPLE ]
70.4%
PERCENT IN LABOR FORCE
3.8%
UNEMPLOYMENT RATE
Income in Lee s Summit
Income Overview in Lee s Summit
Per Capita Income in Lee s Summit is $47,879, while median incomes of families and households are $122,705 and $103,447 respectively.
| Characteristic | Number | Measure |
| Per Capita Income | 101,728 | $47,879 |
| Median Family Income | 27,913 | $122,705 |
| Mean Family Income | 27,913 | $145,089 |
| Median Household Income | 38,919 | $103,447 |
| Mean Household Income | 38,919 | $124,333 |
| Income Deficit | 27,913 | $0 |
| Wage / Income Gap (%) | 101,728 | 29.15% |
| Wage / Income Gap ($) | 101,728 | 70.85¢ per $1 |
| Gini / Inequality Index | 101,728 | 0.40 |
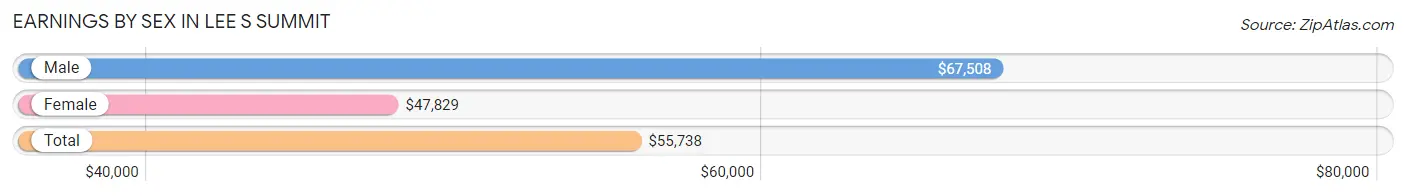
Earnings by Sex in Lee s Summit
Average Earnings in Lee s Summit are $55,738, $67,508 for men and $47,829 for women, a difference of 29.1%.
| Sex | Number | Average Earnings |
| Male | 29,924 (51.6%) | $67,508 |
| Female | 28,099 (48.4%) | $47,829 |
| Total | 58,023 (100.0%) | $55,738 |
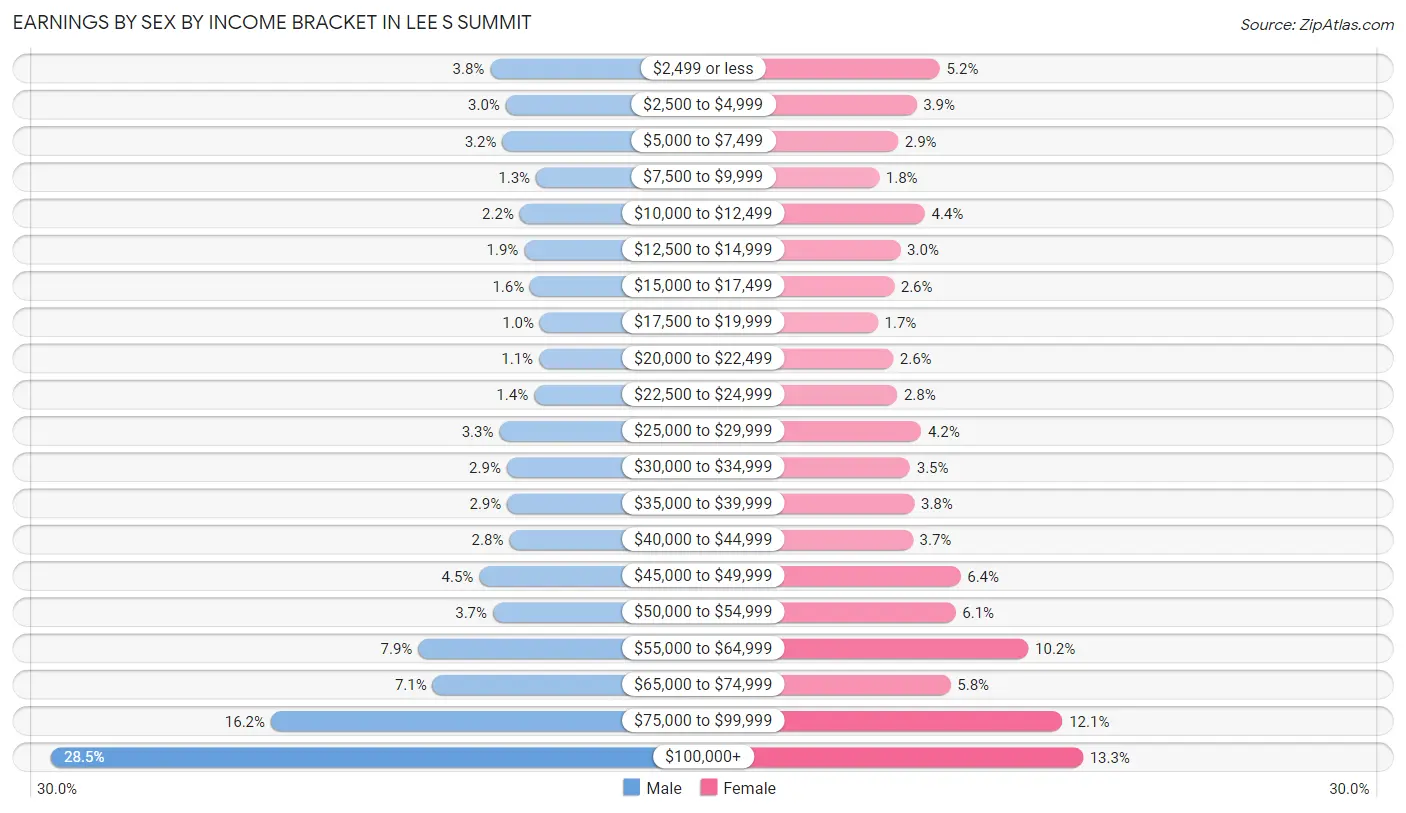
Earnings by Sex by Income Bracket in Lee s Summit
The most common earnings brackets in Lee s Summit are $100,000+ for men (8,531 | 28.5%) and $100,000+ for women (3,725 | 13.3%).
| Income | Male | Female |
| $2,499 or less | 1,146 (3.8%) | 1,467 (5.2%) |
| $2,500 to $4,999 | 885 (3.0%) | 1,096 (3.9%) |
| $5,000 to $7,499 | 942 (3.2%) | 807 (2.9%) |
| $7,500 to $9,999 | 376 (1.3%) | 507 (1.8%) |
| $10,000 to $12,499 | 650 (2.2%) | 1,227 (4.4%) |
| $12,500 to $14,999 | 576 (1.9%) | 844 (3.0%) |
| $15,000 to $17,499 | 475 (1.6%) | 743 (2.6%) |
| $17,500 to $19,999 | 312 (1.0%) | 485 (1.7%) |
| $20,000 to $22,499 | 326 (1.1%) | 729 (2.6%) |
| $22,500 to $24,999 | 409 (1.4%) | 792 (2.8%) |
| $25,000 to $29,999 | 992 (3.3%) | 1,172 (4.2%) |
| $30,000 to $34,999 | 869 (2.9%) | 994 (3.5%) |
| $35,000 to $39,999 | 862 (2.9%) | 1,062 (3.8%) |
| $40,000 to $44,999 | 827 (2.8%) | 1,040 (3.7%) |
| $45,000 to $49,999 | 1,333 (4.4%) | 1,793 (6.4%) |
| $50,000 to $54,999 | 1,102 (3.7%) | 1,715 (6.1%) |
| $55,000 to $64,999 | 2,357 (7.9%) | 2,863 (10.2%) |
| $65,000 to $74,999 | 2,117 (7.1%) | 1,636 (5.8%) |
| $75,000 to $99,999 | 4,837 (16.2%) | 3,402 (12.1%) |
| $100,000+ | 8,531 (28.5%) | 3,725 (13.3%) |
| Total | 29,924 (100.0%) | 28,099 (100.0%) |
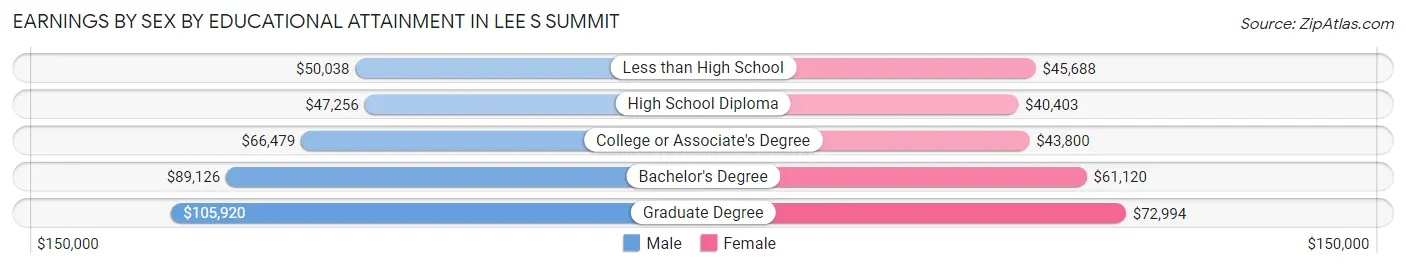
Earnings by Sex by Educational Attainment in Lee s Summit
Average earnings in Lee s Summit are $76,993 for men and $53,505 for women, a difference of 30.5%. Men with an educational attainment of graduate degree enjoy the highest average annual earnings of $105,920, while those with high school diploma education earn the least with $47,256. Women with an educational attainment of graduate degree earn the most with the average annual earnings of $72,994, while those with high school diploma education have the smallest earnings of $40,403.
| Educational Attainment | Male Income | Female Income |
| Less than High School | $50,038 | $45,688 |
| High School Diploma | $47,256 | $40,403 |
| College or Associate's Degree | $66,479 | $43,800 |
| Bachelor's Degree | $89,126 | $61,120 |
| Graduate Degree | $105,920 | $72,994 |
| Total | $76,993 | $53,505 |
Family Income in Lee s Summit
Family Income Brackets in Lee s Summit
According to the Lee s Summit family income data, there are 7,006 families falling into the $100,000 to $149,999 income range, which is the most common income bracket and makes up 25.1% of all families. Conversely, the $10,000 to $14,999 income bracket is the least frequent group with only 112 families (0.4%) belonging to this category.
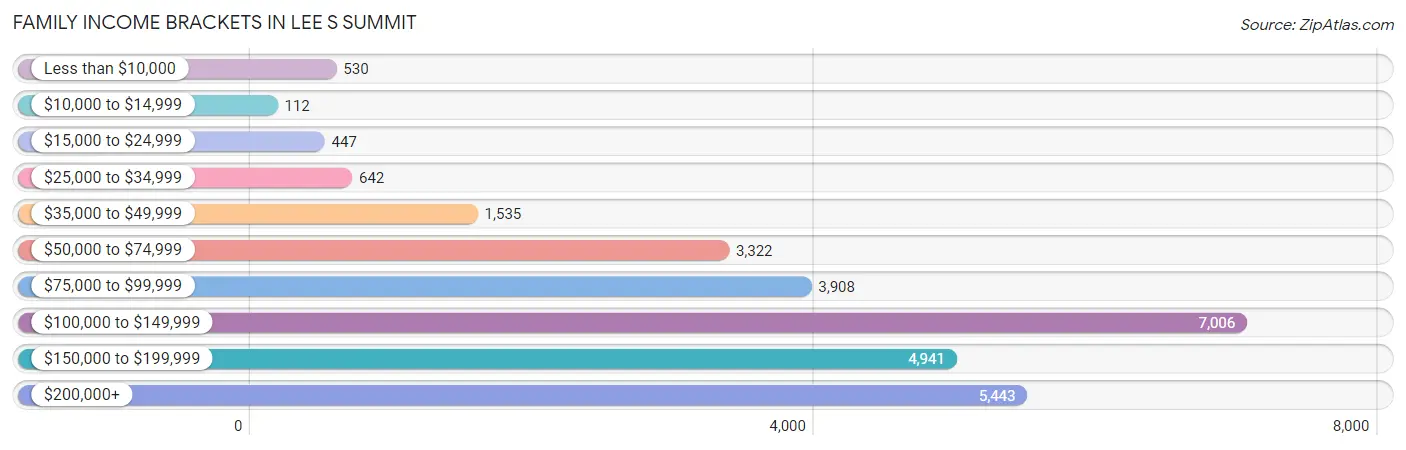
| Income Bracket | # Families | % Families |
| Less than $10,000 | 530 | 1.9% |
| $10,000 to $14,999 | 112 | 0.4% |
| $15,000 to $24,999 | 447 | 1.6% |
| $25,000 to $34,999 | 642 | 2.3% |
| $35,000 to $49,999 | 1,535 | 5.5% |
| $50,000 to $74,999 | 3,322 | 11.9% |
| $75,000 to $99,999 | 3,908 | 14.0% |
| $100,000 to $149,999 | 7,006 | 25.1% |
| $150,000 to $199,999 | 4,941 | 17.7% |
| $200,000+ | 5,443 | 19.5% |
Family Income by Famaliy Size in Lee s Summit
5-person families (2,249 | 8.1%) account for the highest median family income in Lee s Summit with $156,422 per family, while 2-person families (12,922 | 46.3%) have the highest median income of $50,424 per family member.
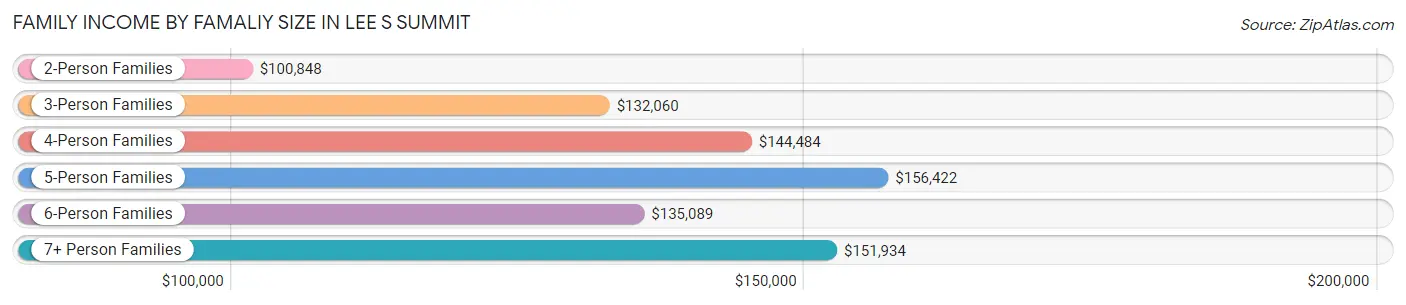
| Income Bracket | # Families | Median Income |
| 2-Person Families | 12,922 (46.3%) | $100,848 |
| 3-Person Families | 6,213 (22.3%) | $132,060 |
| 4-Person Families | 5,365 (19.2%) | $144,484 |
| 5-Person Families | 2,249 (8.1%) | $156,422 |
| 6-Person Families | 827 (3.0%) | $135,089 |
| 7+ Person Families | 337 (1.2%) | $151,934 |
| Total | 27,913 (100.0%) | $122,705 |
Family Income by Number of Earners in Lee s Summit
The median family income in Lee s Summit is $122,705, with families comprising 3+ earners (4,015) having the highest median family income of $177,023, while families with no earners (3,398) have the lowest median family income of $73,690, accounting for 14.4% and 12.2% of families, respectively.
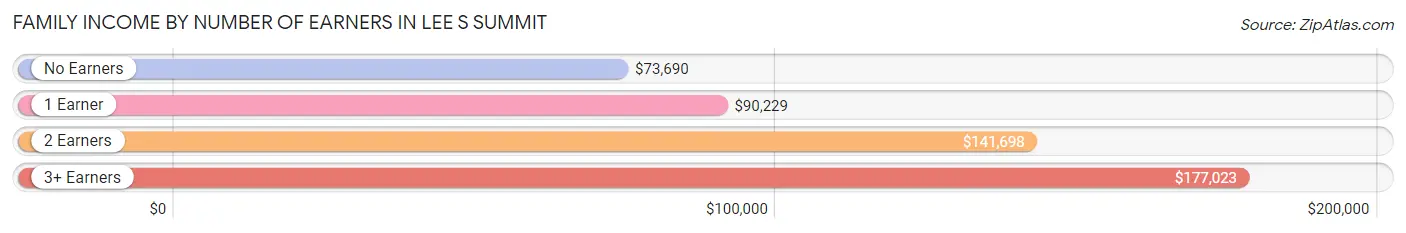
| Number of Earners | # Families | Median Income |
| No Earners | 3,398 (12.2%) | $73,690 |
| 1 Earner | 7,561 (27.1%) | $90,229 |
| 2 Earners | 12,939 (46.4%) | $141,698 |
| 3+ Earners | 4,015 (14.4%) | $177,023 |
| Total | 27,913 (100.0%) | $122,705 |
Household Income in Lee s Summit
Household Income Brackets in Lee s Summit
With 8,445 households falling in the category, the $100,000 to $149,999 income range is the most frequent in Lee s Summit, accounting for 21.7% of all households. In contrast, only 739 households (1.9%) fall into the $10,000 to $14,999 income bracket, making it the least populous group.
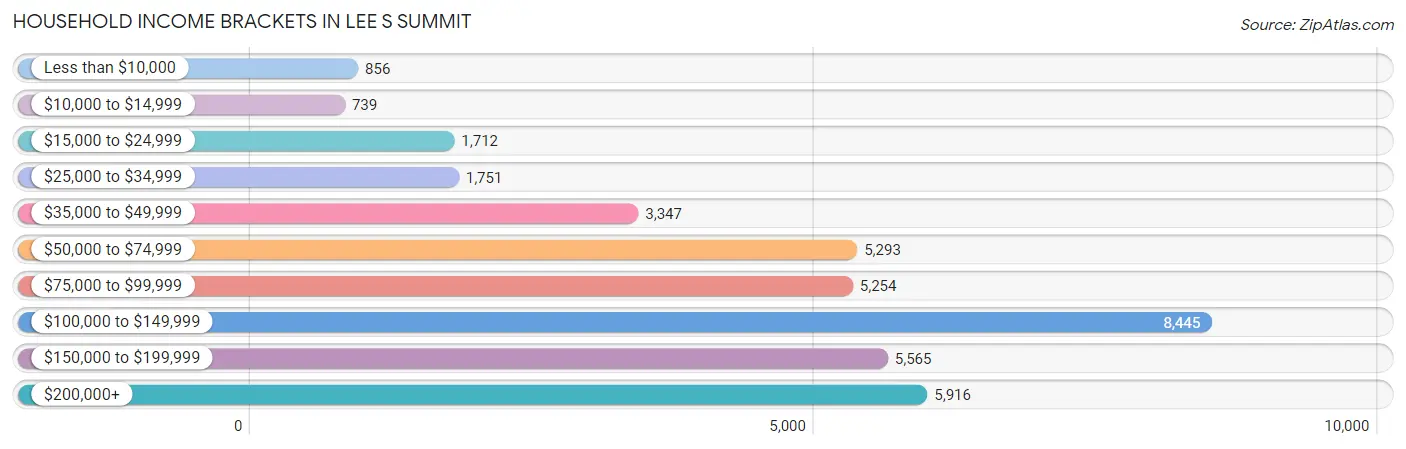
| Income Bracket | # Households | % Households |
| Less than $10,000 | 856 | 2.2% |
| $10,000 to $14,999 | 739 | 1.9% |
| $15,000 to $24,999 | 1,712 | 4.4% |
| $25,000 to $34,999 | 1,751 | 4.5% |
| $35,000 to $49,999 | 3,347 | 8.6% |
| $50,000 to $74,999 | 5,293 | 13.6% |
| $75,000 to $99,999 | 5,254 | 13.5% |
| $100,000 to $149,999 | 8,445 | 21.7% |
| $150,000 to $199,999 | 5,565 | 14.3% |
| $200,000+ | 5,916 | 15.2% |
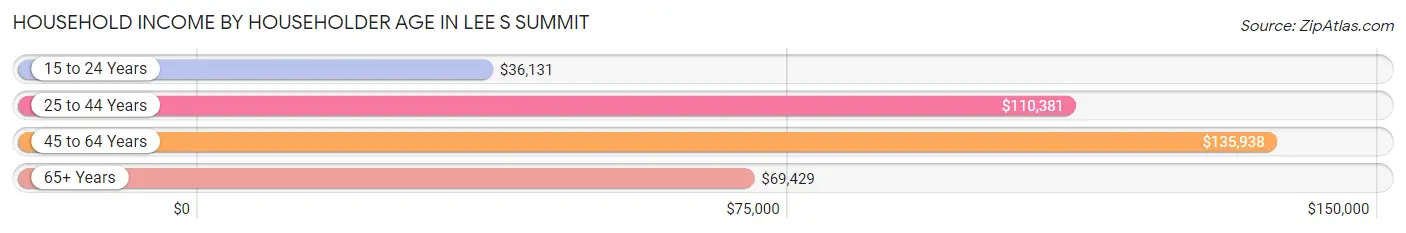
Household Income by Householder Age in Lee s Summit
The median household income in Lee s Summit is $103,447, with the highest median household income of $135,938 found in the 45 to 64 years age bracket for the primary householder. A total of 14,930 households (38.4%) fall into this category. Meanwhile, the 15 to 24 years age bracket for the primary householder has the lowest median household income of $36,131, with 1,068 households (2.7%) in this group.
| Income Bracket | # Households | Median Income |
| 15 to 24 Years | 1,068 (2.7%) | $36,131 |
| 25 to 44 Years | 13,716 (35.2%) | $110,381 |
| 45 to 64 Years | 14,930 (38.4%) | $135,938 |
| 65+ Years | 9,205 (23.6%) | $69,429 |
| Total | 38,919 (100.0%) | $103,447 |
Poverty in Lee s Summit
Income Below Poverty by Sex and Age in Lee s Summit
With 5.1% poverty level for males and 5.5% for females among the residents of Lee s Summit, 15 year old males and under 5 year old females are the most vulnerable to poverty, with 79 males (9.9%) and 412 females (14.5%) in their respective age groups living below the poverty level.
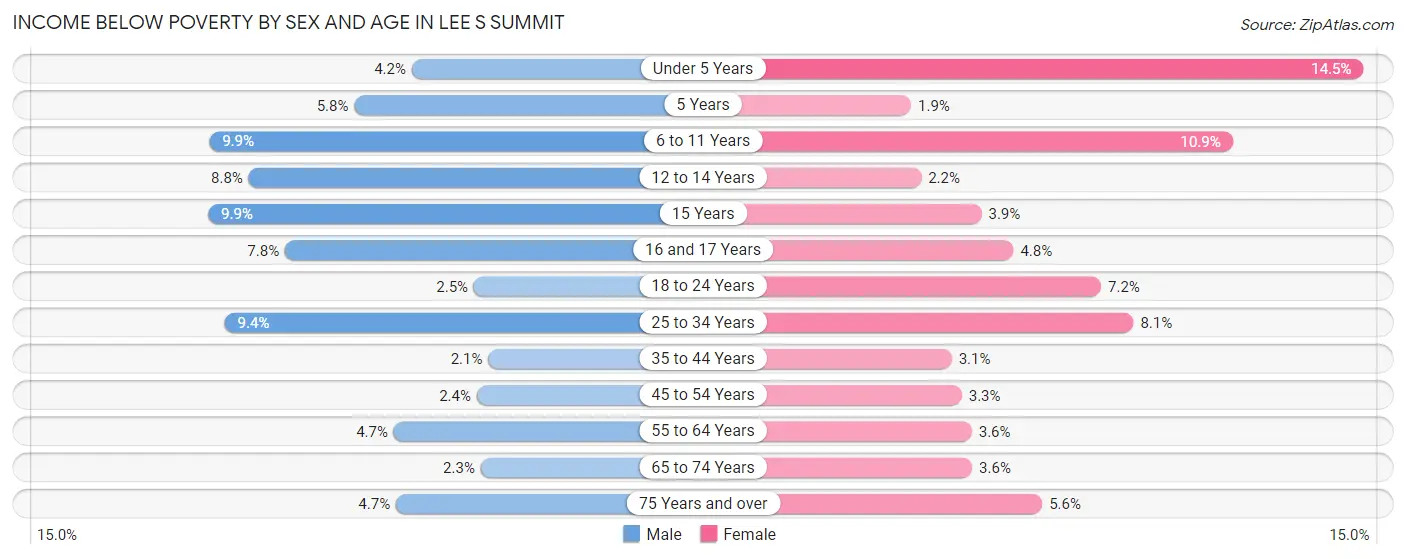
| Age Bracket | Male | Female |
| Under 5 Years | 115 (4.2%) | 412 (14.5%) |
| 5 Years | 33 (5.8%) | 16 (1.9%) |
| 6 to 11 Years | 428 (9.9%) | 439 (10.9%) |
| 12 to 14 Years | 232 (8.8%) | 57 (2.2%) |
| 15 Years | 79 (9.9%) | 29 (3.9%) |
| 16 and 17 Years | 158 (7.7%) | 72 (4.8%) |
| 18 to 24 Years | 84 (2.5%) | 269 (7.2%) |
| 25 to 34 Years | 541 (9.4%) | 473 (8.1%) |
| 35 to 44 Years | 151 (2.1%) | 243 (3.1%) |
| 45 to 54 Years | 161 (2.4%) | 212 (3.3%) |
| 55 to 64 Years | 295 (4.7%) | 253 (3.6%) |
| 65 to 74 Years | 94 (2.3%) | 164 (3.6%) |
| 75 Years and over | 124 (4.7%) | 210 (5.6%) |
| Total | 2,495 (5.1%) | 2,849 (5.5%) |
Income Above Poverty by Sex and Age in Lee s Summit
According to the poverty statistics in Lee s Summit, males aged 35 to 44 years and females aged 5 years are the age groups that are most secure financially, with 97.9% of males and 98.1% of females in these age groups living above the poverty line.
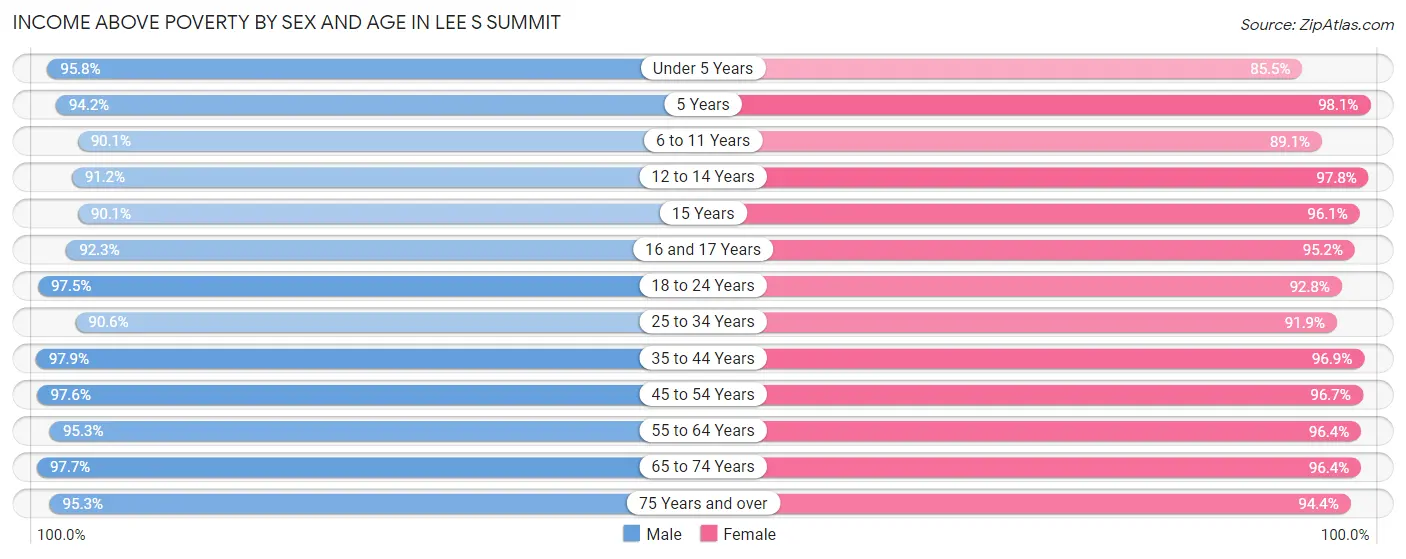
| Age Bracket | Male | Female |
| Under 5 Years | 2,607 (95.8%) | 2,426 (85.5%) |
| 5 Years | 534 (94.2%) | 814 (98.1%) |
| 6 to 11 Years | 3,914 (90.1%) | 3,595 (89.1%) |
| 12 to 14 Years | 2,416 (91.2%) | 2,521 (97.8%) |
| 15 Years | 720 (90.1%) | 716 (96.1%) |
| 16 and 17 Years | 1,881 (92.2%) | 1,435 (95.2%) |
| 18 to 24 Years | 3,284 (97.5%) | 3,457 (92.8%) |
| 25 to 34 Years | 5,193 (90.6%) | 5,350 (91.9%) |
| 35 to 44 Years | 7,088 (97.9%) | 7,692 (96.9%) |
| 45 to 54 Years | 6,519 (97.6%) | 6,144 (96.7%) |
| 55 to 64 Years | 5,954 (95.3%) | 6,733 (96.4%) |
| 65 to 74 Years | 3,993 (97.7%) | 4,358 (96.4%) |
| 75 Years and over | 2,536 (95.3%) | 3,552 (94.4%) |
| Total | 46,639 (94.9%) | 48,793 (94.5%) |
Income Below Poverty Among Married-Couple Families in Lee s Summit
The poverty statistics for married-couple families in Lee s Summit show that 1.2% or 270 of the total 22,356 families live below the poverty line. Families with 5 or more children have the highest poverty rate of 60.4%, comprising of 32 families. On the other hand, families with 1 or 2 children have the lowest poverty rate of 0.2%, which includes 14 families.
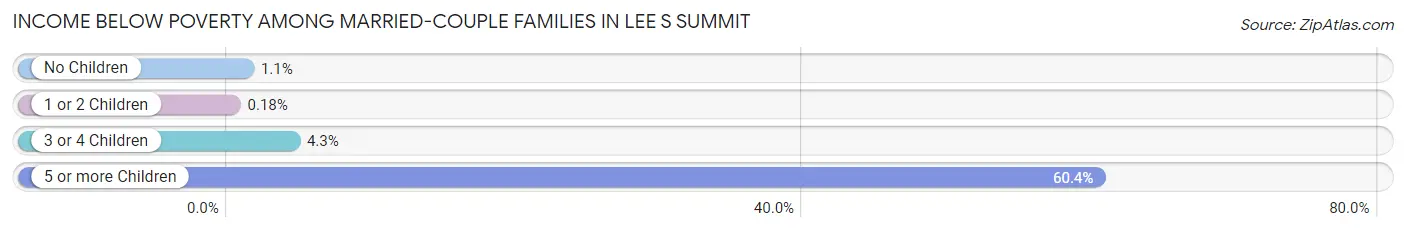
| Children | Above Poverty | Below Poverty |
| No Children | 12,206 (98.9%) | 137 (1.1%) |
| 1 or 2 Children | 7,926 (99.8%) | 14 (0.2%) |
| 3 or 4 Children | 1,933 (95.7%) | 87 (4.3%) |
| 5 or more Children | 21 (39.6%) | 32 (60.4%) |
| Total | 22,086 (98.8%) | 270 (1.2%) |
Income Below Poverty Among Single-Parent Households in Lee s Summit
According to the poverty data in Lee s Summit, 2.1% or 33 single-father households and 15.6% or 622 single-mother households are living below the poverty line. Among single-father households, those with 1 or 2 children have the highest poverty rate, with 33 households (3.5%) experiencing poverty. Likewise, among single-mother households, those with 3 or 4 children have the highest poverty rate, with 178 households (45.0%) falling below the poverty line.
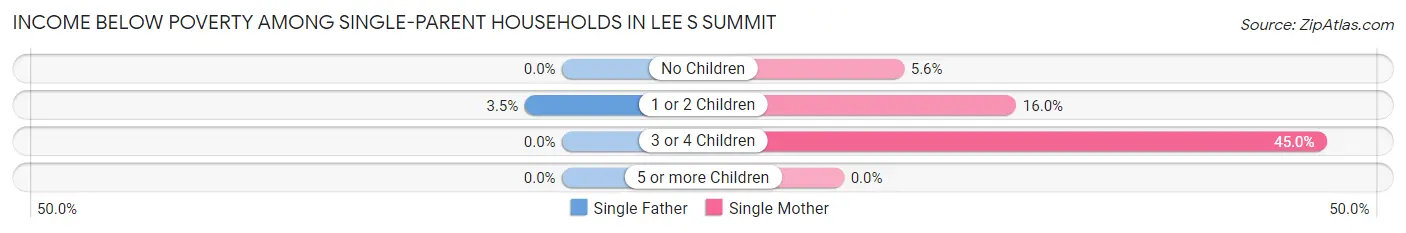
| Children | Single Father | Single Mother |
| No Children | 0 (0.0%) | 70 (5.6%) |
| 1 or 2 Children | 33 (3.5%) | 374 (16.0%) |
| 3 or 4 Children | 0 (0.0%) | 178 (45.0%) |
| 5 or more Children | 0 (0.0%) | 0 (0.0%) |
| Total | 33 (2.1%) | 622 (15.6%) |
Income Below Poverty Among Married-Couple vs Single-Parent Households in Lee s Summit
The poverty data for Lee s Summit shows that 270 of the married-couple family households (1.2%) and 655 of the single-parent households (11.8%) are living below the poverty level. Within the married-couple family households, those with 5 or more children have the highest poverty rate, with 32 households (60.4%) falling below the poverty line. Among the single-parent households, those with 3 or 4 children have the highest poverty rate, with 178 household (31.7%) living below poverty.
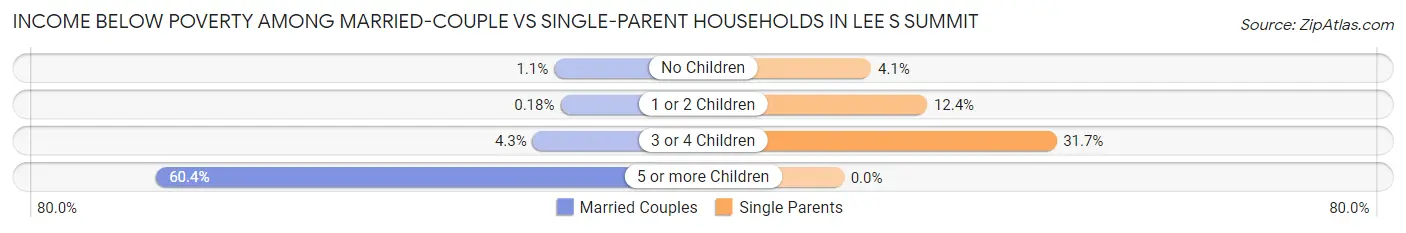
| Children | Married-Couple Families | Single-Parent Households |
| No Children | 137 (1.1%) | 70 (4.1%) |
| 1 or 2 Children | 14 (0.2%) | 407 (12.4%) |
| 3 or 4 Children | 87 (4.3%) | 178 (31.7%) |
| 5 or more Children | 32 (60.4%) | 0 (0.0%) |
| Total | 270 (1.2%) | 655 (11.8%) |
Race in Lee s Summit
The most populous races in Lee s Summit are White / Caucasian (82,332 | 80.9%), Black / African American (9,103 | 8.9%), and Two or more Races (6,138 | 6.0%).
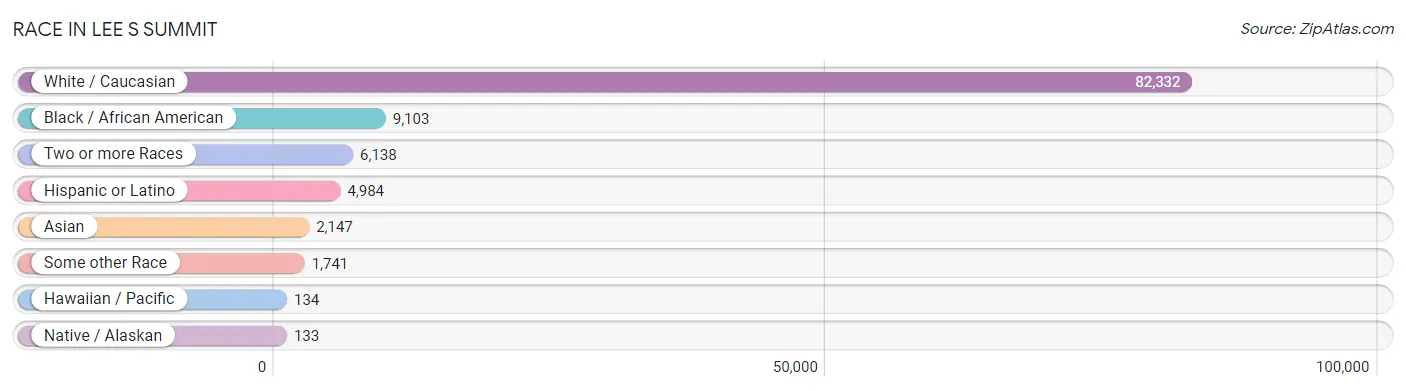
| Race | # Population | % Population |
| Asian | 2,147 | 2.1% |
| Black / African American | 9,103 | 8.9% |
| Hawaiian / Pacific | 134 | 0.1% |
| Hispanic or Latino | 4,984 | 4.9% |
| Native / Alaskan | 133 | 0.1% |
| White / Caucasian | 82,332 | 80.9% |
| Two or more Races | 6,138 | 6.0% |
| Some other Race | 1,741 | 1.7% |
| Total | 101,728 | 100.0% |
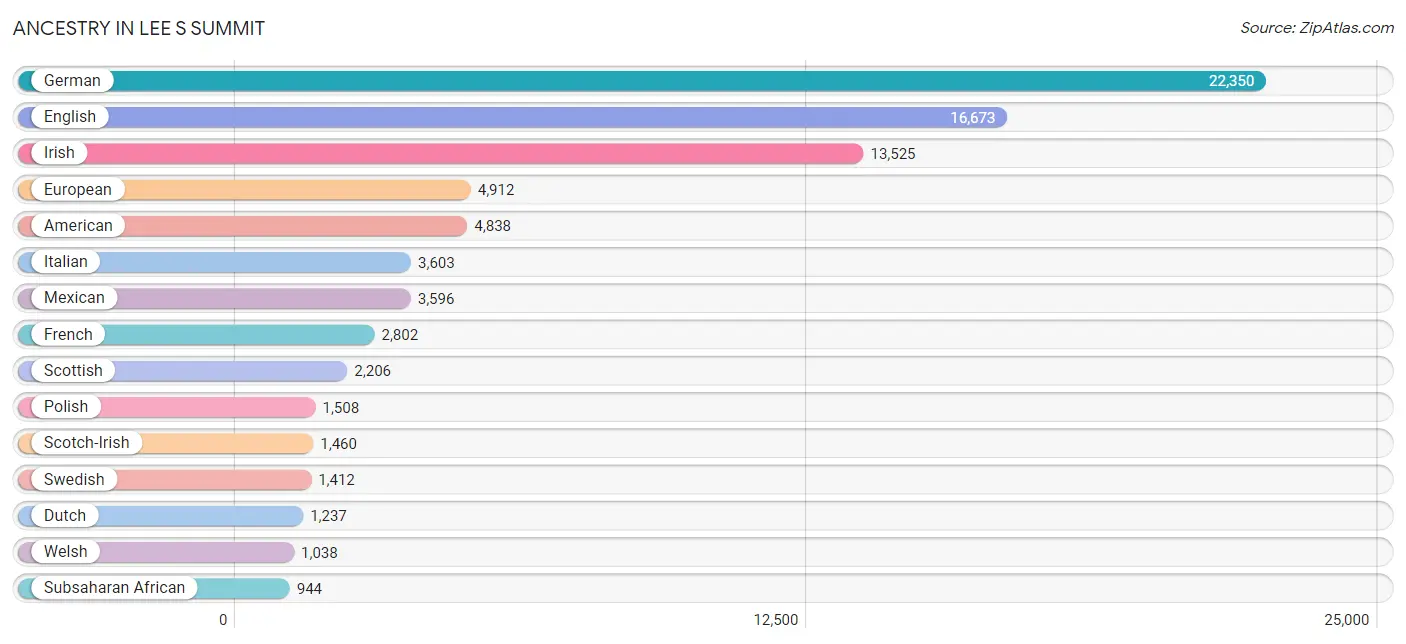
Ancestry in Lee s Summit
The most populous ancestries reported in Lee s Summit are German (22,350 | 22.0%), English (16,673 | 16.4%), Irish (13,525 | 13.3%), European (4,912 | 4.8%), and American (4,838 | 4.8%), together accounting for 61.2% of all Lee s Summit residents.
| Ancestry | # Population | % Population |
| African | 591 | 0.6% |
| American | 4,838 | 4.8% |
| Arab | 860 | 0.9% |
| Armenian | 74 | 0.1% |
| Austrian | 182 | 0.2% |
| Bangladeshi | 23 | 0.0% |
| Belgian | 63 | 0.1% |
| Bhutanese | 361 | 0.4% |
| Brazilian | 34 | 0.0% |
| British | 801 | 0.8% |
| Bulgarian | 17 | 0.0% |
| Burmese | 462 | 0.4% |
| Canadian | 38 | 0.0% |
| Central American | 245 | 0.2% |
| Cherokee | 588 | 0.6% |
| Cheyenne | 5 | 0.0% |
| Chickasaw | 38 | 0.0% |
| Chilean | 41 | 0.0% |
| Chippewa | 60 | 0.1% |
| Choctaw | 114 | 0.1% |
| Colombian | 121 | 0.1% |
| Croatian | 153 | 0.2% |
| Cuban | 56 | 0.1% |
| Czech | 448 | 0.4% |
| Czechoslovakian | 54 | 0.1% |
| Danish | 386 | 0.4% |
| Dominican | 42 | 0.0% |
| Dutch | 1,237 | 1.2% |
| Eastern European | 473 | 0.5% |
| Ecuadorian | 36 | 0.0% |
| Egyptian | 80 | 0.1% |
| English | 16,673 | 16.4% |
| Ethiopian | 50 | 0.1% |
| European | 4,912 | 4.8% |
| Filipino | 35 | 0.0% |
| Finnish | 71 | 0.1% |
| French | 2,802 | 2.8% |
| French American Indian | 8 | 0.0% |
| French Canadian | 259 | 0.3% |
| German | 22,350 | 22.0% |
| Greek | 175 | 0.2% |
| Guamanian / Chamorro | 101 | 0.1% |
| Guatemalan | 57 | 0.1% |
| Honduran | 26 | 0.0% |
| Hungarian | 156 | 0.2% |
| Icelander | 8 | 0.0% |
| Indian (Asian) | 369 | 0.4% |
| Indonesian | 105 | 0.1% |
| Iranian | 6 | 0.0% |
| Iraqi | 93 | 0.1% |
| Irish | 13,525 | 13.3% |
| Israeli | 16 | 0.0% |
| Italian | 3,603 | 3.5% |
| Jamaican | 17 | 0.0% |
| Jordanian | 38 | 0.0% |
| Kenyan | 25 | 0.0% |
| Korean | 752 | 0.7% |
| Latvian | 11 | 0.0% |
| Lebanese | 259 | 0.3% |
| Lithuanian | 116 | 0.1% |
| Luxembourger | 19 | 0.0% |
| Mexican | 3,596 | 3.5% |
| Mongolian | 23 | 0.0% |
| Native Hawaiian | 45 | 0.0% |
| Navajo | 13 | 0.0% |
| Nigerian | 258 | 0.3% |
| Northern European | 91 | 0.1% |
| Norwegian | 818 | 0.8% |
| Paiute | 1 | 0.0% |
| Pakistani | 30 | 0.0% |
| Palestinian | 384 | 0.4% |
| Panamanian | 12 | 0.0% |
| Pennsylvania German | 16 | 0.0% |
| Pima | 15 | 0.0% |
| Polish | 1,508 | 1.5% |
| Portuguese | 11 | 0.0% |
| Potawatomi | 5 | 0.0% |
| Pueblo | 6 | 0.0% |
| Puerto Rican | 126 | 0.1% |
| Russian | 365 | 0.4% |
| Salvadoran | 150 | 0.2% |
| Scandinavian | 250 | 0.3% |
| Scotch-Irish | 1,460 | 1.4% |
| Scottish | 2,206 | 2.2% |
| Serbian | 14 | 0.0% |
| Sioux | 35 | 0.0% |
| Slavic | 95 | 0.1% |
| Slovak | 56 | 0.1% |
| Slovene | 28 | 0.0% |
| South American | 250 | 0.3% |
| Spaniard | 82 | 0.1% |
| Spanish | 427 | 0.4% |
| Sri Lankan | 545 | 0.5% |
| Subsaharan African | 944 | 0.9% |
| Swedish | 1,412 | 1.4% |
| Swiss | 256 | 0.3% |
| Thai | 623 | 0.6% |
| Turkish | 18 | 0.0% |
| Ukrainian | 151 | 0.2% |
| Venezuelan | 52 | 0.1% |
| Vietnamese | 20 | 0.0% |
| Welsh | 1,038 | 1.0% |
| Yugoslavian | 29 | 0.0% | View All 103 Rows |
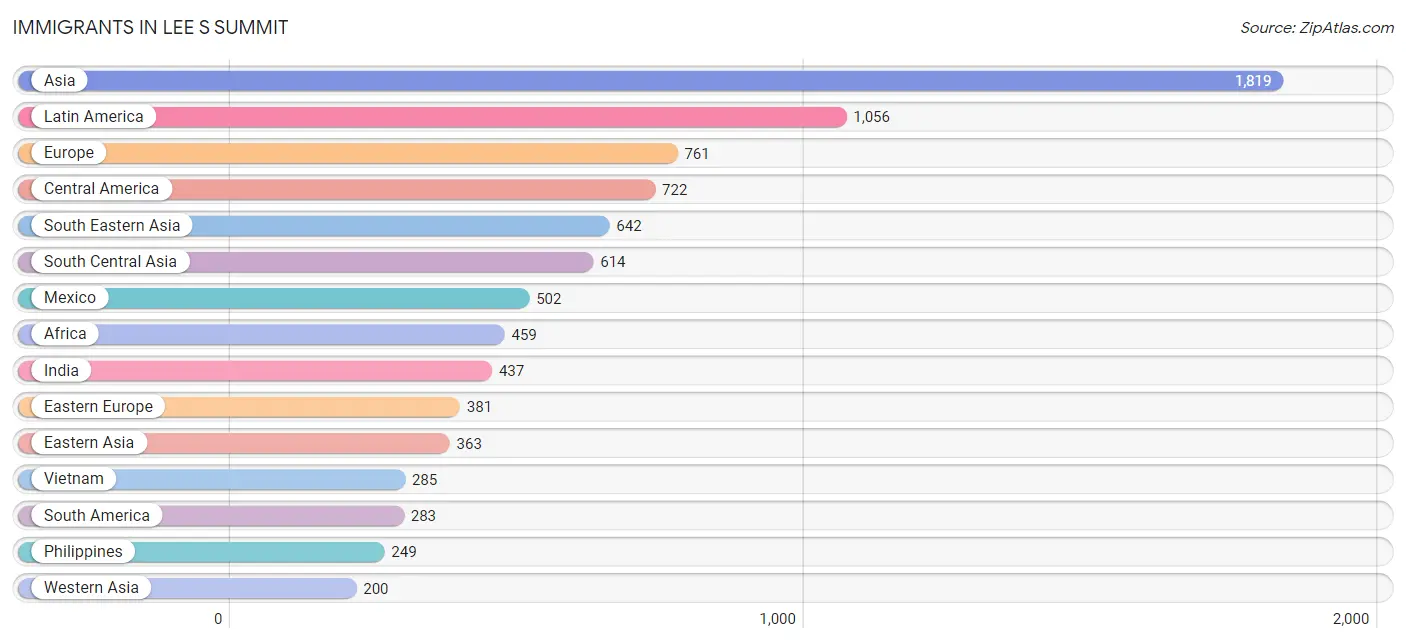
Immigrants in Lee s Summit
The most numerous immigrant groups reported in Lee s Summit came from Asia (1,819 | 1.8%), Latin America (1,056 | 1.0%), Europe (761 | 0.7%), Central America (722 | 0.7%), and South Eastern Asia (642 | 0.6%), together accounting for 4.9% of all Lee s Summit residents.
| Immigration Origin | # Population | % Population |
| Africa | 459 | 0.4% |
| Asia | 1,819 | 1.8% |
| Australia | 30 | 0.0% |
| Austria | 11 | 0.0% |
| Bangladesh | 20 | 0.0% |
| Bosnia and Herzegovina | 173 | 0.2% |
| Brazil | 23 | 0.0% |
| Bulgaria | 17 | 0.0% |
| Cameroon | 30 | 0.0% |
| Canada | 158 | 0.2% |
| Caribbean | 51 | 0.1% |
| Central America | 722 | 0.7% |
| Chile | 50 | 0.1% |
| China | 193 | 0.2% |
| Colombia | 127 | 0.1% |
| Croatia | 11 | 0.0% |
| Czechoslovakia | 33 | 0.0% |
| Dominican Republic | 42 | 0.0% |
| Eastern Africa | 182 | 0.2% |
| Eastern Asia | 363 | 0.4% |
| Eastern Europe | 381 | 0.4% |
| Ecuador | 31 | 0.0% |
| Egypt | 23 | 0.0% |
| El Salvador | 101 | 0.1% |
| England | 39 | 0.0% |
| Ethiopia | 49 | 0.1% |
| Europe | 761 | 0.7% |
| Germany | 105 | 0.1% |
| Greece | 7 | 0.0% |
| Guatemala | 47 | 0.1% |
| Honduras | 26 | 0.0% |
| India | 437 | 0.4% |
| Iraq | 93 | 0.1% |
| Ireland | 36 | 0.0% |
| Italy | 65 | 0.1% |
| Jamaica | 9 | 0.0% |
| Japan | 5 | 0.0% |
| Jordan | 10 | 0.0% |
| Kenya | 133 | 0.1% |
| Korea | 165 | 0.2% |
| Kuwait | 27 | 0.0% |
| Latin America | 1,056 | 1.0% |
| Lithuania | 18 | 0.0% |
| Malaysia | 35 | 0.0% |
| Mexico | 502 | 0.5% |
| Middle Africa | 30 | 0.0% |
| Netherlands | 27 | 0.0% |
| Nigeria | 126 | 0.1% |
| Northern Africa | 23 | 0.0% |
| Northern Europe | 165 | 0.2% |
| Oceania | 109 | 0.1% |
| Pakistan | 157 | 0.2% |
| Panama | 21 | 0.0% |
| Philippines | 249 | 0.2% |
| Russia | 15 | 0.0% |
| Sierra Leone | 39 | 0.0% |
| South America | 283 | 0.3% |
| South Central Asia | 614 | 0.6% |
| South Eastern Asia | 642 | 0.6% |
| Southern Europe | 72 | 0.1% |
| Taiwan | 23 | 0.0% |
| Thailand | 17 | 0.0% |
| Turkey | 18 | 0.0% |
| Ukraine | 66 | 0.1% |
| Venezuela | 52 | 0.1% |
| Vietnam | 285 | 0.3% |
| Western Africa | 165 | 0.2% |
| Western Asia | 200 | 0.2% |
| Western Europe | 143 | 0.1% | View All 69 Rows |
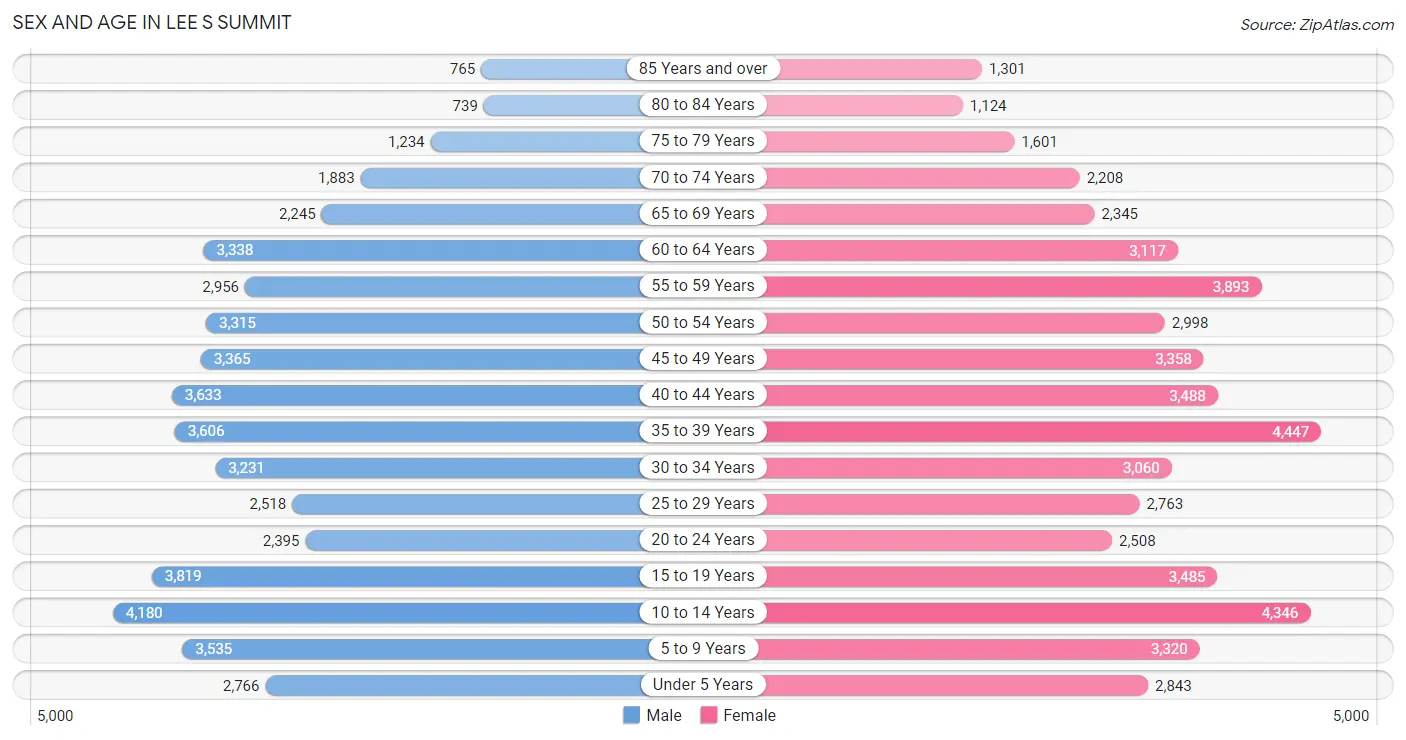
Sex and Age in Lee s Summit
Sex and Age in Lee s Summit
The most populous age groups in Lee s Summit are 10 to 14 Years (4,180 | 8.4%) for men and 35 to 39 Years (4,447 | 8.5%) for women.
| Age Bracket | Male | Female |
| Under 5 Years | 2,766 (5.6%) | 2,843 (5.4%) |
| 5 to 9 Years | 3,535 (7.1%) | 3,320 (6.4%) |
| 10 to 14 Years | 4,180 (8.4%) | 4,346 (8.3%) |
| 15 to 19 Years | 3,819 (7.7%) | 3,485 (6.7%) |
| 20 to 24 Years | 2,395 (4.8%) | 2,508 (4.8%) |
| 25 to 29 Years | 2,518 (5.1%) | 2,763 (5.3%) |
| 30 to 34 Years | 3,231 (6.5%) | 3,060 (5.9%) |
| 35 to 39 Years | 3,606 (7.3%) | 4,447 (8.5%) |
| 40 to 44 Years | 3,633 (7.3%) | 3,488 (6.7%) |
| 45 to 49 Years | 3,365 (6.8%) | 3,358 (6.4%) |
| 50 to 54 Years | 3,315 (6.7%) | 2,998 (5.7%) |
| 55 to 59 Years | 2,956 (6.0%) | 3,893 (7.5%) |
| 60 to 64 Years | 3,338 (6.7%) | 3,117 (6.0%) |
| 65 to 69 Years | 2,245 (4.5%) | 2,345 (4.5%) |
| 70 to 74 Years | 1,883 (3.8%) | 2,208 (4.2%) |
| 75 to 79 Years | 1,234 (2.5%) | 1,601 (3.1%) |
| 80 to 84 Years | 739 (1.5%) | 1,124 (2.1%) |
| 85 Years and over | 765 (1.5%) | 1,301 (2.5%) |
| Total | 49,523 (100.0%) | 52,205 (100.0%) |
Families and Households in Lee s Summit
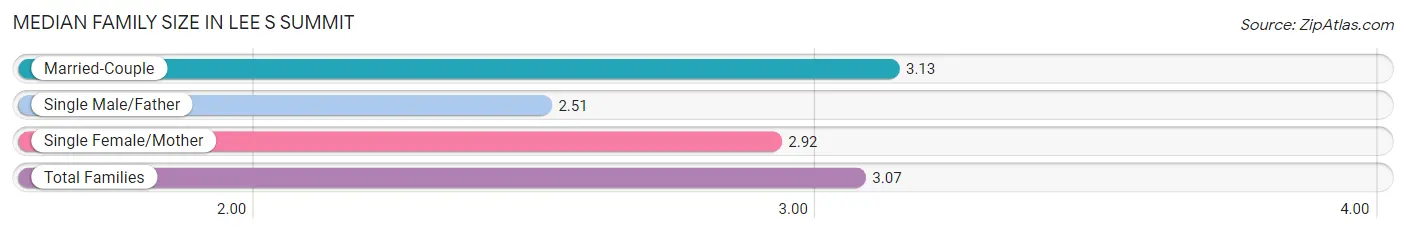
Median Family Size in Lee s Summit
The median family size in Lee s Summit is 3.07 persons per family, with married-couple families (22,356 | 80.1%) accounting for the largest median family size of 3.13 persons per family. On the other hand, single male/father families (1,578 | 5.7%) represent the smallest median family size with 2.51 persons per family.
| Family Type | # Families | Family Size |
| Married-Couple | 22,356 (80.1%) | 3.13 |
| Single Male/Father | 1,578 (5.7%) | 2.51 |
| Single Female/Mother | 3,979 (14.3%) | 2.92 |
| Total Families | 27,913 (100.0%) | 3.07 |
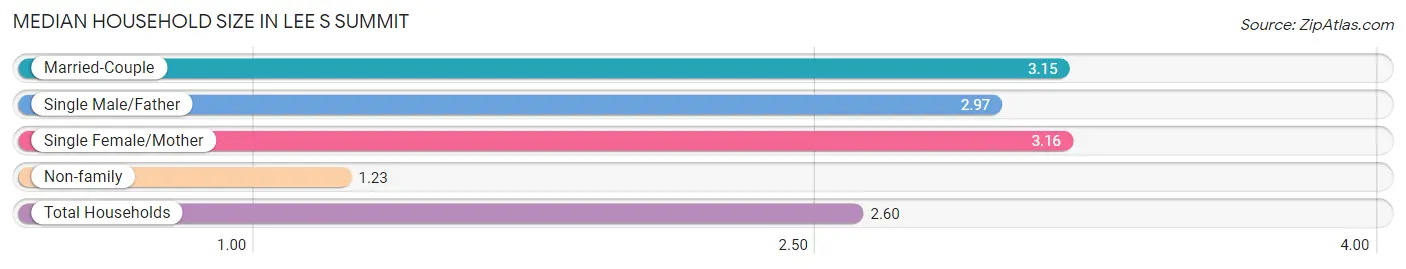
Median Household Size in Lee s Summit
The median household size in Lee s Summit is 2.60 persons per household, with single female/mother households (3,979 | 10.2%) accounting for the largest median household size of 3.16 persons per household. non-family households (11,006 | 28.3%) represent the smallest median household size with 1.23 persons per household.
| Household Type | # Households | Household Size |
| Married-Couple | 22,356 (57.4%) | 3.15 |
| Single Male/Father | 1,578 (4.1%) | 2.97 |
| Single Female/Mother | 3,979 (10.2%) | 3.16 |
| Non-family | 11,006 (28.3%) | 1.23 |
| Total Households | 38,919 (100.0%) | 2.60 |
Household Size by Marriage Status in Lee s Summit
Out of a total of 38,919 households in Lee s Summit, 27,913 (71.7%) are family households, while 11,006 (28.3%) are nonfamily households. The most numerous type of family households are 2-person households, comprising 12,114, and the most common type of nonfamily households are 1-person households, comprising 9,053.
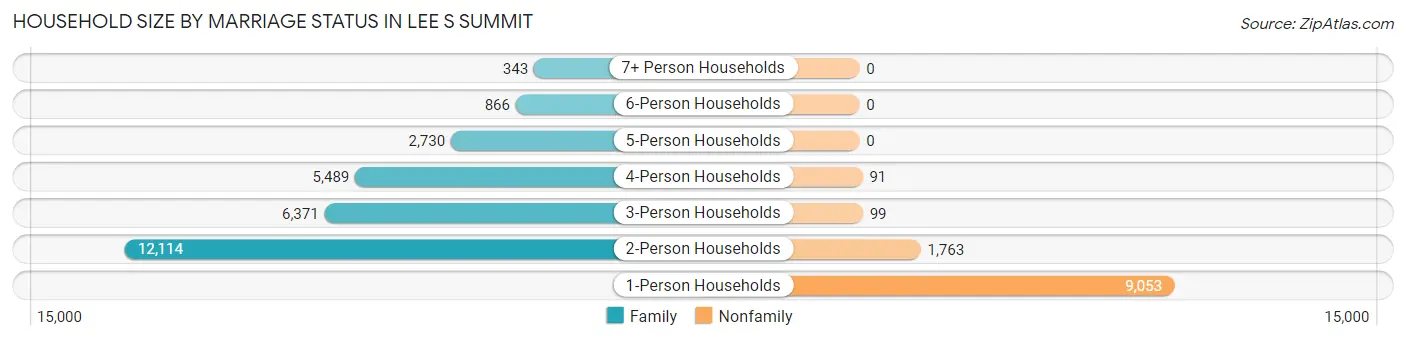
| Household Size | Family Households | Nonfamily Households |
| 1-Person Households | - | 9,053 (23.3%) |
| 2-Person Households | 12,114 (31.1%) | 1,763 (4.5%) |
| 3-Person Households | 6,371 (16.4%) | 99 (0.3%) |
| 4-Person Households | 5,489 (14.1%) | 91 (0.2%) |
| 5-Person Households | 2,730 (7.0%) | 0 (0.0%) |
| 6-Person Households | 866 (2.2%) | 0 (0.0%) |
| 7+ Person Households | 343 (0.9%) | 0 (0.0%) |
| Total | 27,913 (71.7%) | 11,006 (28.3%) |
Female Fertility in Lee s Summit
Fertility by Age in Lee s Summit
Average fertility rate in Lee s Summit is 56.0 births per 1,000 women. Women in the age bracket of 20 to 34 years have the highest fertility rate with 106.0 births per 1,000 women. Women in the age bracket of 20 to 34 years acount for 66.7% of all women with births.
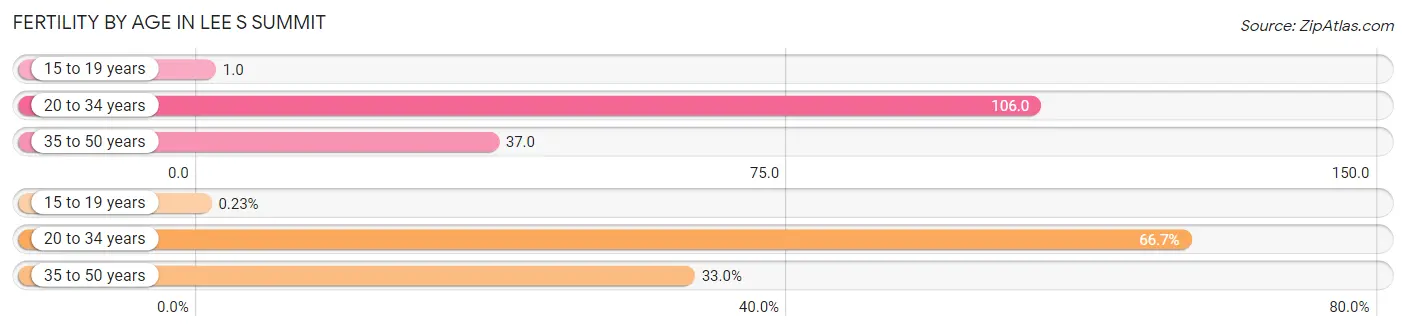
| Age Bracket | Women with Births | Births / 1,000 Women |
| 15 to 19 years | 3 (0.2%) | 1.0 |
| 20 to 34 years | 887 (66.7%) | 106.0 |
| 35 to 50 years | 439 (33.0%) | 37.0 |
| Total | 1,329 (100.0%) | 56.0 |
Fertility by Age by Marriage Status in Lee s Summit
85.9% of women with births (1,329) in Lee s Summit are married. The highest percentage of unmarried women with births falls into 15 to 19 years age bracket with 100.0% of them unmarried at the time of birth, while the lowest percentage of unmarried women with births belong to 20 to 34 years age bracket with 10.8% of them unmarried.
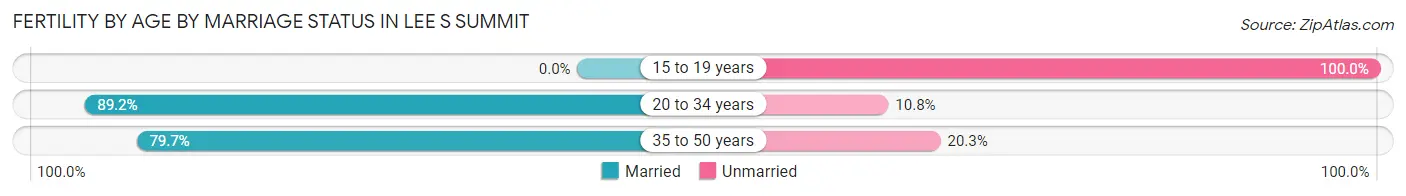
| Age Bracket | Married | Unmarried |
| 15 to 19 years | 0 (0.0%) | 3 (100.0%) |
| 20 to 34 years | 791 (89.2%) | 96 (10.8%) |
| 35 to 50 years | 350 (79.7%) | 89 (20.3%) |
| Total | 1,142 (85.9%) | 187 (14.1%) |
Fertility by Education in Lee s Summit
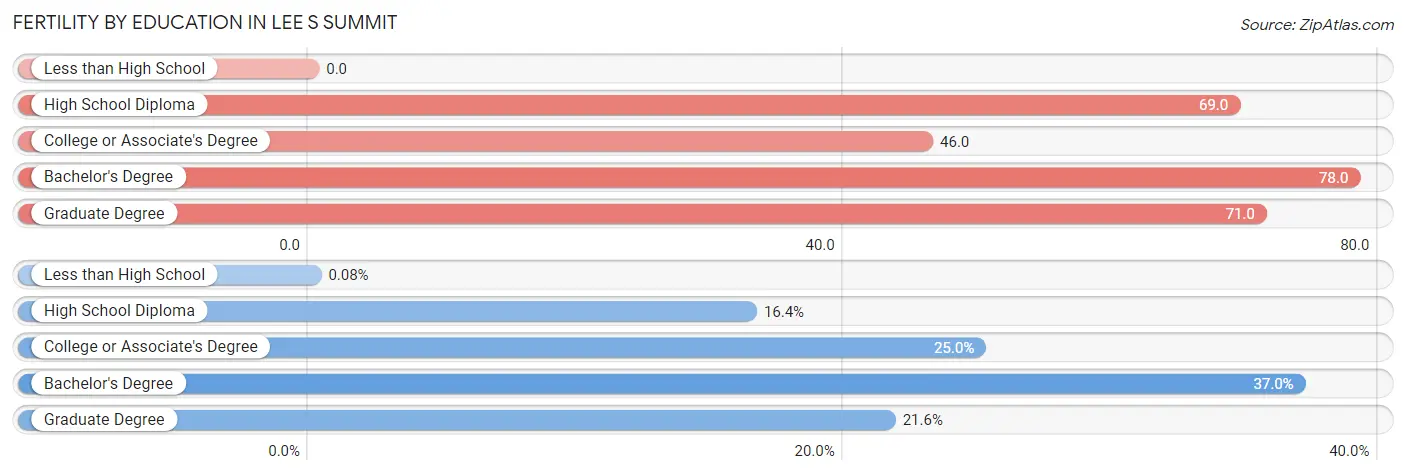
| Educational Attainment | Women with Births | Births / 1,000 Women |
| Less than High School | 1 (0.1%) | 0.0 |
| High School Diploma | 218 (16.4%) | 69.0 |
| College or Associate's Degree | 332 (25.0%) | 46.0 |
| Bachelor's Degree | 491 (36.9%) | 78.0 |
| Graduate Degree | 287 (21.6%) | 71.0 |
| Total | 1,329 (100.0%) | 56.0 |
Fertility by Education by Marriage Status in Lee s Summit
14.1% of women with births in Lee s Summit are unmarried. Women with the educational attainment of bachelor's degree are most likely to be married with 97.8% of them married at childbirth, while women with the educational attainment of less than high school are least likely to be married with 100.0% of them unmarried at childbirth.
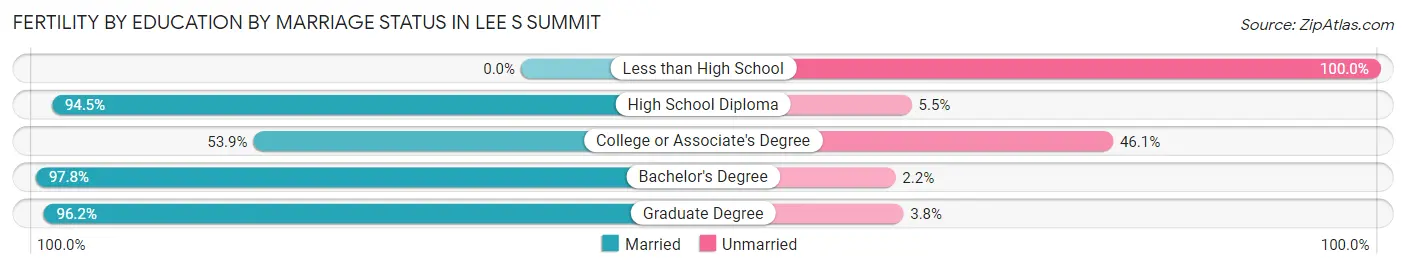
| Educational Attainment | Married | Unmarried |
| Less than High School | 0 (0.0%) | 1 (100.0%) |
| High School Diploma | 206 (94.5%) | 12 (5.5%) |
| College or Associate's Degree | 179 (53.9%) | 153 (46.1%) |
| Bachelor's Degree | 480 (97.8%) | 11 (2.2%) |
| Graduate Degree | 276 (96.2%) | 11 (3.8%) |
| Total | 1,142 (85.9%) | 187 (14.1%) |
Employment Characteristics in Lee s Summit
Employment by Class of Employer in Lee s Summit
Among the 52,798 employed individuals in Lee s Summit, private company employees (36,724 | 69.6%), not-for-profit organizations (5,042 | 9.6%), and local government employees (3,542 | 6.7%) make up the most common classes of employment.
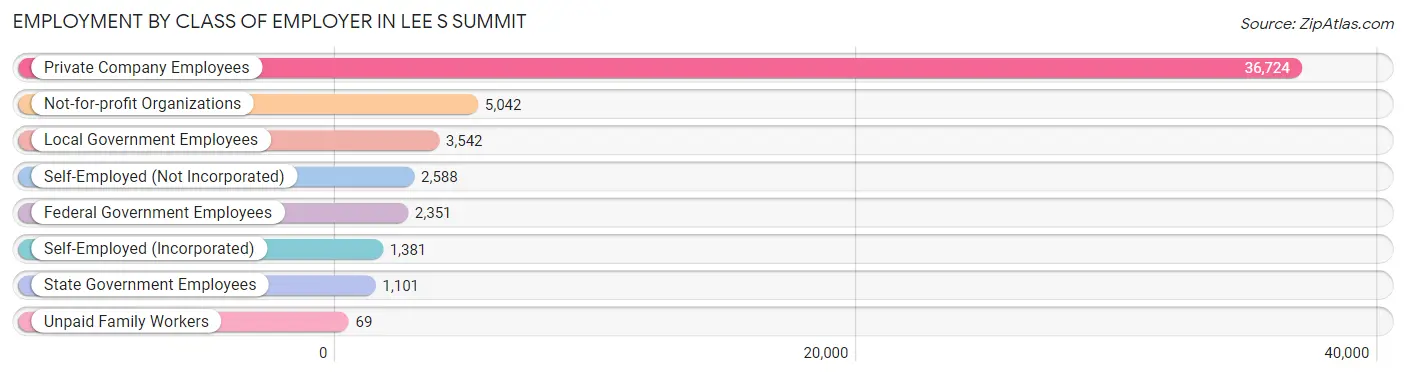
| Employer Class | # Employees | % Employees |
| Private Company Employees | 36,724 | 69.6% |
| Self-Employed (Incorporated) | 1,381 | 2.6% |
| Self-Employed (Not Incorporated) | 2,588 | 4.9% |
| Not-for-profit Organizations | 5,042 | 9.6% |
| Local Government Employees | 3,542 | 6.7% |
| State Government Employees | 1,101 | 2.1% |
| Federal Government Employees | 2,351 | 4.4% |
| Unpaid Family Workers | 69 | 0.1% |
| Total | 52,798 | 100.0% |
Employment Status by Age in Lee s Summit
According to the labor force statistics for Lee s Summit, out of the total population over 16 years of age (79,187), 70.4% or 55,748 individuals are in the labor force, with 3.8% or 2,118 of them unemployed. The age group with the highest labor force participation rate is 45 to 54 years, with 92.1% or 12,006 individuals in the labor force. Within the labor force, the 16 to 19 years age range has the highest percentage of unemployed individuals, with 12.4% or 348 of them being unemployed.
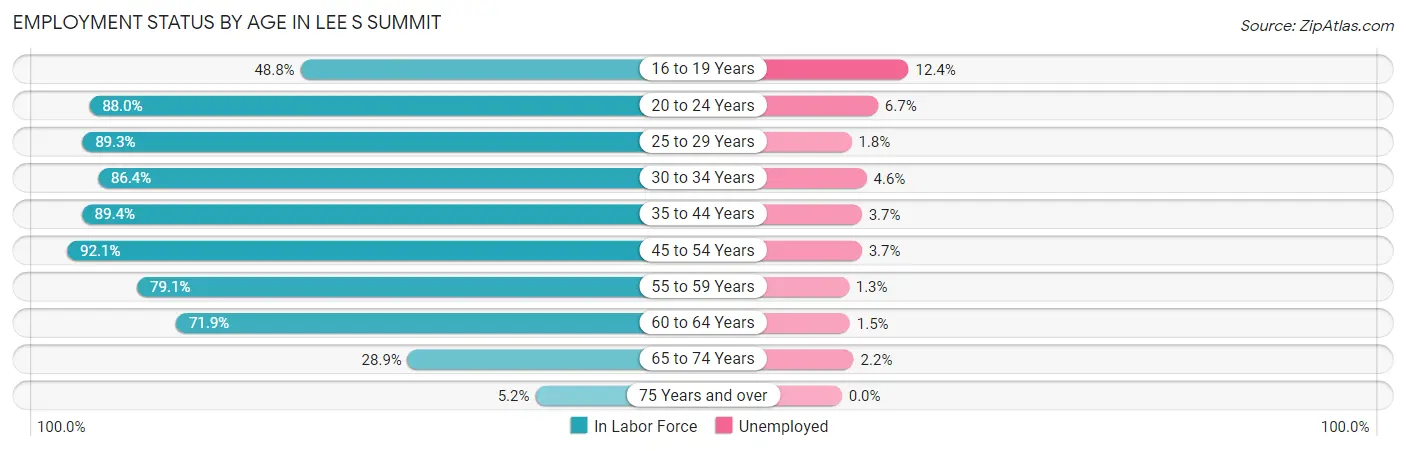
| Age Bracket | In Labor Force | Unemployed |
| 16 to 19 Years | 2,807 (48.8%) | 348 (12.4%) |
| 20 to 24 Years | 4,315 (88.0%) | 289 (6.7%) |
| 25 to 29 Years | 4,716 (89.3%) | 85 (1.8%) |
| 30 to 34 Years | 5,435 (86.4%) | 250 (4.6%) |
| 35 to 44 Years | 13,566 (89.4%) | 502 (3.7%) |
| 45 to 54 Years | 12,006 (92.1%) | 444 (3.7%) |
| 55 to 59 Years | 5,418 (79.1%) | 70 (1.3%) |
| 60 to 64 Years | 4,641 (71.9%) | 70 (1.5%) |
| 65 to 74 Years | 2,509 (28.9%) | 55 (2.2%) |
| 75 Years and over | 352 (5.2%) | 0 (0.0%) |
| Total | 55,748 (70.4%) | 2,118 (3.8%) |
Employment Status by Educational Attainment in Lee s Summit
According to labor force statistics for Lee s Summit, 86.3% of individuals (45,813) out of the total population between 25 and 64 years of age (53,086) are in the labor force, with 3.1% or 1,420 of them being unemployed. The group with the highest labor force participation rate are those with the educational attainment of bachelor's degree or higher, with 89.8% or 24,334 individuals in the labor force. Within the labor force, individuals with high school diploma education have the highest percentage of unemployment, with 5.3% or 370 of them being unemployed.
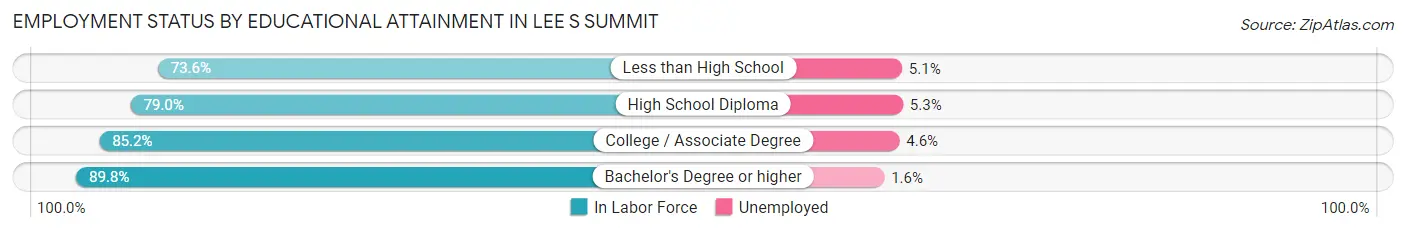
| Educational Attainment | In Labor Force | Unemployed |
| Less than High School | 878 (73.6%) | 61 (5.1%) |
| High School Diploma | 6,976 (79.0%) | 468 (5.3%) |
| College / Associate Degree | 13,602 (85.2%) | 734 (4.6%) |
| Bachelor's Degree or higher | 24,334 (89.8%) | 434 (1.6%) |
| Total | 45,813 (86.3%) | 1,646 (3.1%) |
Employment Occupations by Sex in Lee s Summit
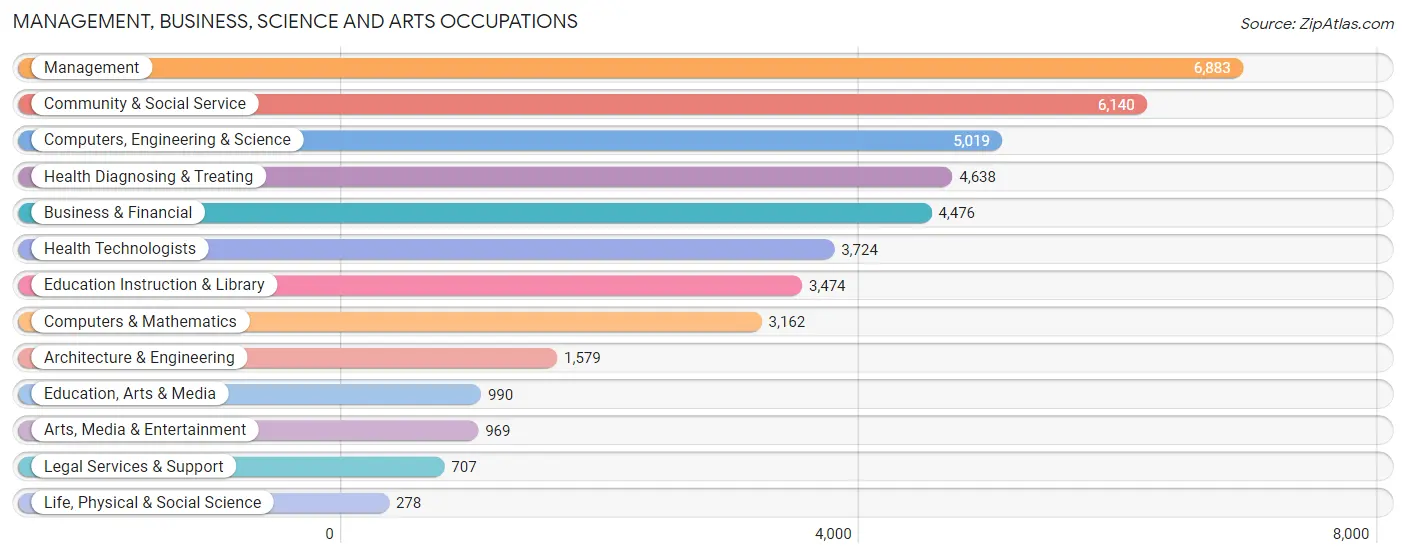
Management, Business, Science and Arts Occupations
The most common Management, Business, Science and Arts occupations in Lee s Summit are Management (6,883 | 12.9%), Community & Social Service (6,140 | 11.5%), Computers, Engineering & Science (5,019 | 9.4%), Health Diagnosing & Treating (4,638 | 8.7%), and Business & Financial (4,476 | 8.4%).
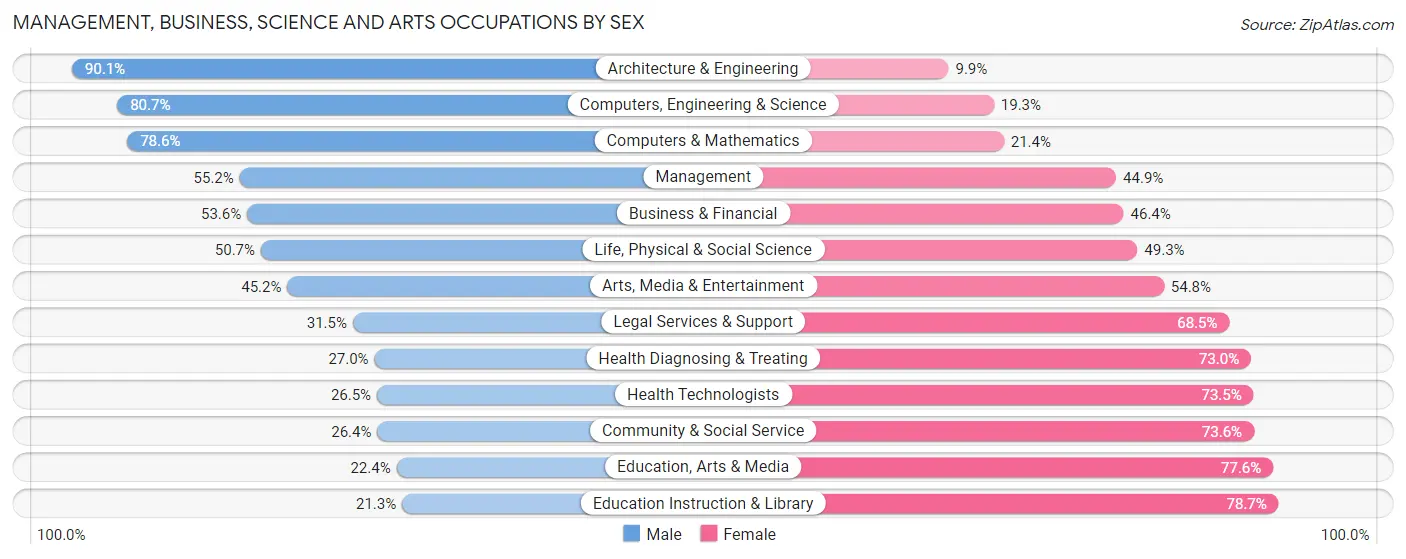
Management, Business, Science and Arts Occupations by Sex
Within the Management, Business, Science and Arts occupations in Lee s Summit, the most male-oriented occupations are Architecture & Engineering (90.1%), Computers, Engineering & Science (80.7%), and Computers & Mathematics (78.6%), while the most female-oriented occupations are Education Instruction & Library (78.7%), Education, Arts & Media (77.6%), and Community & Social Service (73.6%).
| Occupation | Male | Female |
| Management | 3,796 (55.1%) | 3,087 (44.9%) |
| Business & Financial | 2,399 (53.6%) | 2,077 (46.4%) |
| Computers, Engineering & Science | 4,049 (80.7%) | 970 (19.3%) |
| Computers & Mathematics | 2,485 (78.6%) | 677 (21.4%) |
| Architecture & Engineering | 1,423 (90.1%) | 156 (9.9%) |
| Life, Physical & Social Science | 141 (50.7%) | 137 (49.3%) |
| Community & Social Service | 1,622 (26.4%) | 4,518 (73.6%) |
| Education, Arts & Media | 222 (22.4%) | 768 (77.6%) |
| Legal Services & Support | 223 (31.5%) | 484 (68.5%) |
| Education Instruction & Library | 739 (21.3%) | 2,735 (78.7%) |
| Arts, Media & Entertainment | 438 (45.2%) | 531 (54.8%) |
| Health Diagnosing & Treating | 1,253 (27.0%) | 3,385 (73.0%) |
| Health Technologists | 987 (26.5%) | 2,737 (73.5%) |
| Total (Category) | 13,119 (48.3%) | 14,037 (51.7%) |
| Total (Overall) | 27,204 (51.1%) | 26,060 (48.9%) |
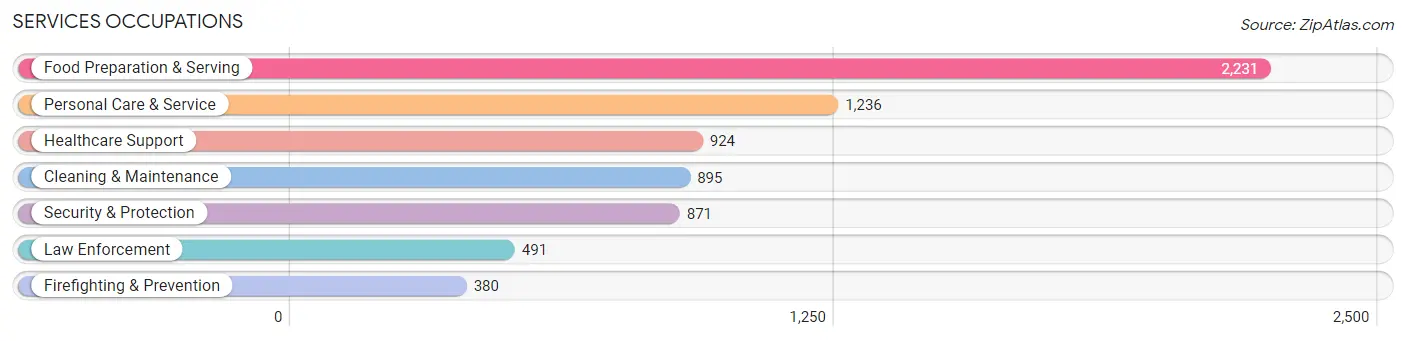
Services Occupations
The most common Services occupations in Lee s Summit are Food Preparation & Serving (2,231 | 4.2%), Personal Care & Service (1,236 | 2.3%), Healthcare Support (924 | 1.7%), Cleaning & Maintenance (895 | 1.7%), and Security & Protection (871 | 1.6%).
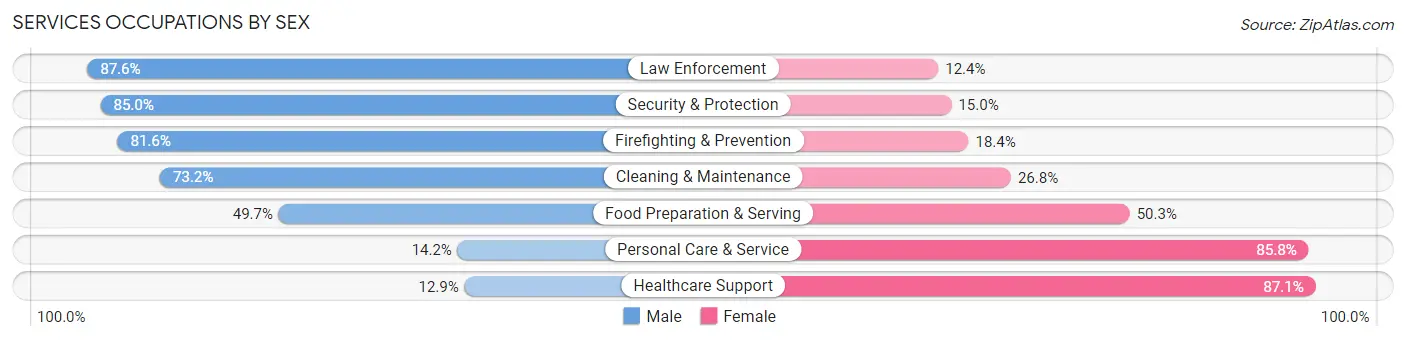
Services Occupations by Sex
Within the Services occupations in Lee s Summit, the most male-oriented occupations are Law Enforcement (87.6%), Security & Protection (85.0%), and Firefighting & Prevention (81.6%), while the most female-oriented occupations are Healthcare Support (87.1%), Personal Care & Service (85.8%), and Food Preparation & Serving (50.3%).
| Occupation | Male | Female |
| Healthcare Support | 119 (12.9%) | 805 (87.1%) |
| Security & Protection | 740 (85.0%) | 131 (15.0%) |
| Firefighting & Prevention | 310 (81.6%) | 70 (18.4%) |
| Law Enforcement | 430 (87.6%) | 61 (12.4%) |
| Food Preparation & Serving | 1,108 (49.7%) | 1,123 (50.3%) |
| Cleaning & Maintenance | 655 (73.2%) | 240 (26.8%) |
| Personal Care & Service | 176 (14.2%) | 1,060 (85.8%) |
| Total (Category) | 2,798 (45.4%) | 3,359 (54.6%) |
| Total (Overall) | 27,204 (51.1%) | 26,060 (48.9%) |
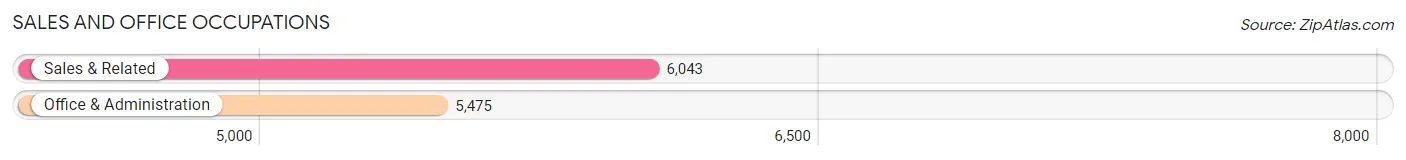
Sales and Office Occupations
The most common Sales and Office occupations in Lee s Summit are Sales & Related (6,043 | 11.4%), and Office & Administration (5,475 | 10.3%).
Sales and Office Occupations by Sex
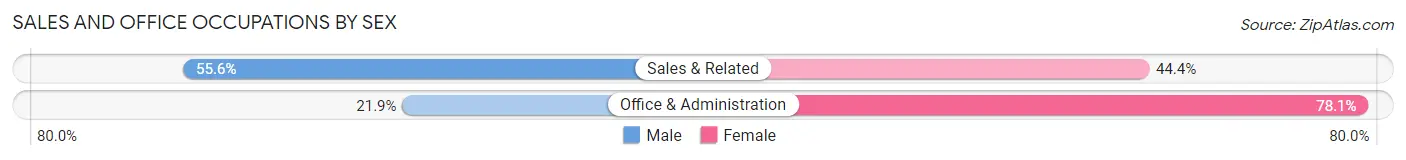
| Occupation | Male | Female |
| Sales & Related | 3,361 (55.6%) | 2,682 (44.4%) |
| Office & Administration | 1,198 (21.9%) | 4,277 (78.1%) |
| Total (Category) | 4,559 (39.6%) | 6,959 (60.4%) |
| Total (Overall) | 27,204 (51.1%) | 26,060 (48.9%) |
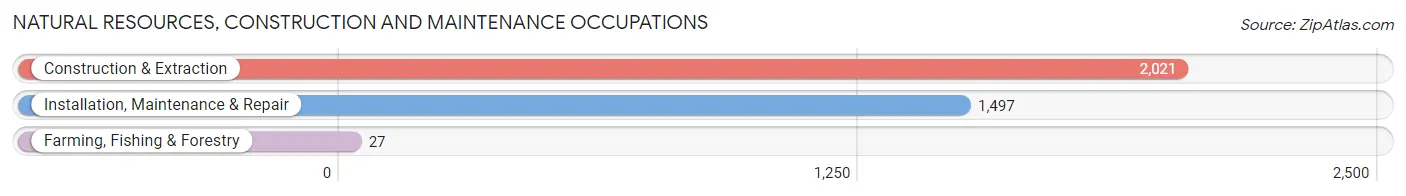
Natural Resources, Construction and Maintenance Occupations
The most common Natural Resources, Construction and Maintenance occupations in Lee s Summit are Construction & Extraction (2,021 | 3.8%), Installation, Maintenance & Repair (1,497 | 2.8%), and Farming, Fishing & Forestry (27 | 0.1%).
Natural Resources, Construction and Maintenance Occupations by Sex
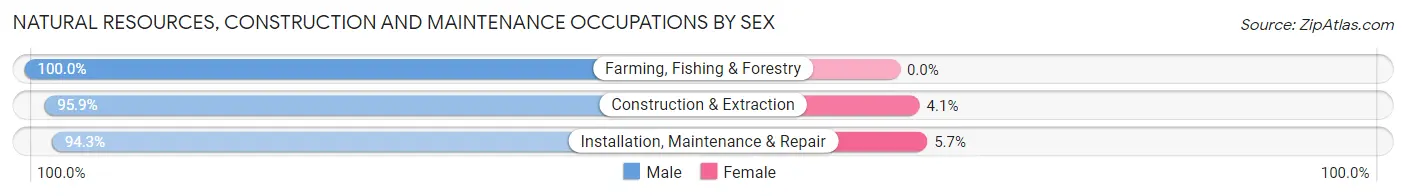
| Occupation | Male | Female |
| Farming, Fishing & Forestry | 27 (100.0%) | 0 (0.0%) |
| Construction & Extraction | 1,938 (95.9%) | 83 (4.1%) |
| Installation, Maintenance & Repair | 1,412 (94.3%) | 85 (5.7%) |
| Total (Category) | 3,377 (95.3%) | 168 (4.7%) |
| Total (Overall) | 27,204 (51.1%) | 26,060 (48.9%) |
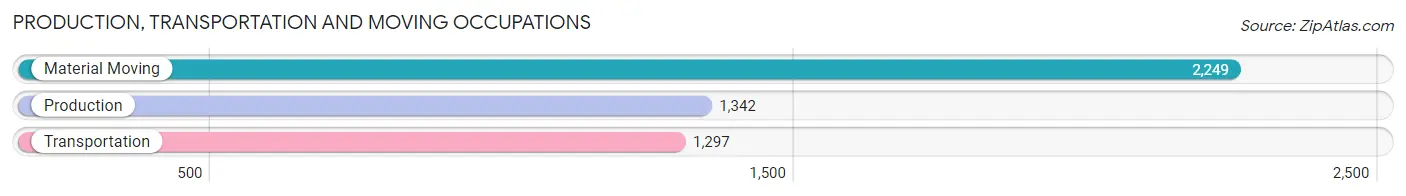
Production, Transportation and Moving Occupations
The most common Production, Transportation and Moving occupations in Lee s Summit are Material Moving (2,249 | 4.2%), Production (1,342 | 2.5%), and Transportation (1,297 | 2.4%).
Production, Transportation and Moving Occupations by Sex
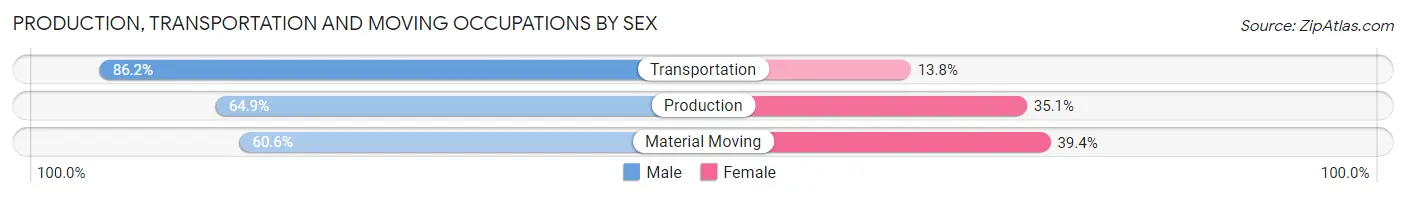
| Occupation | Male | Female |
| Production | 871 (64.9%) | 471 (35.1%) |
| Transportation | 1,118 (86.2%) | 179 (13.8%) |
| Material Moving | 1,362 (60.6%) | 887 (39.4%) |
| Total (Category) | 3,351 (68.6%) | 1,537 (31.4%) |
| Total (Overall) | 27,204 (51.1%) | 26,060 (48.9%) |
Employment Industries by Sex in Lee s Summit
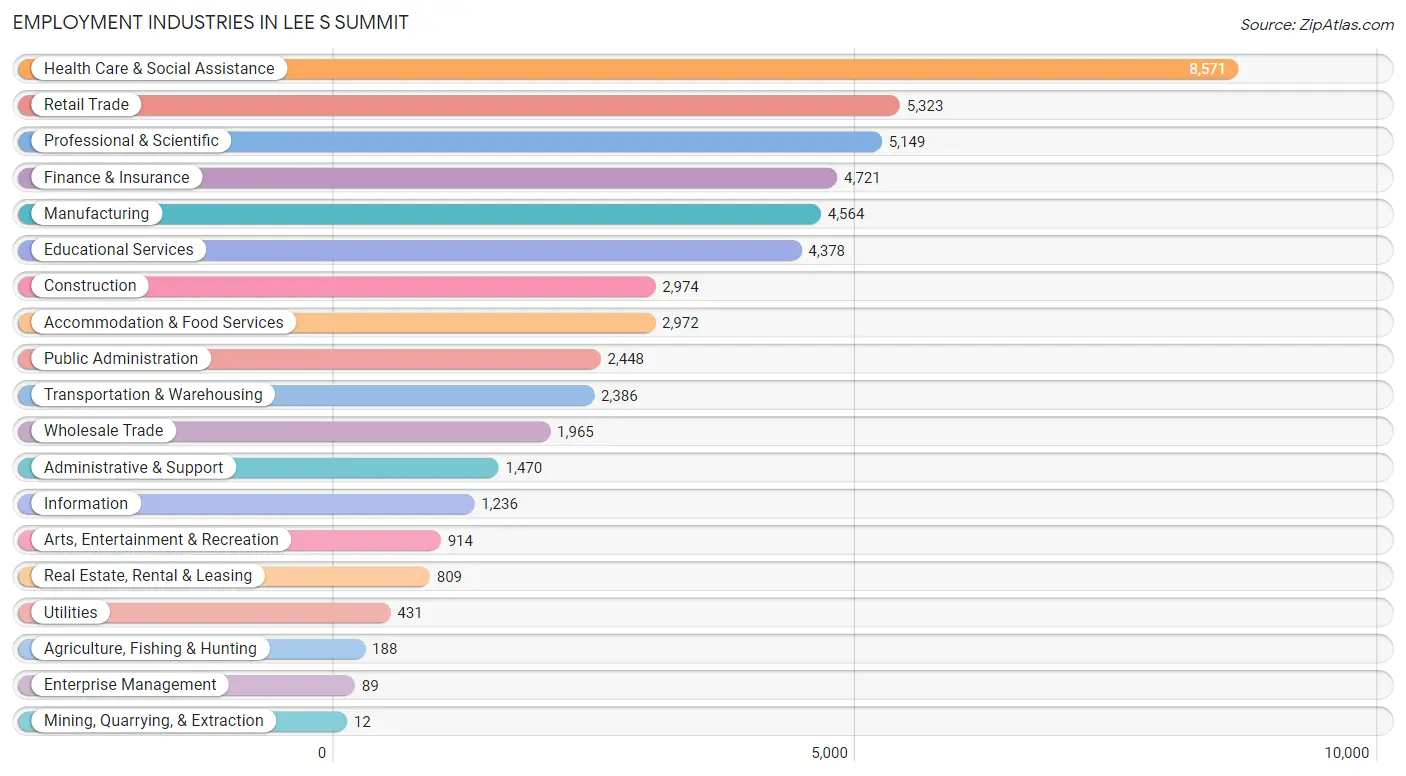
Employment Industries in Lee s Summit
The major employment industries in Lee s Summit include Health Care & Social Assistance (8,571 | 16.1%), Retail Trade (5,323 | 10.0%), Professional & Scientific (5,149 | 9.7%), Finance & Insurance (4,721 | 8.9%), and Manufacturing (4,564 | 8.6%).
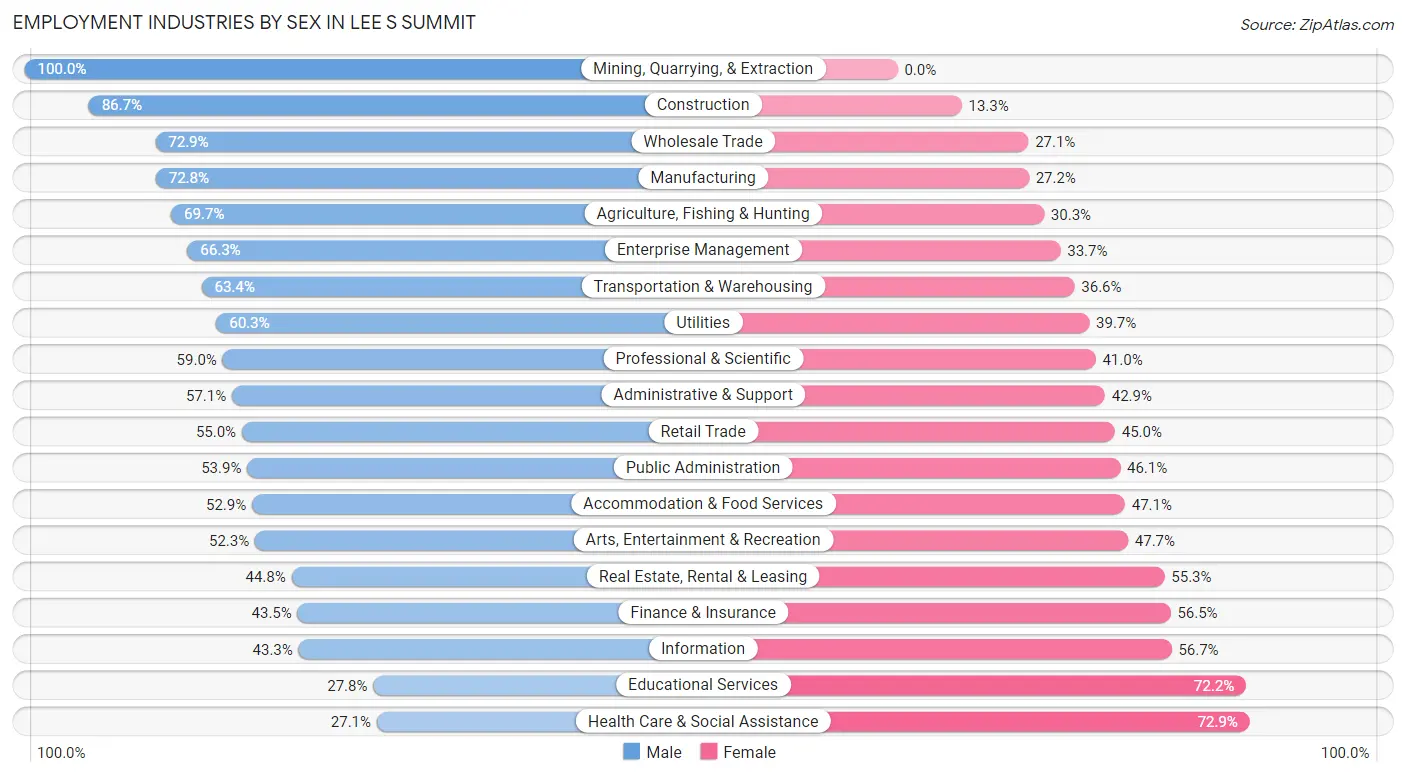
Employment Industries by Sex in Lee s Summit
The Lee s Summit industries that see more men than women are Mining, Quarrying, & Extraction (100.0%), Construction (86.7%), and Wholesale Trade (72.9%), whereas the industries that tend to have a higher number of women are Health Care & Social Assistance (72.9%), Educational Services (72.2%), and Information (56.7%).
| Industry | Male | Female |
| Agriculture, Fishing & Hunting | 131 (69.7%) | 57 (30.3%) |
| Mining, Quarrying, & Extraction | 12 (100.0%) | 0 (0.0%) |
| Construction | 2,579 (86.7%) | 395 (13.3%) |
| Manufacturing | 3,324 (72.8%) | 1,240 (27.2%) |
| Wholesale Trade | 1,433 (72.9%) | 532 (27.1%) |
| Retail Trade | 2,928 (55.0%) | 2,395 (45.0%) |
| Transportation & Warehousing | 1,512 (63.4%) | 874 (36.6%) |
| Utilities | 260 (60.3%) | 171 (39.7%) |
| Information | 535 (43.3%) | 701 (56.7%) |
| Finance & Insurance | 2,053 (43.5%) | 2,668 (56.5%) |
| Real Estate, Rental & Leasing | 362 (44.8%) | 447 (55.2%) |
| Professional & Scientific | 3,038 (59.0%) | 2,111 (41.0%) |
| Enterprise Management | 59 (66.3%) | 30 (33.7%) |
| Administrative & Support | 839 (57.1%) | 631 (42.9%) |
| Educational Services | 1,218 (27.8%) | 3,160 (72.2%) |
| Health Care & Social Assistance | 2,322 (27.1%) | 6,249 (72.9%) |
| Arts, Entertainment & Recreation | 478 (52.3%) | 436 (47.7%) |
| Accommodation & Food Services | 1,573 (52.9%) | 1,399 (47.1%) |
| Public Administration | 1,320 (53.9%) | 1,128 (46.1%) |
| Total | 27,204 (51.1%) | 26,060 (48.9%) |
Education in Lee s Summit
School Enrollment in Lee s Summit
The most common levels of schooling among the 26,105 students in Lee s Summit are middle school (6,503 | 24.9%), high school (6,343 | 24.3%), and elementary school (5,365 | 20.5%).
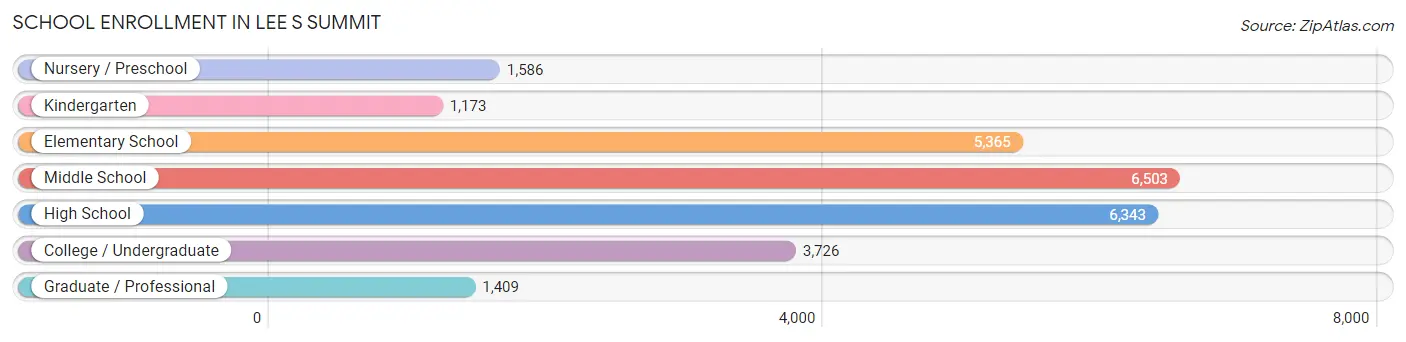
| School Level | # Students | % Students |
| Nursery / Preschool | 1,586 | 6.1% |
| Kindergarten | 1,173 | 4.5% |
| Elementary School | 5,365 | 20.5% |
| Middle School | 6,503 | 24.9% |
| High School | 6,343 | 24.3% |
| College / Undergraduate | 3,726 | 14.3% |
| Graduate / Professional | 1,409 | 5.4% |
| Total | 26,105 | 100.0% |
School Enrollment by Age by Funding Source in Lee s Summit
Out of a total of 26,105 students who are enrolled in schools in Lee s Summit, 3,890 (14.9%) attend a private institution, while the remaining 22,215 (85.1%) are enrolled in public schools. The age group of 3 to 4 year olds has the highest likelihood of being enrolled in private schools, with 492 (50.0% in the age bracket) enrolled. Conversely, the age group of 20 to 24 year olds has the lowest likelihood of being enrolled in a private school, with 1,669 (90.2% in the age bracket) attending a public institution.
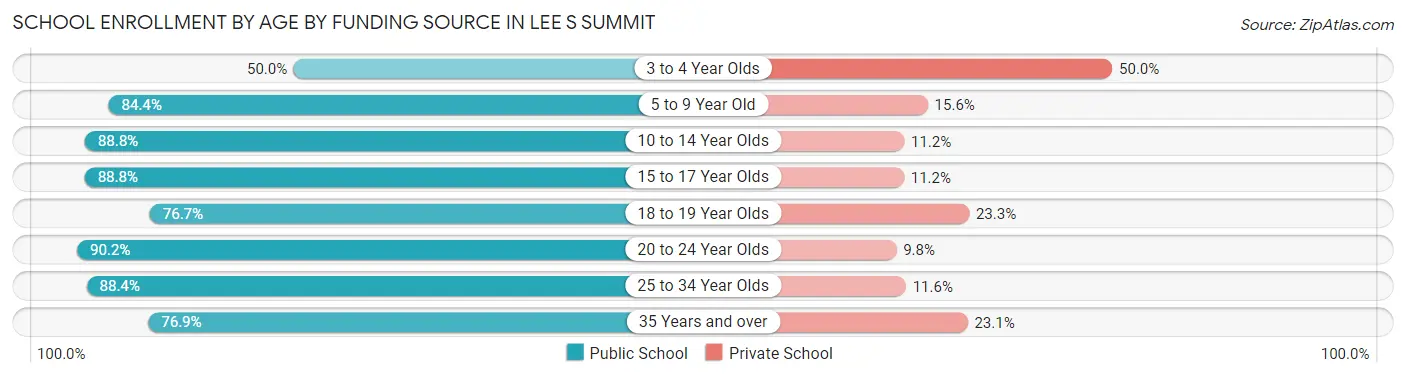
| Age Bracket | Public School | Private School |
| 3 to 4 Year Olds | 492 (50.0%) | 492 (50.0%) |
| 5 to 9 Year Old | 5,214 (84.4%) | 967 (15.6%) |
| 10 to 14 Year Olds | 7,196 (88.8%) | 911 (11.2%) |
| 15 to 17 Year Olds | 4,401 (88.8%) | 555 (11.2%) |
| 18 to 19 Year Olds | 1,238 (76.7%) | 377 (23.3%) |
| 20 to 24 Year Olds | 1,669 (90.2%) | 181 (9.8%) |
| 25 to 34 Year Olds | 1,071 (88.4%) | 140 (11.6%) |
| 35 Years and over | 924 (76.9%) | 277 (23.1%) |
| Total | 22,215 (85.1%) | 3,890 (14.9%) |
Educational Attainment by Field of Study in Lee s Summit
Business (9,180 | 25.5%), education (5,128 | 14.3%), science & technology (3,993 | 11.1%), engineering (2,566 | 7.1%), and arts & humanities (2,335 | 6.5%) are the most common fields of study among 35,943 individuals in Lee s Summit who have obtained a bachelor's degree or higher.
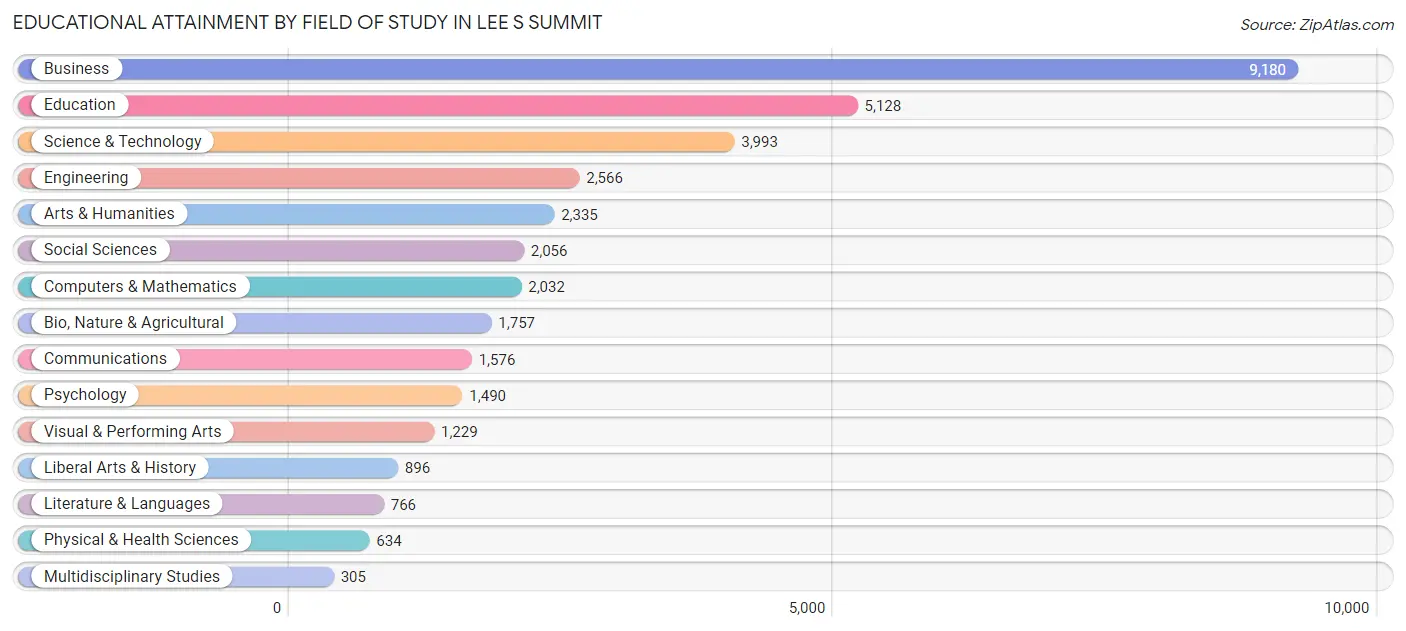
| Field of Study | # Graduates | % Graduates |
| Computers & Mathematics | 2,032 | 5.7% |
| Bio, Nature & Agricultural | 1,757 | 4.9% |
| Physical & Health Sciences | 634 | 1.8% |
| Psychology | 1,490 | 4.2% |
| Social Sciences | 2,056 | 5.7% |
| Engineering | 2,566 | 7.1% |
| Multidisciplinary Studies | 305 | 0.9% |
| Science & Technology | 3,993 | 11.1% |
| Business | 9,180 | 25.5% |
| Education | 5,128 | 14.3% |
| Literature & Languages | 766 | 2.1% |
| Liberal Arts & History | 896 | 2.5% |
| Visual & Performing Arts | 1,229 | 3.4% |
| Communications | 1,576 | 4.4% |
| Arts & Humanities | 2,335 | 6.5% |
| Total | 35,943 | 100.0% |
Transportation & Commute in Lee s Summit
Vehicle Availability by Sex in Lee s Summit
The most prevalent vehicle ownership categories in Lee s Summit are males with 2 vehicles (12,460, accounting for 45.8%) and females with 2 vehicles (11,486, making up 48.7%).
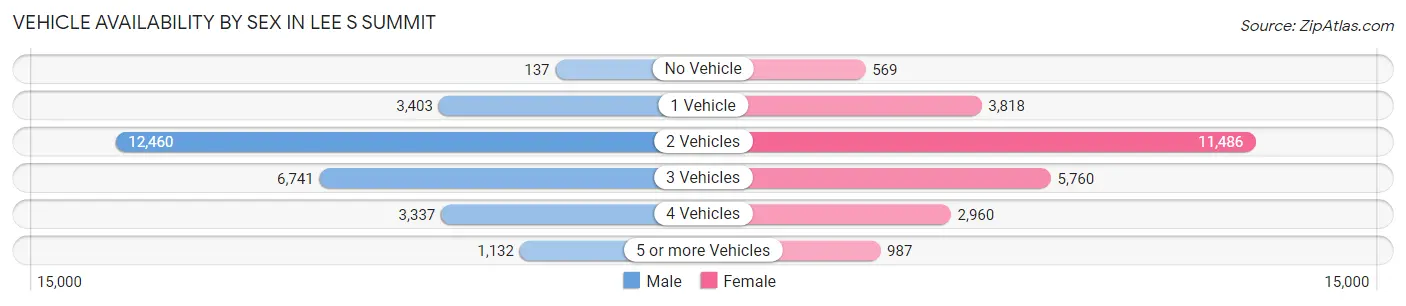
| Vehicles Available | Male | Female |
| No Vehicle | 137 (0.5%) | 569 (2.2%) |
| 1 Vehicle | 3,403 (12.5%) | 3,818 (14.9%) |
| 2 Vehicles | 12,460 (45.8%) | 11,486 (44.9%) |
| 3 Vehicles | 6,741 (24.8%) | 5,760 (22.5%) |
| 4 Vehicles | 3,337 (12.3%) | 2,960 (11.6%) |
| 5 or more Vehicles | 1,132 (4.2%) | 987 (3.9%) |
| Total | 27,210 (100.0%) | 25,580 (100.0%) |
Commute Time in Lee s Summit
The most frequently occuring commute durations in Lee s Summit are 30 to 34 minutes (6,811 commuters, 15.4%), 15 to 19 minutes (6,002 commuters, 13.5%), and 20 to 24 minutes (5,517 commuters, 12.4%).
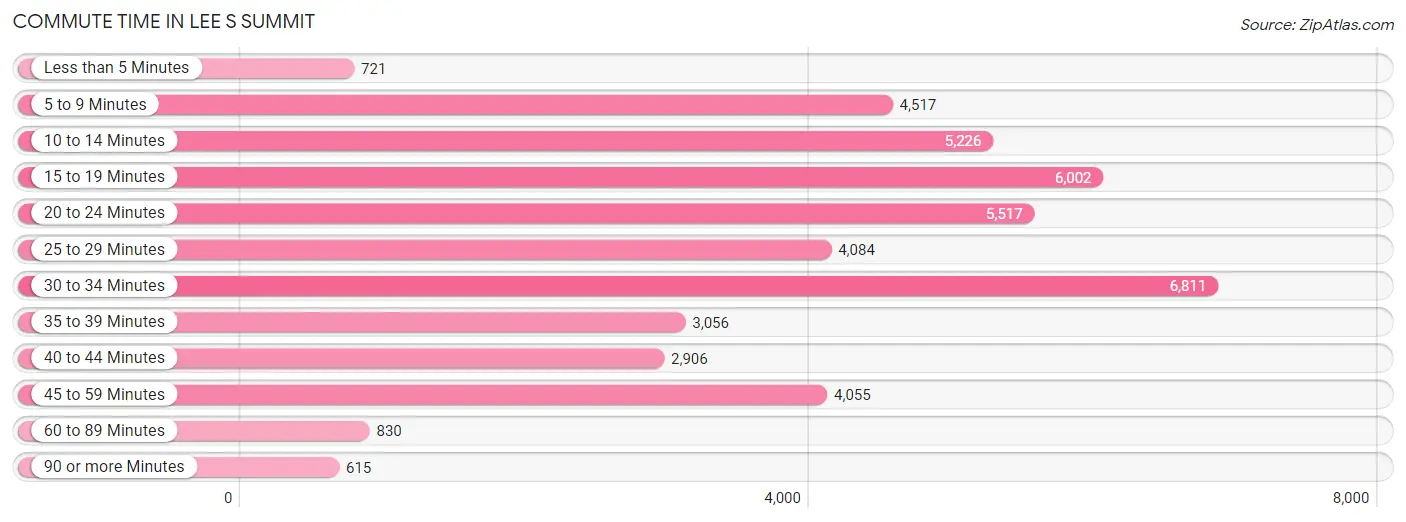
| Commute Time | # Commuters | % Commuters |
| Less than 5 Minutes | 721 | 1.6% |
| 5 to 9 Minutes | 4,517 | 10.2% |
| 10 to 14 Minutes | 5,226 | 11.8% |
| 15 to 19 Minutes | 6,002 | 13.5% |
| 20 to 24 Minutes | 5,517 | 12.4% |
| 25 to 29 Minutes | 4,084 | 9.2% |
| 30 to 34 Minutes | 6,811 | 15.4% |
| 35 to 39 Minutes | 3,056 | 6.9% |
| 40 to 44 Minutes | 2,906 | 6.6% |
| 45 to 59 Minutes | 4,055 | 9.1% |
| 60 to 89 Minutes | 830 | 1.9% |
| 90 or more Minutes | 615 | 1.4% |
Commute Time by Sex in Lee s Summit
The most common commute times in Lee s Summit are 30 to 34 minutes (3,935 commuters, 16.8%) for males and 15 to 19 minutes (3,368 commuters, 16.2%) for females.
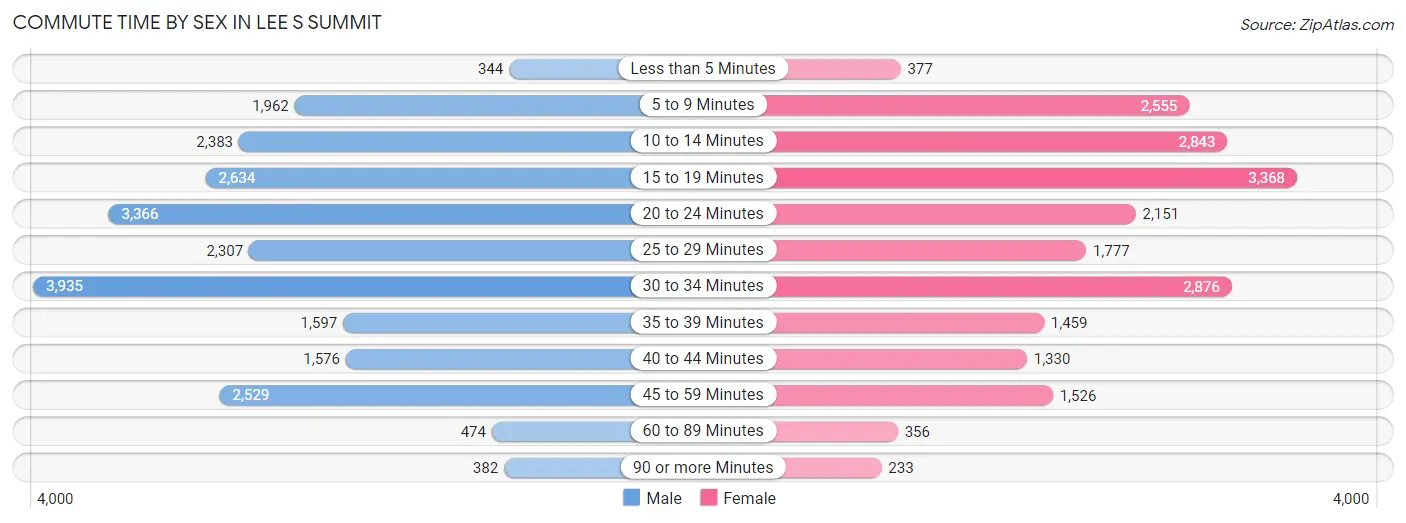
| Commute Time | Male | Female |
| Less than 5 Minutes | 344 (1.5%) | 377 (1.8%) |
| 5 to 9 Minutes | 1,962 (8.4%) | 2,555 (12.2%) |
| 10 to 14 Minutes | 2,383 (10.2%) | 2,843 (13.6%) |
| 15 to 19 Minutes | 2,634 (11.2%) | 3,368 (16.2%) |
| 20 to 24 Minutes | 3,366 (14.3%) | 2,151 (10.3%) |
| 25 to 29 Minutes | 2,307 (9.8%) | 1,777 (8.5%) |
| 30 to 34 Minutes | 3,935 (16.8%) | 2,876 (13.8%) |
| 35 to 39 Minutes | 1,597 (6.8%) | 1,459 (7.0%) |
| 40 to 44 Minutes | 1,576 (6.7%) | 1,330 (6.4%) |
| 45 to 59 Minutes | 2,529 (10.8%) | 1,526 (7.3%) |
| 60 to 89 Minutes | 474 (2.0%) | 356 (1.7%) |
| 90 or more Minutes | 382 (1.6%) | 233 (1.1%) |
Time of Departure to Work by Sex in Lee s Summit
The most frequent times of departure to work in Lee s Summit are 7:00 AM to 7:29 AM (4,049, 17.2%) for males and 7:30 AM to 7:59 AM (3,335, 16.0%) for females.
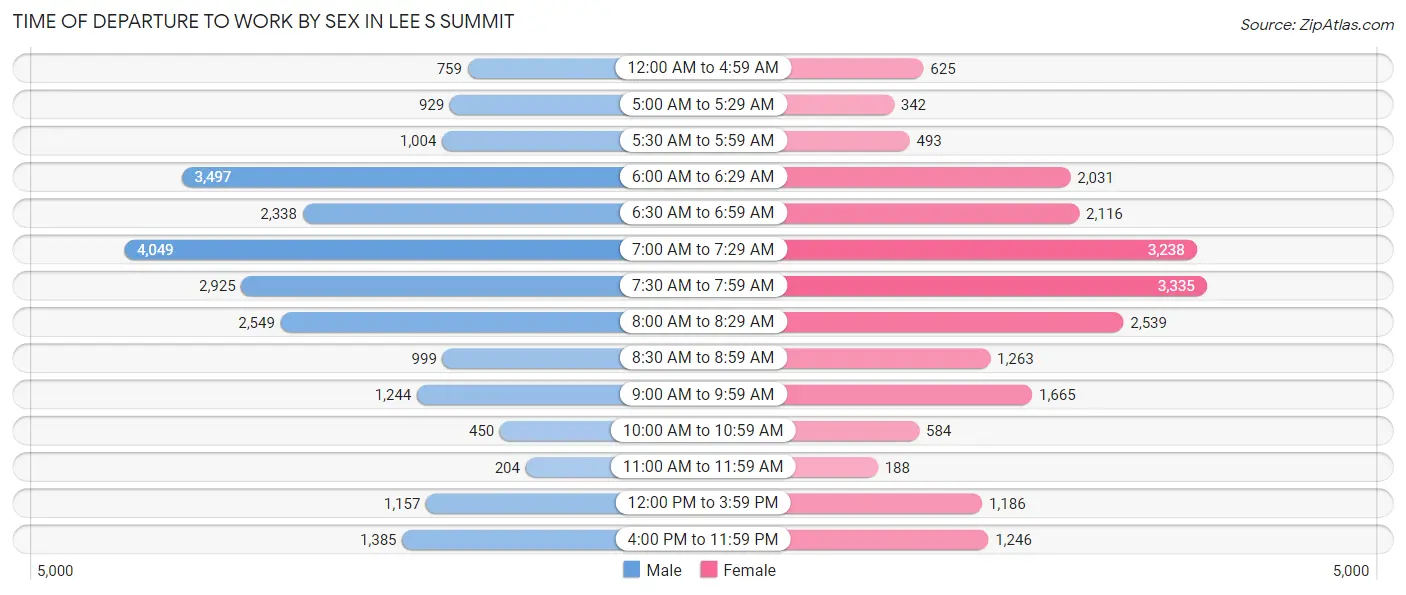
| Time of Departure | Male | Female |
| 12:00 AM to 4:59 AM | 759 (3.2%) | 625 (3.0%) |
| 5:00 AM to 5:29 AM | 929 (4.0%) | 342 (1.6%) |
| 5:30 AM to 5:59 AM | 1,004 (4.3%) | 493 (2.4%) |
| 6:00 AM to 6:29 AM | 3,497 (14.9%) | 2,031 (9.7%) |
| 6:30 AM to 6:59 AM | 2,338 (10.0%) | 2,116 (10.2%) |
| 7:00 AM to 7:29 AM | 4,049 (17.2%) | 3,238 (15.5%) |
| 7:30 AM to 7:59 AM | 2,925 (12.4%) | 3,335 (16.0%) |
| 8:00 AM to 8:29 AM | 2,549 (10.8%) | 2,539 (12.2%) |
| 8:30 AM to 8:59 AM | 999 (4.3%) | 1,263 (6.1%) |
| 9:00 AM to 9:59 AM | 1,244 (5.3%) | 1,665 (8.0%) |
| 10:00 AM to 10:59 AM | 450 (1.9%) | 584 (2.8%) |
| 11:00 AM to 11:59 AM | 204 (0.9%) | 188 (0.9%) |
| 12:00 PM to 3:59 PM | 1,157 (4.9%) | 1,186 (5.7%) |
| 4:00 PM to 11:59 PM | 1,385 (5.9%) | 1,246 (6.0%) |
| Total | 23,489 (100.0%) | 20,851 (100.0%) |
Housing Occupancy in Lee s Summit
Occupancy by Ownership in Lee s Summit
Of the total 38,919 dwellings in Lee s Summit, owner-occupied units account for 29,244 (75.1%), while renter-occupied units make up 9,675 (24.9%).
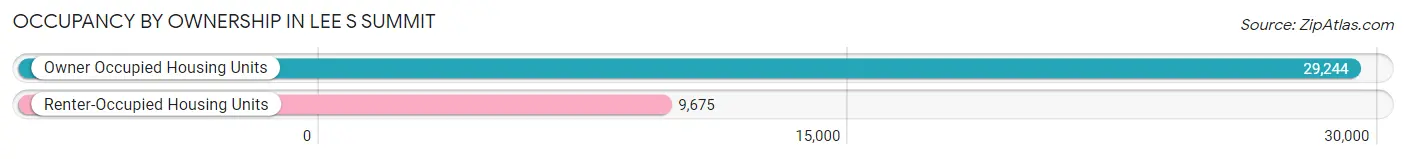
| Occupancy | # Housing Units | % Housing Units |
| Owner Occupied Housing Units | 29,244 | 75.1% |
| Renter-Occupied Housing Units | 9,675 | 24.9% |
| Total Occupied Housing Units | 38,919 | 100.0% |
Occupancy by Household Size in Lee s Summit
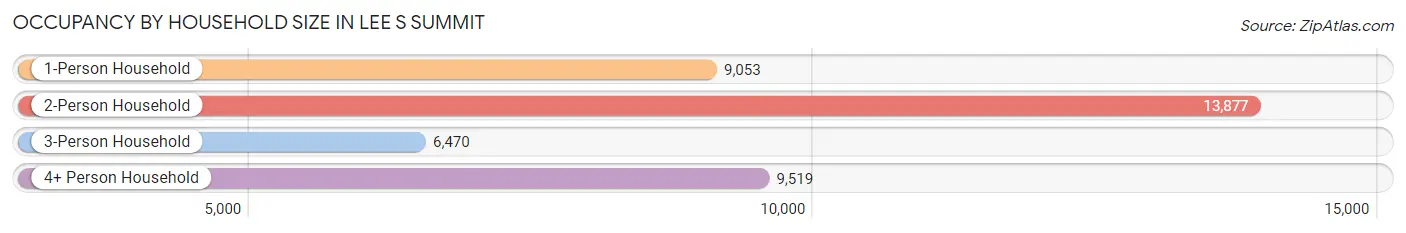
| Household Size | # Housing Units | % Housing Units |
| 1-Person Household | 9,053 | 23.3% |
| 2-Person Household | 13,877 | 35.7% |
| 3-Person Household | 6,470 | 16.6% |
| 4+ Person Household | 9,519 | 24.5% |
| Total Housing Units | 38,919 | 100.0% |
Occupancy by Ownership by Household Size in Lee s Summit
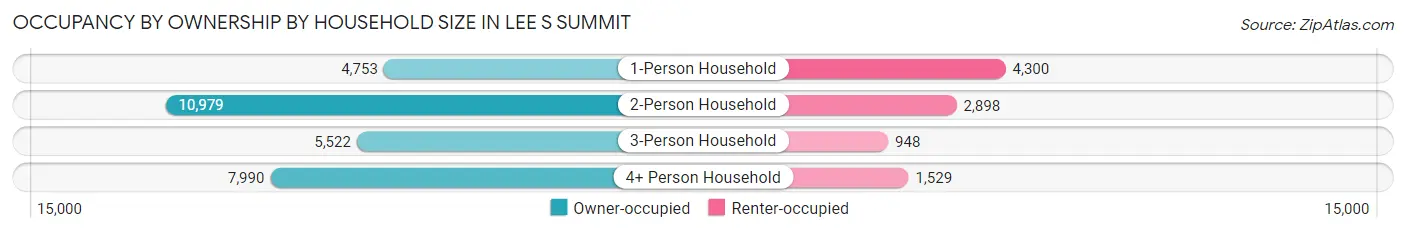
| Household Size | Owner-occupied | Renter-occupied |
| 1-Person Household | 4,753 (52.5%) | 4,300 (47.5%) |
| 2-Person Household | 10,979 (79.1%) | 2,898 (20.9%) |
| 3-Person Household | 5,522 (85.4%) | 948 (14.6%) |
| 4+ Person Household | 7,990 (83.9%) | 1,529 (16.1%) |
| Total Housing Units | 29,244 (75.1%) | 9,675 (24.9%) |
Occupancy by Educational Attainment in Lee s Summit
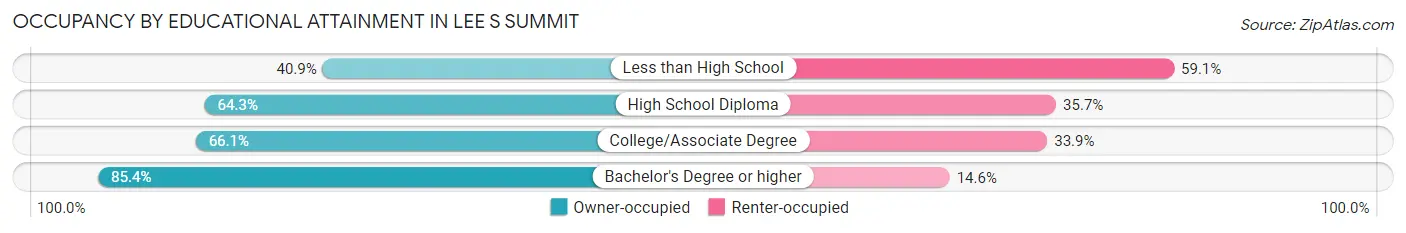
| Household Size | Owner-occupied | Renter-occupied |
| Less than High School | 325 (40.9%) | 469 (59.1%) |
| High School Diploma | 3,916 (64.3%) | 2,172 (35.7%) |
| College/Associate Degree | 8,064 (66.1%) | 4,141 (33.9%) |
| Bachelor's Degree or higher | 16,939 (85.4%) | 2,893 (14.6%) |
Occupancy by Age of Householder in Lee s Summit

| Age Bracket | # Households | % Households |
| Under 35 Years | 6,784 | 17.4% |
| 35 to 44 Years | 8,000 | 20.6% |
| 45 to 54 Years | 7,235 | 18.6% |
| 55 to 64 Years | 7,695 | 19.8% |
| 65 to 74 Years | 5,005 | 12.9% |
| 75 to 84 Years | 2,845 | 7.3% |
| 85 Years and Over | 1,355 | 3.5% |
| Total | 38,919 | 100.0% |
Housing Finances in Lee s Summit
Median Income by Occupancy in Lee s Summit
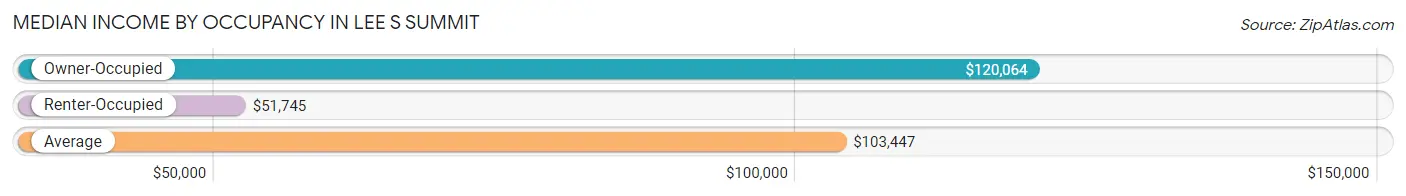
| Occupancy Type | # Households | Median Income |
| Owner-Occupied | 29,244 (75.1%) | $120,064 |
| Renter-Occupied | 9,675 (24.9%) | $51,745 |
| Average | 38,919 (100.0%) | $103,447 |
Occupancy by Householder Income Bracket in Lee s Summit
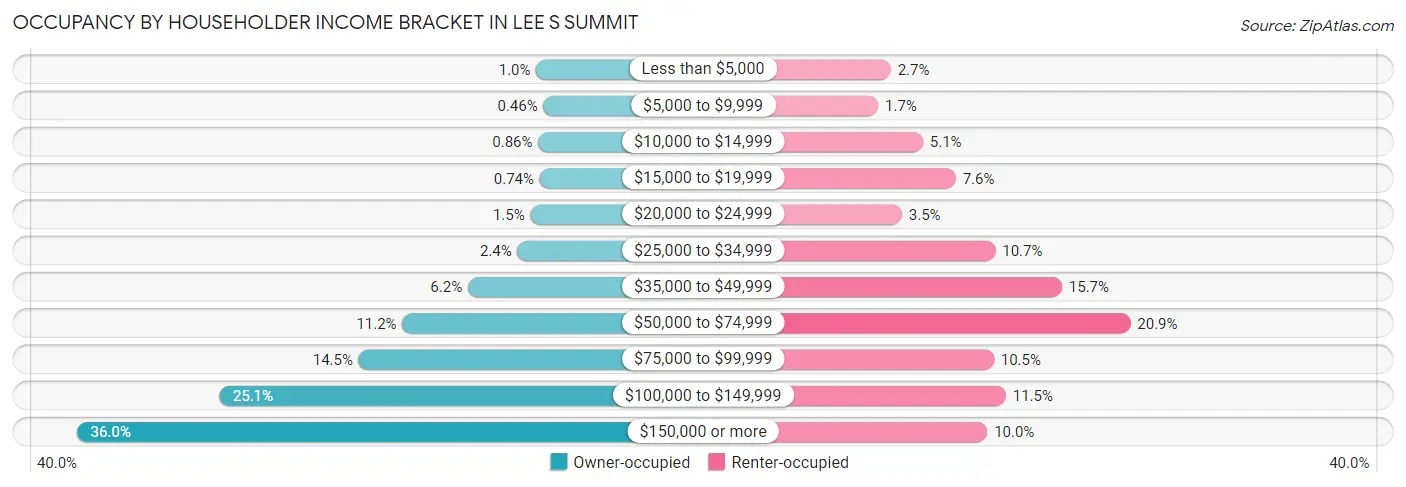
| Income Bracket | Owner-occupied | Renter-occupied |
| Less than $5,000 | 295 (1.0%) | 259 (2.7%) |
| $5,000 to $9,999 | 134 (0.5%) | 166 (1.7%) |
| $10,000 to $14,999 | 252 (0.9%) | 496 (5.1%) |
| $15,000 to $19,999 | 216 (0.7%) | 738 (7.6%) |
| $20,000 to $24,999 | 425 (1.5%) | 342 (3.5%) |
| $25,000 to $34,999 | 713 (2.4%) | 1,030 (10.6%) |
| $35,000 to $49,999 | 1,820 (6.2%) | 1,521 (15.7%) |
| $50,000 to $74,999 | 3,278 (11.2%) | 2,026 (20.9%) |
| $75,000 to $99,999 | 4,251 (14.5%) | 1,019 (10.5%) |
| $100,000 to $149,999 | 7,345 (25.1%) | 1,108 (11.5%) |
| $150,000 or more | 10,515 (36.0%) | 970 (10.0%) |
| Total | 29,244 (100.0%) | 9,675 (100.0%) |
Monthly Housing Cost Tiers in Lee s Summit
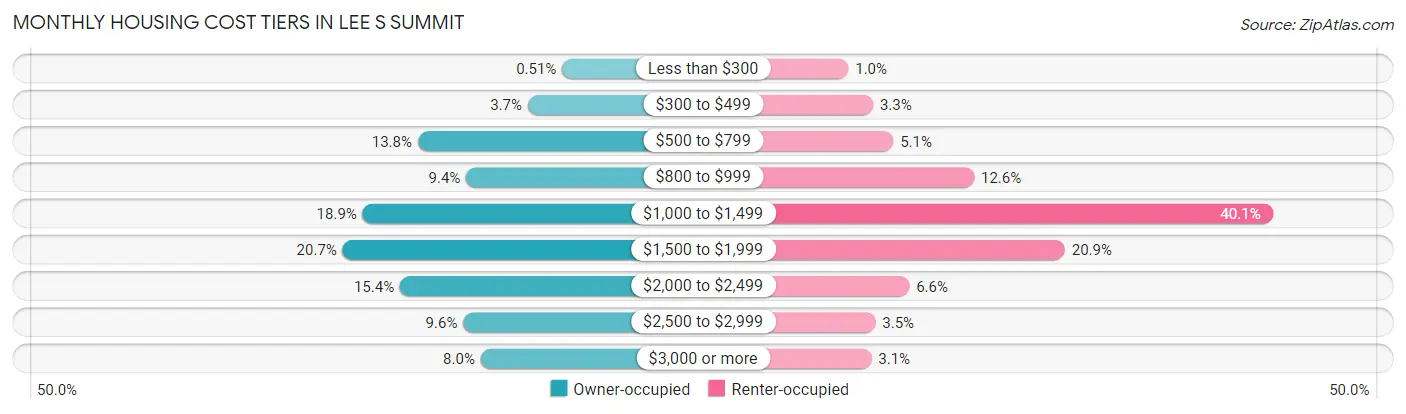
| Monthly Cost | Owner-occupied | Renter-occupied |
| Less than $300 | 149 (0.5%) | 97 (1.0%) |
| $300 to $499 | 1,073 (3.7%) | 316 (3.3%) |
| $500 to $799 | 4,037 (13.8%) | 497 (5.1%) |
| $800 to $999 | 2,734 (9.3%) | 1,217 (12.6%) |
| $1,000 to $1,499 | 5,521 (18.9%) | 3,875 (40.1%) |
| $1,500 to $1,999 | 6,059 (20.7%) | 2,025 (20.9%) |
| $2,000 to $2,499 | 4,514 (15.4%) | 640 (6.6%) |
| $2,500 to $2,999 | 2,814 (9.6%) | 338 (3.5%) |
| $3,000 or more | 2,343 (8.0%) | 302 (3.1%) |
| Total | 29,244 (100.0%) | 9,675 (100.0%) |
Physical Housing Characteristics in Lee s Summit
Housing Structures in Lee s Summit
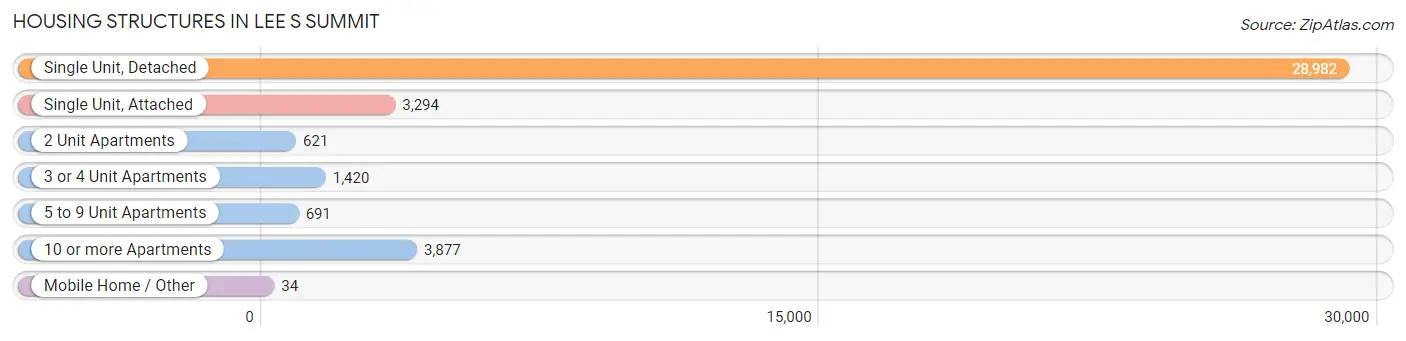
| Structure Type | # Housing Units | % Housing Units |
| Single Unit, Detached | 28,982 | 74.5% |
| Single Unit, Attached | 3,294 | 8.5% |
| 2 Unit Apartments | 621 | 1.6% |
| 3 or 4 Unit Apartments | 1,420 | 3.6% |
| 5 to 9 Unit Apartments | 691 | 1.8% |
| 10 or more Apartments | 3,877 | 10.0% |
| Mobile Home / Other | 34 | 0.1% |
| Total | 38,919 | 100.0% |
Housing Structures by Occupancy in Lee s Summit
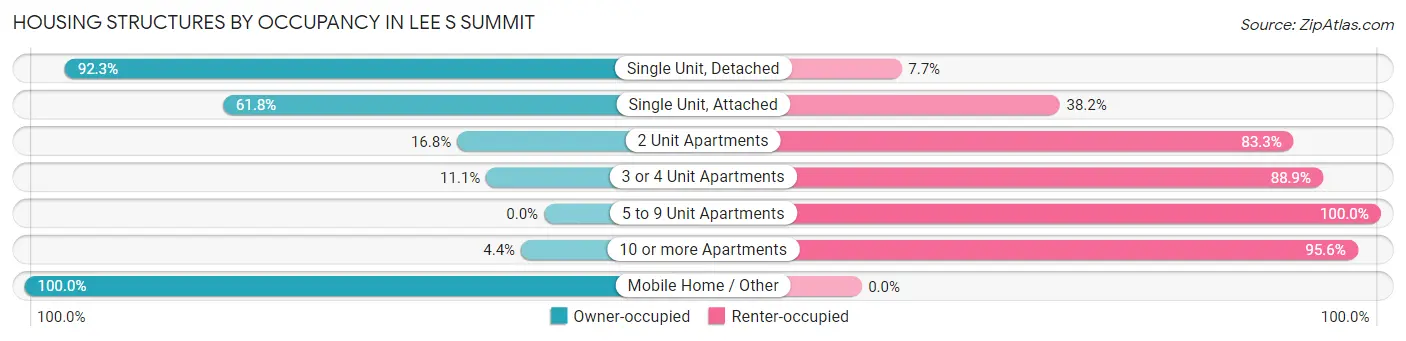
| Structure Type | Owner-occupied | Renter-occupied |
| Single Unit, Detached | 26,740 (92.3%) | 2,242 (7.7%) |
| Single Unit, Attached | 2,036 (61.8%) | 1,258 (38.2%) |
| 2 Unit Apartments | 104 (16.8%) | 517 (83.3%) |
| 3 or 4 Unit Apartments | 158 (11.1%) | 1,262 (88.9%) |
| 5 to 9 Unit Apartments | 0 (0.0%) | 691 (100.0%) |
| 10 or more Apartments | 172 (4.4%) | 3,705 (95.6%) |
| Mobile Home / Other | 34 (100.0%) | 0 (0.0%) |
| Total | 29,244 (75.1%) | 9,675 (24.9%) |
Housing Structures by Number of Rooms in Lee s Summit
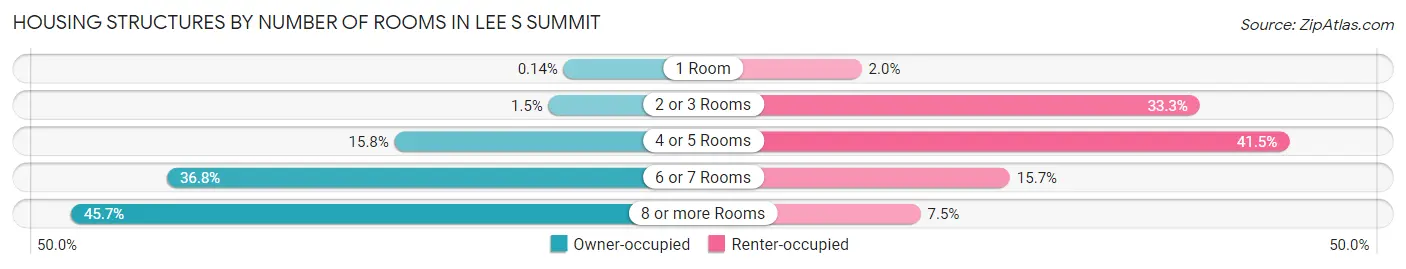
| Number of Rooms | Owner-occupied | Renter-occupied |
| 1 Room | 41 (0.1%) | 194 (2.0%) |
| 2 or 3 Rooms | 448 (1.5%) | 3,219 (33.3%) |
| 4 or 5 Rooms | 4,616 (15.8%) | 4,019 (41.5%) |
| 6 or 7 Rooms | 10,771 (36.8%) | 1,521 (15.7%) |
| 8 or more Rooms | 13,368 (45.7%) | 722 (7.5%) |
| Total | 29,244 (100.0%) | 9,675 (100.0%) |
Housing Structure by Heating Type in Lee s Summit
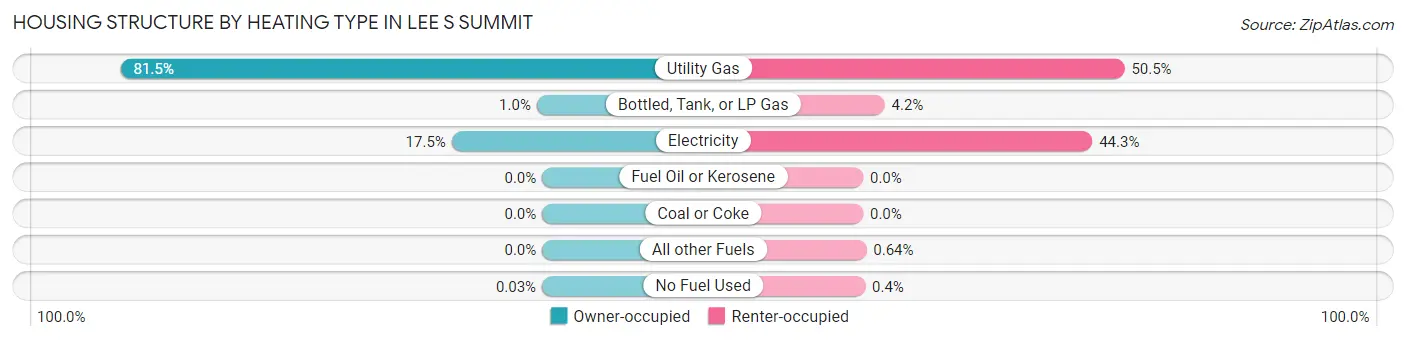
| Heating Type | Owner-occupied | Renter-occupied |
| Utility Gas | 23,818 (81.5%) | 4,887 (50.5%) |
| Bottled, Tank, or LP Gas | 305 (1.0%) | 402 (4.2%) |
| Electricity | 5,112 (17.5%) | 4,285 (44.3%) |
| Fuel Oil or Kerosene | 0 (0.0%) | 0 (0.0%) |
| Coal or Coke | 0 (0.0%) | 0 (0.0%) |
| All other Fuels | 0 (0.0%) | 62 (0.6%) |
| No Fuel Used | 9 (0.0%) | 39 (0.4%) |
| Total | 29,244 (100.0%) | 9,675 (100.0%) |
Household Vehicle Usage in Lee s Summit
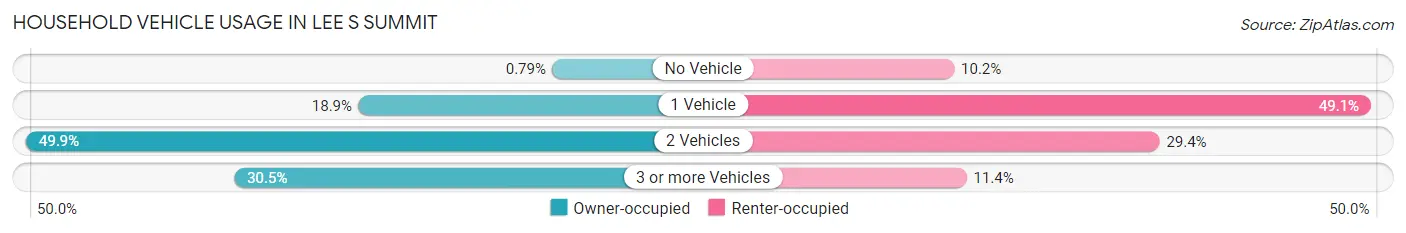
| Vehicles per Household | Owner-occupied | Renter-occupied |
| No Vehicle | 230 (0.8%) | 986 (10.2%) |
| 1 Vehicle | 5,524 (18.9%) | 4,750 (49.1%) |
| 2 Vehicles | 14,586 (49.9%) | 2,841 (29.4%) |
| 3 or more Vehicles | 8,904 (30.4%) | 1,098 (11.4%) |
| Total | 29,244 (100.0%) | 9,675 (100.0%) |
Real Estate & Mortgages in Lee s Summit
Real Estate and Mortgage Overview in Lee s Summit
| Characteristic | Without Mortgage | With Mortgage |
| Housing Units | 8,329 | 20,915 |
| Median Property Value | $276,000 | $296,700 |
| Median Household Income | $91,228 | $8,486 |
| Monthly Housing Costs | $730 | $2,335 |
| Real Estate Taxes | $3,537 | $224 |
Property Value by Mortgage Status in Lee s Summit
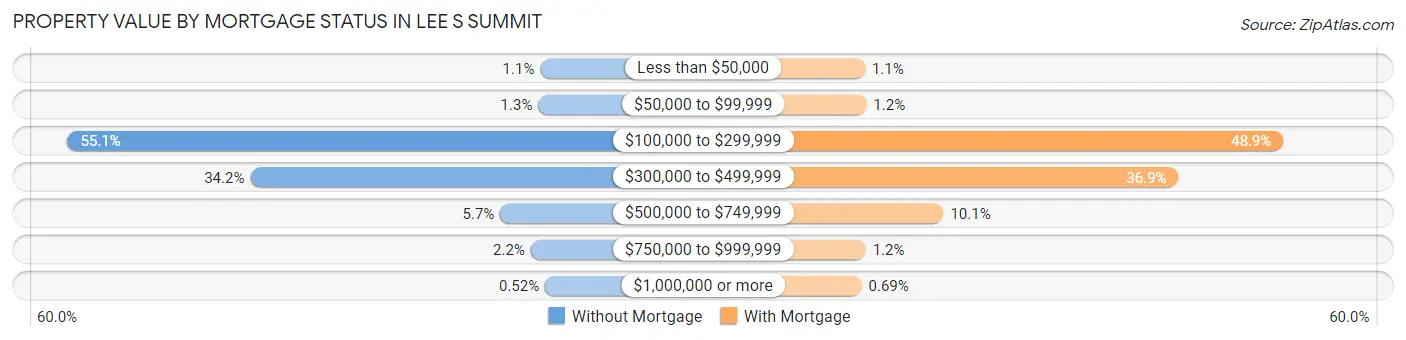
| Property Value | Without Mortgage | With Mortgage |
| Less than $50,000 | 89 (1.1%) | 225 (1.1%) |
| $50,000 to $99,999 | 108 (1.3%) | 259 (1.2%) |
| $100,000 to $299,999 | 4,589 (55.1%) | 10,226 (48.9%) |
| $300,000 to $499,999 | 2,849 (34.2%) | 7,717 (36.9%) |
| $500,000 to $749,999 | 471 (5.7%) | 2,101 (10.1%) |
| $750,000 to $999,999 | 180 (2.2%) | 243 (1.2%) |
| $1,000,000 or more | 43 (0.5%) | 144 (0.7%) |
| Total | 8,329 (100.0%) | 20,915 (100.0%) |
Household Income by Mortgage Status in Lee s Summit
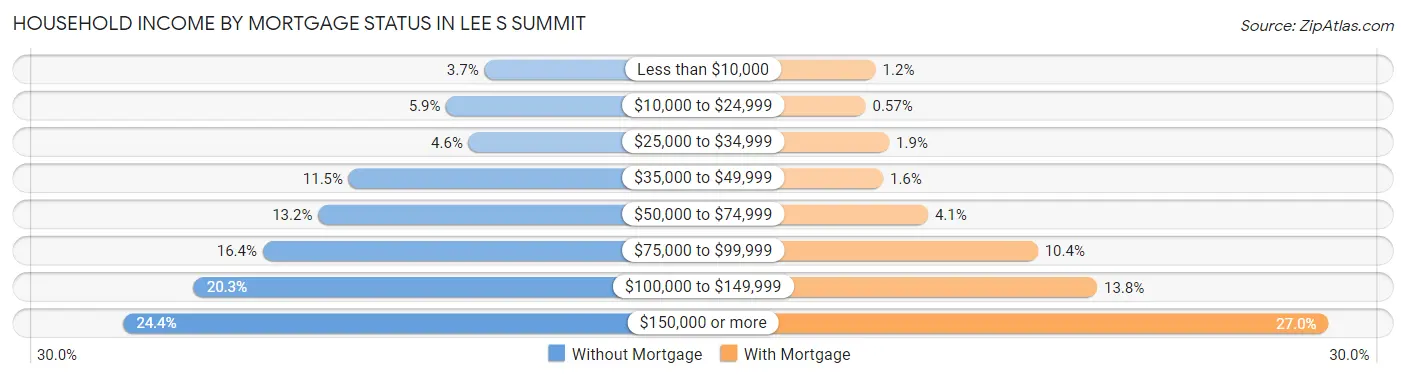
| Household Income | Without Mortgage | With Mortgage |
| Less than $10,000 | 310 (3.7%) | 241 (1.1%) |
| $10,000 to $24,999 | 491 (5.9%) | 119 (0.6%) |
| $25,000 to $34,999 | 385 (4.6%) | 402 (1.9%) |
| $35,000 to $49,999 | 955 (11.5%) | 328 (1.6%) |
| $50,000 to $74,999 | 1,101 (13.2%) | 865 (4.1%) |
| $75,000 to $99,999 | 1,365 (16.4%) | 2,177 (10.4%) |
| $100,000 to $149,999 | 1,693 (20.3%) | 2,886 (13.8%) |
| $150,000 or more | 2,029 (24.4%) | 5,652 (27.0%) |
| Total | 8,329 (100.0%) | 20,915 (100.0%) |
Property Value to Household Income Ratio in Lee s Summit
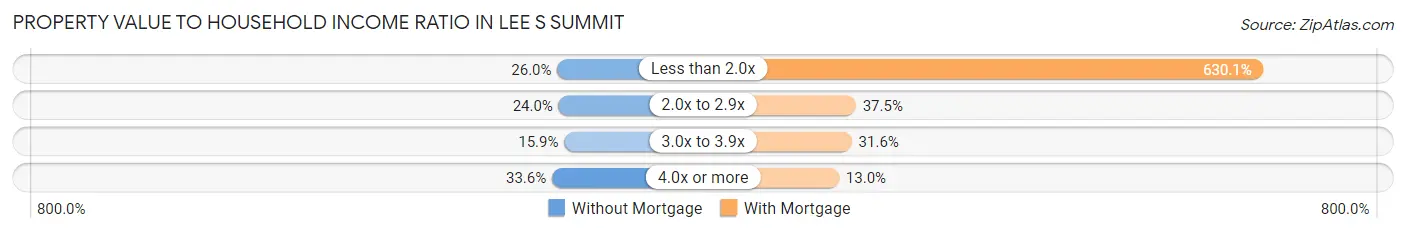
| Value-to-Income Ratio | Without Mortgage | With Mortgage |
| Less than 2.0x | 2,162 (26.0%) | 131,789 (630.1%) |
| 2.0x to 2.9x | 2,000 (24.0%) | 7,845 (37.5%) |
| 3.0x to 3.9x | 1,323 (15.9%) | 6,611 (31.6%) |
| 4.0x or more | 2,802 (33.6%) | 2,725 (13.0%) |
| Total | 8,329 (100.0%) | 20,915 (100.0%) |
Real Estate Taxes by Mortgage Status in Lee s Summit
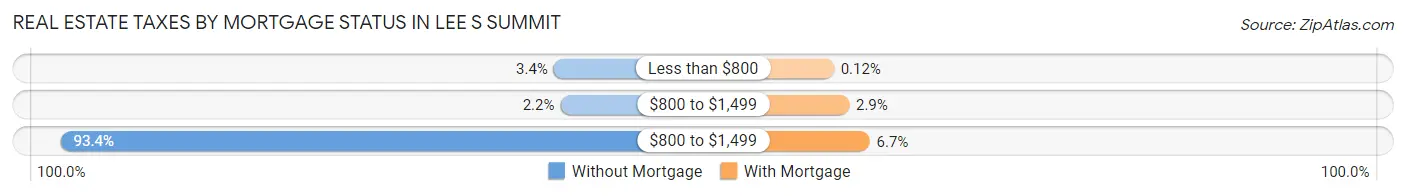
| Property Taxes | Without Mortgage | With Mortgage |
| Less than $800 | 280 (3.4%) | 26 (0.1%) |
| $800 to $1,499 | 179 (2.1%) | 611 (2.9%) |
| $800 to $1,499 | 7,780 (93.4%) | 1,397 (6.7%) |
| Total | 8,329 (100.0%) | 20,915 (100.0%) |
Health & Disability in Lee s Summit
Health Insurance Coverage by Age in Lee s Summit
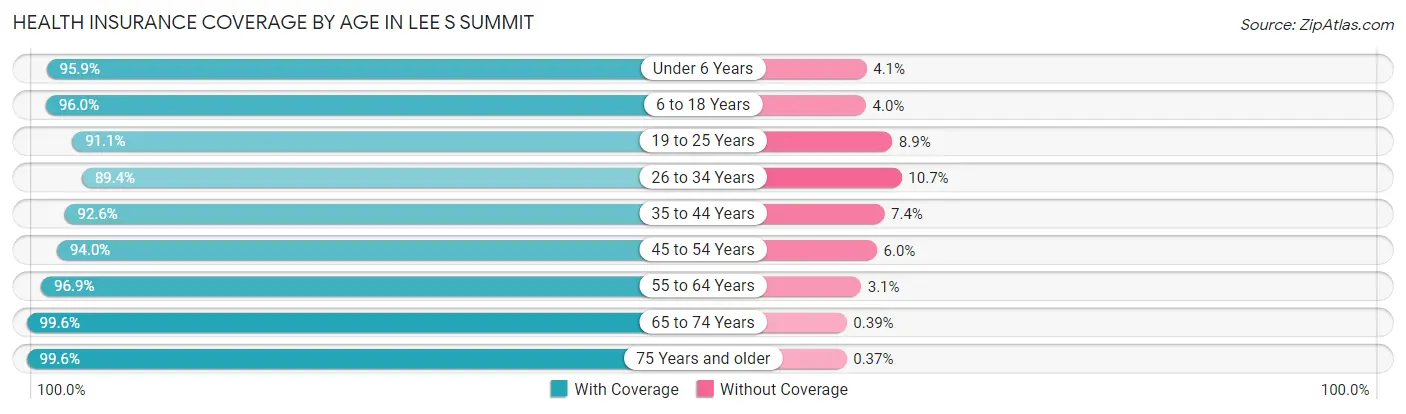
| Age Bracket | With Coverage | Without Coverage |
| Under 6 Years | 6,811 (95.9%) | 291 (4.1%) |
| 6 to 18 Years | 19,274 (96.0%) | 797 (4.0%) |
| 19 to 25 Years | 6,198 (91.1%) | 604 (8.9%) |
| 26 to 34 Years | 9,260 (89.3%) | 1,104 (10.6%) |
| 35 to 44 Years | 14,025 (92.6%) | 1,126 (7.4%) |
| 45 to 54 Years | 12,250 (94.0%) | 786 (6.0%) |
| 55 to 64 Years | 12,827 (96.9%) | 408 (3.1%) |
| 65 to 74 Years | 8,575 (99.6%) | 34 (0.4%) |
| 75 Years and older | 6,398 (99.6%) | 24 (0.4%) |
| Total | 95,618 (94.9%) | 5,174 (5.1%) |
Health Insurance Coverage by Citizenship Status in Lee s Summit
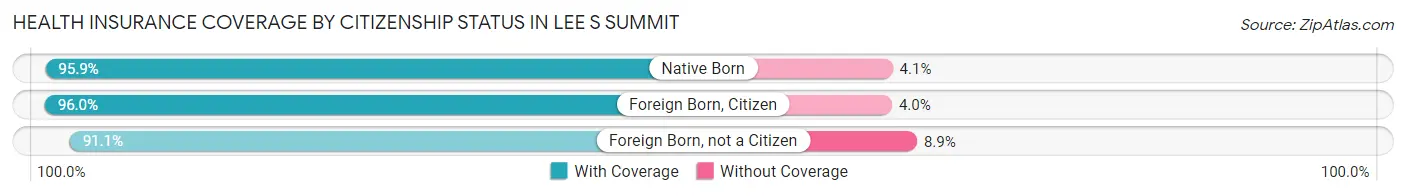
| Citizenship Status | With Coverage | Without Coverage |
| Native Born | 6,811 (95.9%) | 291 (4.1%) |
| Foreign Born, Citizen | 19,274 (96.0%) | 797 (4.0%) |
| Foreign Born, not a Citizen | 6,198 (91.1%) | 604 (8.9%) |
Health Insurance Coverage by Household Income in Lee s Summit
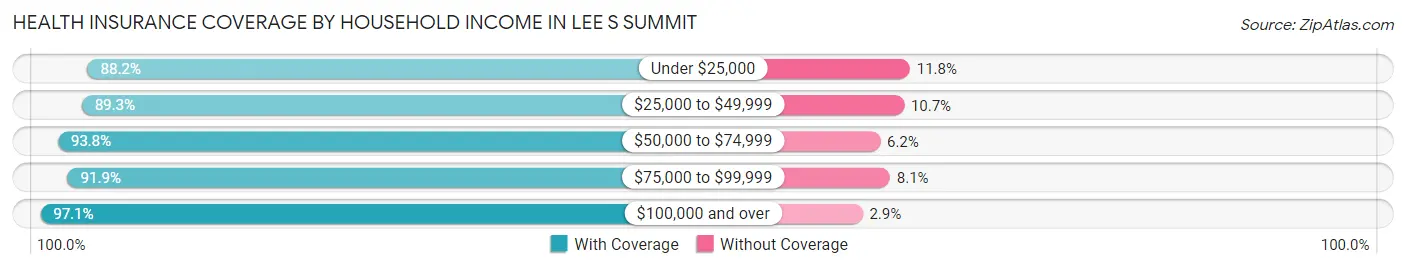
| Household Income | With Coverage | Without Coverage |
| Under $25,000 | 4,852 (88.2%) | 650 (11.8%) |
| $25,000 to $49,999 | 7,914 (89.3%) | 949 (10.7%) |
| $50,000 to $74,999 | 10,334 (93.8%) | 687 (6.2%) |
| $75,000 to $99,999 | 11,922 (91.9%) | 1,047 (8.1%) |
| $100,000 and over | 60,543 (97.1%) | 1,834 (2.9%) |
Public vs Private Health Insurance Coverage by Age in Lee s Summit
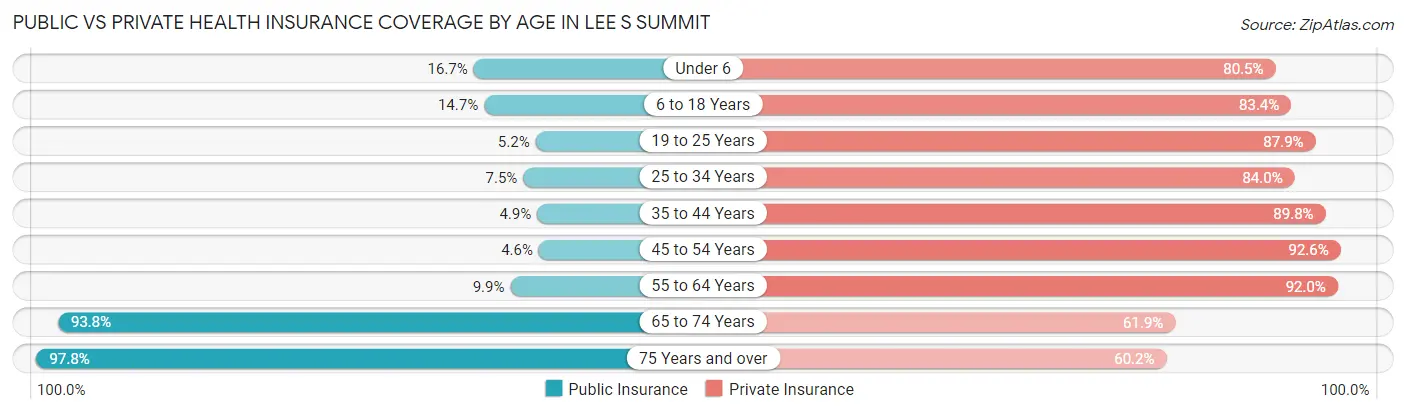
| Age Bracket | Public Insurance | Private Insurance |
| Under 6 | 1,183 (16.7%) | 5,715 (80.5%) |
| 6 to 18 Years | 2,956 (14.7%) | 16,737 (83.4%) |
| 19 to 25 Years | 352 (5.2%) | 5,979 (87.9%) |
| 25 to 34 Years | 773 (7.5%) | 8,708 (84.0%) |
| 35 to 44 Years | 739 (4.9%) | 13,599 (89.8%) |
| 45 to 54 Years | 593 (4.5%) | 12,067 (92.6%) |
| 55 to 64 Years | 1,303 (9.9%) | 12,181 (92.0%) |
| 65 to 74 Years | 8,078 (93.8%) | 5,326 (61.9%) |
| 75 Years and over | 6,281 (97.8%) | 3,868 (60.2%) |
| Total | 22,258 (22.1%) | 84,180 (83.5%) |
Disability Status by Sex by Age in Lee s Summit
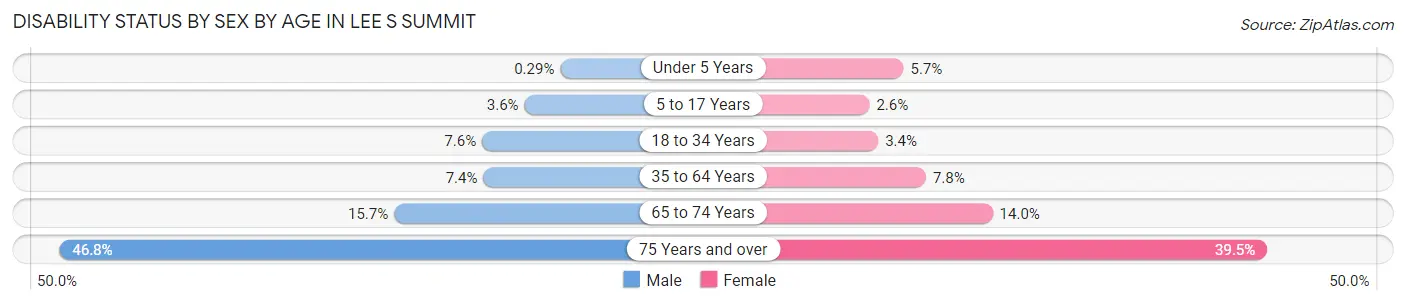
| Age Bracket | Male | Female |
| Under 5 Years | 8 (0.3%) | 163 (5.7%) |
| 5 to 17 Years | 381 (3.6%) | 255 (2.6%) |
| 18 to 34 Years | 658 (7.5%) | 323 (3.4%) |
| 35 to 64 Years | 1,497 (7.4%) | 1,662 (7.8%) |
| 65 to 74 Years | 642 (15.7%) | 633 (14.0%) |
| 75 Years and over | 1,244 (46.8%) | 1,485 (39.5%) |
Disability Class by Sex by Age in Lee s Summit
Disability Class: Hearing Difficulty
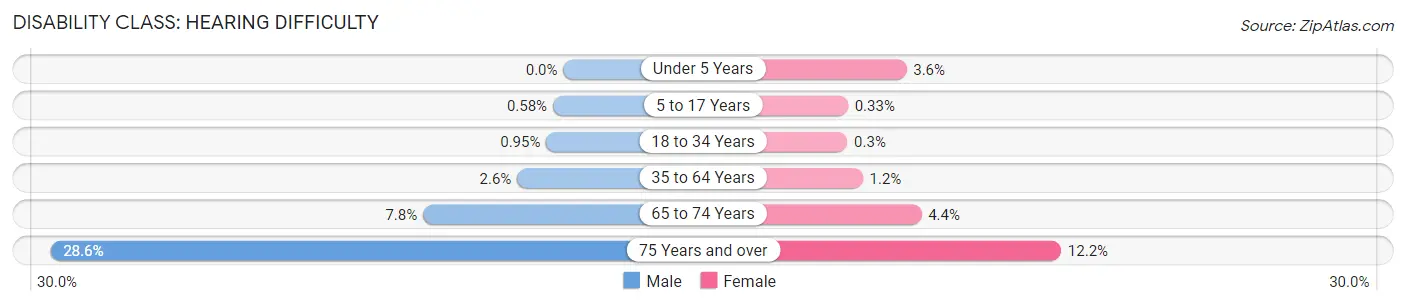
| Age Bracket | Male | Female |
| Under 5 Years | 0 (0.0%) | 102 (3.6%) |
| 5 to 17 Years | 61 (0.6%) | 33 (0.3%) |
| 18 to 34 Years | 83 (0.9%) | 29 (0.3%) |
| 35 to 64 Years | 517 (2.6%) | 247 (1.2%) |
| 65 to 74 Years | 319 (7.8%) | 200 (4.4%) |
| 75 Years and over | 760 (28.6%) | 459 (12.2%) |
Disability Class: Vision Difficulty
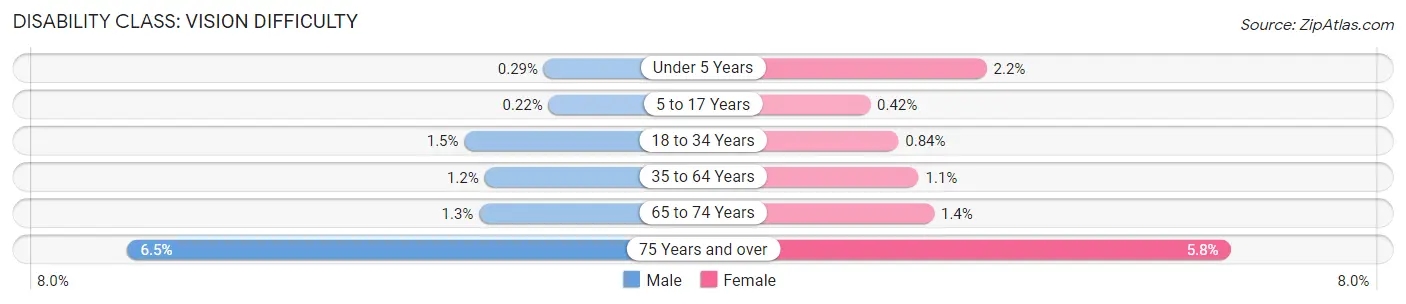
| Age Bracket | Male | Female |
| Under 5 Years | 8 (0.3%) | 61 (2.1%) |
| 5 to 17 Years | 23 (0.2%) | 42 (0.4%) |
| 18 to 34 Years | 128 (1.5%) | 80 (0.8%) |
| 35 to 64 Years | 235 (1.2%) | 243 (1.1%) |
| 65 to 74 Years | 51 (1.3%) | 62 (1.4%) |
| 75 Years and over | 172 (6.5%) | 217 (5.8%) |
Disability Class: Cognitive Difficulty
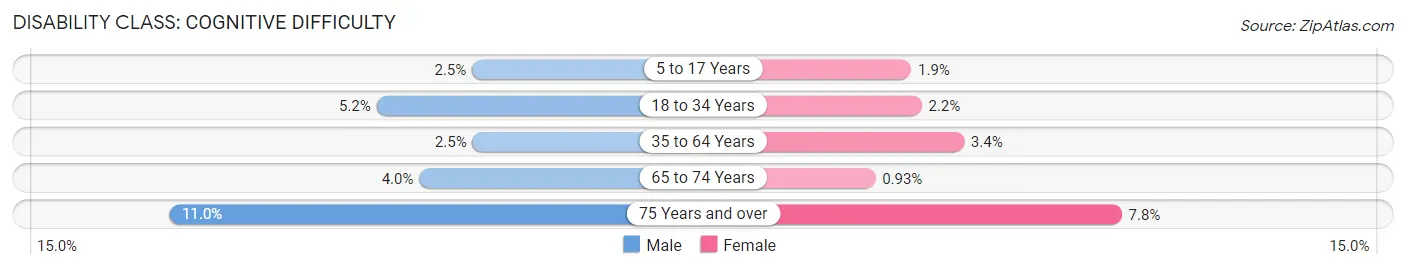
| Age Bracket | Male | Female |
| 5 to 17 Years | 268 (2.5%) | 191 (1.9%) |
| 18 to 34 Years | 453 (5.2%) | 212 (2.2%) |
| 35 to 64 Years | 509 (2.5%) | 723 (3.4%) |
| 65 to 74 Years | 164 (4.0%) | 42 (0.9%) |
| 75 Years and over | 292 (11.0%) | 293 (7.8%) |
Disability Class: Ambulatory Difficulty
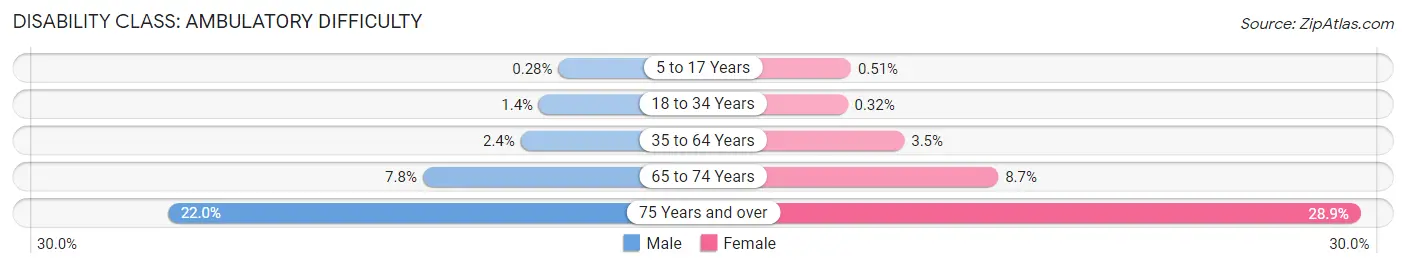
| Age Bracket | Male | Female |
| 5 to 17 Years | 30 (0.3%) | 51 (0.5%) |
| 18 to 34 Years | 119 (1.4%) | 31 (0.3%) |
| 35 to 64 Years | 480 (2.4%) | 740 (3.5%) |
| 65 to 74 Years | 320 (7.8%) | 394 (8.7%) |
| 75 Years and over | 586 (22.0%) | 1,087 (28.9%) |
Disability Class: Self-Care Difficulty
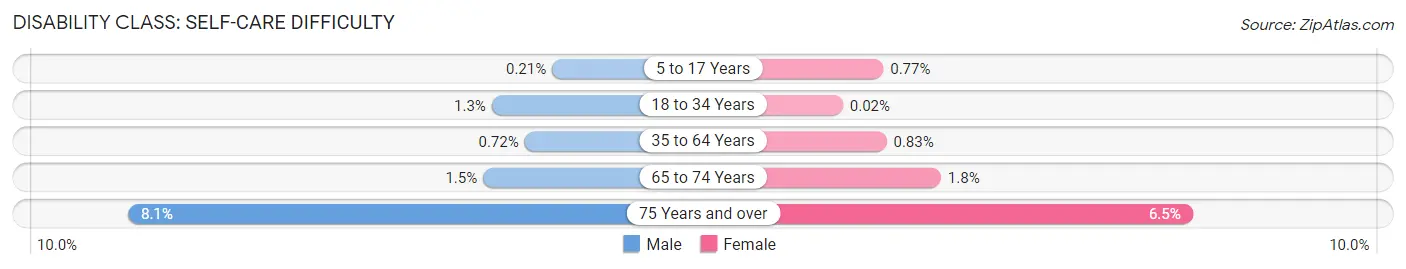
| Age Bracket | Male | Female |
| 5 to 17 Years | 22 (0.2%) | 76 (0.8%) |
| 18 to 34 Years | 116 (1.3%) | 2 (0.0%) |
| 35 to 64 Years | 145 (0.7%) | 177 (0.8%) |
| 65 to 74 Years | 61 (1.5%) | 83 (1.8%) |
| 75 Years and over | 215 (8.1%) | 245 (6.5%) |
Technology Access in Lee s Summit
Computing Device Access in Lee s Summit
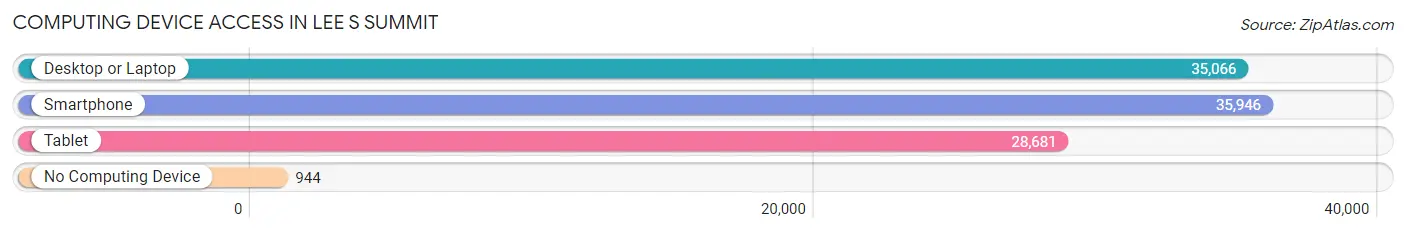
| Device Type | # Households | % Households |
| Desktop or Laptop | 35,066 | 90.1% |
| Smartphone | 35,946 | 92.4% |
| Tablet | 28,681 | 73.7% |
| No Computing Device | 944 | 2.4% |
| Total | 38,919 | 100.0% |
Internet Access in Lee s Summit
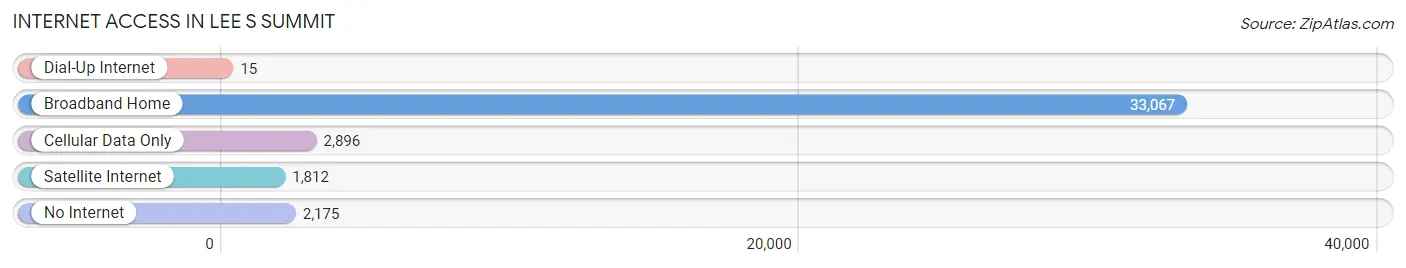
| Internet Type | # Households | % Households |
| Dial-Up Internet | 15 | 0.0% |
| Broadband Home | 33,067 | 85.0% |
| Cellular Data Only | 2,896 | 7.4% |
| Satellite Internet | 1,812 | 4.7% |
| No Internet | 2,175 | 5.6% |
| Total | 38,919 | 100.0% |
Lee s Summit Summary
Lee’s Summit is a city located in Jackson County, Missouri, United States. It is part of the Kansas City metropolitan area and is the sixth largest city in the state. The population was estimated to be around 94,000 in 2019.
History
The area that is now Lee’s Summit was first settled in the early 1800s by settlers from Kentucky and Tennessee. The town was originally known as Strother, named after the first settler, Benjamin Strother. In 1868, the town was renamed to Lee’s Summit after a nearby hill that was named after Dr. Pleasant Lea, a prominent local doctor.
The city was officially incorporated in 1868 and has since grown to become the sixth largest city in the state. The city has a rich history and has been home to many notable figures, including former President Harry S. Truman, who was born in Lamar, Missouri, just outside of Lee’s Summit.
Geography
Lee’s Summit is located in the western part of Jackson County, Missouri. It is situated on the western edge of the Missouri River Valley, and is bordered by the cities of Independence, Blue Springs, and Raytown. The city covers an area of approximately 32 square miles and has an elevation of 890 feet.
The city is located in the humid continental climate zone, with hot, humid summers and cold, dry winters. The average annual temperature is around 54 degrees Fahrenheit, with an average high of around 87 degrees in the summer and an average low of around 28 degrees in the winter.
Economy
Lee’s Summit has a strong and diverse economy. The city is home to a number of large employers, including Cerner Corporation, DST Systems, and the Lee’s Summit Medical Center. The city also has a thriving retail sector, with a number of shopping centers and malls located in the area.
The city is also home to a number of educational institutions, including the University of Central Missouri, Metropolitan Community College, and the Lee’s Summit R-7 School District.
Demographics
As of the 2019 census, the population of Lee’s Summit was estimated to be around 94,000. The city has a diverse population, with the largest racial group being White (77.3%), followed by African American (13.2%), Hispanic or Latino (4.7%), and Asian (2.7%). The median household income in the city is around $72,000, and the median home value is around $200,000.
Lee’s Summit is a vibrant and growing city with a rich history and a strong economy. The city is home to a diverse population and is a great place to live, work, and play.
Common Questions
What is Per Capita Income in Lee s Summit?
Per Capita income in Lee s Summit is $47,879.
What is the Median Family Income in Lee s Summit?
Median Family Income in Lee s Summit is $122,705.
What is the Median Household income in Lee s Summit?
Median Household Income in Lee s Summit is $103,447.
What is Income or Wage Gap in Lee s Summit?
Income or Wage Gap in Lee s Summit is 29.2%.
Women in Lee s Summit earn 70.8 cents for every dollar earned by a man.
What is Inequality or Gini Index in Lee s Summit?
Inequality or Gini Index in Lee s Summit is 0.40.
What is the Total Population of Lee s Summit?
Total Population of Lee s Summit is 101,728.
What is the Total Male Population of Lee s Summit?
Total Male Population of Lee s Summit is 49,523.
What is the Total Female Population of Lee s Summit?
Total Female Population of Lee s Summit is 52,205.
What is the Ratio of Males per 100 Females in Lee s Summit?
There are 94.86 Males per 100 Females in Lee s Summit.
What is the Ratio of Females per 100 Males in Lee s Summit?
There are 105.42 Females per 100 Males in Lee s Summit.
What is the Median Population Age in Lee s Summit?
Median Population Age in Lee s Summit is 38.6 Years.
What is the Average Family Size in Lee s Summit
Average Family Size in Lee s Summit is 3.1 People.
What is the Average Household Size in Lee s Summit
Average Household Size in Lee s Summit is 2.6 People.
How Large is the Labor Force in Lee s Summit?
There are 55,748 People in the Labor Forcein in Lee s Summit.
What is the Percentage of People in the Labor Force in Lee s Summit?
70.4% of People are in the Labor Force in Lee s Summit.
What is the Unemployment Rate in Lee s Summit?
Unemployment Rate in Lee s Summit is 3.8%.