Weldon Spring, MO Map & Demographics
Weldon Spring Map
Weldon Spring Overview
$73,104
PER CAPITA INCOME
$173,141
AVG FAMILY INCOME
$143,389
AVG HOUSEHOLD INCOME
35.8%
WAGE / INCOME GAP [ % ]
64.2¢/ $1
WAGE / INCOME GAP [ $ ]
0.45
INEQUALITY / GINI INDEX
5,320
TOTAL POPULATION
2,629
MALE POPULATION
2,691
FEMALE POPULATION
97.70
MALES / 100 FEMALES
102.36
FEMALES / 100 MALES
56.9
MEDIAN AGE
2.8
AVG FAMILY SIZE
2.4
AVG HOUSEHOLD SIZE
2,366
LABOR FORCE [ PEOPLE ]
50.3%
PERCENT IN LABOR FORCE
6.3%
UNEMPLOYMENT RATE
Income in Weldon Spring
Income Overview in Weldon Spring
Per Capita Income in Weldon Spring is $73,104, while median incomes of families and households are $173,141 and $143,389 respectively.
| Characteristic | Number | Measure |
| Per Capita Income | 5,320 | $73,104 |
| Median Family Income | 1,684 | $173,141 |
| Mean Family Income | 1,684 | $213,492 |
| Median Household Income | 2,162 | $143,389 |
| Mean Household Income | 2,162 | $180,793 |
| Income Deficit | 1,684 | $0 |
| Wage / Income Gap (%) | 5,320 | 35.81% |
| Wage / Income Gap ($) | 5,320 | 64.19¢ per $1 |
| Gini / Inequality Index | 5,320 | 0.45 |
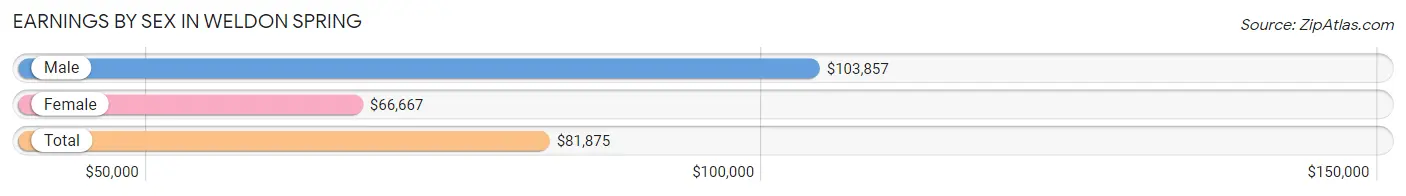
Earnings by Sex in Weldon Spring
Average Earnings in Weldon Spring are $81,875, $103,857 for men and $66,667 for women, a difference of 35.8%.
| Sex | Number | Average Earnings |
| Male | 1,438 (55.3%) | $103,857 |
| Female | 1,160 (44.7%) | $66,667 |
| Total | 2,598 (100.0%) | $81,875 |
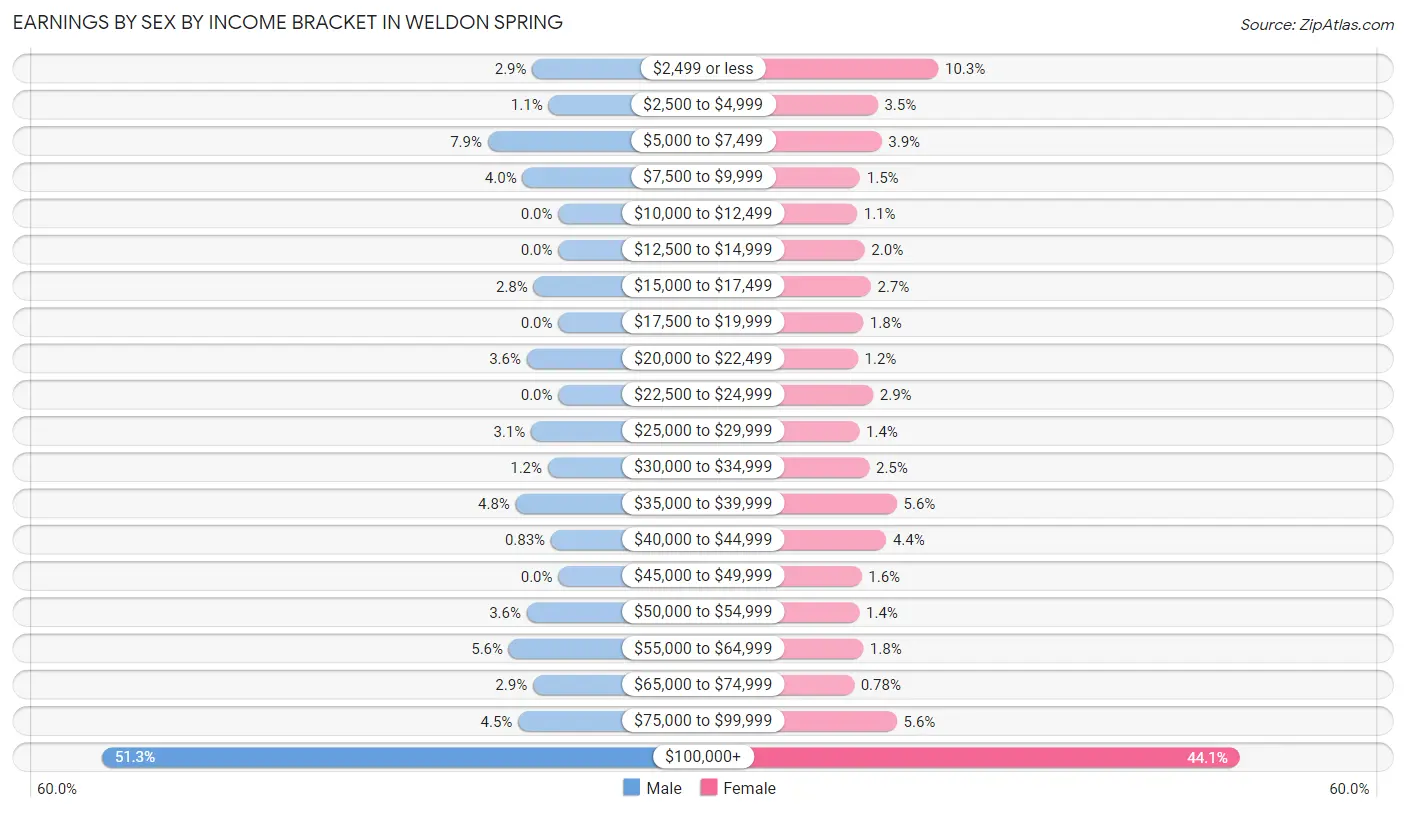
Earnings by Sex by Income Bracket in Weldon Spring
The most common earnings brackets in Weldon Spring are $100,000+ for men (738 | 51.3%) and $100,000+ for women (512 | 44.1%).
| Income | Male | Female |
| $2,499 or less | 42 (2.9%) | 119 (10.3%) |
| $2,500 to $4,999 | 16 (1.1%) | 40 (3.5%) |
| $5,000 to $7,499 | 114 (7.9%) | 45 (3.9%) |
| $7,500 to $9,999 | 58 (4.0%) | 17 (1.5%) |
| $10,000 to $12,499 | 0 (0.0%) | 13 (1.1%) |
| $12,500 to $14,999 | 0 (0.0%) | 23 (2.0%) |
| $15,000 to $17,499 | 40 (2.8%) | 31 (2.7%) |
| $17,500 to $19,999 | 0 (0.0%) | 21 (1.8%) |
| $20,000 to $22,499 | 51 (3.5%) | 14 (1.2%) |
| $22,500 to $24,999 | 0 (0.0%) | 34 (2.9%) |
| $25,000 to $29,999 | 44 (3.1%) | 16 (1.4%) |
| $30,000 to $34,999 | 17 (1.2%) | 29 (2.5%) |
| $35,000 to $39,999 | 69 (4.8%) | 65 (5.6%) |
| $40,000 to $44,999 | 12 (0.8%) | 51 (4.4%) |
| $45,000 to $49,999 | 0 (0.0%) | 19 (1.6%) |
| $50,000 to $54,999 | 51 (3.5%) | 16 (1.4%) |
| $55,000 to $64,999 | 80 (5.6%) | 21 (1.8%) |
| $65,000 to $74,999 | 41 (2.9%) | 9 (0.8%) |
| $75,000 to $99,999 | 65 (4.5%) | 65 (5.6%) |
| $100,000+ | 738 (51.3%) | 512 (44.1%) |
| Total | 1,438 (100.0%) | 1,160 (100.0%) |
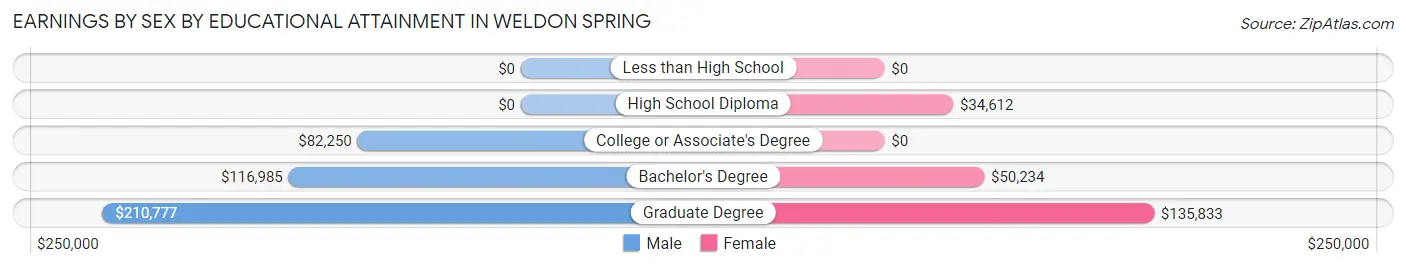
Earnings by Sex by Educational Attainment in Weldon Spring
Average earnings in Weldon Spring are $118,160 for men and $81,454 for women, a difference of 31.1%. Men with an educational attainment of graduate degree enjoy the highest average annual earnings of $210,777, while those with college or associate's degree education earn the least with $82,250. Women with an educational attainment of graduate degree earn the most with the average annual earnings of $135,833, while those with high school diploma education have the smallest earnings of $34,612.
| Educational Attainment | Male Income | Female Income |
| Less than High School | - | - |
| High School Diploma | - | - |
| College or Associate's Degree | $82,250 | $0 |
| Bachelor's Degree | $116,985 | $50,234 |
| Graduate Degree | $210,777 | $135,833 |
| Total | $118,160 | $81,454 |
Family Income in Weldon Spring
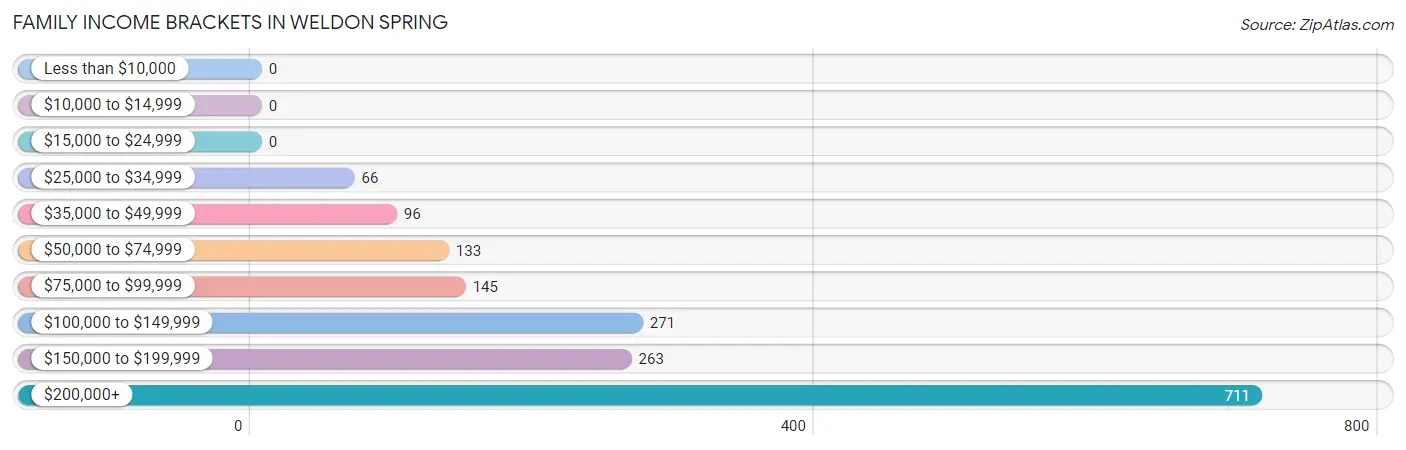
Family Income Brackets in Weldon Spring
According to the Weldon Spring family income data, there are 711 families falling into the $200,000+ income range, which is the most common income bracket and makes up 42.2% of all families.
| Income Bracket | # Families | % Families |
| Less than $10,000 | 0 | 0.0% |
| $10,000 to $14,999 | 0 | 0.0% |
| $15,000 to $24,999 | 0 | 0.0% |
| $25,000 to $34,999 | 66 | 3.9% |
| $35,000 to $49,999 | 96 | 5.7% |
| $50,000 to $74,999 | 133 | 7.9% |
| $75,000 to $99,999 | 145 | 8.6% |
| $100,000 to $149,999 | 271 | 16.1% |
| $150,000 to $199,999 | 263 | 15.6% |
| $200,000+ | 711 | 42.2% |
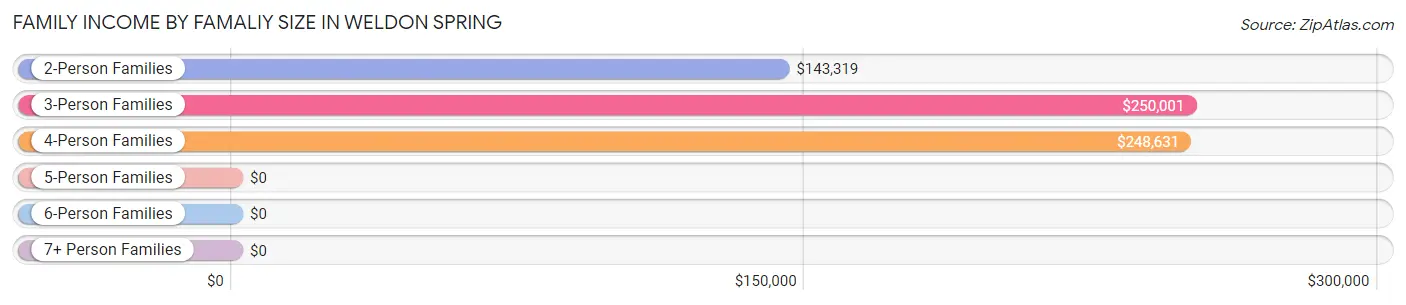
Family Income by Famaliy Size in Weldon Spring
3-person families (319 | 18.9%) account for the highest median family income in Weldon Spring with $250,001 per family, while 3-person families (319 | 18.9%) have the highest median income of $83,334 per family member.
| Income Bracket | # Families | Median Income |
| 2-Person Families | 945 (56.1%) | $143,319 |
| 3-Person Families | 319 (18.9%) | $250,001 |
| 4-Person Families | 299 (17.8%) | $248,631 |
| 5-Person Families | 64 (3.8%) | $0 |
| 6-Person Families | 7 (0.4%) | $0 |
| 7+ Person Families | 50 (3.0%) | $0 |
| Total | 1,684 (100.0%) | $173,141 |
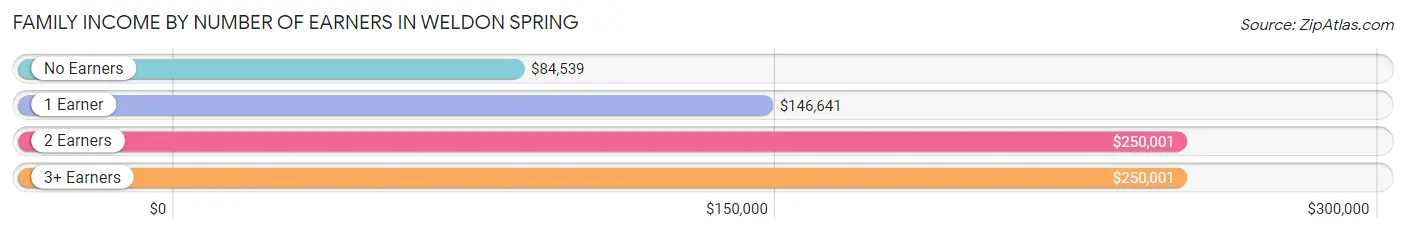
Family Income by Number of Earners in Weldon Spring
The median family income in Weldon Spring is $173,141, with families comprising 2 earners (620) having the highest median family income of $250,001, while families with no earners (435) have the lowest median family income of $84,539, accounting for 36.8% and 25.8% of families, respectively.
| Number of Earners | # Families | Median Income |
| No Earners | 435 (25.8%) | $84,539 |
| 1 Earner | 401 (23.8%) | $146,641 |
| 2 Earners | 620 (36.8%) | $250,001 |
| 3+ Earners | 228 (13.5%) | $250,001 |
| Total | 1,684 (100.0%) | $173,141 |
Household Income in Weldon Spring
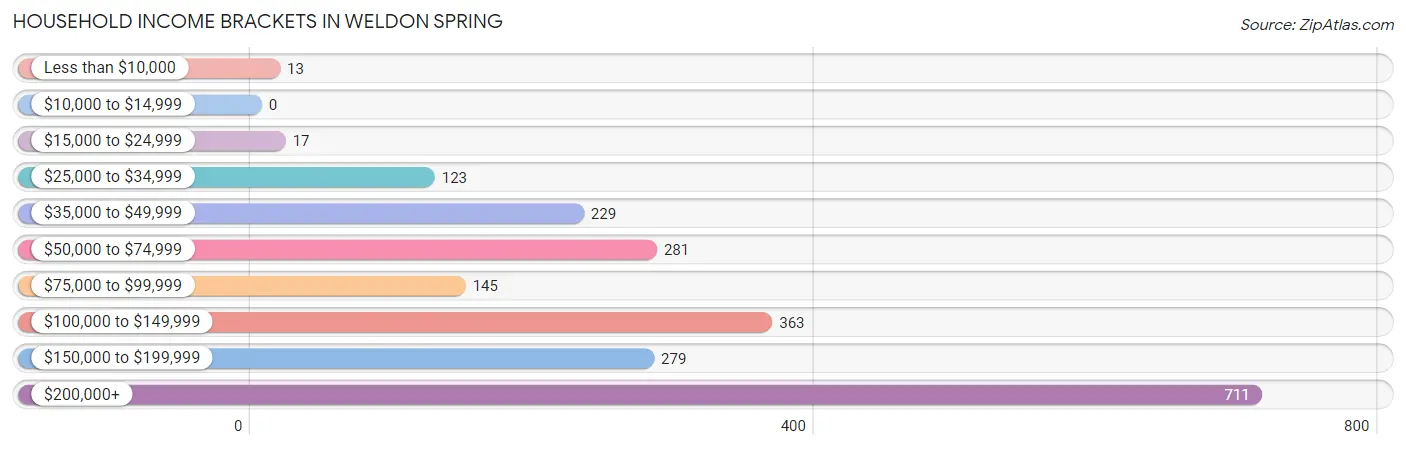
Household Income Brackets in Weldon Spring
With 711 households falling in the category, the $200,000+ income range is the most frequent in Weldon Spring, accounting for 32.9% of all households.
| Income Bracket | # Households | % Households |
| Less than $10,000 | 13 | 0.6% |
| $10,000 to $14,999 | 0 | 0.0% |
| $15,000 to $24,999 | 17 | 0.8% |
| $25,000 to $34,999 | 123 | 5.7% |
| $35,000 to $49,999 | 229 | 10.6% |
| $50,000 to $74,999 | 281 | 13.0% |
| $75,000 to $99,999 | 145 | 6.7% |
| $100,000 to $149,999 | 363 | 16.8% |
| $150,000 to $199,999 | 279 | 12.9% |
| $200,000+ | 711 | 32.9% |
Household Income by Householder Age in Weldon Spring
The median household income in Weldon Spring is $143,389, with the highest median household income of $199,911 found in the 45 to 64 years age bracket for the primary householder. A total of 1,058 households (48.9%) fall into this category.
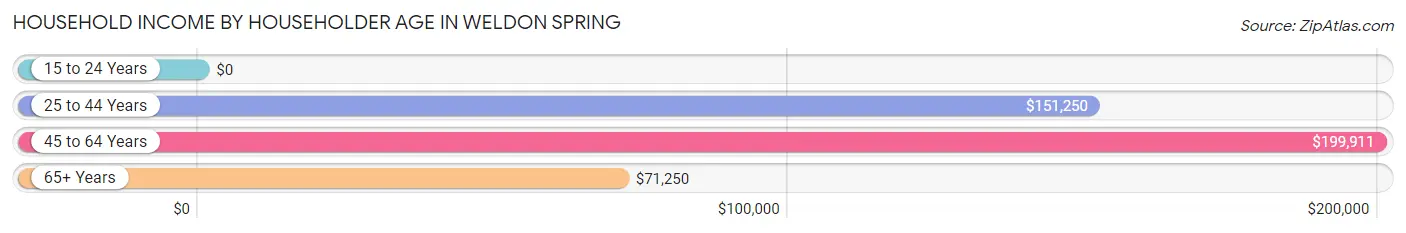
| Income Bracket | # Households | Median Income |
| 15 to 24 Years | 0 (0.0%) | $0 |
| 25 to 44 Years | 204 (9.4%) | $151,250 |
| 45 to 64 Years | 1,058 (48.9%) | $199,911 |
| 65+ Years | 900 (41.6%) | $71,250 |
| Total | 2,162 (100.0%) | $143,389 |
Poverty in Weldon Spring
Income Below Poverty by Sex and Age in Weldon Spring
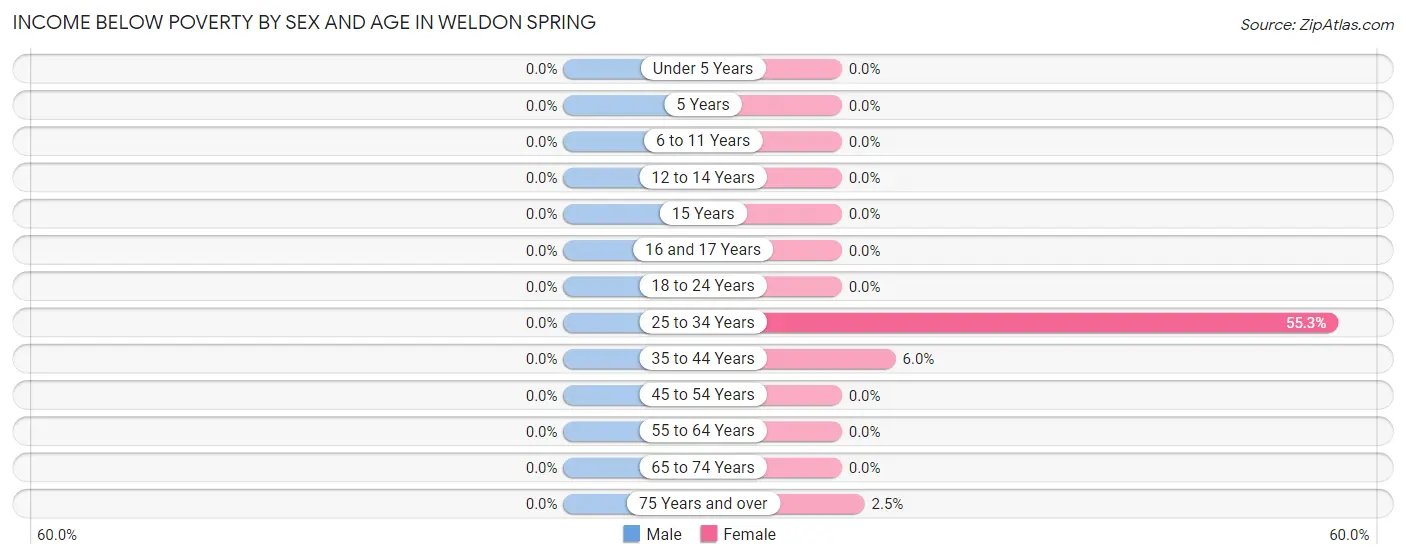
| Age Bracket | Male | Female |
| Under 5 Years | 0 (0.0%) | 0 (0.0%) |
| 5 Years | 0 (0.0%) | 0 (0.0%) |
| 6 to 11 Years | 0 (0.0%) | 0 (0.0%) |
| 12 to 14 Years | 0 (0.0%) | 0 (0.0%) |
| 15 Years | 0 (0.0%) | 0 (0.0%) |
| 16 and 17 Years | 0 (0.0%) | 0 (0.0%) |
| 18 to 24 Years | 0 (0.0%) | 0 (0.0%) |
| 25 to 34 Years | 0 (0.0%) | 21 (55.3%) |
| 35 to 44 Years | 0 (0.0%) | 16 (6.0%) |
| 45 to 54 Years | 0 (0.0%) | 0 (0.0%) |
| 55 to 64 Years | 0 (0.0%) | 0 (0.0%) |
| 65 to 74 Years | 0 (0.0%) | 0 (0.0%) |
| 75 Years and over | 0 (0.0%) | 12 (2.5%) |
| Total | 0 (0.0%) | 49 (1.9%) |
Income Above Poverty by Sex and Age in Weldon Spring
According to the poverty statistics in Weldon Spring, males aged under 5 years and females aged under 5 years are the age groups that are most secure financially, with 100.0% of males and 100.0% of females in these age groups living above the poverty line.
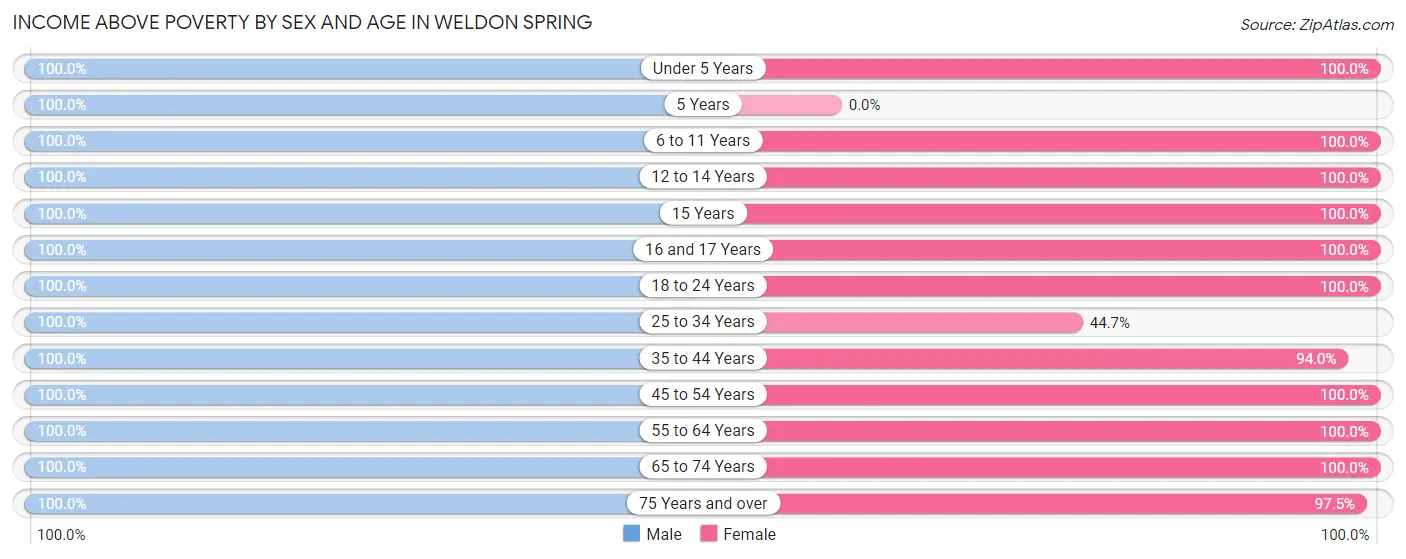
| Age Bracket | Male | Female |
| Under 5 Years | 33 (100.0%) | 27 (100.0%) |
| 5 Years | 22 (100.0%) | 0 (0.0%) |
| 6 to 11 Years | 42 (100.0%) | 154 (100.0%) |
| 12 to 14 Years | 102 (100.0%) | 134 (100.0%) |
| 15 Years | 76 (100.0%) | 23 (100.0%) |
| 16 and 17 Years | 21 (100.0%) | 109 (100.0%) |
| 18 to 24 Years | 286 (100.0%) | 52 (100.0%) |
| 25 to 34 Years | 133 (100.0%) | 17 (44.7%) |
| 35 to 44 Years | 205 (100.0%) | 251 (94.0%) |
| 45 to 54 Years | 294 (100.0%) | 427 (100.0%) |
| 55 to 64 Years | 694 (100.0%) | 627 (100.0%) |
| 65 to 74 Years | 375 (100.0%) | 305 (100.0%) |
| 75 Years and over | 325 (100.0%) | 460 (97.5%) |
| Total | 2,608 (100.0%) | 2,586 (98.1%) |
Income Below Poverty Among Married-Couple Families in Weldon Spring
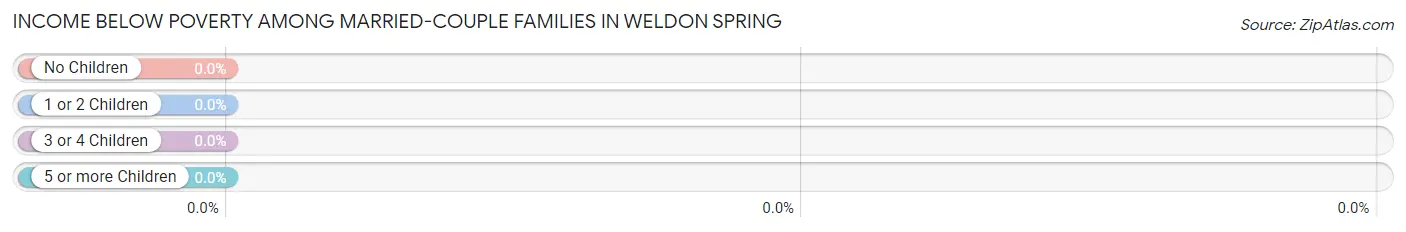
| Children | Above Poverty | Below Poverty |
| No Children | 1,081 (100.0%) | 0 (0.0%) |
| 1 or 2 Children | 365 (100.0%) | 0 (0.0%) |
| 3 or 4 Children | 121 (100.0%) | 0 (0.0%) |
| 5 or more Children | 0 (0.0%) | 0 (0.0%) |
| Total | 1,567 (100.0%) | 0 (0.0%) |
Income Below Poverty Among Single-Parent Households in Weldon Spring
| Children | Single Father | Single Mother |
| No Children | 0 (0.0%) | 0 (0.0%) |
| 1 or 2 Children | 0 (0.0%) | 0 (0.0%) |
| 3 or 4 Children | 0 (0.0%) | 0 (0.0%) |
| 5 or more Children | 0 (0.0%) | 0 (0.0%) |
| Total | 0 (0.0%) | 0 (0.0%) |
Income Below Poverty Among Married-Couple vs Single-Parent Households in Weldon Spring
| Children | Married-Couple Families | Single-Parent Households |
| No Children | 0 (0.0%) | 0 (0.0%) |
| 1 or 2 Children | 0 (0.0%) | 0 (0.0%) |
| 3 or 4 Children | 0 (0.0%) | 0 (0.0%) |
| 5 or more Children | 0 (0.0%) | 0 (0.0%) |
| Total | 0 (0.0%) | 0 (0.0%) |
Race in Weldon Spring
The most populous races in Weldon Spring are White / Caucasian (4,860 | 91.3%), Asian (272 | 5.1%), and Black / African American (104 | 1.9%).
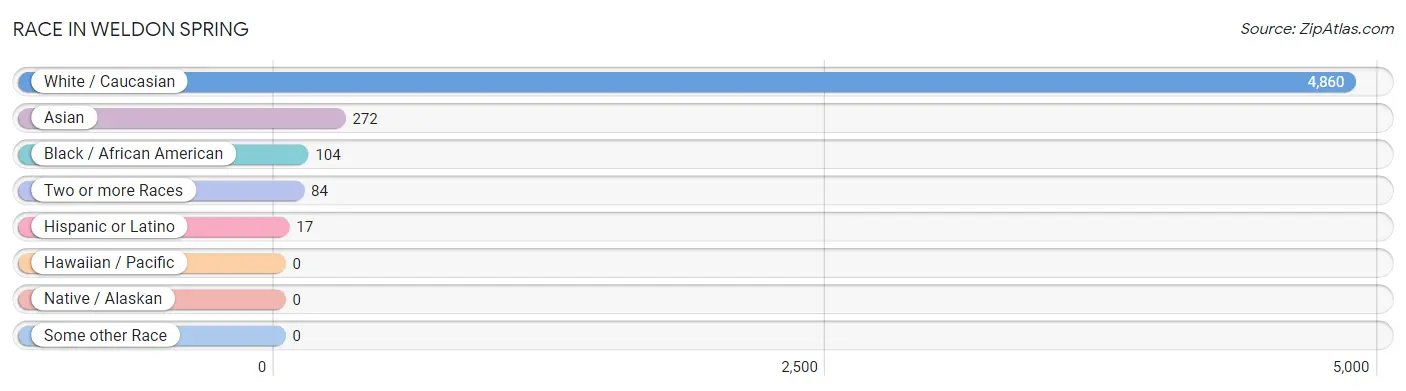
| Race | # Population | % Population |
| Asian | 272 | 5.1% |
| Black / African American | 104 | 1.9% |
| Hawaiian / Pacific | 0 | 0.0% |
| Hispanic or Latino | 17 | 0.3% |
| Native / Alaskan | 0 | 0.0% |
| White / Caucasian | 4,860 | 91.3% |
| Two or more Races | 84 | 1.6% |
| Some other Race | 0 | 0.0% |
| Total | 5,320 | 100.0% |
Ancestry in Weldon Spring
The most populous ancestries reported in Weldon Spring are German (2,296 | 43.2%), Irish (1,307 | 24.6%), English (706 | 13.3%), American (354 | 6.7%), and Italian (337 | 6.3%), together accounting for 94.0% of all Weldon Spring residents.
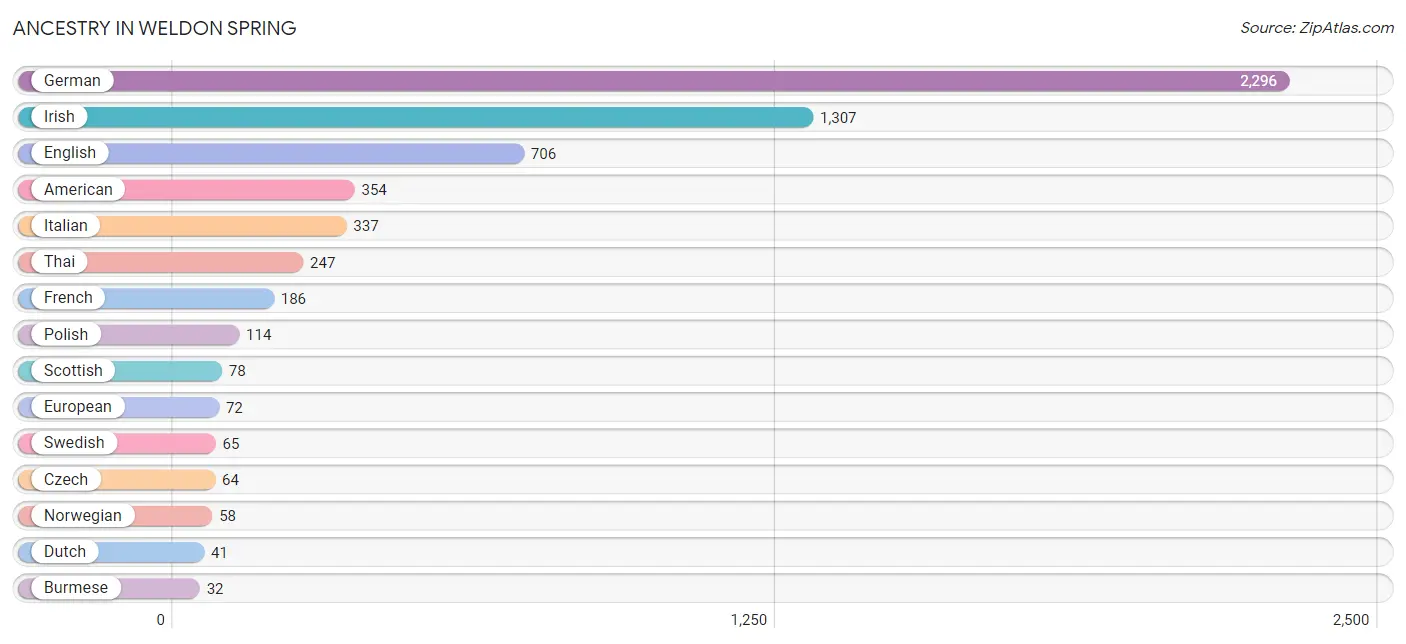
| Ancestry | # Population | % Population |
| American | 354 | 6.7% |
| Austrian | 25 | 0.5% |
| British | 15 | 0.3% |
| Burmese | 32 | 0.6% |
| Central American | 17 | 0.3% |
| Croatian | 11 | 0.2% |
| Czech | 64 | 1.2% |
| Dutch | 41 | 0.8% |
| English | 706 | 13.3% |
| European | 72 | 1.3% |
| French | 186 | 3.5% |
| German | 2,296 | 43.2% |
| Irish | 1,307 | 24.6% |
| Italian | 337 | 6.3% |
| Korean | 30 | 0.6% |
| Norwegian | 58 | 1.1% |
| Panamanian | 17 | 0.3% |
| Polish | 114 | 2.1% |
| Scotch-Irish | 16 | 0.3% |
| Scottish | 78 | 1.5% |
| Serbian | 5 | 0.1% |
| Sri Lankan | 12 | 0.2% |
| Swedish | 65 | 1.2% |
| Thai | 247 | 4.6% |
| Ukrainian | 27 | 0.5% | View All 25 Rows |
Immigrants in Weldon Spring
The most numerous immigrant groups reported in Weldon Spring came from Asia (272 | 5.1%), India (197 | 3.7%), South Central Asia (197 | 3.7%), Eastern Asia (50 | 0.9%), and Korea (50 | 0.9%), together accounting for 14.4% of all Weldon Spring residents.
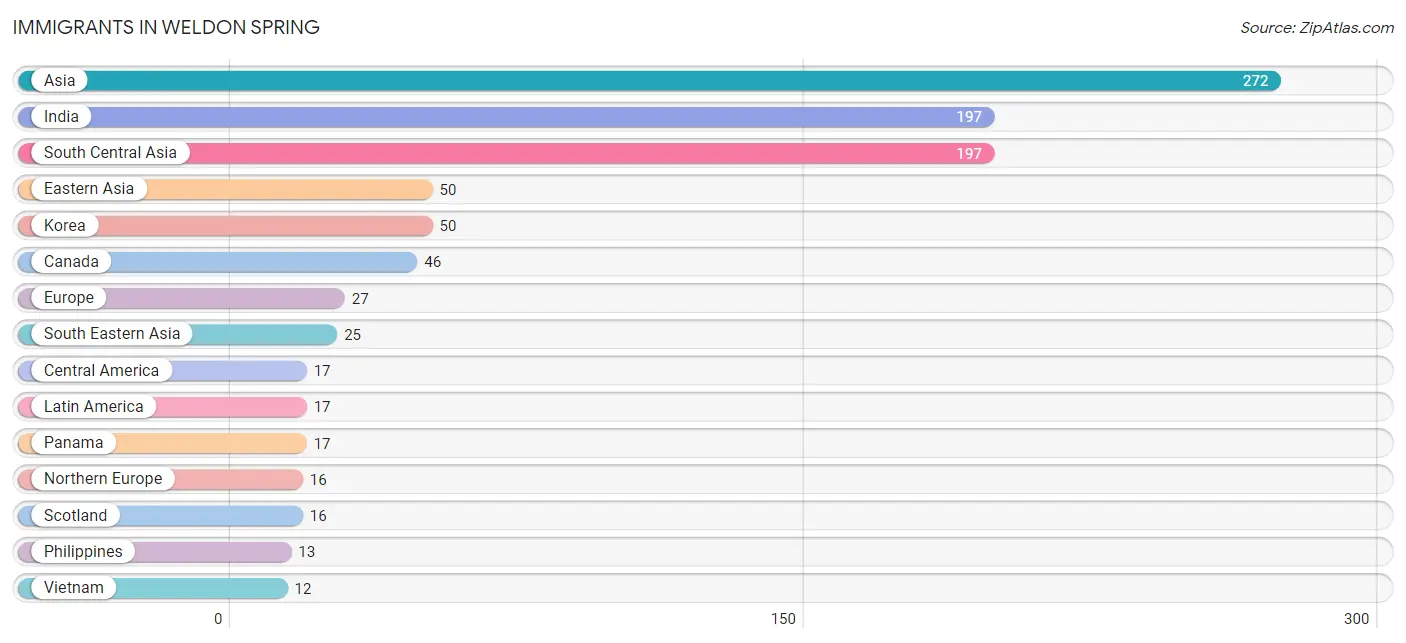
| Immigration Origin | # Population | % Population |
| Asia | 272 | 5.1% |
| Canada | 46 | 0.9% |
| Central America | 17 | 0.3% |
| Croatia | 11 | 0.2% |
| Eastern Asia | 50 | 0.9% |
| Eastern Europe | 11 | 0.2% |
| Europe | 27 | 0.5% |
| India | 197 | 3.7% |
| Korea | 50 | 0.9% |
| Latin America | 17 | 0.3% |
| Northern Europe | 16 | 0.3% |
| Panama | 17 | 0.3% |
| Philippines | 13 | 0.2% |
| Scotland | 16 | 0.3% |
| South Central Asia | 197 | 3.7% |
| South Eastern Asia | 25 | 0.5% |
| Vietnam | 12 | 0.2% | View All 17 Rows |
Sex and Age in Weldon Spring
Sex and Age in Weldon Spring
The most populous age groups in Weldon Spring are 55 to 59 Years (377 | 14.3%) for men and 60 to 64 Years (323 | 12.0%) for women.
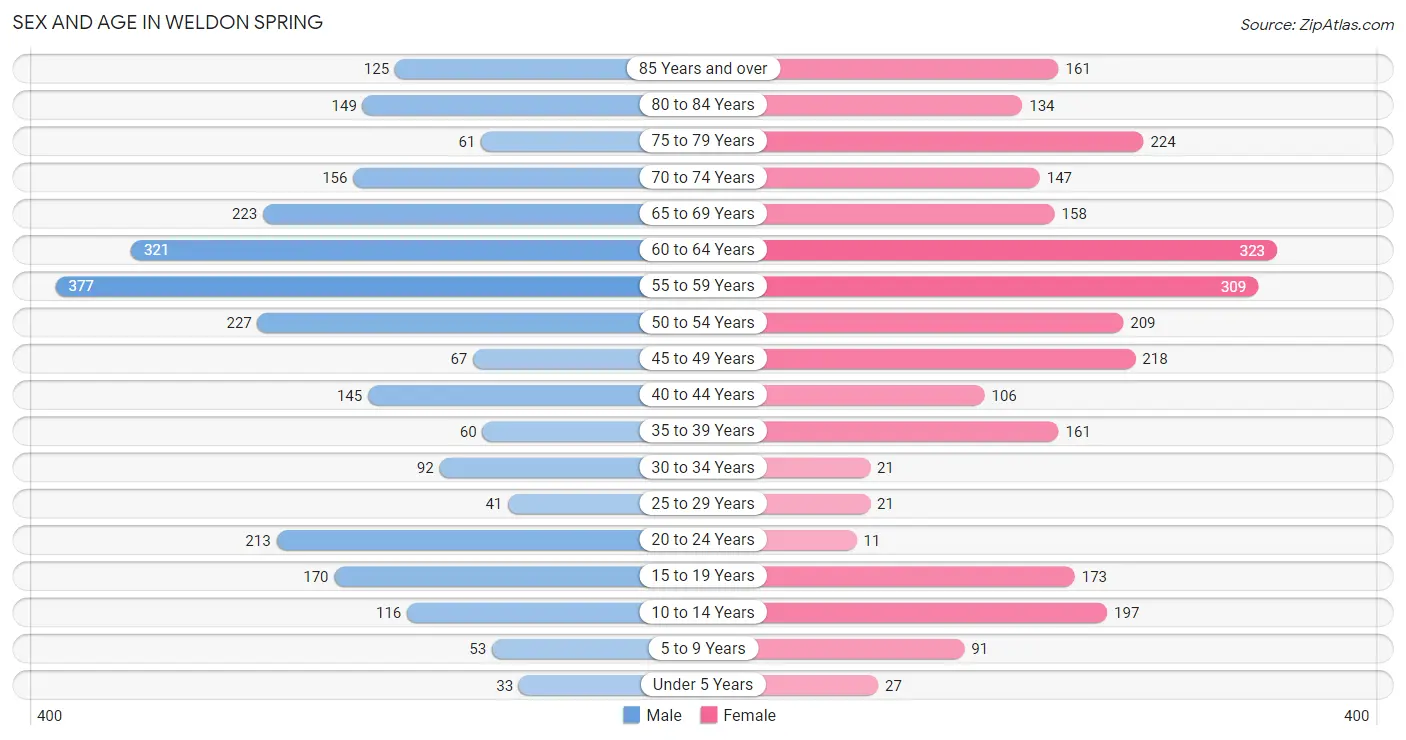
| Age Bracket | Male | Female |
| Under 5 Years | 33 (1.3%) | 27 (1.0%) |
| 5 to 9 Years | 53 (2.0%) | 91 (3.4%) |
| 10 to 14 Years | 116 (4.4%) | 197 (7.3%) |
| 15 to 19 Years | 170 (6.5%) | 173 (6.4%) |
| 20 to 24 Years | 213 (8.1%) | 11 (0.4%) |
| 25 to 29 Years | 41 (1.6%) | 21 (0.8%) |
| 30 to 34 Years | 92 (3.5%) | 21 (0.8%) |
| 35 to 39 Years | 60 (2.3%) | 161 (6.0%) |
| 40 to 44 Years | 145 (5.5%) | 106 (3.9%) |
| 45 to 49 Years | 67 (2.5%) | 218 (8.1%) |
| 50 to 54 Years | 227 (8.6%) | 209 (7.8%) |
| 55 to 59 Years | 377 (14.3%) | 309 (11.5%) |
| 60 to 64 Years | 321 (12.2%) | 323 (12.0%) |
| 65 to 69 Years | 223 (8.5%) | 158 (5.9%) |
| 70 to 74 Years | 156 (5.9%) | 147 (5.5%) |
| 75 to 79 Years | 61 (2.3%) | 224 (8.3%) |
| 80 to 84 Years | 149 (5.7%) | 134 (5.0%) |
| 85 Years and over | 125 (4.8%) | 161 (6.0%) |
| Total | 2,629 (100.0%) | 2,691 (100.0%) |
Families and Households in Weldon Spring
Median Family Size in Weldon Spring
The median family size in Weldon Spring is 2.78 persons per family, with single male/father families (56 | 3.3%) accounting for the largest median family size of 2.86 persons per family. On the other hand, single female/mother families (61 | 3.6%) represent the smallest median family size with 2.18 persons per family.
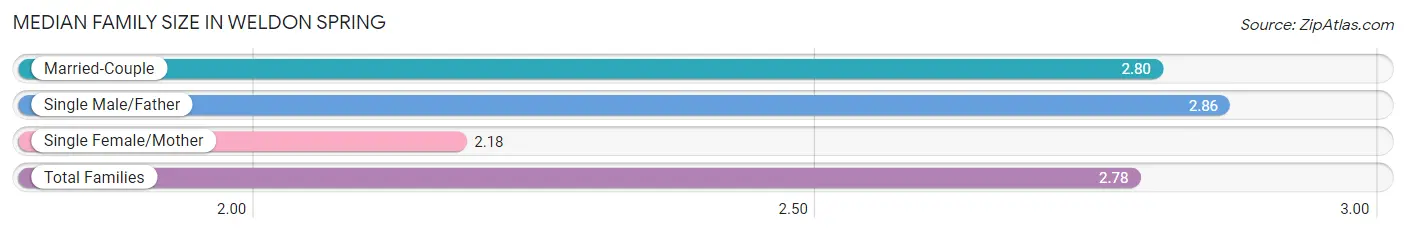
| Family Type | # Families | Family Size |
| Married-Couple | 1,567 (93.0%) | 2.80 |
| Single Male/Father | 56 (3.3%) | 2.86 |
| Single Female/Mother | 61 (3.6%) | 2.18 |
| Total Families | 1,684 (100.0%) | 2.78 |
Median Household Size in Weldon Spring
The median household size in Weldon Spring is 2.43 persons per household, with single male/father households (56 | 2.6%) accounting for the largest median household size of 3.14 persons per household. non-family households (478 | 22.1%) represent the smallest median household size with 1.15 persons per household.
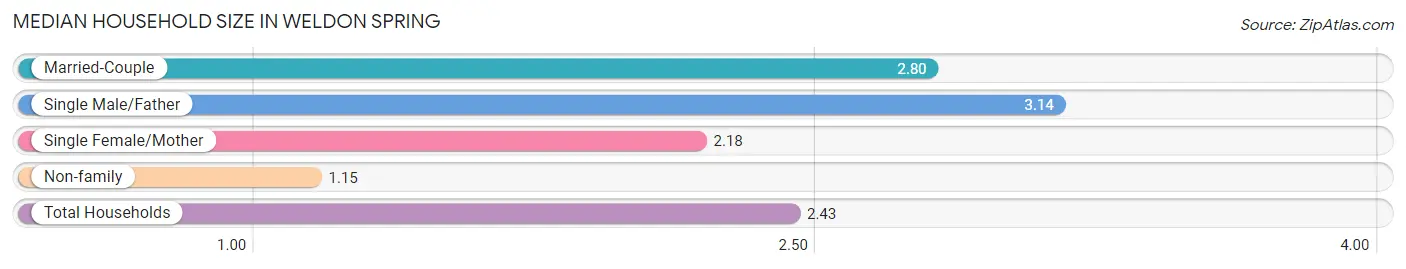
| Household Type | # Households | Household Size |
| Married-Couple | 1,567 (72.5%) | 2.80 |
| Single Male/Father | 56 (2.6%) | 3.14 |
| Single Female/Mother | 61 (2.8%) | 2.18 |
| Non-family | 478 (22.1%) | 1.15 |
| Total Households | 2,162 (100.0%) | 2.43 |
Household Size by Marriage Status in Weldon Spring
Out of a total of 2,162 households in Weldon Spring, 1,684 (77.9%) are family households, while 478 (22.1%) are nonfamily households. The most numerous type of family households are 2-person households, comprising 945, and the most common type of nonfamily households are 1-person households, comprising 411.
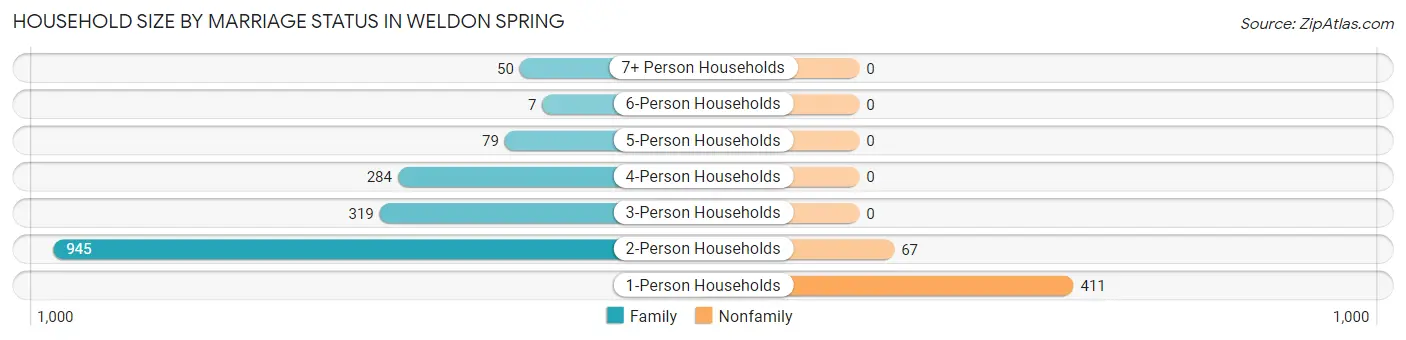
| Household Size | Family Households | Nonfamily Households |
| 1-Person Households | - | 411 (19.0%) |
| 2-Person Households | 945 (43.7%) | 67 (3.1%) |
| 3-Person Households | 319 (14.7%) | 0 (0.0%) |
| 4-Person Households | 284 (13.1%) | 0 (0.0%) |
| 5-Person Households | 79 (3.6%) | 0 (0.0%) |
| 6-Person Households | 7 (0.3%) | 0 (0.0%) |
| 7+ Person Households | 50 (2.3%) | 0 (0.0%) |
| Total | 1,684 (77.9%) | 478 (22.1%) |
Female Fertility in Weldon Spring
Fertility by Age in Weldon Spring
| Age Bracket | Women with Births | Births / 1,000 Women |
| 15 to 19 years | 0 (0.0%) | 0.0 |
| 20 to 34 years | 0 (0.0%) | 0.0 |
| 35 to 50 years | 0 (0.0%) | 0.0 |
| Total | 0 (0.0%) | 0.0 |
Fertility by Age by Marriage Status in Weldon Spring
| Age Bracket | Married | Unmarried |
| 15 to 19 years | 0 (0.0%) | 0 (0.0%) |
| 20 to 34 years | 0 (0.0%) | 0 (0.0%) |
| 35 to 50 years | 0 (0.0%) | 0 (0.0%) |
| Total | 0 (0.0%) | 0 (0.0%) |
Fertility by Education in Weldon Spring
| Educational Attainment | Women with Births | Births / 1,000 Women |
| Less than High School | 0 (0.0%) | 0.0 |
| High School Diploma | 0 (0.0%) | 0.0 |
| College or Associate's Degree | 0 (0.0%) | 0.0 |
| Bachelor's Degree | 0 (0.0%) | 0.0 |
| Graduate Degree | 0 (0.0%) | 0.0 |
| Total | 0 (0.0%) | 0.0 |
Fertility by Education by Marriage Status in Weldon Spring
| Educational Attainment | Married | Unmarried |
| Less than High School | 0 (0.0%) | 0 (0.0%) |
| High School Diploma | 0 (0.0%) | 0 (0.0%) |
| College or Associate's Degree | 0 (0.0%) | 0 (0.0%) |
| Bachelor's Degree | 0 (0.0%) | 0 (0.0%) |
| Graduate Degree | 0 (0.0%) | 0 (0.0%) |
| Total | 0 (0.0%) | 0 (0.0%) |
Employment Characteristics in Weldon Spring
Employment by Class of Employer in Weldon Spring
Among the 2,218 employed individuals in Weldon Spring, private company employees (1,592 | 71.8%), not-for-profit organizations (221 | 10.0%), and self-employed (incorporated) (179 | 8.1%) make up the most common classes of employment.
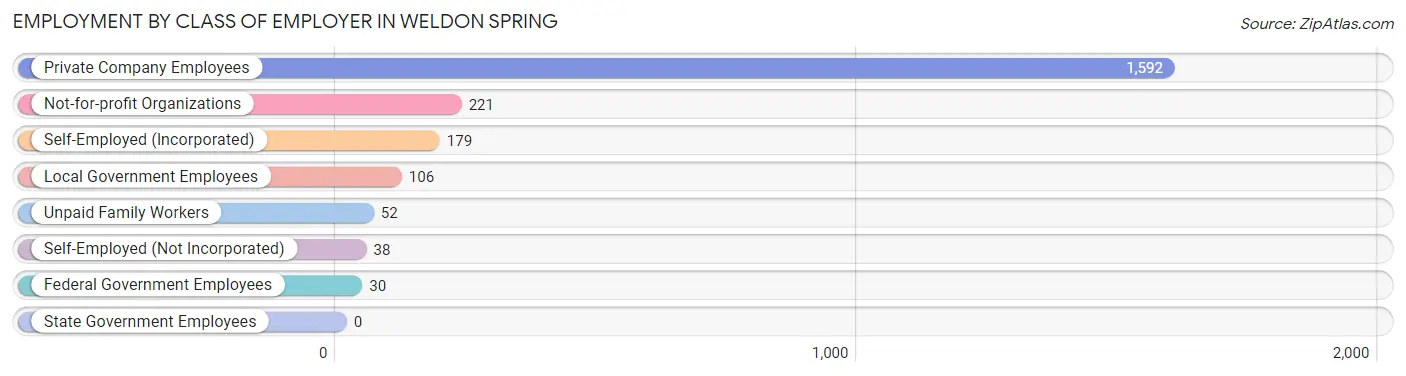
| Employer Class | # Employees | % Employees |
| Private Company Employees | 1,592 | 71.8% |
| Self-Employed (Incorporated) | 179 | 8.1% |
| Self-Employed (Not Incorporated) | 38 | 1.7% |
| Not-for-profit Organizations | 221 | 10.0% |
| Local Government Employees | 106 | 4.8% |
| State Government Employees | 0 | 0.0% |
| Federal Government Employees | 30 | 1.3% |
| Unpaid Family Workers | 52 | 2.3% |
| Total | 2,218 | 100.0% |
Employment Status by Age in Weldon Spring
According to the labor force statistics for Weldon Spring, out of the total population over 16 years of age (4,704), 50.3% or 2,366 individuals are in the labor force, with 6.3% or 149 of them unemployed. The age group with the highest labor force participation rate is 45 to 54 years, with 85.4% or 616 individuals in the labor force. Within the labor force, the 65 to 74 years age range has the highest percentage of unemployed individuals, with 23.8% or 50 of them being unemployed.
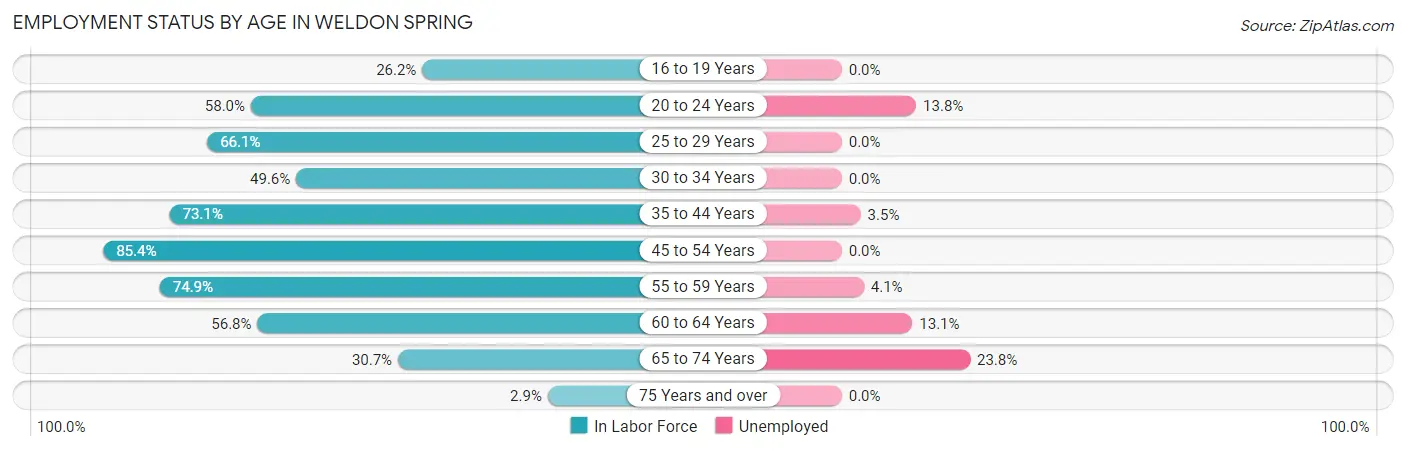
| Age Bracket | In Labor Force | Unemployed |
| 16 to 19 Years | 64 (26.2%) | 0 (0.0%) |
| 20 to 24 Years | 130 (58.0%) | 18 (13.8%) |
| 25 to 29 Years | 41 (66.1%) | 0 (0.0%) |
| 30 to 34 Years | 56 (49.6%) | 0 (0.0%) |
| 35 to 44 Years | 345 (73.1%) | 12 (3.5%) |
| 45 to 54 Years | 616 (85.4%) | 0 (0.0%) |
| 55 to 59 Years | 514 (74.9%) | 21 (4.1%) |
| 60 to 64 Years | 366 (56.8%) | 48 (13.1%) |
| 65 to 74 Years | 210 (30.7%) | 50 (23.8%) |
| 75 Years and over | 25 (2.9%) | 0 (0.0%) |
| Total | 2,366 (50.3%) | 149 (6.3%) |
Employment Status by Educational Attainment in Weldon Spring
According to labor force statistics for Weldon Spring, 71.8% of individuals (1,937) out of the total population between 25 and 64 years of age (2,698) are in the labor force, with 4.2% or 81 of them being unemployed. The group with the highest labor force participation rate are those with the educational attainment of bachelor's degree or higher, with 79.1% or 1,354 individuals in the labor force. Within the labor force, individuals with bachelor's degree or higher education have the highest percentage of unemployment, with 6.0% or 81 of them being unemployed.
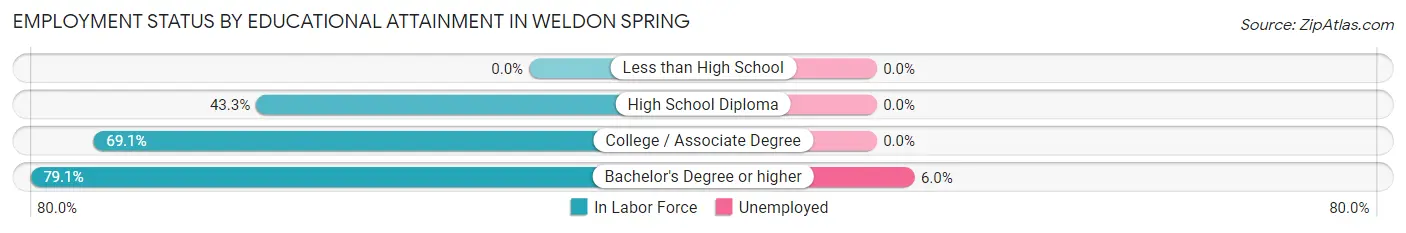
| Educational Attainment | In Labor Force | Unemployed |
| Less than High School | 0 (0.0%) | 0 (0.0%) |
| High School Diploma | 114 (43.3%) | 0 (0.0%) |
| College / Associate Degree | 469 (69.1%) | 0 (0.0%) |
| Bachelor's Degree or higher | 1,354 (79.1%) | 103 (6.0%) |
| Total | 1,937 (71.8%) | 113 (4.2%) |
Employment Occupations by Sex in Weldon Spring
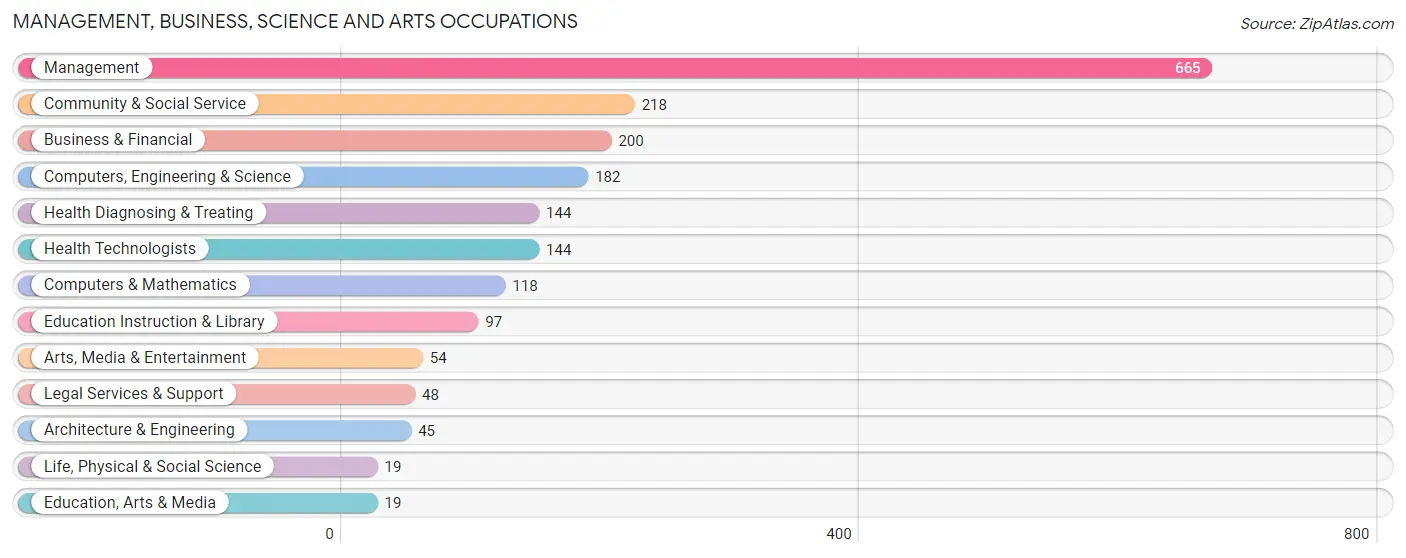
Management, Business, Science and Arts Occupations
The most common Management, Business, Science and Arts occupations in Weldon Spring are Management (665 | 30.0%), Community & Social Service (218 | 9.8%), Business & Financial (200 | 9.0%), Computers, Engineering & Science (182 | 8.2%), and Health Diagnosing & Treating (144 | 6.5%).
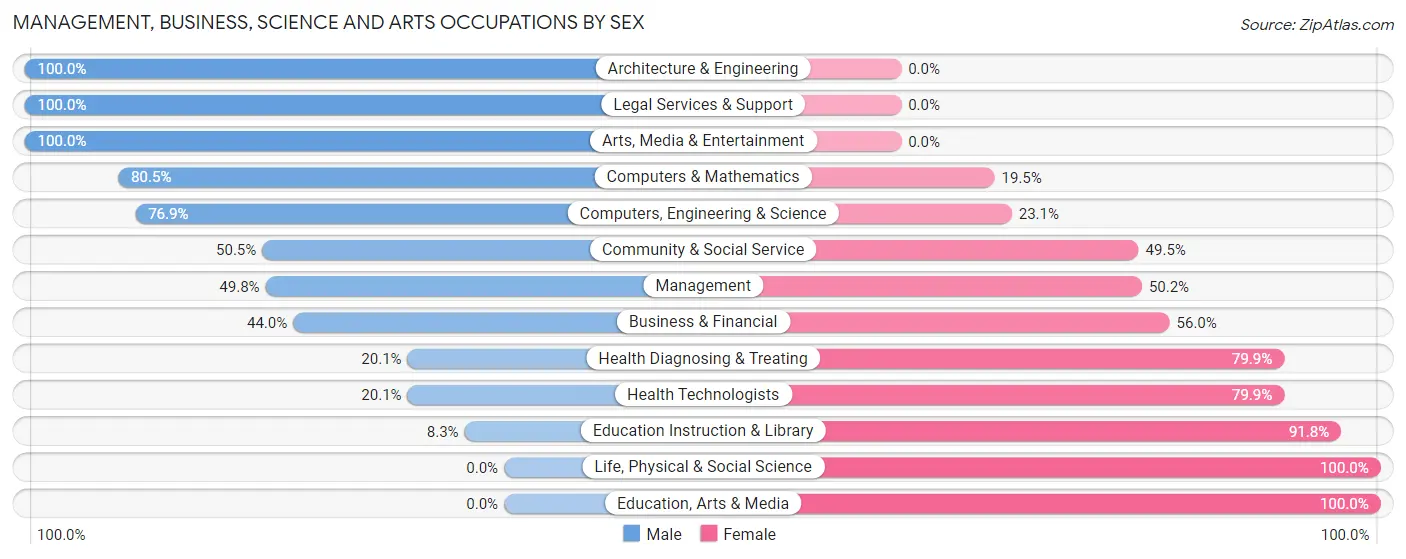
Management, Business, Science and Arts Occupations by Sex
Within the Management, Business, Science and Arts occupations in Weldon Spring, the most male-oriented occupations are Architecture & Engineering (100.0%), Legal Services & Support (100.0%), and Arts, Media & Entertainment (100.0%), while the most female-oriented occupations are Life, Physical & Social Science (100.0%), Education, Arts & Media (100.0%), and Education Instruction & Library (91.7%).
| Occupation | Male | Female |
| Management | 331 (49.8%) | 334 (50.2%) |
| Business & Financial | 88 (44.0%) | 112 (56.0%) |
| Computers, Engineering & Science | 140 (76.9%) | 42 (23.1%) |
| Computers & Mathematics | 95 (80.5%) | 23 (19.5%) |
| Architecture & Engineering | 45 (100.0%) | 0 (0.0%) |
| Life, Physical & Social Science | 0 (0.0%) | 19 (100.0%) |
| Community & Social Service | 110 (50.5%) | 108 (49.5%) |
| Education, Arts & Media | 0 (0.0%) | 19 (100.0%) |
| Legal Services & Support | 48 (100.0%) | 0 (0.0%) |
| Education Instruction & Library | 8 (8.3%) | 89 (91.7%) |
| Arts, Media & Entertainment | 54 (100.0%) | 0 (0.0%) |
| Health Diagnosing & Treating | 29 (20.1%) | 115 (79.9%) |
| Health Technologists | 29 (20.1%) | 115 (79.9%) |
| Total (Category) | 698 (49.5%) | 711 (50.5%) |
| Total (Overall) | 1,233 (55.6%) | 985 (44.4%) |
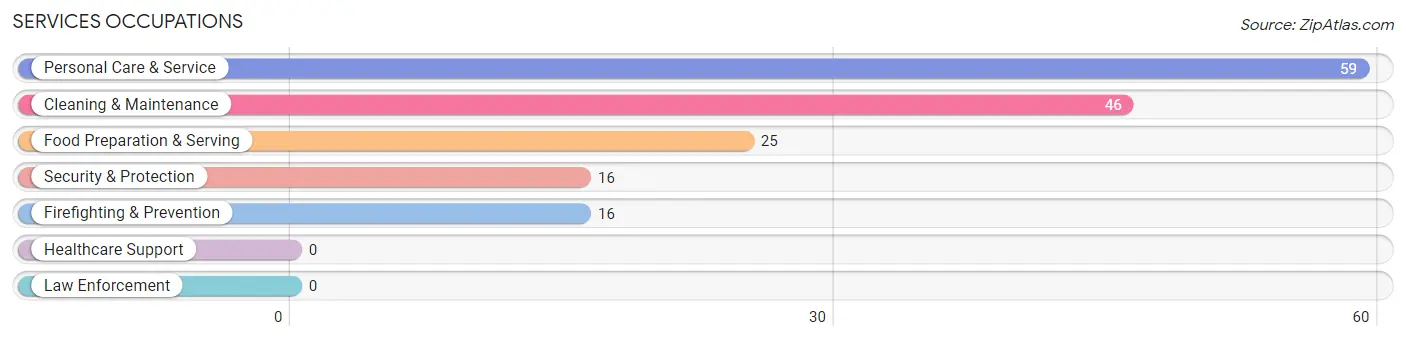
Services Occupations
The most common Services occupations in Weldon Spring are Personal Care & Service (59 | 2.7%), Cleaning & Maintenance (46 | 2.1%), Food Preparation & Serving (25 | 1.1%), Security & Protection (16 | 0.7%), and Firefighting & Prevention (16 | 0.7%).
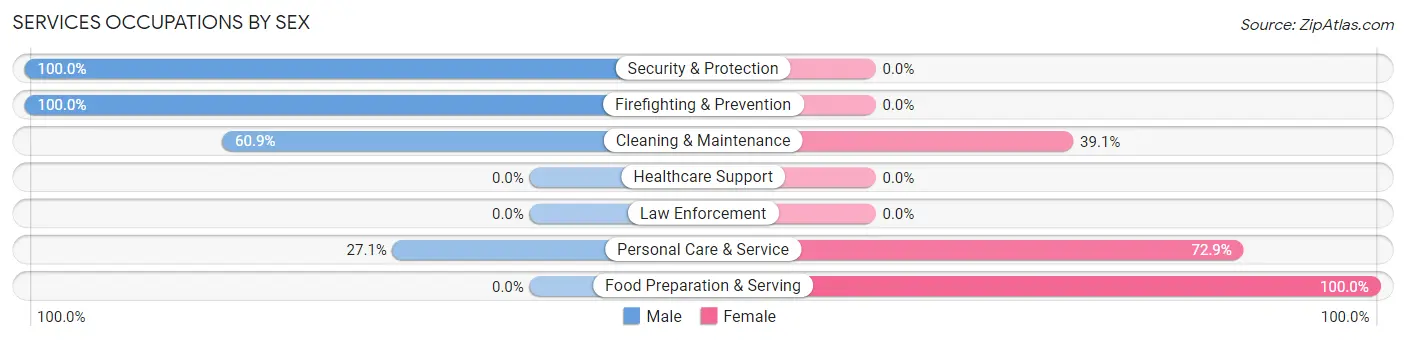
Services Occupations by Sex
Within the Services occupations in Weldon Spring, the most male-oriented occupations are Security & Protection (100.0%), Firefighting & Prevention (100.0%), and Cleaning & Maintenance (60.9%), while the most female-oriented occupations are Food Preparation & Serving (100.0%), Personal Care & Service (72.9%), and Cleaning & Maintenance (39.1%).
| Occupation | Male | Female |
| Healthcare Support | 0 (0.0%) | 0 (0.0%) |
| Security & Protection | 16 (100.0%) | 0 (0.0%) |
| Firefighting & Prevention | 16 (100.0%) | 0 (0.0%) |
| Law Enforcement | 0 (0.0%) | 0 (0.0%) |
| Food Preparation & Serving | 0 (0.0%) | 25 (100.0%) |
| Cleaning & Maintenance | 28 (60.9%) | 18 (39.1%) |
| Personal Care & Service | 16 (27.1%) | 43 (72.9%) |
| Total (Category) | 60 (41.1%) | 86 (58.9%) |
| Total (Overall) | 1,233 (55.6%) | 985 (44.4%) |
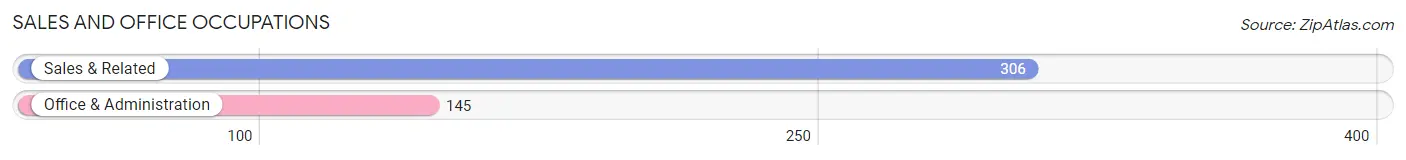
Sales and Office Occupations
The most common Sales and Office occupations in Weldon Spring are Sales & Related (306 | 13.8%), and Office & Administration (145 | 6.5%).
Sales and Office Occupations by Sex
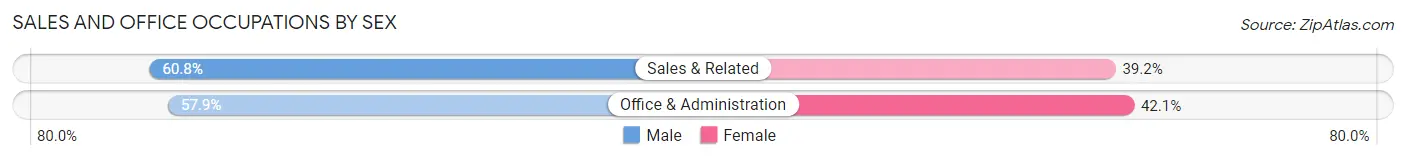
| Occupation | Male | Female |
| Sales & Related | 186 (60.8%) | 120 (39.2%) |
| Office & Administration | 84 (57.9%) | 61 (42.1%) |
| Total (Category) | 270 (59.9%) | 181 (40.1%) |
| Total (Overall) | 1,233 (55.6%) | 985 (44.4%) |
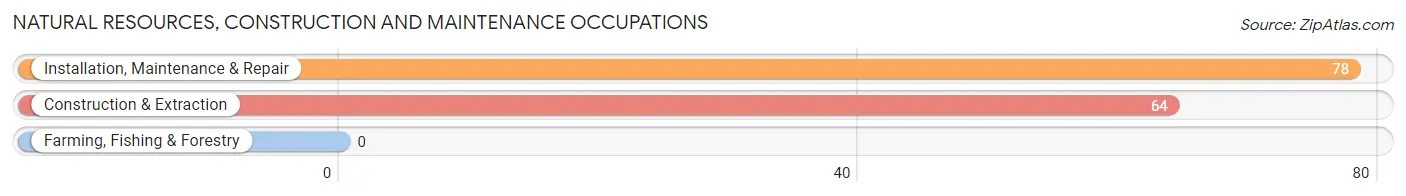
Natural Resources, Construction and Maintenance Occupations
The most common Natural Resources, Construction and Maintenance occupations in Weldon Spring are Installation, Maintenance & Repair (78 | 3.5%), and Construction & Extraction (64 | 2.9%).
Natural Resources, Construction and Maintenance Occupations by Sex
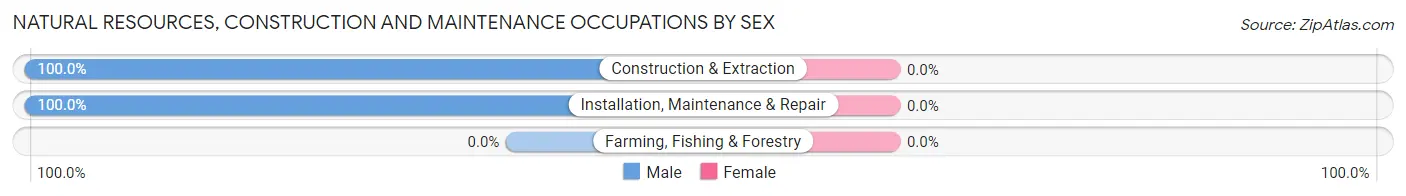
| Occupation | Male | Female |
| Farming, Fishing & Forestry | 0 (0.0%) | 0 (0.0%) |
| Construction & Extraction | 64 (100.0%) | 0 (0.0%) |
| Installation, Maintenance & Repair | 78 (100.0%) | 0 (0.0%) |
| Total (Category) | 142 (100.0%) | 0 (0.0%) |
| Total (Overall) | 1,233 (55.6%) | 985 (44.4%) |
Production, Transportation and Moving Occupations
The most common Production, Transportation and Moving occupations in Weldon Spring are Production (59 | 2.7%), and Transportation (11 | 0.5%).
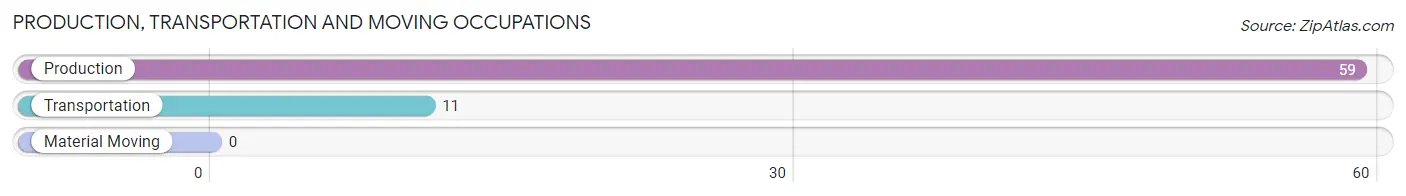
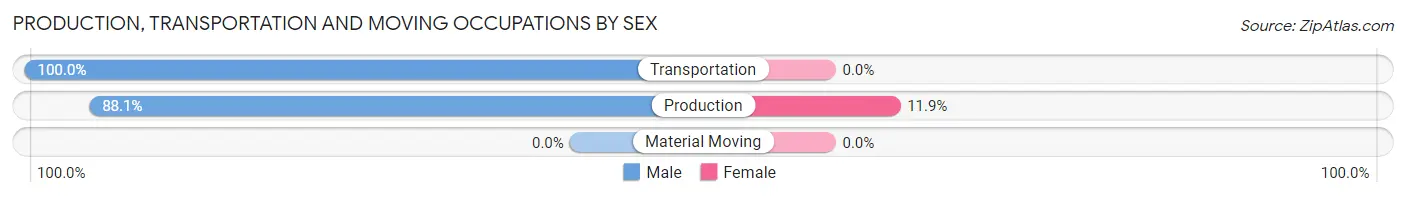
Production, Transportation and Moving Occupations by Sex
| Occupation | Male | Female |
| Production | 52 (88.1%) | 7 (11.9%) |
| Transportation | 11 (100.0%) | 0 (0.0%) |
| Material Moving | 0 (0.0%) | 0 (0.0%) |
| Total (Category) | 63 (90.0%) | 7 (10.0%) |
| Total (Overall) | 1,233 (55.6%) | 985 (44.4%) |
Employment Industries by Sex in Weldon Spring
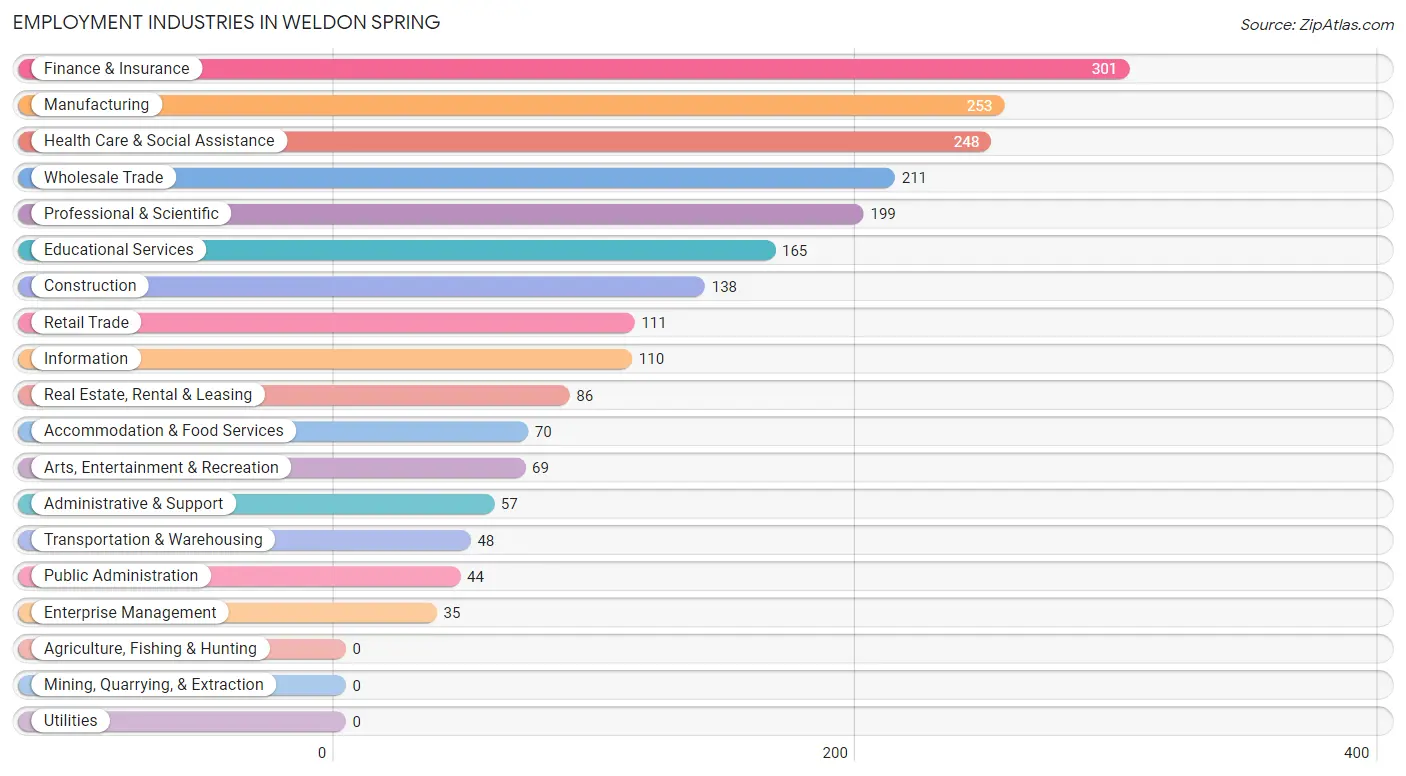
Employment Industries in Weldon Spring
The major employment industries in Weldon Spring include Finance & Insurance (301 | 13.6%), Manufacturing (253 | 11.4%), Health Care & Social Assistance (248 | 11.2%), Wholesale Trade (211 | 9.5%), and Professional & Scientific (199 | 9.0%).
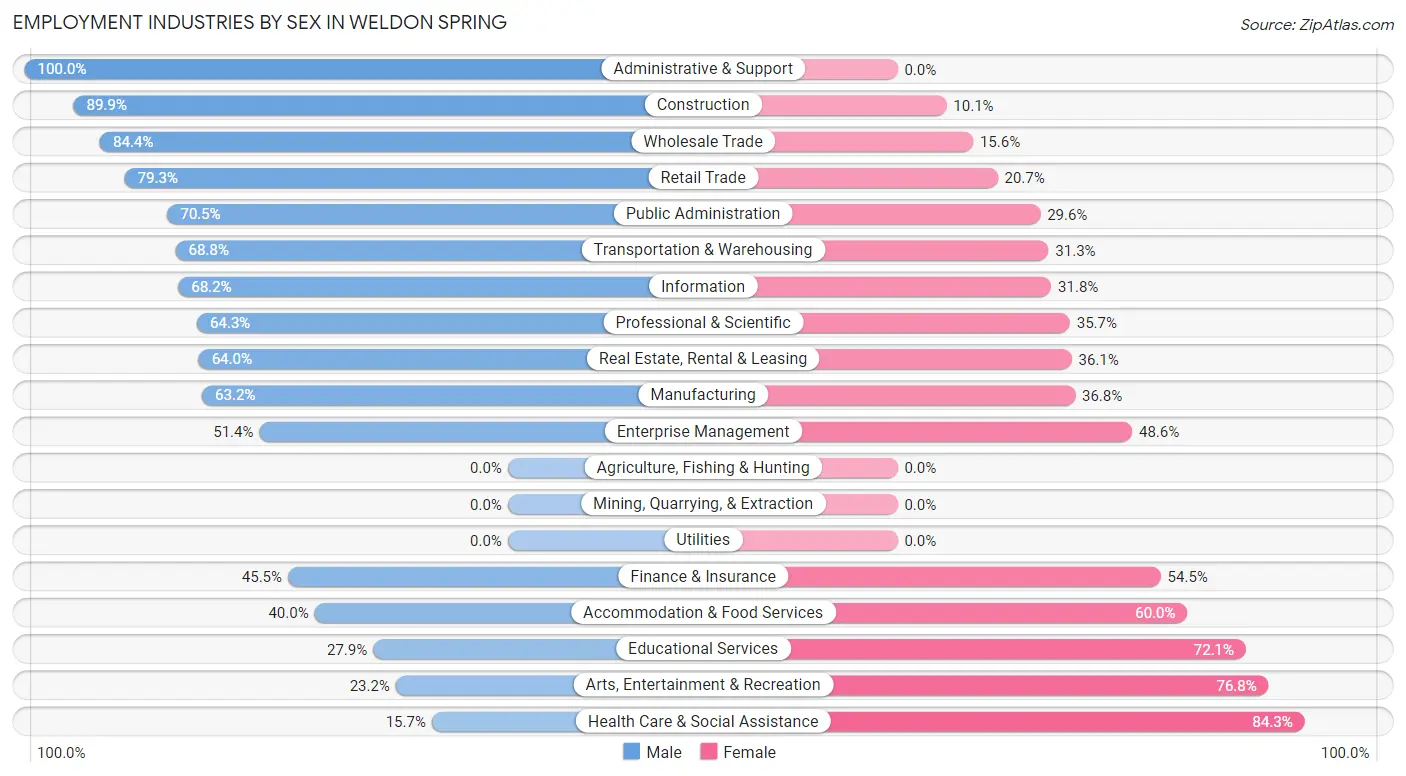
Employment Industries by Sex in Weldon Spring
The Weldon Spring industries that see more men than women are Administrative & Support (100.0%), Construction (89.9%), and Wholesale Trade (84.4%), whereas the industries that tend to have a higher number of women are Health Care & Social Assistance (84.3%), Arts, Entertainment & Recreation (76.8%), and Educational Services (72.1%).
| Industry | Male | Female |
| Agriculture, Fishing & Hunting | 0 (0.0%) | 0 (0.0%) |
| Mining, Quarrying, & Extraction | 0 (0.0%) | 0 (0.0%) |
| Construction | 124 (89.9%) | 14 (10.1%) |
| Manufacturing | 160 (63.2%) | 93 (36.8%) |
| Wholesale Trade | 178 (84.4%) | 33 (15.6%) |
| Retail Trade | 88 (79.3%) | 23 (20.7%) |
| Transportation & Warehousing | 33 (68.8%) | 15 (31.2%) |
| Utilities | 0 (0.0%) | 0 (0.0%) |
| Information | 75 (68.2%) | 35 (31.8%) |
| Finance & Insurance | 137 (45.5%) | 164 (54.5%) |
| Real Estate, Rental & Leasing | 55 (63.9%) | 31 (36.0%) |
| Professional & Scientific | 128 (64.3%) | 71 (35.7%) |
| Enterprise Management | 18 (51.4%) | 17 (48.6%) |
| Administrative & Support | 57 (100.0%) | 0 (0.0%) |
| Educational Services | 46 (27.9%) | 119 (72.1%) |
| Health Care & Social Assistance | 39 (15.7%) | 209 (84.3%) |
| Arts, Entertainment & Recreation | 16 (23.2%) | 53 (76.8%) |
| Accommodation & Food Services | 28 (40.0%) | 42 (60.0%) |
| Public Administration | 31 (70.5%) | 13 (29.5%) |
| Total | 1,233 (55.6%) | 985 (44.4%) |
Education in Weldon Spring
School Enrollment in Weldon Spring
The most common levels of schooling among the 963 students in Weldon Spring are high school (334 | 34.7%), middle school (280 | 29.1%), and college / undergraduate (161 | 16.7%).
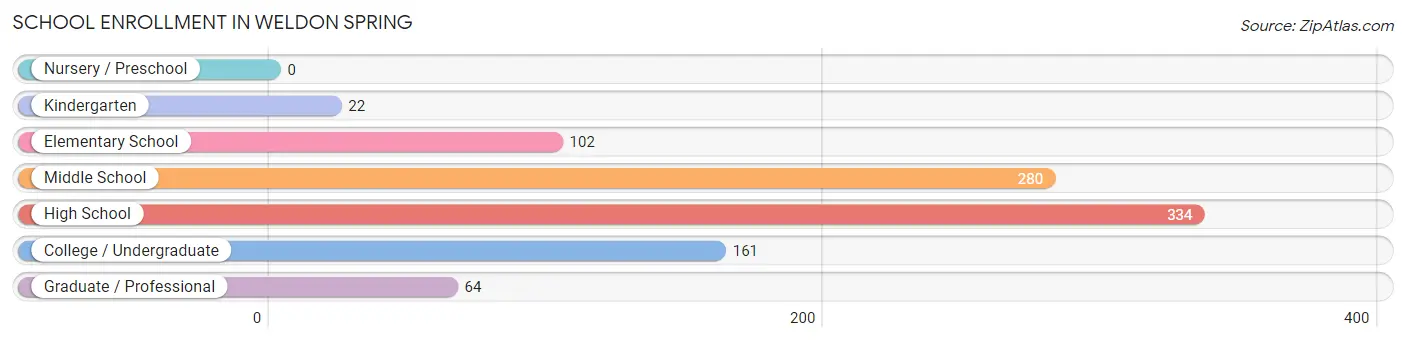
| School Level | # Students | % Students |
| Nursery / Preschool | 0 | 0.0% |
| Kindergarten | 22 | 2.3% |
| Elementary School | 102 | 10.6% |
| Middle School | 280 | 29.1% |
| High School | 334 | 34.7% |
| College / Undergraduate | 161 | 16.7% |
| Graduate / Professional | 64 | 6.7% |
| Total | 963 | 100.0% |
School Enrollment by Age by Funding Source in Weldon Spring
Out of a total of 963 students who are enrolled in schools in Weldon Spring, 297 (30.8%) attend a private institution, while the remaining 666 (69.2%) are enrolled in public schools. The age group of 5 to 9 year old has the highest likelihood of being enrolled in private schools, with 62 (43.1% in the age bracket) enrolled. Conversely, the age group of 25 to 34 year olds has the lowest likelihood of being enrolled in a private school, with 53 (100.0% in the age bracket) attending a public institution.
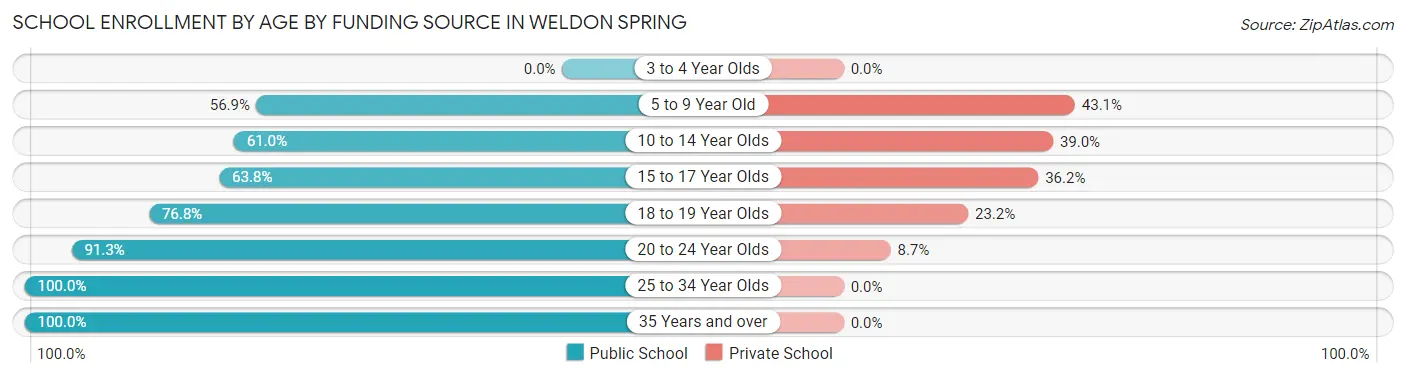
| Age Bracket | Public School | Private School |
| 3 to 4 Year Olds | 0 (0.0%) | 0 (0.0%) |
| 5 to 9 Year Old | 82 (56.9%) | 62 (43.1%) |
| 10 to 14 Year Olds | 191 (61.0%) | 122 (39.0%) |
| 15 to 17 Year Olds | 146 (63.8%) | 83 (36.2%) |
| 18 to 19 Year Olds | 63 (76.8%) | 19 (23.2%) |
| 20 to 24 Year Olds | 115 (91.3%) | 11 (8.7%) |
| 25 to 34 Year Olds | 53 (100.0%) | 0 (0.0%) |
| 35 Years and over | 16 (100.0%) | 0 (0.0%) |
| Total | 666 (69.2%) | 297 (30.8%) |
Educational Attainment by Field of Study in Weldon Spring
Business (731 | 30.2%), engineering (336 | 13.9%), education (222 | 9.2%), science & technology (194 | 8.0%), and computers & mathematics (162 | 6.7%) are the most common fields of study among 2,423 individuals in Weldon Spring who have obtained a bachelor's degree or higher.
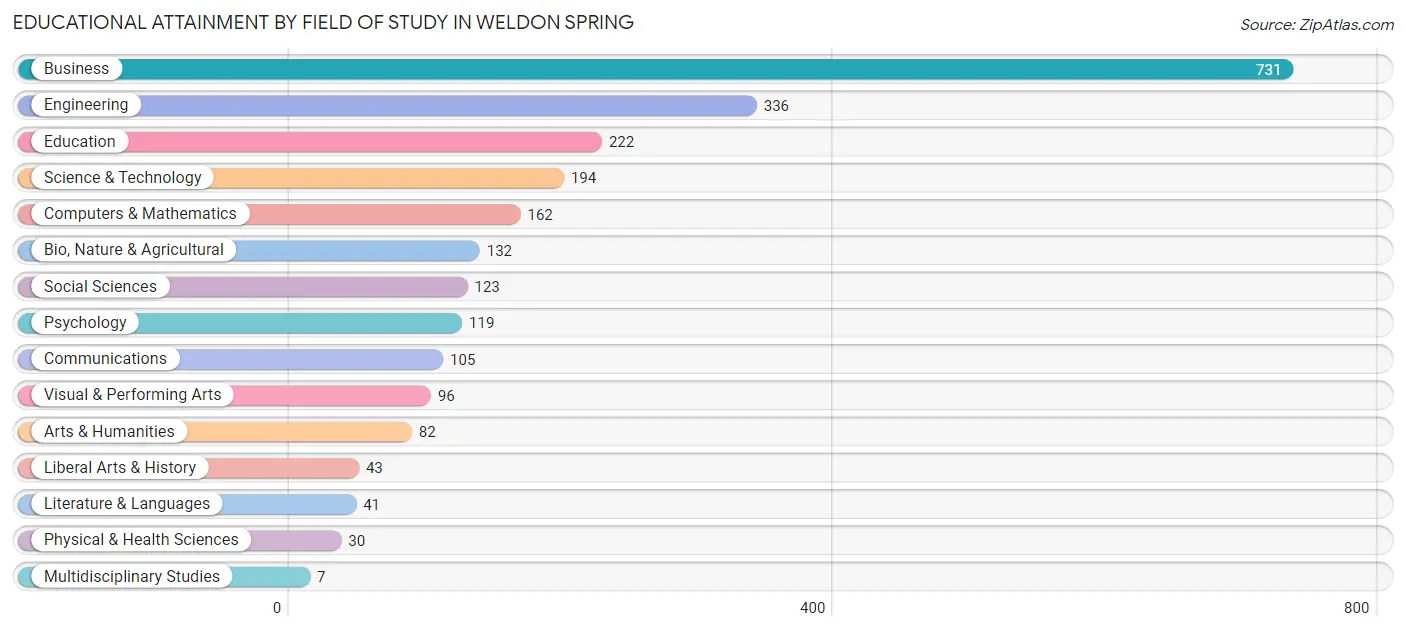
| Field of Study | # Graduates | % Graduates |
| Computers & Mathematics | 162 | 6.7% |
| Bio, Nature & Agricultural | 132 | 5.4% |
| Physical & Health Sciences | 30 | 1.2% |
| Psychology | 119 | 4.9% |
| Social Sciences | 123 | 5.1% |
| Engineering | 336 | 13.9% |
| Multidisciplinary Studies | 7 | 0.3% |
| Science & Technology | 194 | 8.0% |
| Business | 731 | 30.2% |
| Education | 222 | 9.2% |
| Literature & Languages | 41 | 1.7% |
| Liberal Arts & History | 43 | 1.8% |
| Visual & Performing Arts | 96 | 4.0% |
| Communications | 105 | 4.3% |
| Arts & Humanities | 82 | 3.4% |
| Total | 2,423 | 100.0% |
Transportation & Commute in Weldon Spring
Vehicle Availability by Sex in Weldon Spring
The most prevalent vehicle ownership categories in Weldon Spring are males with 3 vehicles (437, accounting for 35.4%) and females with 3 vehicles (333, making up 44.4%).
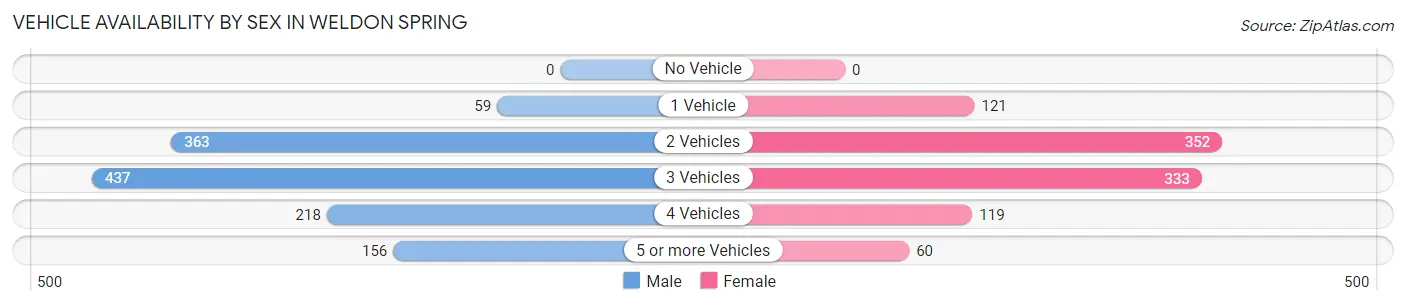
| Vehicles Available | Male | Female |
| No Vehicle | 0 (0.0%) | 0 (0.0%) |
| 1 Vehicle | 59 (4.8%) | 121 (12.3%) |
| 2 Vehicles | 363 (29.4%) | 352 (35.7%) |
| 3 Vehicles | 437 (35.4%) | 333 (33.8%) |
| 4 Vehicles | 218 (17.7%) | 119 (12.1%) |
| 5 or more Vehicles | 156 (12.7%) | 60 (6.1%) |
| Total | 1,233 (100.0%) | 985 (100.0%) |
Commute Time in Weldon Spring
The most frequently occuring commute durations in Weldon Spring are 30 to 34 minutes (389 commuters, 23.9%), 20 to 24 minutes (314 commuters, 19.3%), and 10 to 14 minutes (241 commuters, 14.8%).
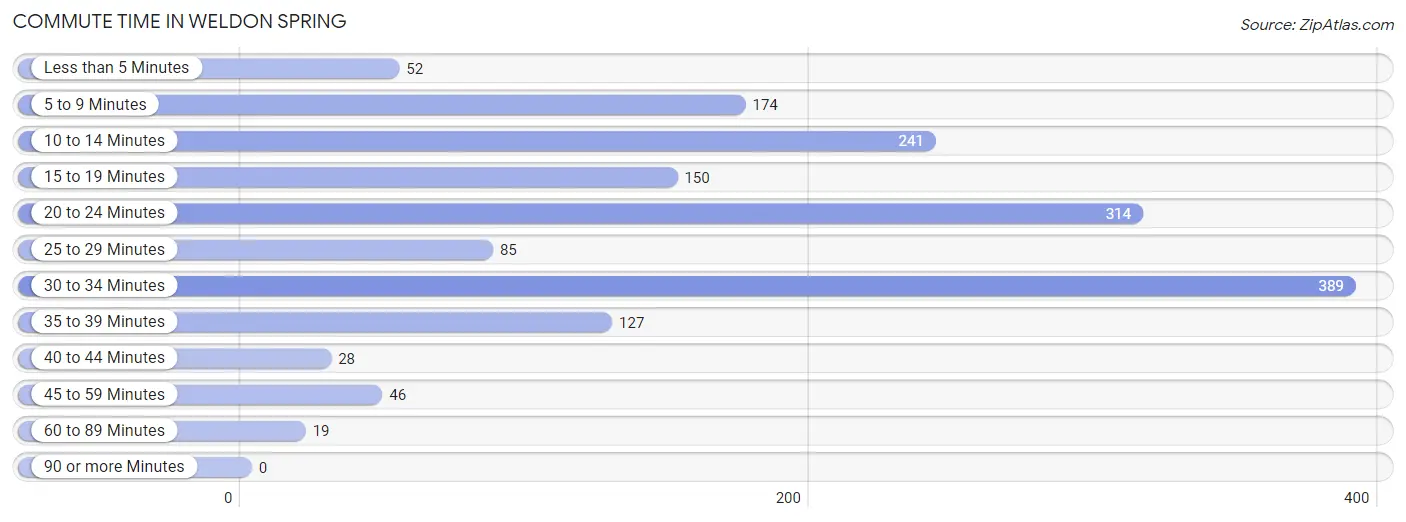
| Commute Time | # Commuters | % Commuters |
| Less than 5 Minutes | 52 | 3.2% |
| 5 to 9 Minutes | 174 | 10.7% |
| 10 to 14 Minutes | 241 | 14.8% |
| 15 to 19 Minutes | 150 | 9.2% |
| 20 to 24 Minutes | 314 | 19.3% |
| 25 to 29 Minutes | 85 | 5.2% |
| 30 to 34 Minutes | 389 | 23.9% |
| 35 to 39 Minutes | 127 | 7.8% |
| 40 to 44 Minutes | 28 | 1.7% |
| 45 to 59 Minutes | 46 | 2.8% |
| 60 to 89 Minutes | 19 | 1.2% |
| 90 or more Minutes | 0 | 0.0% |
Commute Time by Sex in Weldon Spring
The most common commute times in Weldon Spring are 30 to 34 minutes (238 commuters, 27.0%) for males and 10 to 14 minutes (163 commuters, 22.0%) for females.
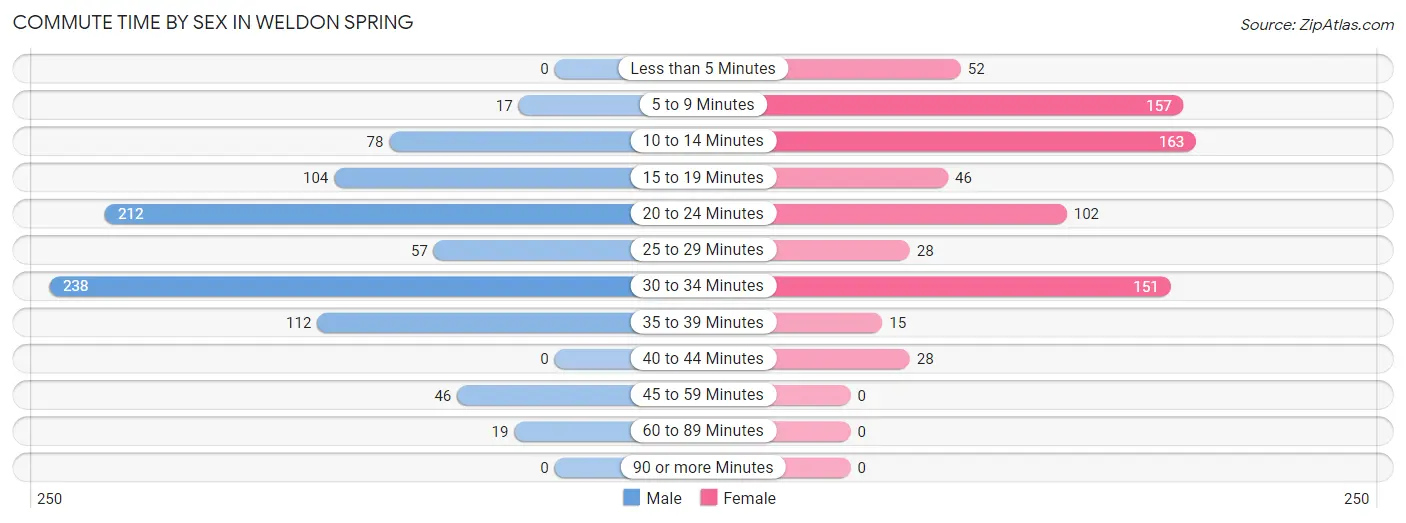
| Commute Time | Male | Female |
| Less than 5 Minutes | 0 (0.0%) | 52 (7.0%) |
| 5 to 9 Minutes | 17 (1.9%) | 157 (21.2%) |
| 10 to 14 Minutes | 78 (8.8%) | 163 (22.0%) |
| 15 to 19 Minutes | 104 (11.8%) | 46 (6.2%) |
| 20 to 24 Minutes | 212 (24.0%) | 102 (13.8%) |
| 25 to 29 Minutes | 57 (6.5%) | 28 (3.8%) |
| 30 to 34 Minutes | 238 (27.0%) | 151 (20.3%) |
| 35 to 39 Minutes | 112 (12.7%) | 15 (2.0%) |
| 40 to 44 Minutes | 0 (0.0%) | 28 (3.8%) |
| 45 to 59 Minutes | 46 (5.2%) | 0 (0.0%) |
| 60 to 89 Minutes | 19 (2.1%) | 0 (0.0%) |
| 90 or more Minutes | 0 (0.0%) | 0 (0.0%) |
Time of Departure to Work by Sex in Weldon Spring
The most frequent times of departure to work in Weldon Spring are 7:00 AM to 7:29 AM (199, 22.5%) for males and 8:00 AM to 8:29 AM (198, 26.7%) for females.
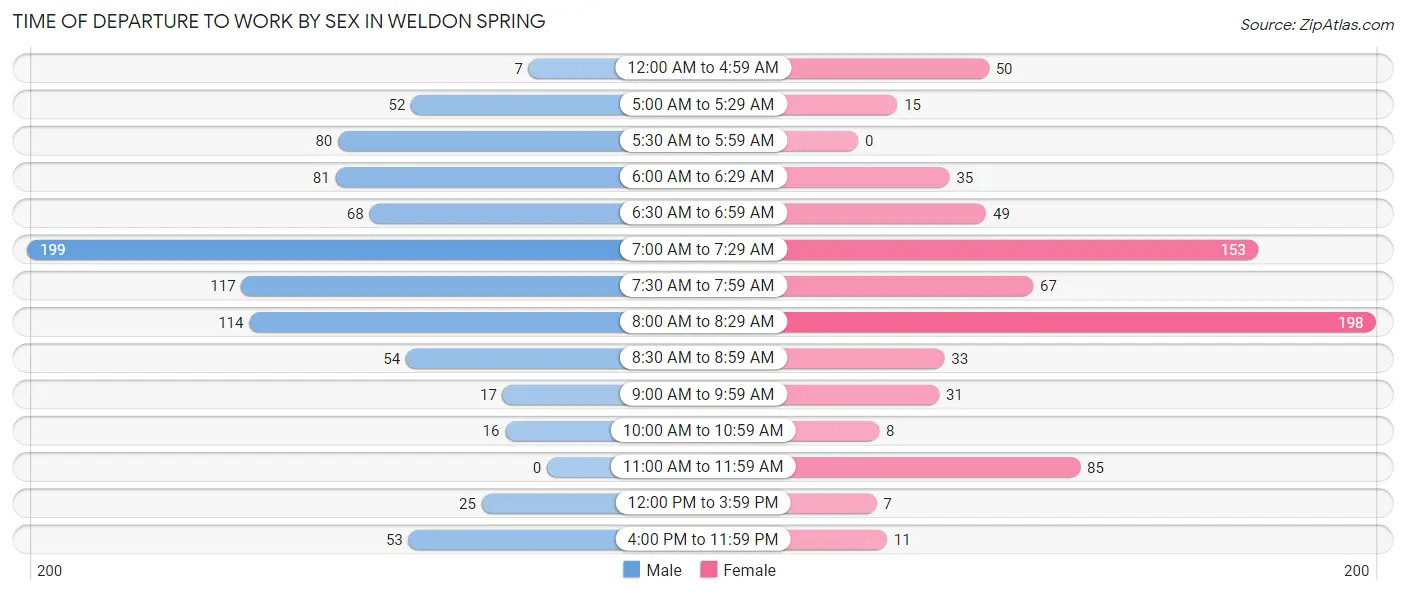
| Time of Departure | Male | Female |
| 12:00 AM to 4:59 AM | 7 (0.8%) | 50 (6.7%) |
| 5:00 AM to 5:29 AM | 52 (5.9%) | 15 (2.0%) |
| 5:30 AM to 5:59 AM | 80 (9.1%) | 0 (0.0%) |
| 6:00 AM to 6:29 AM | 81 (9.2%) | 35 (4.7%) |
| 6:30 AM to 6:59 AM | 68 (7.7%) | 49 (6.6%) |
| 7:00 AM to 7:29 AM | 199 (22.5%) | 153 (20.6%) |
| 7:30 AM to 7:59 AM | 117 (13.3%) | 67 (9.0%) |
| 8:00 AM to 8:29 AM | 114 (12.9%) | 198 (26.7%) |
| 8:30 AM to 8:59 AM | 54 (6.1%) | 33 (4.4%) |
| 9:00 AM to 9:59 AM | 17 (1.9%) | 31 (4.2%) |
| 10:00 AM to 10:59 AM | 16 (1.8%) | 8 (1.1%) |
| 11:00 AM to 11:59 AM | 0 (0.0%) | 85 (11.5%) |
| 12:00 PM to 3:59 PM | 25 (2.8%) | 7 (0.9%) |
| 4:00 PM to 11:59 PM | 53 (6.0%) | 11 (1.5%) |
| Total | 883 (100.0%) | 742 (100.0%) |
Housing Occupancy in Weldon Spring
Occupancy by Ownership in Weldon Spring
Of the total 2,162 dwellings in Weldon Spring, owner-occupied units account for 1,915 (88.6%), while renter-occupied units make up 247 (11.4%).
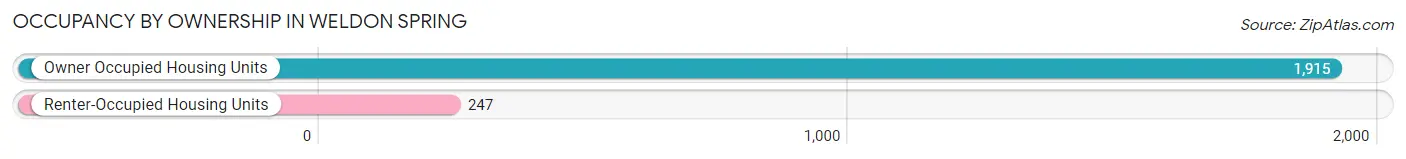
| Occupancy | # Housing Units | % Housing Units |
| Owner Occupied Housing Units | 1,915 | 88.6% |
| Renter-Occupied Housing Units | 247 | 11.4% |
| Total Occupied Housing Units | 2,162 | 100.0% |
Occupancy by Household Size in Weldon Spring
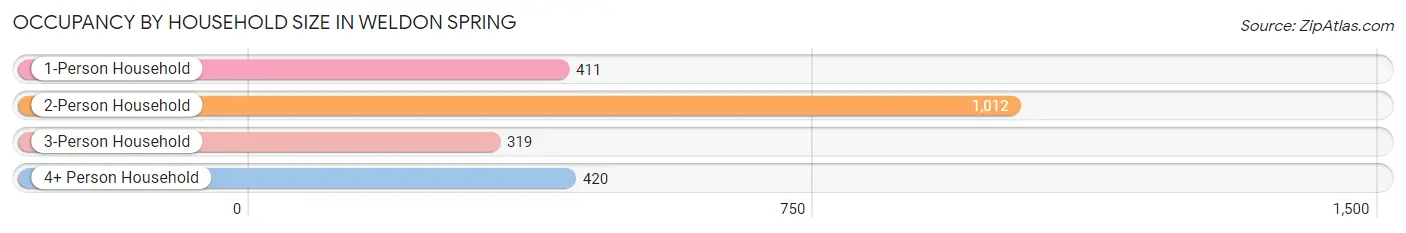
| Household Size | # Housing Units | % Housing Units |
| 1-Person Household | 411 | 19.0% |
| 2-Person Household | 1,012 | 46.8% |
| 3-Person Household | 319 | 14.7% |
| 4+ Person Household | 420 | 19.4% |
| Total Housing Units | 2,162 | 100.0% |
Occupancy by Ownership by Household Size in Weldon Spring
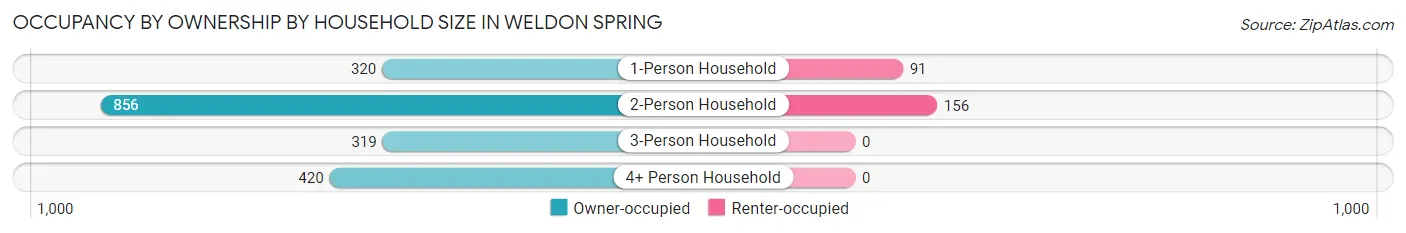
| Household Size | Owner-occupied | Renter-occupied |
| 1-Person Household | 320 (77.9%) | 91 (22.1%) |
| 2-Person Household | 856 (84.6%) | 156 (15.4%) |
| 3-Person Household | 319 (100.0%) | 0 (0.0%) |
| 4+ Person Household | 420 (100.0%) | 0 (0.0%) |
| Total Housing Units | 1,915 (88.6%) | 247 (11.4%) |
Occupancy by Educational Attainment in Weldon Spring
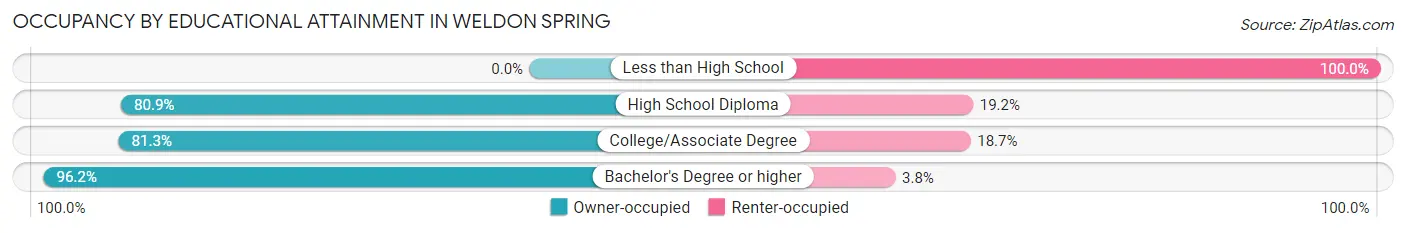
| Household Size | Owner-occupied | Renter-occupied |
| Less than High School | 0 (0.0%) | 29 (100.0%) |
| High School Diploma | 325 (80.8%) | 77 (19.2%) |
| College/Associate Degree | 414 (81.3%) | 95 (18.7%) |
| Bachelor's Degree or higher | 1,176 (96.2%) | 46 (3.8%) |
Occupancy by Age of Householder in Weldon Spring
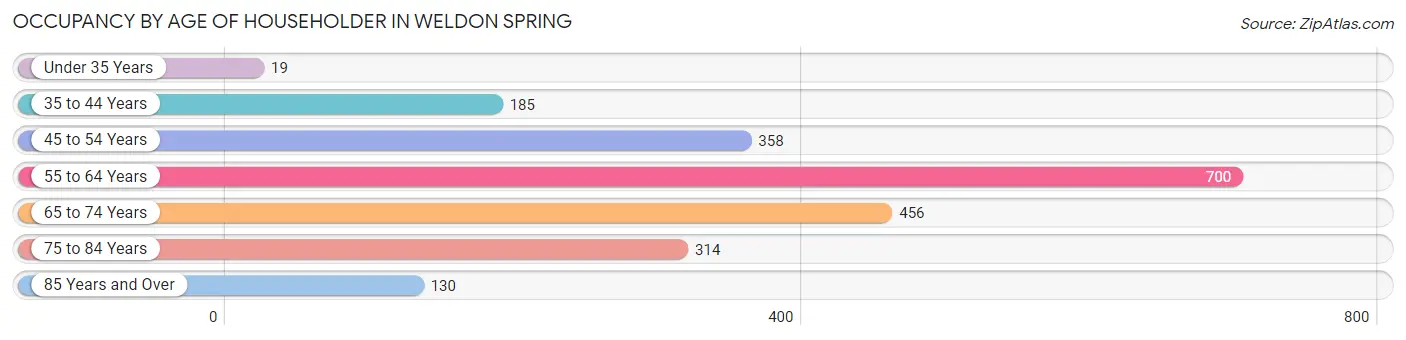
| Age Bracket | # Households | % Households |
| Under 35 Years | 19 | 0.9% |
| 35 to 44 Years | 185 | 8.6% |
| 45 to 54 Years | 358 | 16.6% |
| 55 to 64 Years | 700 | 32.4% |
| 65 to 74 Years | 456 | 21.1% |
| 75 to 84 Years | 314 | 14.5% |
| 85 Years and Over | 130 | 6.0% |
| Total | 2,162 | 100.0% |
Housing Finances in Weldon Spring
Median Income by Occupancy in Weldon Spring
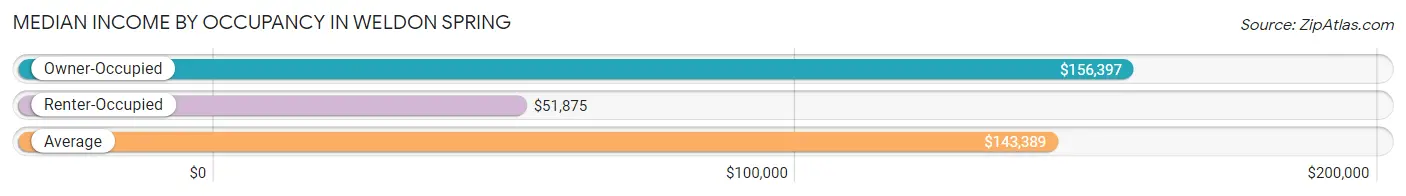
| Occupancy Type | # Households | Median Income |
| Owner-Occupied | 1,915 (88.6%) | $156,397 |
| Renter-Occupied | 247 (11.4%) | $51,875 |
| Average | 2,162 (100.0%) | $143,389 |
Occupancy by Householder Income Bracket in Weldon Spring
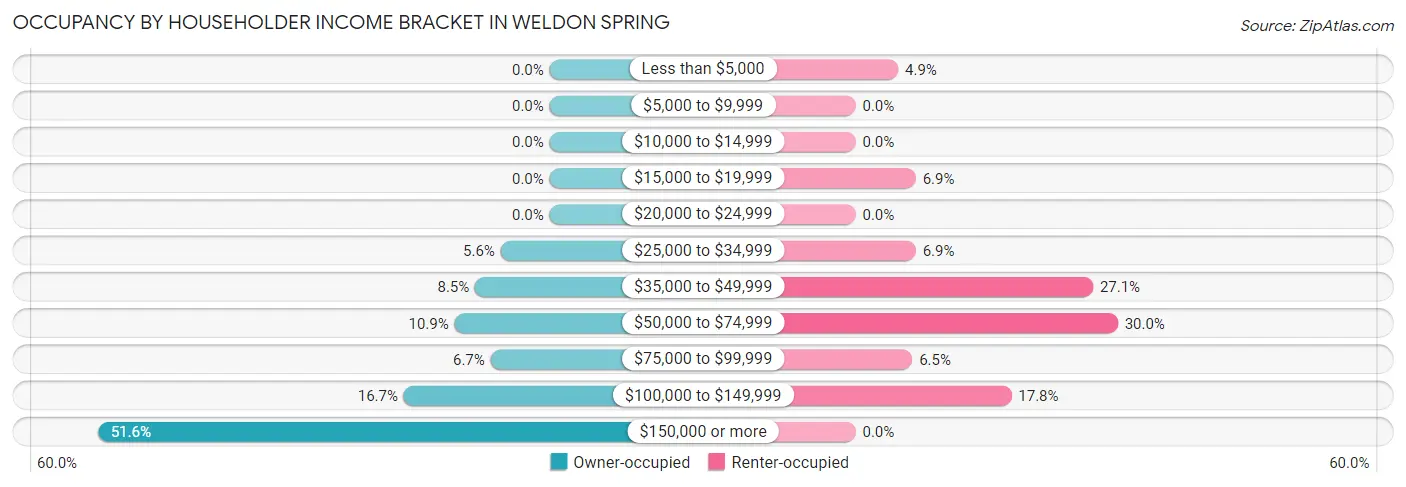
| Income Bracket | Owner-occupied | Renter-occupied |
| Less than $5,000 | 0 (0.0%) | 12 (4.9%) |
| $5,000 to $9,999 | 0 (0.0%) | 0 (0.0%) |
| $10,000 to $14,999 | 0 (0.0%) | 0 (0.0%) |
| $15,000 to $19,999 | 0 (0.0%) | 17 (6.9%) |
| $20,000 to $24,999 | 0 (0.0%) | 0 (0.0%) |
| $25,000 to $34,999 | 107 (5.6%) | 17 (6.9%) |
| $35,000 to $49,999 | 163 (8.5%) | 67 (27.1%) |
| $50,000 to $74,999 | 208 (10.9%) | 74 (30.0%) |
| $75,000 to $99,999 | 129 (6.7%) | 16 (6.5%) |
| $100,000 to $149,999 | 319 (16.7%) | 44 (17.8%) |
| $150,000 or more | 989 (51.6%) | 0 (0.0%) |
| Total | 1,915 (100.0%) | 247 (100.0%) |
Monthly Housing Cost Tiers in Weldon Spring
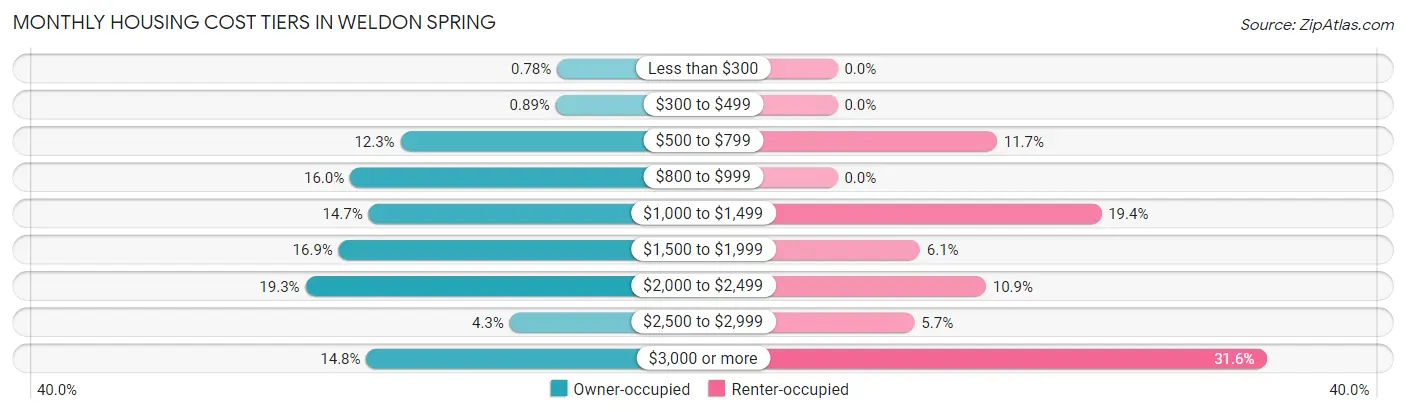
| Monthly Cost | Owner-occupied | Renter-occupied |
| Less than $300 | 15 (0.8%) | 0 (0.0%) |
| $300 to $499 | 17 (0.9%) | 0 (0.0%) |
| $500 to $799 | 236 (12.3%) | 29 (11.7%) |
| $800 to $999 | 307 (16.0%) | 0 (0.0%) |
| $1,000 to $1,499 | 281 (14.7%) | 48 (19.4%) |
| $1,500 to $1,999 | 323 (16.9%) | 15 (6.1%) |
| $2,000 to $2,499 | 370 (19.3%) | 27 (10.9%) |
| $2,500 to $2,999 | 82 (4.3%) | 14 (5.7%) |
| $3,000 or more | 284 (14.8%) | 78 (31.6%) |
| Total | 1,915 (100.0%) | 247 (100.0%) |
Physical Housing Characteristics in Weldon Spring
Housing Structures in Weldon Spring
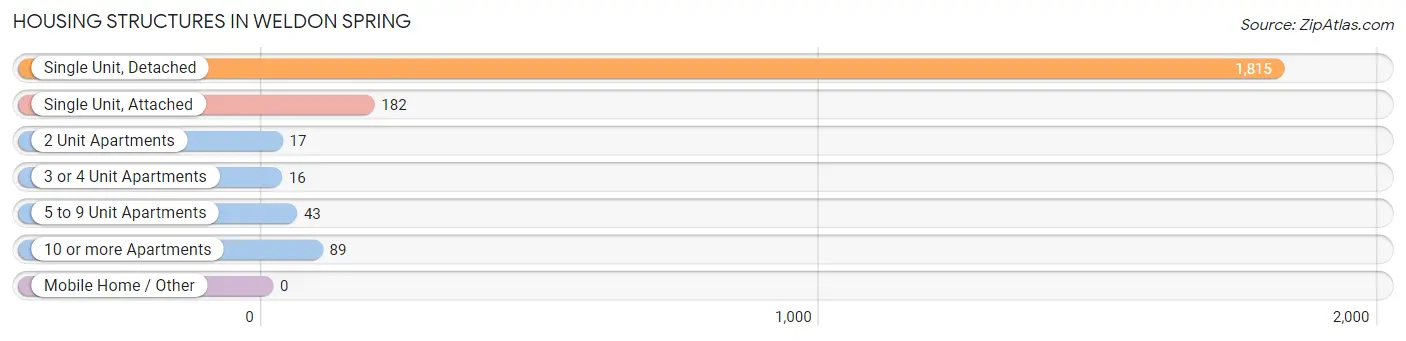
| Structure Type | # Housing Units | % Housing Units |
| Single Unit, Detached | 1,815 | 84.0% |
| Single Unit, Attached | 182 | 8.4% |
| 2 Unit Apartments | 17 | 0.8% |
| 3 or 4 Unit Apartments | 16 | 0.7% |
| 5 to 9 Unit Apartments | 43 | 2.0% |
| 10 or more Apartments | 89 | 4.1% |
| Mobile Home / Other | 0 | 0.0% |
| Total | 2,162 | 100.0% |
Housing Structures by Occupancy in Weldon Spring
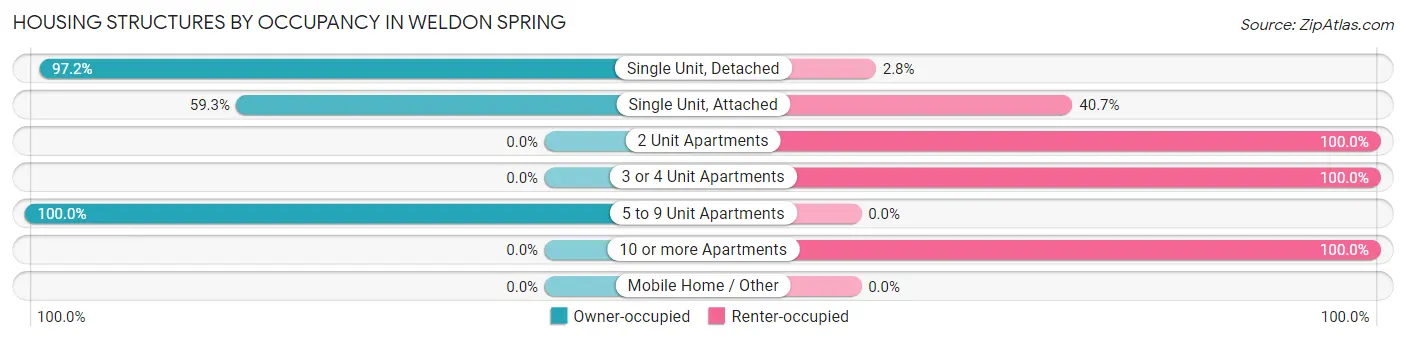
| Structure Type | Owner-occupied | Renter-occupied |
| Single Unit, Detached | 1,764 (97.2%) | 51 (2.8%) |
| Single Unit, Attached | 108 (59.3%) | 74 (40.7%) |
| 2 Unit Apartments | 0 (0.0%) | 17 (100.0%) |
| 3 or 4 Unit Apartments | 0 (0.0%) | 16 (100.0%) |
| 5 to 9 Unit Apartments | 43 (100.0%) | 0 (0.0%) |
| 10 or more Apartments | 0 (0.0%) | 89 (100.0%) |
| Mobile Home / Other | 0 (0.0%) | 0 (0.0%) |
| Total | 1,915 (88.6%) | 247 (11.4%) |
Housing Structures by Number of Rooms in Weldon Spring
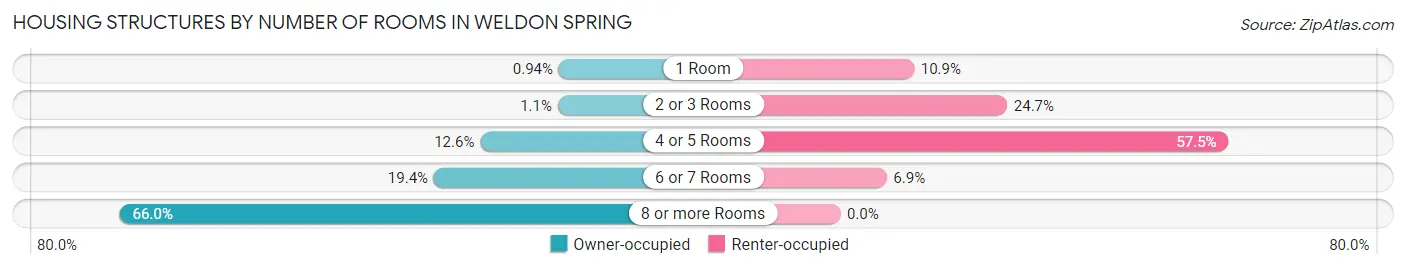
| Number of Rooms | Owner-occupied | Renter-occupied |
| 1 Room | 18 (0.9%) | 27 (10.9%) |
| 2 or 3 Rooms | 21 (1.1%) | 61 (24.7%) |
| 4 or 5 Rooms | 241 (12.6%) | 142 (57.5%) |
| 6 or 7 Rooms | 372 (19.4%) | 17 (6.9%) |
| 8 or more Rooms | 1,263 (65.9%) | 0 (0.0%) |
| Total | 1,915 (100.0%) | 247 (100.0%) |
Housing Structure by Heating Type in Weldon Spring
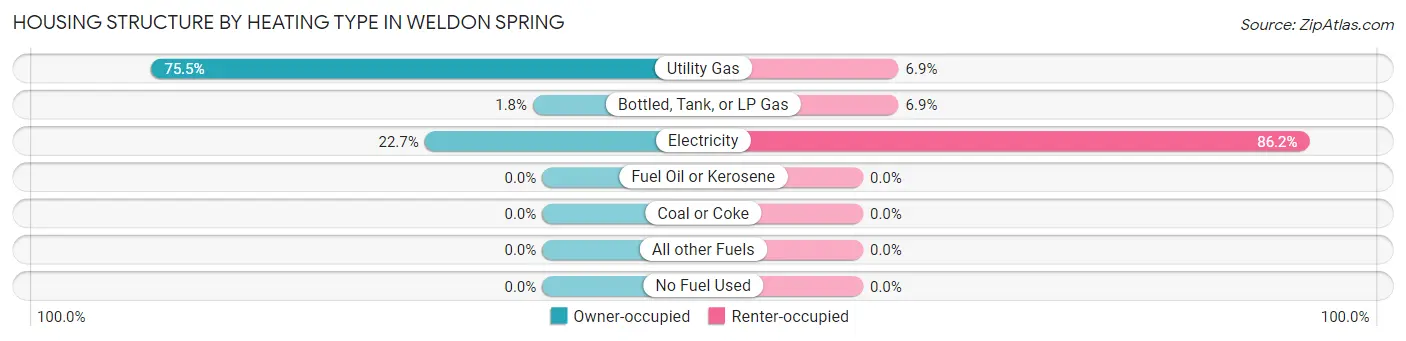
| Heating Type | Owner-occupied | Renter-occupied |
| Utility Gas | 1,446 (75.5%) | 17 (6.9%) |
| Bottled, Tank, or LP Gas | 34 (1.8%) | 17 (6.9%) |
| Electricity | 435 (22.7%) | 213 (86.2%) |
| Fuel Oil or Kerosene | 0 (0.0%) | 0 (0.0%) |
| Coal or Coke | 0 (0.0%) | 0 (0.0%) |
| All other Fuels | 0 (0.0%) | 0 (0.0%) |
| No Fuel Used | 0 (0.0%) | 0 (0.0%) |
| Total | 1,915 (100.0%) | 247 (100.0%) |
Household Vehicle Usage in Weldon Spring
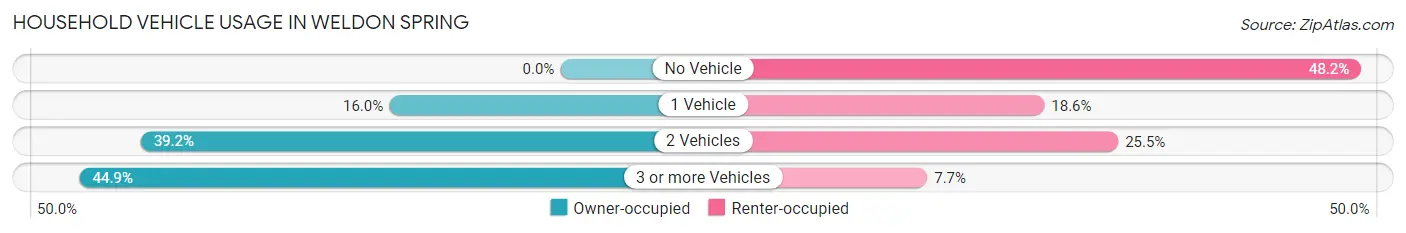
| Vehicles per Household | Owner-occupied | Renter-occupied |
| No Vehicle | 0 (0.0%) | 119 (48.2%) |
| 1 Vehicle | 306 (16.0%) | 46 (18.6%) |
| 2 Vehicles | 750 (39.2%) | 63 (25.5%) |
| 3 or more Vehicles | 859 (44.9%) | 19 (7.7%) |
| Total | 1,915 (100.0%) | 247 (100.0%) |
Real Estate & Mortgages in Weldon Spring
Real Estate and Mortgage Overview in Weldon Spring
| Characteristic | Without Mortgage | With Mortgage |
| Housing Units | 719 | 1,196 |
| Median Property Value | $521,600 | $481,700 |
| Median Household Income | $143,375 | $649 |
| Monthly Housing Costs | $921 | $267 |
| Real Estate Taxes | $4,932 | $0 |
Property Value by Mortgage Status in Weldon Spring
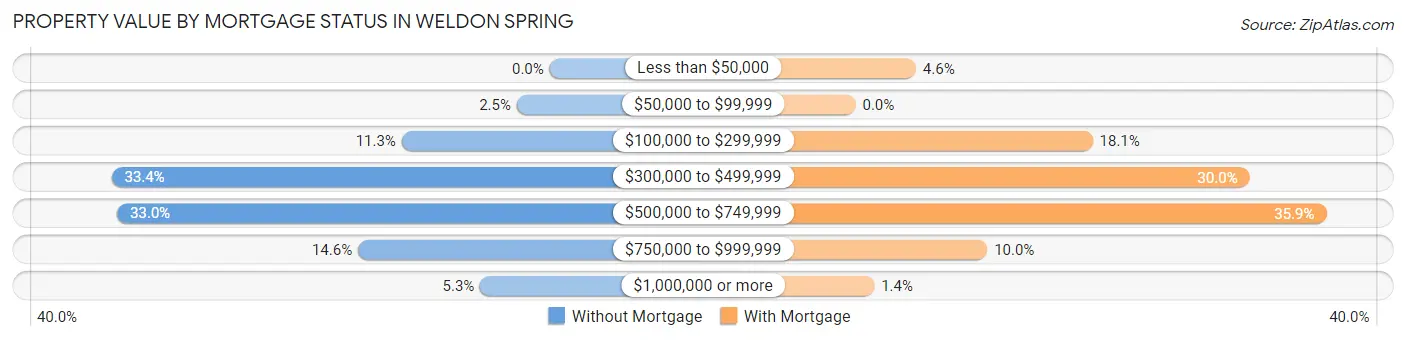
| Property Value | Without Mortgage | With Mortgage |
| Less than $50,000 | 0 (0.0%) | 55 (4.6%) |
| $50,000 to $99,999 | 18 (2.5%) | 0 (0.0%) |
| $100,000 to $299,999 | 81 (11.3%) | 216 (18.1%) |
| $300,000 to $499,999 | 240 (33.4%) | 359 (30.0%) |
| $500,000 to $749,999 | 237 (33.0%) | 429 (35.9%) |
| $750,000 to $999,999 | 105 (14.6%) | 120 (10.0%) |
| $1,000,000 or more | 38 (5.3%) | 17 (1.4%) |
| Total | 719 (100.0%) | 1,196 (100.0%) |
Household Income by Mortgage Status in Weldon Spring
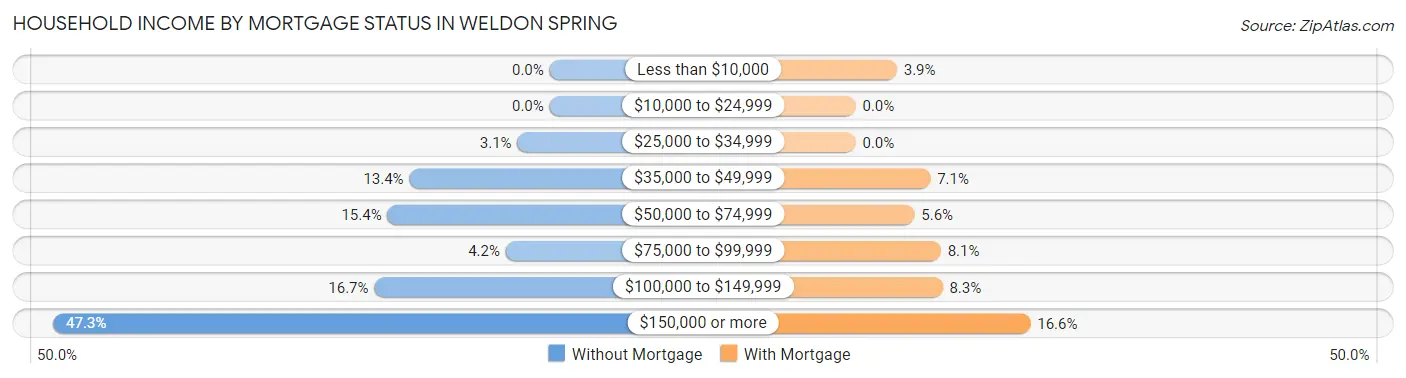
| Household Income | Without Mortgage | With Mortgage |
| Less than $10,000 | 0 (0.0%) | 47 (3.9%) |
| $10,000 to $24,999 | 0 (0.0%) | 0 (0.0%) |
| $25,000 to $34,999 | 22 (3.1%) | 0 (0.0%) |
| $35,000 to $49,999 | 96 (13.4%) | 85 (7.1%) |
| $50,000 to $74,999 | 111 (15.4%) | 67 (5.6%) |
| $75,000 to $99,999 | 30 (4.2%) | 97 (8.1%) |
| $100,000 to $149,999 | 120 (16.7%) | 99 (8.3%) |
| $150,000 or more | 340 (47.3%) | 199 (16.6%) |
| Total | 719 (100.0%) | 1,196 (100.0%) |
Property Value to Household Income Ratio in Weldon Spring
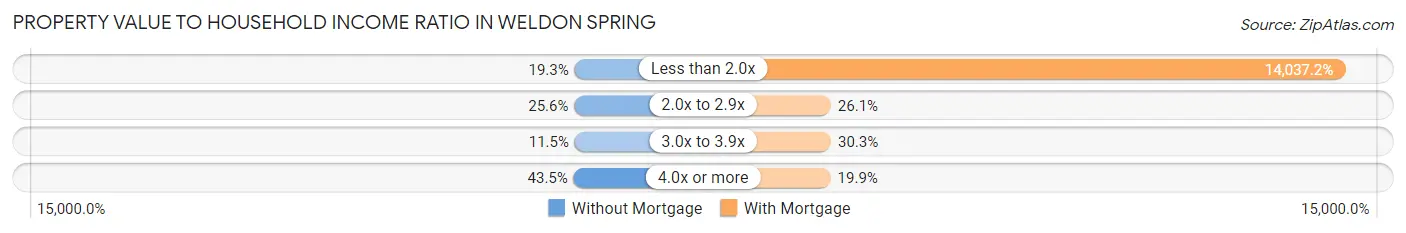
| Value-to-Income Ratio | Without Mortgage | With Mortgage |
| Less than 2.0x | 139 (19.3%) | 167,885 (14,037.2%) |
| 2.0x to 2.9x | 184 (25.6%) | 312 (26.1%) |
| 3.0x to 3.9x | 83 (11.5%) | 362 (30.3%) |
| 4.0x or more | 313 (43.5%) | 238 (19.9%) |
| Total | 719 (100.0%) | 1,196 (100.0%) |
Real Estate Taxes by Mortgage Status in Weldon Spring
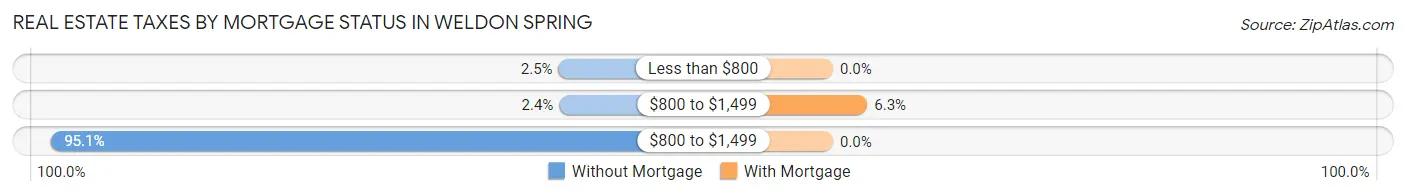
| Property Taxes | Without Mortgage | With Mortgage |
| Less than $800 | 18 (2.5%) | 0 (0.0%) |
| $800 to $1,499 | 17 (2.4%) | 75 (6.3%) |
| $800 to $1,499 | 684 (95.1%) | 0 (0.0%) |
| Total | 719 (100.0%) | 1,196 (100.0%) |
Health & Disability in Weldon Spring
Health Insurance Coverage by Age in Weldon Spring
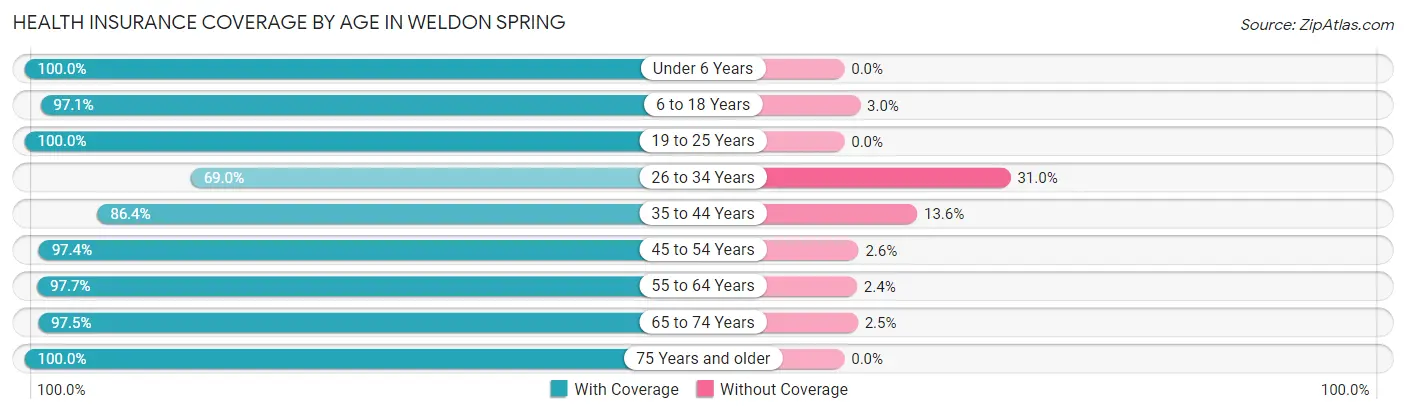
| Age Bracket | With Coverage | Without Coverage |
| Under 6 Years | 82 (100.0%) | 0 (0.0%) |
| 6 to 18 Years | 723 (97.1%) | 22 (2.9%) |
| 19 to 25 Years | 254 (100.0%) | 0 (0.0%) |
| 26 to 34 Years | 118 (69.0%) | 53 (31.0%) |
| 35 to 44 Years | 408 (86.4%) | 64 (13.6%) |
| 45 to 54 Years | 702 (97.4%) | 19 (2.6%) |
| 55 to 64 Years | 1,290 (97.7%) | 31 (2.4%) |
| 65 to 74 Years | 663 (97.5%) | 17 (2.5%) |
| 75 Years and older | 797 (100.0%) | 0 (0.0%) |
| Total | 5,037 (96.1%) | 206 (3.9%) |
Health Insurance Coverage by Citizenship Status in Weldon Spring
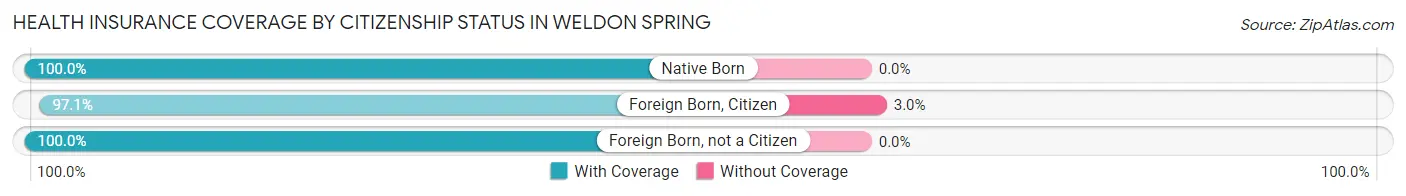
| Citizenship Status | With Coverage | Without Coverage |
| Native Born | 82 (100.0%) | 0 (0.0%) |
| Foreign Born, Citizen | 723 (97.1%) | 22 (2.9%) |
| Foreign Born, not a Citizen | 254 (100.0%) | 0 (0.0%) |
Health Insurance Coverage by Household Income in Weldon Spring
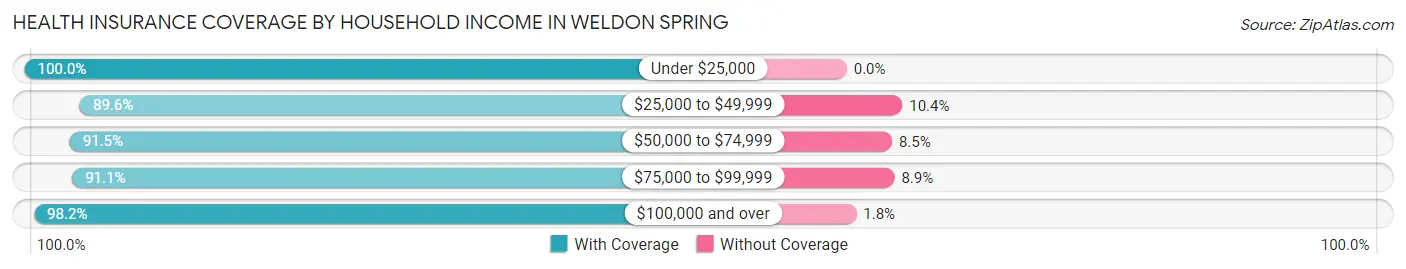
| Household Income | With Coverage | Without Coverage |
| Under $25,000 | 29 (100.0%) | 0 (0.0%) |
| $25,000 to $49,999 | 620 (89.6%) | 72 (10.4%) |
| $50,000 to $74,999 | 389 (91.5%) | 36 (8.5%) |
| $75,000 to $99,999 | 316 (91.1%) | 31 (8.9%) |
| $100,000 and over | 3,683 (98.2%) | 67 (1.8%) |
Public vs Private Health Insurance Coverage by Age in Weldon Spring
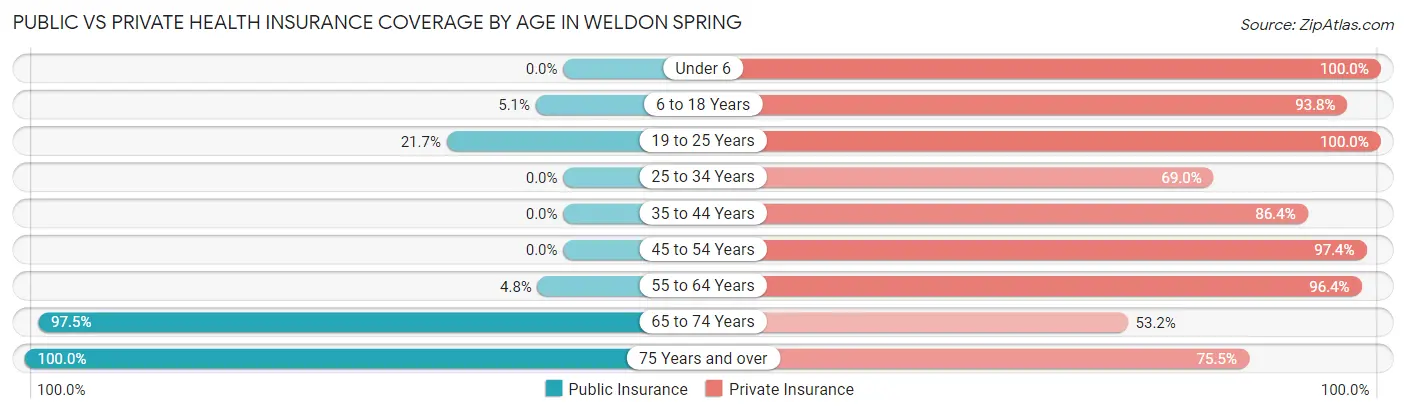
| Age Bracket | Public Insurance | Private Insurance |
| Under 6 | 0 (0.0%) | 82 (100.0%) |
| 6 to 18 Years | 38 (5.1%) | 699 (93.8%) |
| 19 to 25 Years | 55 (21.6%) | 254 (100.0%) |
| 25 to 34 Years | 0 (0.0%) | 118 (69.0%) |
| 35 to 44 Years | 0 (0.0%) | 408 (86.4%) |
| 45 to 54 Years | 0 (0.0%) | 702 (97.4%) |
| 55 to 64 Years | 63 (4.8%) | 1,274 (96.4%) |
| 65 to 74 Years | 663 (97.5%) | 362 (53.2%) |
| 75 Years and over | 797 (100.0%) | 602 (75.5%) |
| Total | 1,616 (30.8%) | 4,501 (85.9%) |
Disability Status by Sex by Age in Weldon Spring
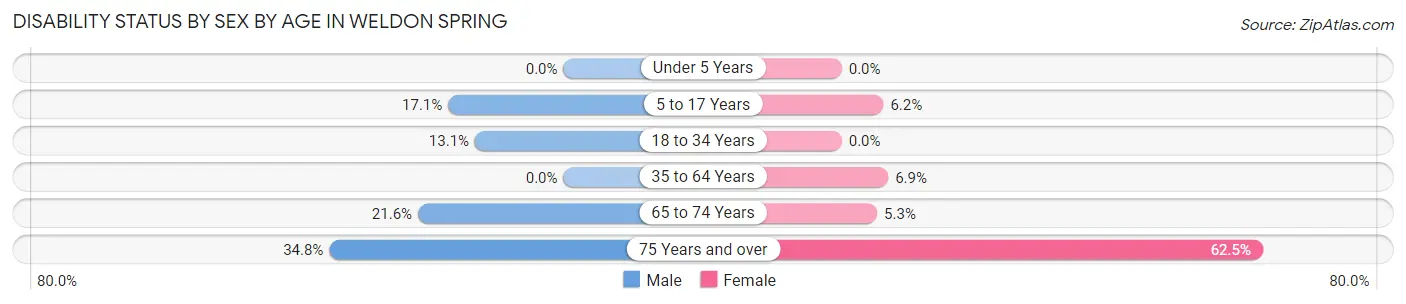
| Age Bracket | Male | Female |
| Under 5 Years | 0 (0.0%) | 0 (0.0%) |
| 5 to 17 Years | 45 (17.1%) | 26 (6.2%) |
| 18 to 34 Years | 55 (13.1%) | 0 (0.0%) |
| 35 to 64 Years | 0 (0.0%) | 91 (6.9%) |
| 65 to 74 Years | 81 (21.6%) | 16 (5.2%) |
| 75 Years and over | 113 (34.8%) | 295 (62.5%) |
Disability Class by Sex by Age in Weldon Spring
Disability Class: Hearing Difficulty
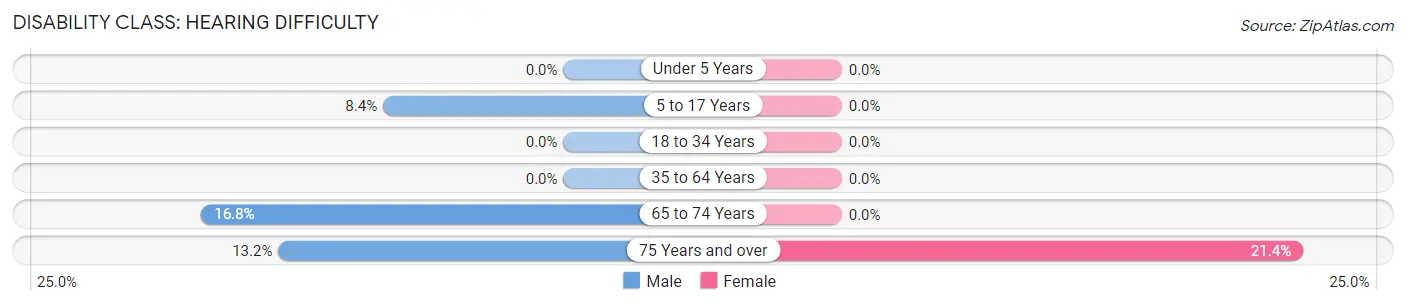
| Age Bracket | Male | Female |
| Under 5 Years | 0 (0.0%) | 0 (0.0%) |
| 5 to 17 Years | 22 (8.4%) | 0 (0.0%) |
| 18 to 34 Years | 0 (0.0%) | 0 (0.0%) |
| 35 to 64 Years | 0 (0.0%) | 0 (0.0%) |
| 65 to 74 Years | 63 (16.8%) | 0 (0.0%) |
| 75 Years and over | 43 (13.2%) | 101 (21.4%) |
Disability Class: Vision Difficulty
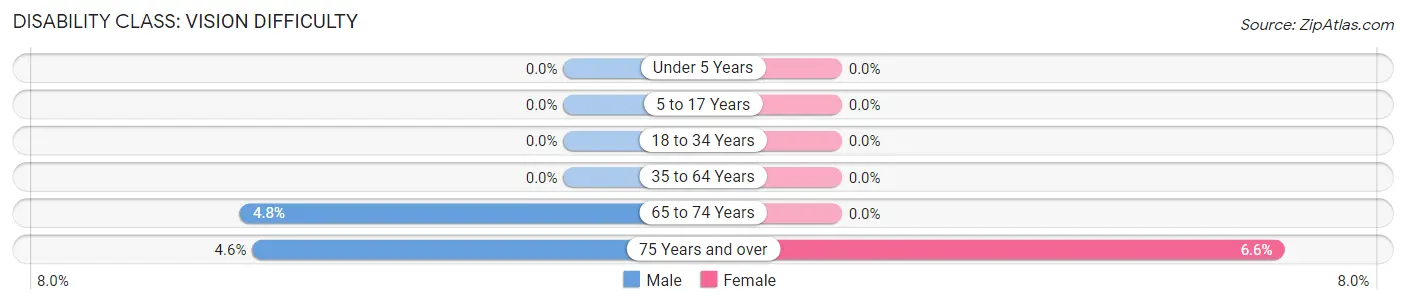
| Age Bracket | Male | Female |
| Under 5 Years | 0 (0.0%) | 0 (0.0%) |
| 5 to 17 Years | 0 (0.0%) | 0 (0.0%) |
| 18 to 34 Years | 0 (0.0%) | 0 (0.0%) |
| 35 to 64 Years | 0 (0.0%) | 0 (0.0%) |
| 65 to 74 Years | 18 (4.8%) | 0 (0.0%) |
| 75 Years and over | 15 (4.6%) | 31 (6.6%) |
Disability Class: Cognitive Difficulty
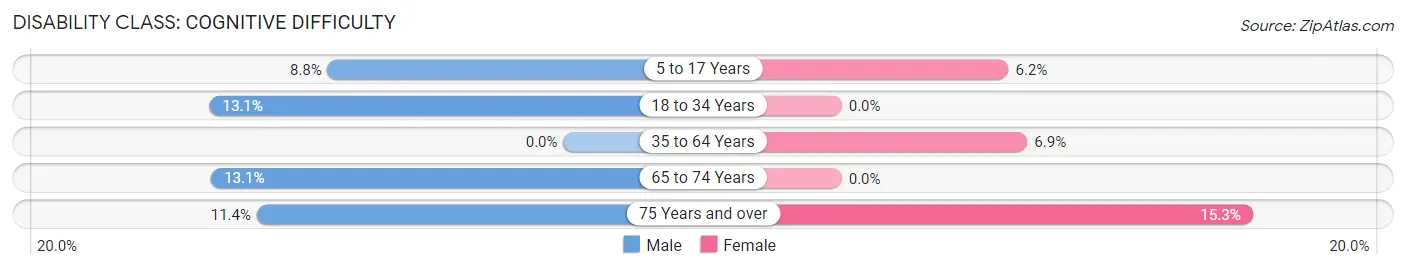
| Age Bracket | Male | Female |
| 5 to 17 Years | 23 (8.7%) | 26 (6.2%) |
| 18 to 34 Years | 55 (13.1%) | 0 (0.0%) |
| 35 to 64 Years | 0 (0.0%) | 91 (6.9%) |
| 65 to 74 Years | 49 (13.1%) | 0 (0.0%) |
| 75 Years and over | 37 (11.4%) | 72 (15.2%) |
Disability Class: Ambulatory Difficulty
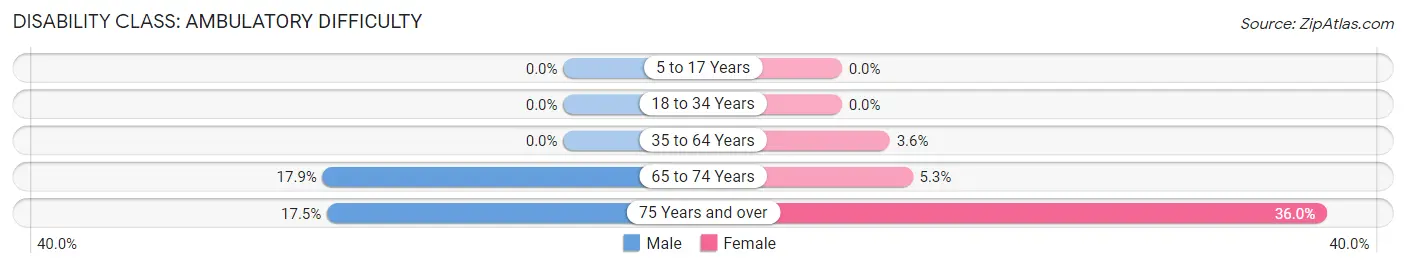
| Age Bracket | Male | Female |
| 5 to 17 Years | 0 (0.0%) | 0 (0.0%) |
| 18 to 34 Years | 0 (0.0%) | 0 (0.0%) |
| 35 to 64 Years | 0 (0.0%) | 47 (3.6%) |
| 65 to 74 Years | 67 (17.9%) | 16 (5.2%) |
| 75 Years and over | 57 (17.5%) | 170 (36.0%) |
Disability Class: Self-Care Difficulty
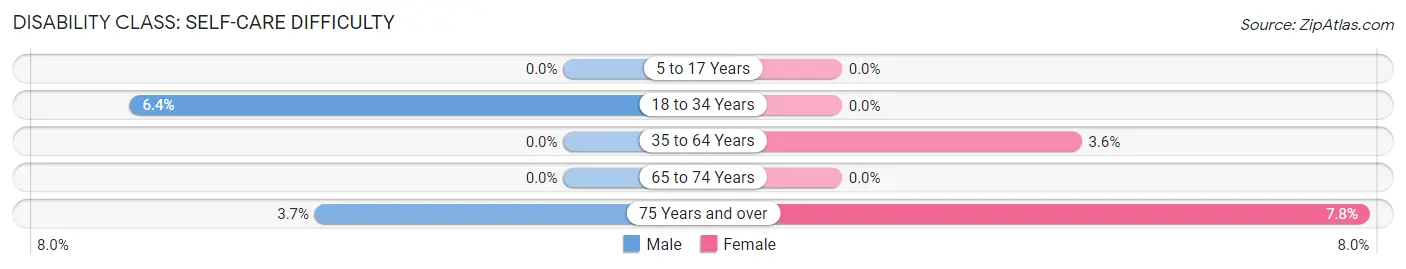
| Age Bracket | Male | Female |
| 5 to 17 Years | 0 (0.0%) | 0 (0.0%) |
| 18 to 34 Years | 27 (6.4%) | 0 (0.0%) |
| 35 to 64 Years | 0 (0.0%) | 47 (3.6%) |
| 65 to 74 Years | 0 (0.0%) | 0 (0.0%) |
| 75 Years and over | 12 (3.7%) | 37 (7.8%) |
Technology Access in Weldon Spring
Computing Device Access in Weldon Spring
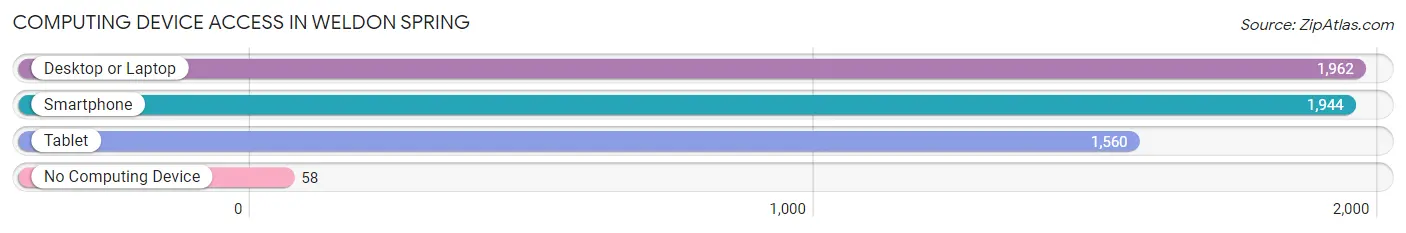
| Device Type | # Households | % Households |
| Desktop or Laptop | 1,962 | 90.7% |
| Smartphone | 1,944 | 89.9% |
| Tablet | 1,560 | 72.2% |
| No Computing Device | 58 | 2.7% |
| Total | 2,162 | 100.0% |
Internet Access in Weldon Spring
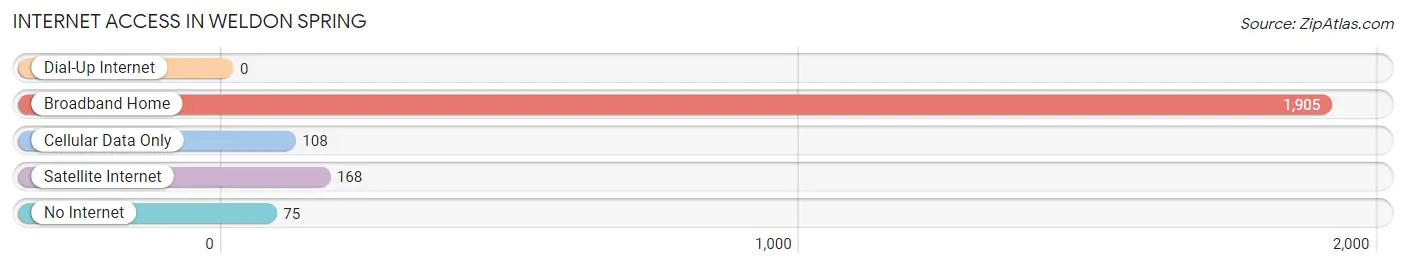
| Internet Type | # Households | % Households |
| Dial-Up Internet | 0 | 0.0% |
| Broadband Home | 1,905 | 88.1% |
| Cellular Data Only | 108 | 5.0% |
| Satellite Internet | 168 | 7.8% |
| No Internet | 75 | 3.5% |
| Total | 2,162 | 100.0% |
Weldon Spring Summary
Weldon Spring is a small city located in St. Charles County, Missouri, United States. It is situated on the Missouri River, approximately 25 miles west of St. Louis. The city has a population of approximately 4,000 people and is part of the St. Louis metropolitan area.
History
Weldon Spring was founded in 1837 by William Weldon, a local farmer. The city was named after him and was originally a small farming community. In the late 19th century, the city began to grow as a result of the construction of the St. Louis and Iron Mountain Railroad. This railroad connected Weldon Spring to St. Louis and other nearby cities.
In the early 20th century, Weldon Spring became a popular destination for tourists. The city was home to several resorts, including the Weldon Spring Hotel, which was built in 1910. The hotel was a popular destination for visitors from St. Louis and other nearby cities.
During World War II, the U.S. government established a uranium processing plant in Weldon Spring. The plant was used to process uranium ore for the Manhattan Project. After the war, the plant was closed and the area was declared a Superfund site. The site was cleaned up in the late 1990s and is now a wildlife refuge.
Geography
Weldon Spring is located in St. Charles County, Missouri. The city is situated on the Missouri River, approximately 25 miles west of St. Louis. The city has a total area of 4.2 square miles, all of which is land. The city is located in the Missouri River Valley, which is characterized by rolling hills and wooded areas.
Economy
The economy of Weldon Spring is largely based on tourism and manufacturing. The city is home to several resorts, including the Weldon Spring Hotel, which is a popular destination for visitors from St. Louis and other nearby cities. The city is also home to several manufacturing companies, including a paper mill and a plastics factory.
Demographics
As of the 2010 census, the population of Weldon Spring was 4,039. The racial makeup of the city was 94.3% White, 1.3% African American, 0.3% Native American, 0.7% Asian, 0.1% Pacific Islander, 1.2% from other races, and 2.3% from two or more races. Hispanic or Latino of any race were 3.2% of the population.
The median household income in Weldon Spring was $50,938, and the median family income was $60,938. The per capita income for the city was $25,938. About 5.3% of families and 7.2% of the population were below the poverty line, including 8.3% of those under age 18 and 5.2% of those age 65 or over.
Common Questions
What is Per Capita Income in Weldon Spring?
Per Capita income in Weldon Spring is $73,104.
What is the Median Family Income in Weldon Spring?
Median Family Income in Weldon Spring is $173,141.
What is the Median Household income in Weldon Spring?
Median Household Income in Weldon Spring is $143,389.
What is Income or Wage Gap in Weldon Spring?
Income or Wage Gap in Weldon Spring is 35.8%.
Women in Weldon Spring earn 64.2 cents for every dollar earned by a man.
What is Inequality or Gini Index in Weldon Spring?
Inequality or Gini Index in Weldon Spring is 0.45.
What is the Total Population of Weldon Spring?
Total Population of Weldon Spring is 5,320.
What is the Total Male Population of Weldon Spring?
Total Male Population of Weldon Spring is 2,629.
What is the Total Female Population of Weldon Spring?
Total Female Population of Weldon Spring is 2,691.
What is the Ratio of Males per 100 Females in Weldon Spring?
There are 97.70 Males per 100 Females in Weldon Spring.
What is the Ratio of Females per 100 Males in Weldon Spring?
There are 102.36 Females per 100 Males in Weldon Spring.
What is the Median Population Age in Weldon Spring?
Median Population Age in Weldon Spring is 56.9 Years.
What is the Average Family Size in Weldon Spring
Average Family Size in Weldon Spring is 2.8 People.
What is the Average Household Size in Weldon Spring
Average Household Size in Weldon Spring is 2.4 People.
How Large is the Labor Force in Weldon Spring?
There are 2,366 People in the Labor Forcein in Weldon Spring.
What is the Percentage of People in the Labor Force in Weldon Spring?
50.3% of People are in the Labor Force in Weldon Spring.
What is the Unemployment Rate in Weldon Spring?
Unemployment Rate in Weldon Spring is 6.3%.