St Charles, MO Map & Demographics
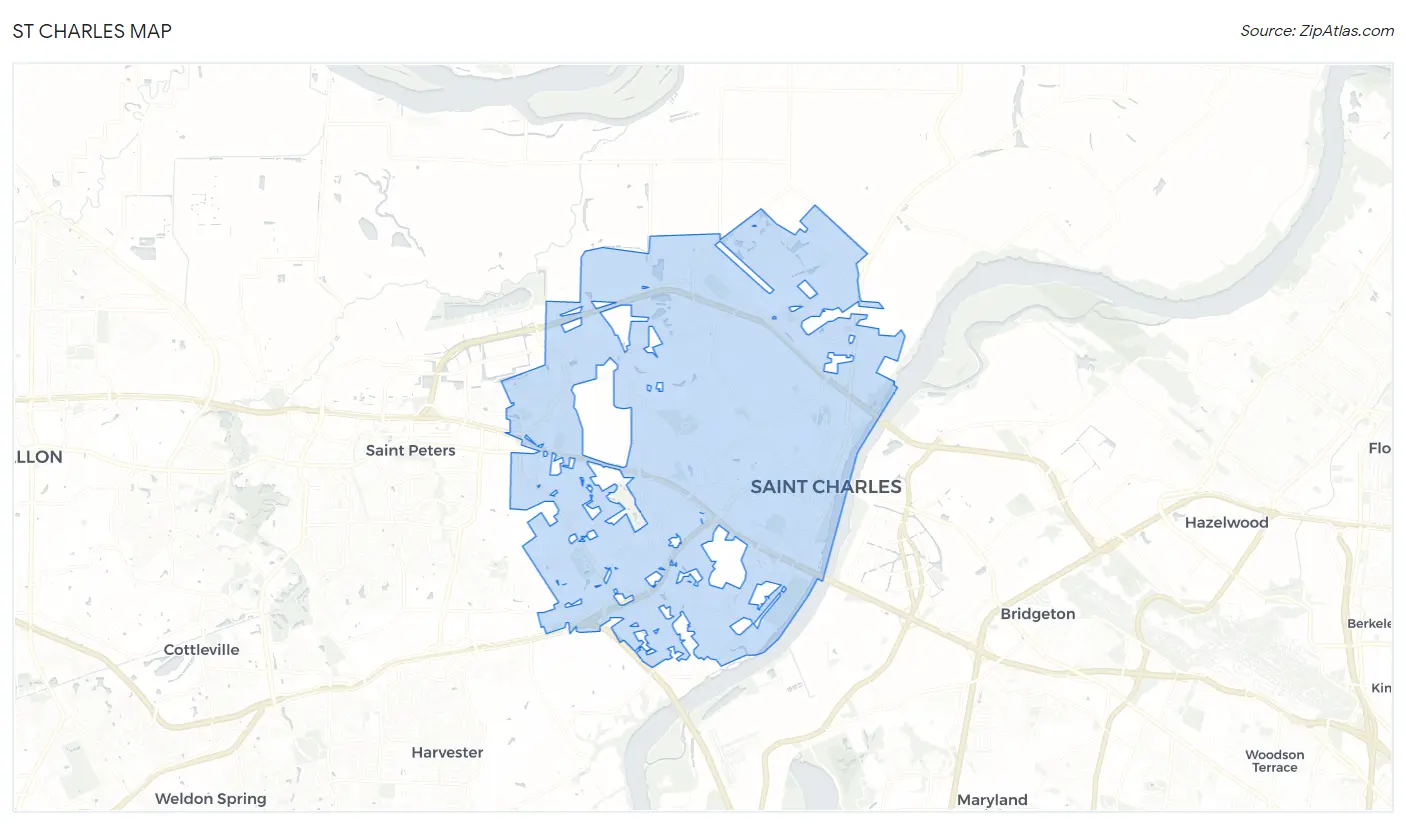
St Charles Map
St Charles Overview
$47,196
PER CAPITA INCOME
$106,426
AVG FAMILY INCOME
$83,589
AVG HOUSEHOLD INCOME
25.6%
WAGE / INCOME GAP [ % ]
74.4¢/ $1
WAGE / INCOME GAP [ $ ]
0.44
INEQUALITY / GINI INDEX
70,687
TOTAL POPULATION
34,763
MALE POPULATION
35,924
FEMALE POPULATION
96.77
MALES / 100 FEMALES
103.34
FEMALES / 100 MALES
38.2
MEDIAN AGE
2.8
AVG FAMILY SIZE
2.2
AVG HOUSEHOLD SIZE
39,087
LABOR FORCE [ PEOPLE ]
65.7%
PERCENT IN LABOR FORCE
2.5%
UNEMPLOYMENT RATE
Income in St Charles
Income Overview in St Charles
Per Capita Income in St Charles is $47,196, while median incomes of families and households are $106,426 and $83,589 respectively.
| Characteristic | Number | Measure |
| Per Capita Income | 70,687 | $47,196 |
| Median Family Income | 17,347 | $106,426 |
| Mean Family Income | 17,347 | $129,105 |
| Median Household Income | 29,760 | $83,589 |
| Mean Household Income | 29,760 | $110,087 |
| Income Deficit | 17,347 | $0 |
| Wage / Income Gap (%) | 70,687 | 25.60% |
| Wage / Income Gap ($) | 70,687 | 74.40¢ per $1 |
| Gini / Inequality Index | 70,687 | 0.44 |
Earnings by Sex in St Charles
Average Earnings in St Charles are $47,828, $55,797 for men and $41,513 for women, a difference of 25.6%.
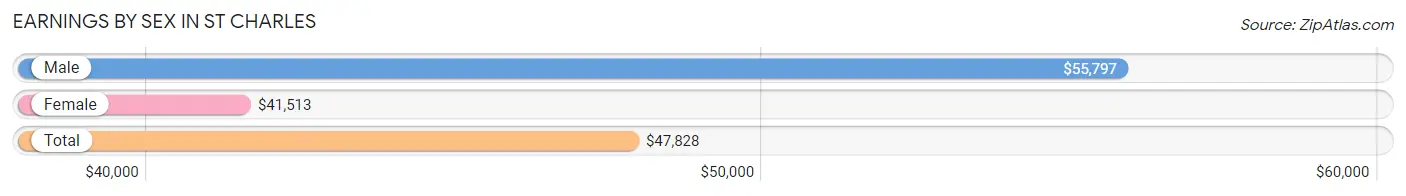
| Sex | Number | Average Earnings |
| Male | 21,416 (51.9%) | $55,797 |
| Female | 19,840 (48.1%) | $41,513 |
| Total | 41,256 (100.0%) | $47,828 |
Earnings by Sex by Income Bracket in St Charles
The most common earnings brackets in St Charles are $100,000+ for men (4,831 | 22.6%) and $100,000+ for women (2,212 | 11.2%).
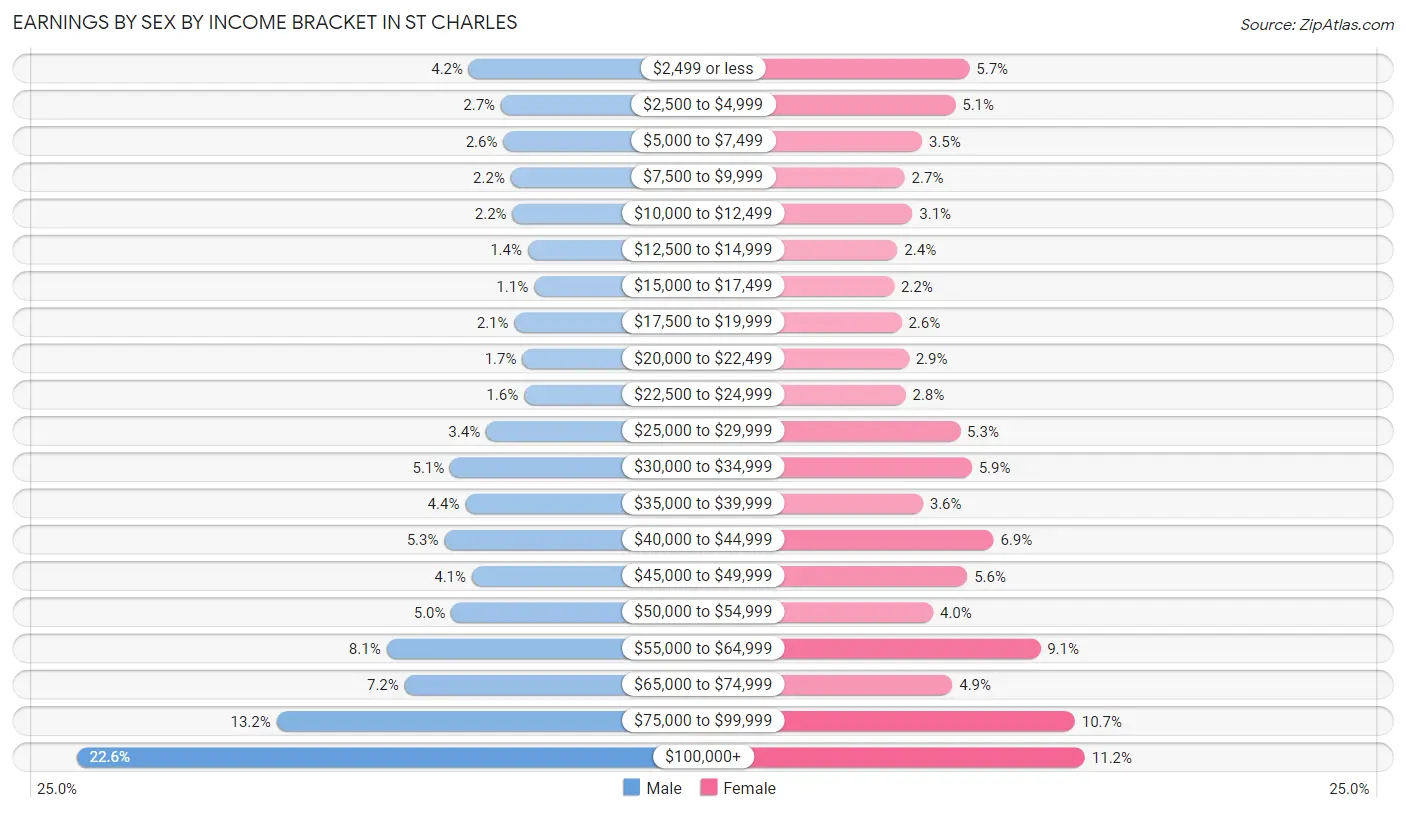
| Income | Male | Female |
| $2,499 or less | 897 (4.2%) | 1,138 (5.7%) |
| $2,500 to $4,999 | 576 (2.7%) | 1,008 (5.1%) |
| $5,000 to $7,499 | 552 (2.6%) | 699 (3.5%) |
| $7,500 to $9,999 | 478 (2.2%) | 538 (2.7%) |
| $10,000 to $12,499 | 461 (2.1%) | 609 (3.1%) |
| $12,500 to $14,999 | 306 (1.4%) | 470 (2.4%) |
| $15,000 to $17,499 | 244 (1.1%) | 439 (2.2%) |
| $17,500 to $19,999 | 442 (2.1%) | 507 (2.6%) |
| $20,000 to $22,499 | 361 (1.7%) | 575 (2.9%) |
| $22,500 to $24,999 | 344 (1.6%) | 545 (2.8%) |
| $25,000 to $29,999 | 727 (3.4%) | 1,054 (5.3%) |
| $30,000 to $34,999 | 1,086 (5.1%) | 1,160 (5.9%) |
| $35,000 to $39,999 | 934 (4.4%) | 706 (3.6%) |
| $40,000 to $44,999 | 1,144 (5.3%) | 1,363 (6.9%) |
| $45,000 to $49,999 | 867 (4.1%) | 1,119 (5.6%) |
| $50,000 to $54,999 | 1,074 (5.0%) | 802 (4.0%) |
| $55,000 to $64,999 | 1,723 (8.1%) | 1,798 (9.1%) |
| $65,000 to $74,999 | 1,543 (7.2%) | 980 (4.9%) |
| $75,000 to $99,999 | 2,826 (13.2%) | 2,118 (10.7%) |
| $100,000+ | 4,831 (22.6%) | 2,212 (11.2%) |
| Total | 21,416 (100.0%) | 19,840 (100.0%) |
Earnings by Sex by Educational Attainment in St Charles
Average earnings in St Charles are $63,115 for men and $47,847 for women, a difference of 24.2%. Men with an educational attainment of graduate degree enjoy the highest average annual earnings of $107,500, while those with less than high school education earn the least with $33,659. Women with an educational attainment of graduate degree earn the most with the average annual earnings of $70,921, while those with less than high school education have the smallest earnings of $26,685.
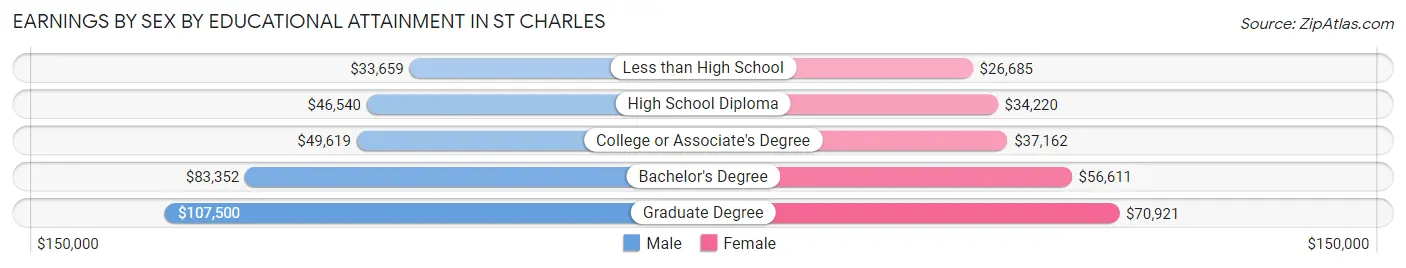
| Educational Attainment | Male Income | Female Income |
| Less than High School | $33,659 | $26,685 |
| High School Diploma | $46,540 | $34,220 |
| College or Associate's Degree | $49,619 | $37,162 |
| Bachelor's Degree | $83,352 | $56,611 |
| Graduate Degree | $107,500 | $70,921 |
| Total | $63,115 | $47,847 |
Family Income in St Charles
Family Income Brackets in St Charles
According to the St Charles family income data, there are 3,868 families falling into the $100,000 to $149,999 income range, which is the most common income bracket and makes up 22.3% of all families. Conversely, the $10,000 to $14,999 income bracket is the least frequent group with only 104 families (0.6%) belonging to this category.
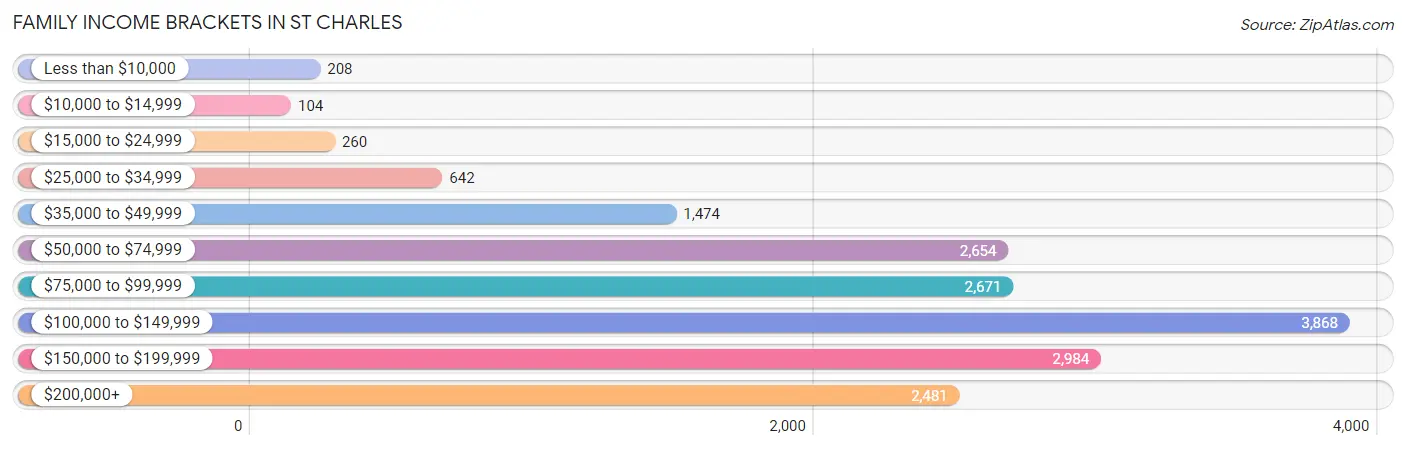
| Income Bracket | # Families | % Families |
| Less than $10,000 | 208 | 1.2% |
| $10,000 to $14,999 | 104 | 0.6% |
| $15,000 to $24,999 | 260 | 1.5% |
| $25,000 to $34,999 | 642 | 3.7% |
| $35,000 to $49,999 | 1,474 | 8.5% |
| $50,000 to $74,999 | 2,654 | 15.3% |
| $75,000 to $99,999 | 2,671 | 15.4% |
| $100,000 to $149,999 | 3,868 | 22.3% |
| $150,000 to $199,999 | 2,984 | 17.2% |
| $200,000+ | 2,481 | 14.3% |
Family Income by Famaliy Size in St Charles
6-person families (313 | 1.8%) account for the highest median family income in St Charles with $162,933 per family, while 2-person families (9,679 | 55.8%) have the highest median income of $47,188 per family member.
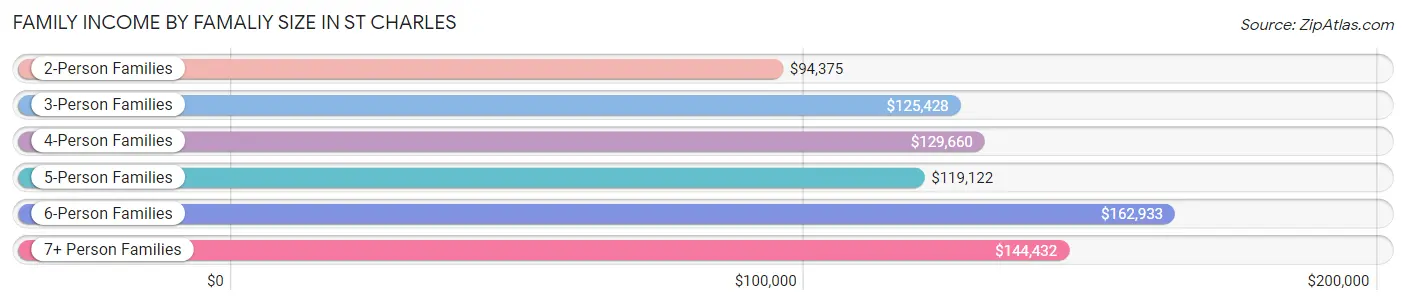
| Income Bracket | # Families | Median Income |
| 2-Person Families | 9,679 (55.8%) | $94,375 |
| 3-Person Families | 3,543 (20.4%) | $125,428 |
| 4-Person Families | 2,798 (16.1%) | $129,660 |
| 5-Person Families | 933 (5.4%) | $119,122 |
| 6-Person Families | 313 (1.8%) | $162,933 |
| 7+ Person Families | 81 (0.5%) | $144,432 |
| Total | 17,347 (100.0%) | $106,426 |
Family Income by Number of Earners in St Charles
The median family income in St Charles is $106,426, with families comprising 3+ earners (1,699) having the highest median family income of $163,105, while families with no earners (2,665) have the lowest median family income of $71,233, accounting for 9.8% and 15.4% of families, respectively.
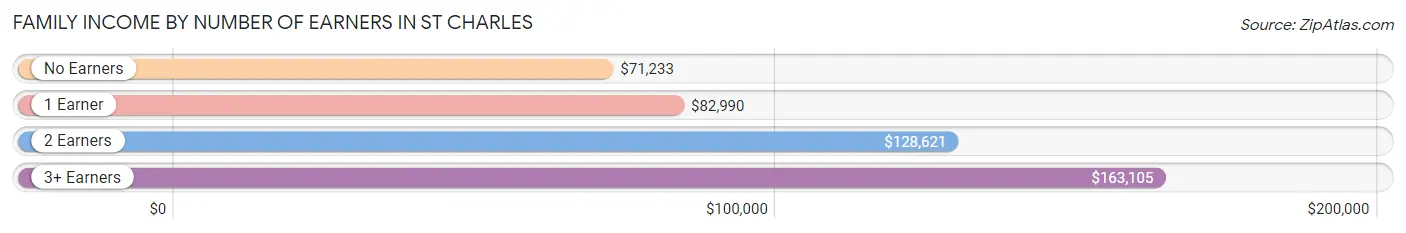
| Number of Earners | # Families | Median Income |
| No Earners | 2,665 (15.4%) | $71,233 |
| 1 Earner | 4,635 (26.7%) | $82,990 |
| 2 Earners | 8,348 (48.1%) | $128,621 |
| 3+ Earners | 1,699 (9.8%) | $163,105 |
| Total | 17,347 (100.0%) | $106,426 |
Household Income in St Charles
Household Income Brackets in St Charles
With 5,416 households falling in the category, the $100,000 to $149,999 income range is the most frequent in St Charles, accounting for 18.2% of all households. In contrast, only 446 households (1.5%) fall into the $10,000 to $14,999 income bracket, making it the least populous group.
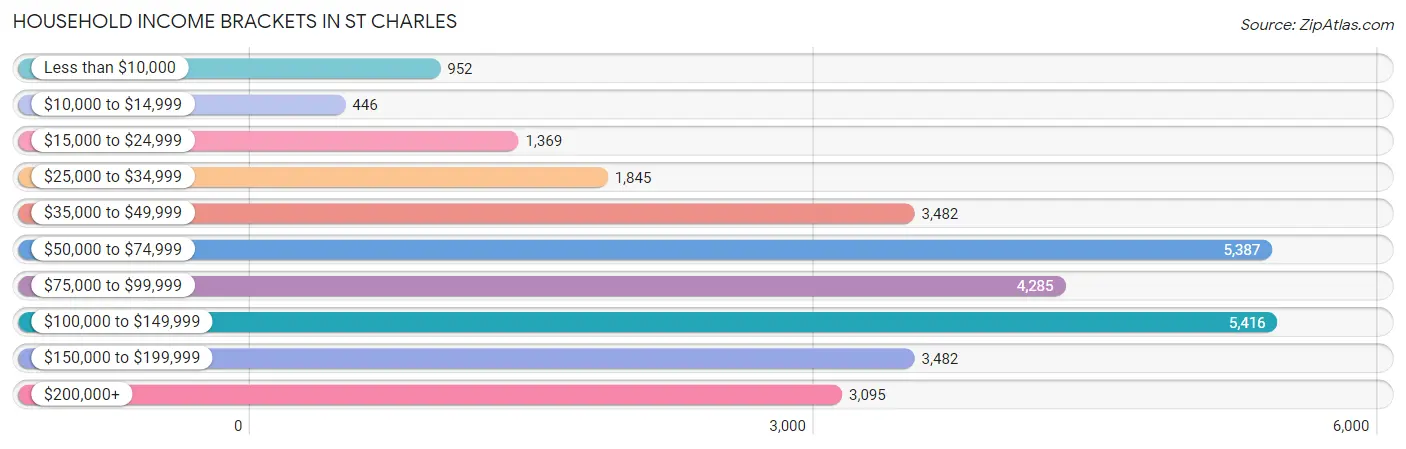
| Income Bracket | # Households | % Households |
| Less than $10,000 | 952 | 3.2% |
| $10,000 to $14,999 | 446 | 1.5% |
| $15,000 to $24,999 | 1,369 | 4.6% |
| $25,000 to $34,999 | 1,845 | 6.2% |
| $35,000 to $49,999 | 3,482 | 11.7% |
| $50,000 to $74,999 | 5,387 | 18.1% |
| $75,000 to $99,999 | 4,285 | 14.4% |
| $100,000 to $149,999 | 5,416 | 18.2% |
| $150,000 to $199,999 | 3,482 | 11.7% |
| $200,000+ | 3,095 | 10.4% |
Household Income by Householder Age in St Charles
The median household income in St Charles is $83,589, with the highest median household income of $103,720 found in the 45 to 64 years age bracket for the primary householder. A total of 10,200 households (34.3%) fall into this category. Meanwhile, the 15 to 24 years age bracket for the primary householder has the lowest median household income of $43,313, with 1,530 households (5.1%) in this group.
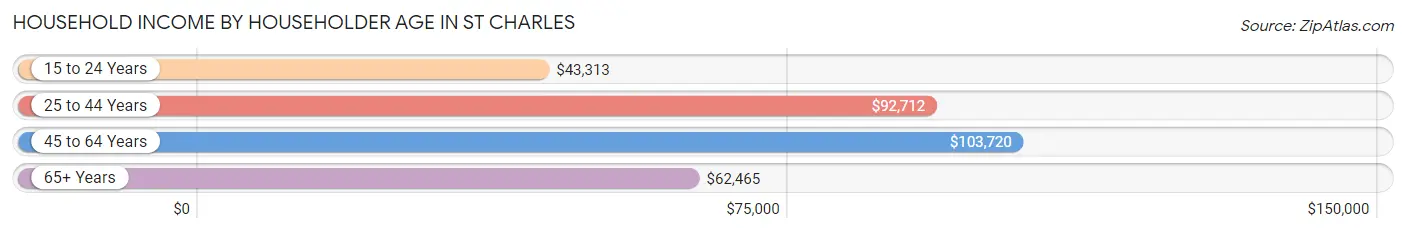
| Income Bracket | # Households | Median Income |
| 15 to 24 Years | 1,530 (5.1%) | $43,313 |
| 25 to 44 Years | 10,124 (34.0%) | $92,712 |
| 45 to 64 Years | 10,200 (34.3%) | $103,720 |
| 65+ Years | 7,906 (26.6%) | $62,465 |
| Total | 29,760 (100.0%) | $83,589 |
Poverty in St Charles
Income Below Poverty by Sex and Age in St Charles
With 4.3% poverty level for males and 7.5% for females among the residents of St Charles, 18 to 24 year old males and under 5 year old females are the most vulnerable to poverty, with 196 males (7.8%) and 282 females (14.4%) in their respective age groups living below the poverty level.
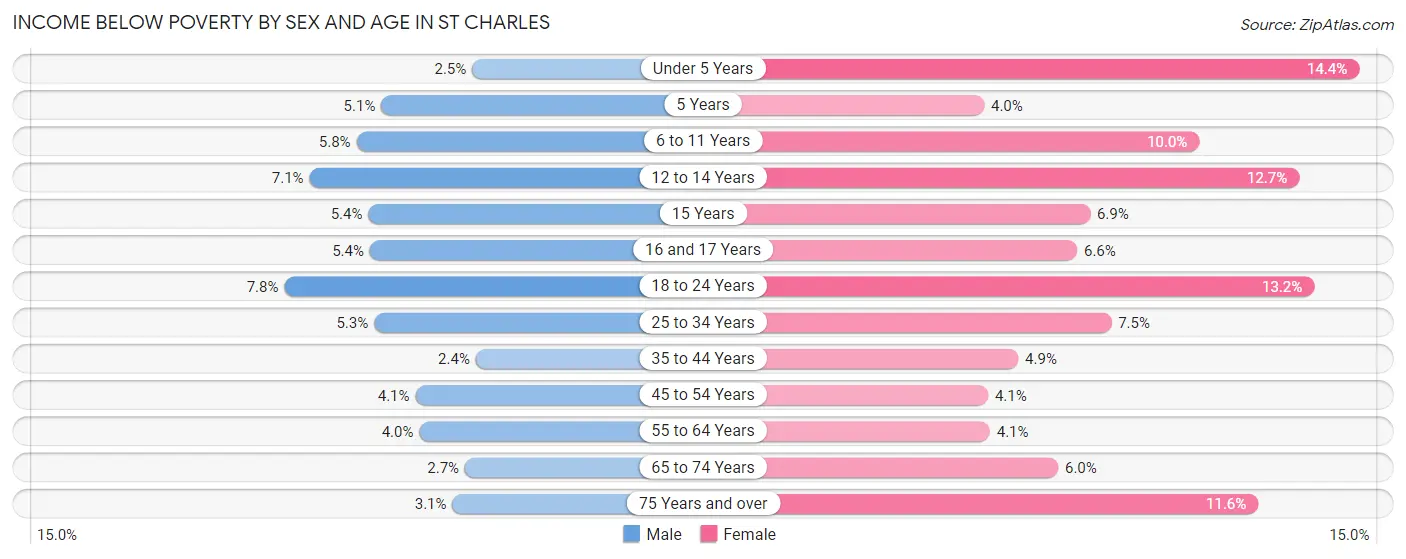
| Age Bracket | Male | Female |
| Under 5 Years | 38 (2.5%) | 282 (14.4%) |
| 5 Years | 17 (5.1%) | 18 (4.0%) |
| 6 to 11 Years | 139 (5.8%) | 217 (10.0%) |
| 12 to 14 Years | 62 (7.1%) | 83 (12.7%) |
| 15 Years | 19 (5.4%) | 19 (6.9%) |
| 16 and 17 Years | 29 (5.4%) | 45 (6.6%) |
| 18 to 24 Years | 196 (7.8%) | 297 (13.2%) |
| 25 to 34 Years | 284 (5.3%) | 410 (7.5%) |
| 35 to 44 Years | 107 (2.4%) | 192 (4.9%) |
| 45 to 54 Years | 148 (4.1%) | 141 (4.1%) |
| 55 to 64 Years | 200 (4.0%) | 207 (4.1%) |
| 65 to 74 Years | 91 (2.7%) | 237 (6.0%) |
| 75 Years and over | 60 (3.1%) | 343 (11.6%) |
| Total | 1,390 (4.3%) | 2,491 (7.5%) |
Income Above Poverty by Sex and Age in St Charles
According to the poverty statistics in St Charles, males aged 35 to 44 years and females aged 5 years are the age groups that are most secure financially, with 97.6% of males and 96.0% of females in these age groups living above the poverty line.
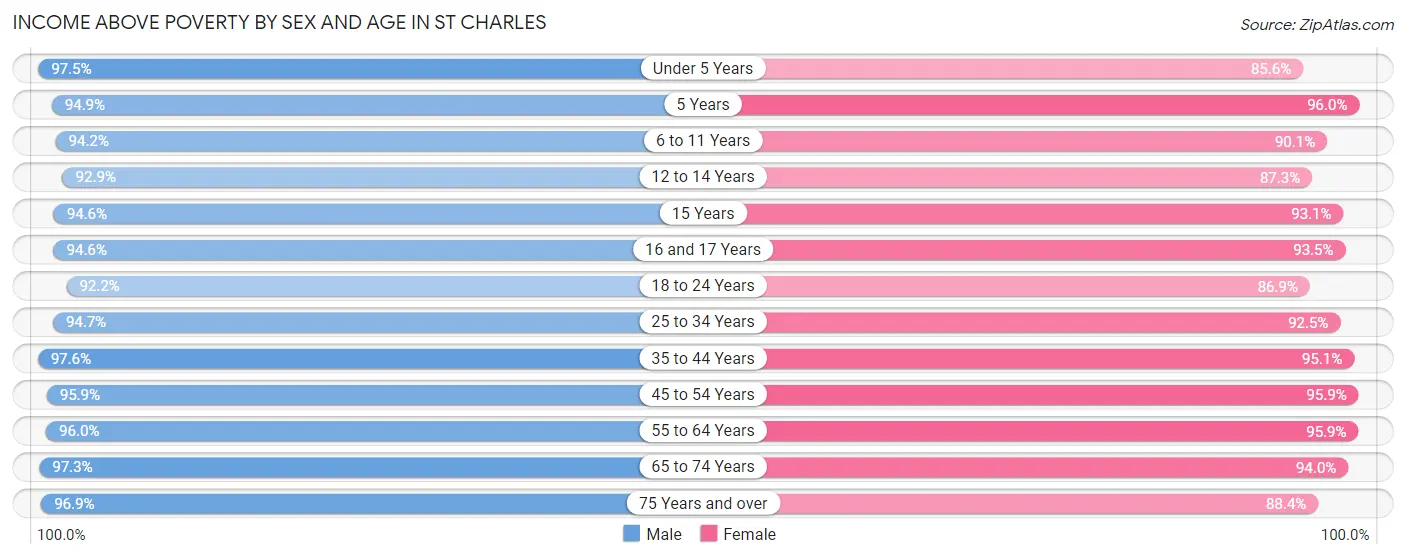
| Age Bracket | Male | Female |
| Under 5 Years | 1,461 (97.5%) | 1,677 (85.6%) |
| 5 Years | 318 (94.9%) | 437 (96.0%) |
| 6 to 11 Years | 2,273 (94.2%) | 1,964 (90.0%) |
| 12 to 14 Years | 815 (92.9%) | 569 (87.3%) |
| 15 Years | 331 (94.6%) | 256 (93.1%) |
| 16 and 17 Years | 509 (94.6%) | 642 (93.4%) |
| 18 to 24 Years | 2,326 (92.2%) | 1,962 (86.9%) |
| 25 to 34 Years | 5,103 (94.7%) | 5,055 (92.5%) |
| 35 to 44 Years | 4,284 (97.6%) | 3,722 (95.1%) |
| 45 to 54 Years | 3,444 (95.9%) | 3,321 (95.9%) |
| 55 to 64 Years | 4,784 (96.0%) | 4,817 (95.9%) |
| 65 to 74 Years | 3,231 (97.3%) | 3,702 (94.0%) |
| 75 Years and over | 1,884 (96.9%) | 2,616 (88.4%) |
| Total | 30,763 (95.7%) | 30,740 (92.5%) |
Income Below Poverty Among Married-Couple Families in St Charles
The poverty statistics for married-couple families in St Charles show that 1.7% or 228 of the total 13,795 families live below the poverty line. Families with 3 or 4 children have the highest poverty rate of 5.9%, comprising of 50 families. On the other hand, families with 5 or more children have the lowest poverty rate of 0.0%, which includes 0 families.
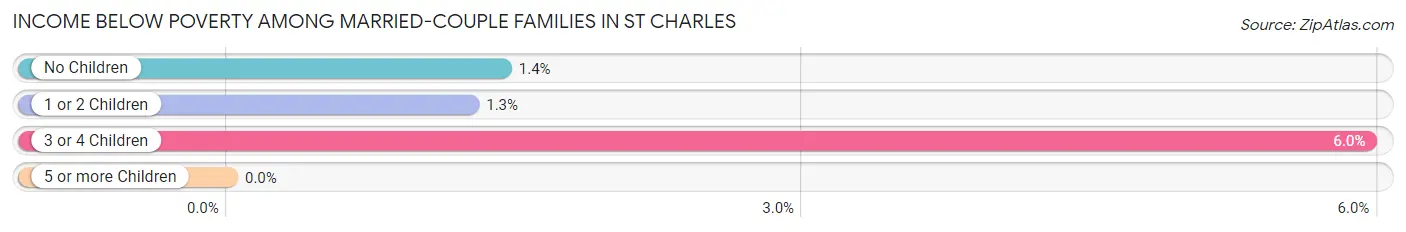
| Children | Above Poverty | Below Poverty |
| No Children | 8,845 (98.6%) | 128 (1.4%) |
| 1 or 2 Children | 3,912 (98.7%) | 50 (1.3%) |
| 3 or 4 Children | 791 (94.1%) | 50 (5.9%) |
| 5 or more Children | 19 (100.0%) | 0 (0.0%) |
| Total | 13,567 (98.4%) | 228 (1.7%) |
Income Below Poverty Among Single-Parent Households in St Charles
According to the poverty data in St Charles, 0.4% or 4 single-father households and 9.7% or 253 single-mother households are living below the poverty line. Among single-father households, those with no children have the highest poverty rate, with 4 households (1.0%) experiencing poverty. Likewise, among single-mother households, those with 5 or more children have the highest poverty rate, with 28 households (87.5%) falling below the poverty line.
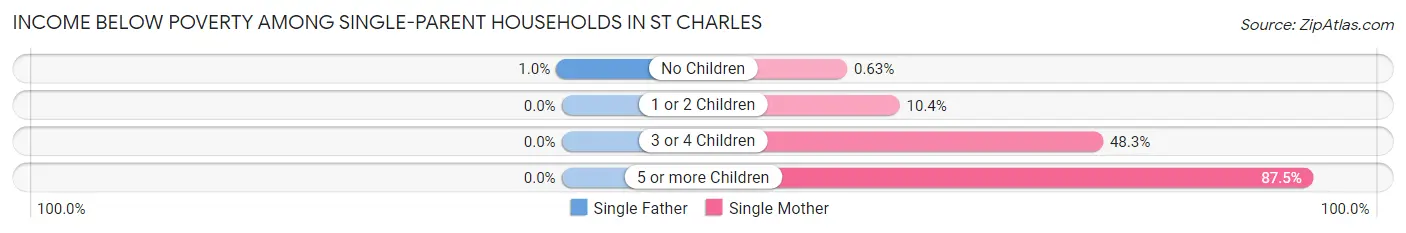
| Children | Single Father | Single Mother |
| No Children | 4 (1.0%) | 7 (0.6%) |
| 1 or 2 Children | 0 (0.0%) | 133 (10.4%) |
| 3 or 4 Children | 0 (0.0%) | 85 (48.3%) |
| 5 or more Children | 0 (0.0%) | 28 (87.5%) |
| Total | 4 (0.4%) | 253 (9.7%) |
Income Below Poverty Among Married-Couple vs Single-Parent Households in St Charles
The poverty data for St Charles shows that 228 of the married-couple family households (1.7%) and 257 of the single-parent households (7.2%) are living below the poverty level. Within the married-couple family households, those with 3 or 4 children have the highest poverty rate, with 50 households (5.9%) falling below the poverty line. Among the single-parent households, those with 5 or more children have the highest poverty rate, with 28 household (87.5%) living below poverty.
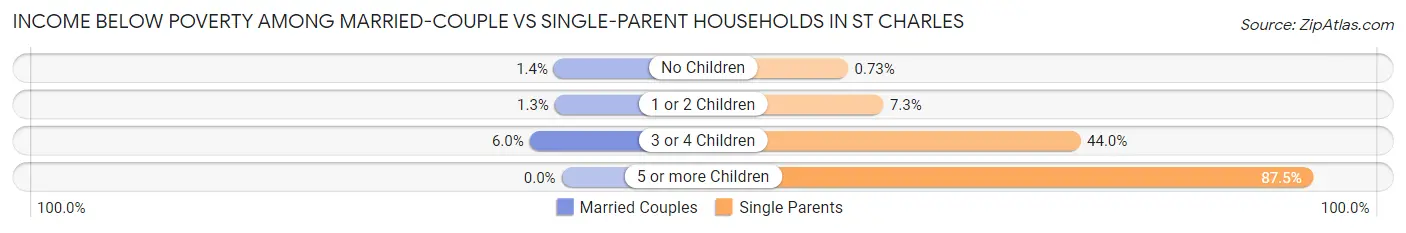
| Children | Married-Couple Families | Single-Parent Households |
| No Children | 128 (1.4%) | 11 (0.7%) |
| 1 or 2 Children | 50 (1.3%) | 133 (7.3%) |
| 3 or 4 Children | 50 (5.9%) | 85 (44.0%) |
| 5 or more Children | 0 (0.0%) | 28 (87.5%) |
| Total | 228 (1.7%) | 257 (7.2%) |
Race in St Charles
The most populous races in St Charles are White / Caucasian (57,775 | 81.7%), Black / African American (5,141 | 7.3%), and Hispanic or Latino (3,980 | 5.6%).
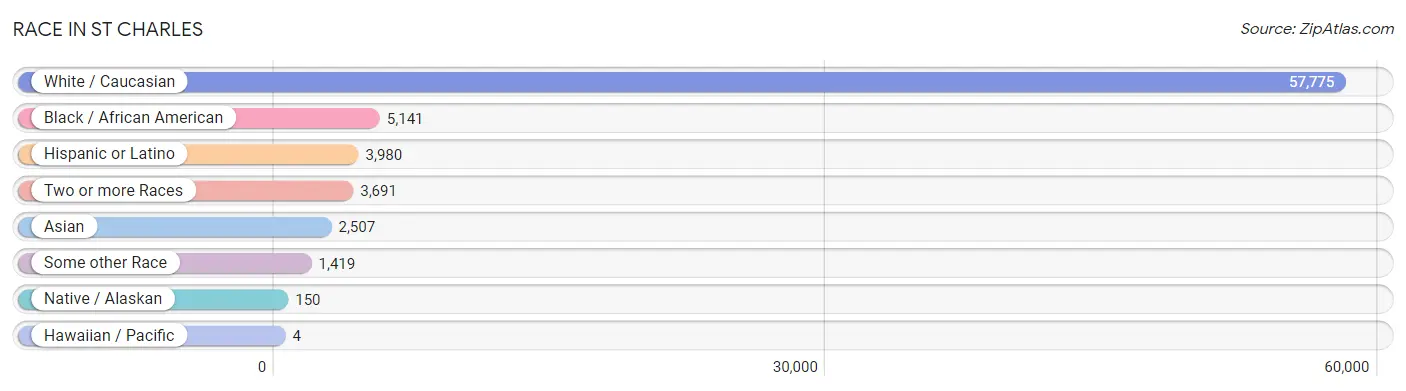
| Race | # Population | % Population |
| Asian | 2,507 | 3.5% |
| Black / African American | 5,141 | 7.3% |
| Hawaiian / Pacific | 4 | 0.0% |
| Hispanic or Latino | 3,980 | 5.6% |
| Native / Alaskan | 150 | 0.2% |
| White / Caucasian | 57,775 | 81.7% |
| Two or more Races | 3,691 | 5.2% |
| Some other Race | 1,419 | 2.0% |
| Total | 70,687 | 100.0% |
Ancestry in St Charles
The most populous ancestries reported in St Charles are German (22,828 | 32.3%), Irish (10,174 | 14.4%), English (7,504 | 10.6%), American (4,909 | 6.9%), and Italian (3,216 | 4.5%), together accounting for 68.8% of all St Charles residents.
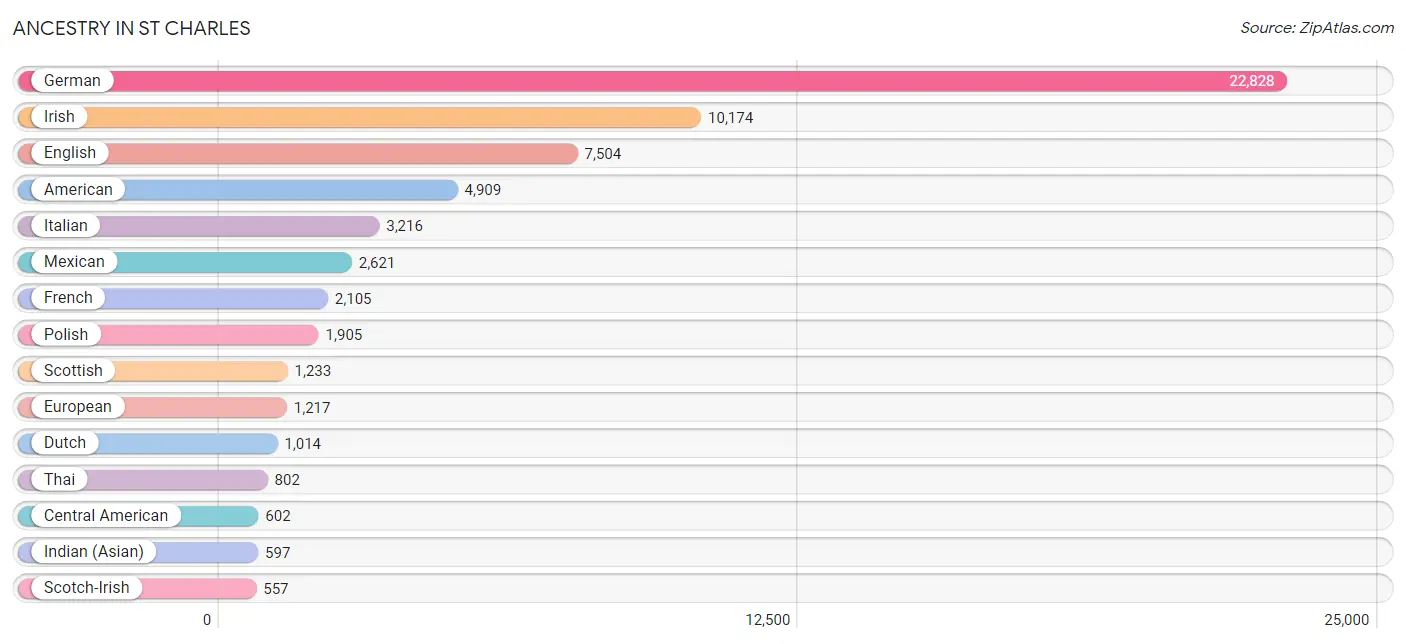
| Ancestry | # Population | % Population |
| African | 400 | 0.6% |
| Albanian | 21 | 0.0% |
| Alsatian | 6 | 0.0% |
| American | 4,909 | 6.9% |
| Apache | 8 | 0.0% |
| Arab | 170 | 0.2% |
| Argentinean | 35 | 0.1% |
| Armenian | 130 | 0.2% |
| Austrian | 149 | 0.2% |
| Belgian | 93 | 0.1% |
| Bhutanese | 291 | 0.4% |
| Blackfeet | 3 | 0.0% |
| Bolivian | 29 | 0.0% |
| Brazilian | 74 | 0.1% |
| British | 395 | 0.6% |
| Burmese | 383 | 0.5% |
| Cajun | 47 | 0.1% |
| Canadian | 69 | 0.1% |
| Central American | 602 | 0.9% |
| Cherokee | 173 | 0.2% |
| Cheyenne | 25 | 0.0% |
| Chilean | 11 | 0.0% |
| Chippewa | 4 | 0.0% |
| Choctaw | 84 | 0.1% |
| Colombian | 68 | 0.1% |
| Costa Rican | 136 | 0.2% |
| Croatian | 46 | 0.1% |
| Cuban | 65 | 0.1% |
| Czech | 294 | 0.4% |
| Czechoslovakian | 40 | 0.1% |
| Danish | 405 | 0.6% |
| Dutch | 1,014 | 1.4% |
| Eastern European | 99 | 0.1% |
| Egyptian | 49 | 0.1% |
| English | 7,504 | 10.6% |
| European | 1,217 | 1.7% |
| Filipino | 8 | 0.0% |
| Finnish | 40 | 0.1% |
| French | 2,105 | 3.0% |
| French American Indian | 3 | 0.0% |
| French Canadian | 214 | 0.3% |
| German | 22,828 | 32.3% |
| Greek | 108 | 0.2% |
| Guatemalan | 207 | 0.3% |
| Honduran | 150 | 0.2% |
| Hungarian | 181 | 0.3% |
| Indian (Asian) | 597 | 0.8% |
| Iranian | 15 | 0.0% |
| Irish | 10,174 | 14.4% |
| Italian | 3,216 | 4.5% |
| Jamaican | 70 | 0.1% |
| Jordanian | 9 | 0.0% |
| Korean | 468 | 0.7% |
| Latvian | 19 | 0.0% |
| Lebanese | 46 | 0.1% |
| Lithuanian | 10 | 0.0% |
| Lumbee | 3 | 0.0% |
| Luxembourger | 77 | 0.1% |
| Macedonian | 41 | 0.1% |
| Maltese | 32 | 0.1% |
| Mexican | 2,621 | 3.7% |
| Mexican American Indian | 19 | 0.0% |
| Native Hawaiian | 35 | 0.1% |
| Navajo | 50 | 0.1% |
| New Zealander | 4 | 0.0% |
| Nigerian | 9 | 0.0% |
| Northern European | 127 | 0.2% |
| Norwegian | 518 | 0.7% |
| Pakistani | 135 | 0.2% |
| Palestinian | 31 | 0.0% |
| Panamanian | 101 | 0.1% |
| Peruvian | 48 | 0.1% |
| Polish | 1,905 | 2.7% |
| Portuguese | 22 | 0.0% |
| Puerto Rican | 221 | 0.3% |
| Romanian | 34 | 0.1% |
| Russian | 309 | 0.4% |
| Salvadoran | 8 | 0.0% |
| Scandinavian | 214 | 0.3% |
| Scotch-Irish | 557 | 0.8% |
| Scottish | 1,233 | 1.7% |
| Slavic | 59 | 0.1% |
| Slovak | 115 | 0.2% |
| Slovene | 24 | 0.0% |
| South American | 213 | 0.3% |
| Spaniard | 113 | 0.2% |
| Spanish | 92 | 0.1% |
| Sri Lankan | 332 | 0.5% |
| Subsaharan African | 476 | 0.7% |
| Sudanese | 22 | 0.0% |
| Swedish | 497 | 0.7% |
| Swiss | 214 | 0.3% |
| Thai | 802 | 1.1% |
| Tohono O'Odham | 32 | 0.1% |
| Trinidadian and Tobagonian | 17 | 0.0% |
| Ukrainian | 18 | 0.0% |
| Venezuelan | 22 | 0.0% |
| Vietnamese | 15 | 0.0% |
| Welsh | 261 | 0.4% |
| Yugoslavian | 80 | 0.1% | View All 100 Rows |
Immigrants in St Charles
The most numerous immigrant groups reported in St Charles came from Asia (1,630 | 2.3%), Latin America (1,364 | 1.9%), Central America (1,123 | 1.6%), South Central Asia (740 | 1.1%), and Europe (602 | 0.9%), together accounting for 7.7% of all St Charles residents.
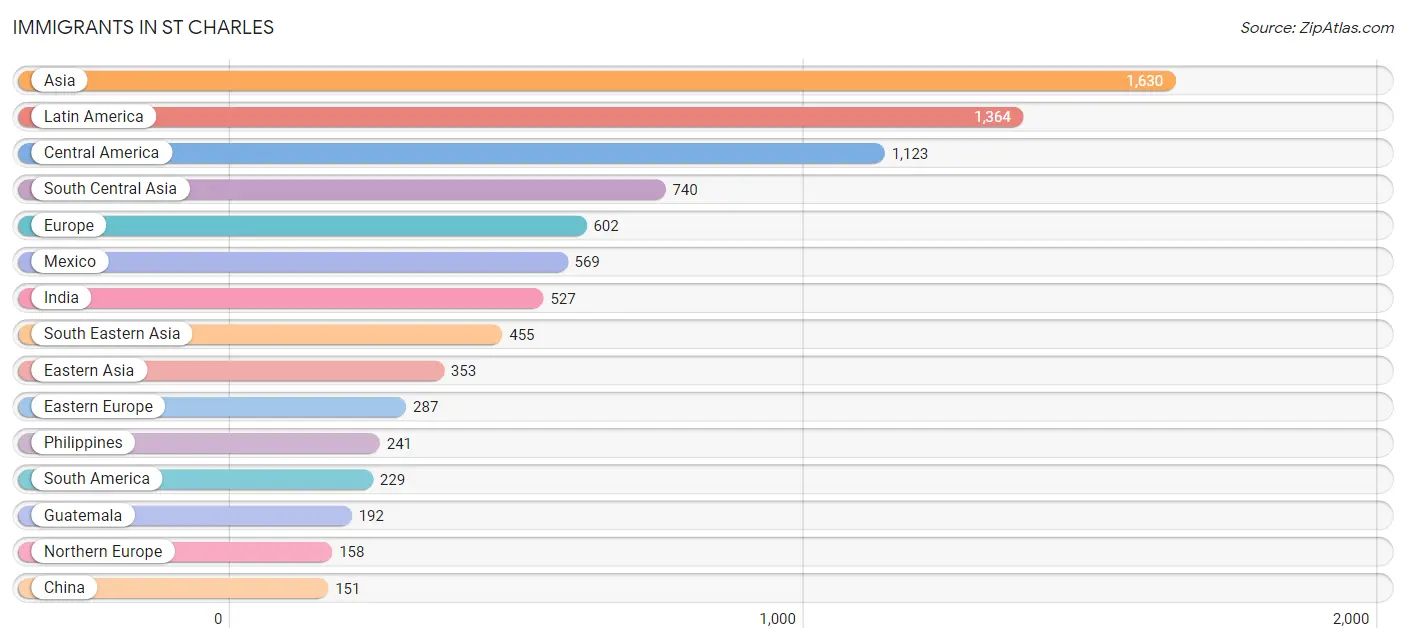
| Immigration Origin | # Population | % Population |
| Africa | 142 | 0.2% |
| Albania | 21 | 0.0% |
| Argentina | 35 | 0.1% |
| Armenia | 26 | 0.0% |
| Asia | 1,630 | 2.3% |
| Australia | 26 | 0.0% |
| Bangladesh | 15 | 0.0% |
| Belarus | 12 | 0.0% |
| Belgium | 20 | 0.0% |
| Bolivia | 29 | 0.0% |
| Bosnia and Herzegovina | 59 | 0.1% |
| Brazil | 85 | 0.1% |
| Canada | 115 | 0.2% |
| Caribbean | 12 | 0.0% |
| Central America | 1,123 | 1.6% |
| Chile | 39 | 0.1% |
| China | 151 | 0.2% |
| Colombia | 14 | 0.0% |
| Costa Rica | 136 | 0.2% |
| Czechoslovakia | 5 | 0.0% |
| Denmark | 27 | 0.0% |
| Eastern Asia | 353 | 0.5% |
| Eastern Europe | 287 | 0.4% |
| Egypt | 6 | 0.0% |
| England | 79 | 0.1% |
| Europe | 602 | 0.9% |
| Germany | 54 | 0.1% |
| Ghana | 16 | 0.0% |
| Greece | 32 | 0.1% |
| Guatemala | 192 | 0.3% |
| Honduras | 125 | 0.2% |
| Hungary | 15 | 0.0% |
| India | 527 | 0.7% |
| Italy | 11 | 0.0% |
| Jamaica | 12 | 0.0% |
| Japan | 60 | 0.1% |
| Jordan | 30 | 0.0% |
| Korea | 122 | 0.2% |
| Latin America | 1,364 | 1.9% |
| Lebanon | 7 | 0.0% |
| Mexico | 569 | 0.8% |
| Middle Africa | 16 | 0.0% |
| Morocco | 19 | 0.0% |
| Nepal | 32 | 0.1% |
| Netherlands | 13 | 0.0% |
| Nigeria | 9 | 0.0% |
| Northern Africa | 47 | 0.1% |
| Northern Europe | 158 | 0.2% |
| Oceania | 30 | 0.0% |
| Pakistan | 103 | 0.2% |
| Panama | 101 | 0.1% |
| Philippines | 241 | 0.3% |
| Poland | 63 | 0.1% |
| Romania | 7 | 0.0% |
| Russia | 50 | 0.1% |
| Scotland | 11 | 0.0% |
| South Africa | 4 | 0.0% |
| South America | 229 | 0.3% |
| South Central Asia | 740 | 1.1% |
| South Eastern Asia | 455 | 0.6% |
| Southern Europe | 59 | 0.1% |
| Spain | 16 | 0.0% |
| Sudan | 22 | 0.0% |
| Sweden | 14 | 0.0% |
| Switzerland | 11 | 0.0% |
| Syria | 8 | 0.0% |
| Taiwan | 8 | 0.0% |
| Thailand | 92 | 0.1% |
| Ukraine | 25 | 0.0% |
| Venezuela | 27 | 0.0% |
| Vietnam | 122 | 0.2% |
| Western Africa | 25 | 0.0% |
| Western Asia | 76 | 0.1% |
| Western Europe | 98 | 0.1% |
| Zaire | 16 | 0.0% | View All 75 Rows |
Sex and Age in St Charles
Sex and Age in St Charles
The most populous age groups in St Charles are 20 to 24 Years (3,633 | 10.4%) for men and 20 to 24 Years (3,058 | 8.5%) for women.
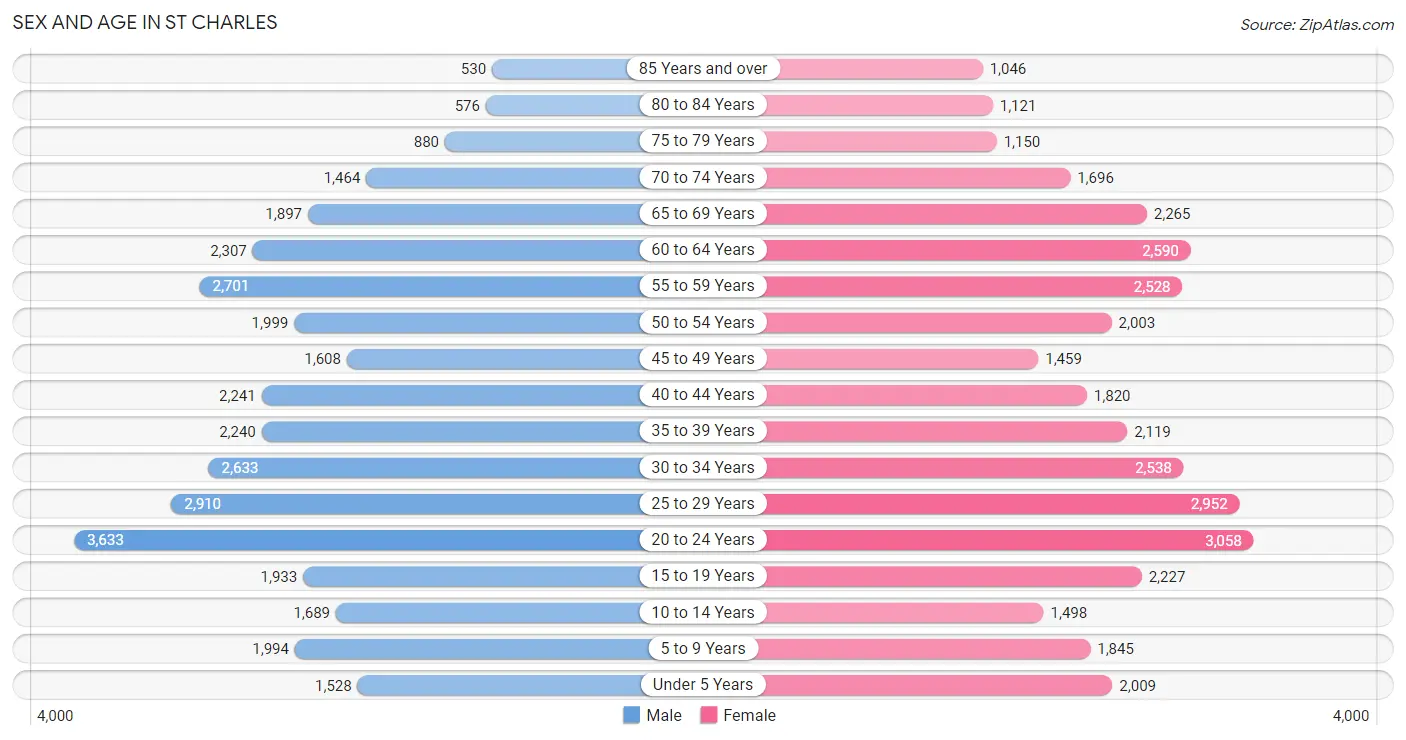
| Age Bracket | Male | Female |
| Under 5 Years | 1,528 (4.4%) | 2,009 (5.6%) |
| 5 to 9 Years | 1,994 (5.7%) | 1,845 (5.1%) |
| 10 to 14 Years | 1,689 (4.9%) | 1,498 (4.2%) |
| 15 to 19 Years | 1,933 (5.6%) | 2,227 (6.2%) |
| 20 to 24 Years | 3,633 (10.4%) | 3,058 (8.5%) |
| 25 to 29 Years | 2,910 (8.4%) | 2,952 (8.2%) |
| 30 to 34 Years | 2,633 (7.6%) | 2,538 (7.1%) |
| 35 to 39 Years | 2,240 (6.4%) | 2,119 (5.9%) |
| 40 to 44 Years | 2,241 (6.5%) | 1,820 (5.1%) |
| 45 to 49 Years | 1,608 (4.6%) | 1,459 (4.1%) |
| 50 to 54 Years | 1,999 (5.8%) | 2,003 (5.6%) |
| 55 to 59 Years | 2,701 (7.8%) | 2,528 (7.0%) |
| 60 to 64 Years | 2,307 (6.6%) | 2,590 (7.2%) |
| 65 to 69 Years | 1,897 (5.5%) | 2,265 (6.3%) |
| 70 to 74 Years | 1,464 (4.2%) | 1,696 (4.7%) |
| 75 to 79 Years | 880 (2.5%) | 1,150 (3.2%) |
| 80 to 84 Years | 576 (1.7%) | 1,121 (3.1%) |
| 85 Years and over | 530 (1.5%) | 1,046 (2.9%) |
| Total | 34,763 (100.0%) | 35,924 (100.0%) |
Families and Households in St Charles
Median Family Size in St Charles
The median family size in St Charles is 2.84 persons per family, with married-couple families (13,795 | 79.5%) accounting for the largest median family size of 2.86 persons per family. On the other hand, single male/father families (952 | 5.5%) represent the smallest median family size with 2.56 persons per family.
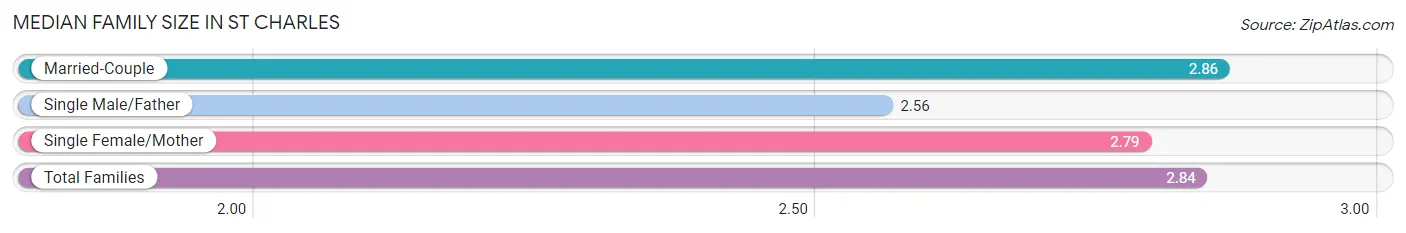
| Family Type | # Families | Family Size |
| Married-Couple | 13,795 (79.5%) | 2.86 |
| Single Male/Father | 952 (5.5%) | 2.56 |
| Single Female/Mother | 2,600 (15.0%) | 2.79 |
| Total Families | 17,347 (100.0%) | 2.84 |
Median Household Size in St Charles
The median household size in St Charles is 2.20 persons per household, with single female/mother households (2,600 | 8.7%) accounting for the largest median household size of 2.91 persons per household. non-family households (12,413 | 41.7%) represent the smallest median household size with 1.24 persons per household.
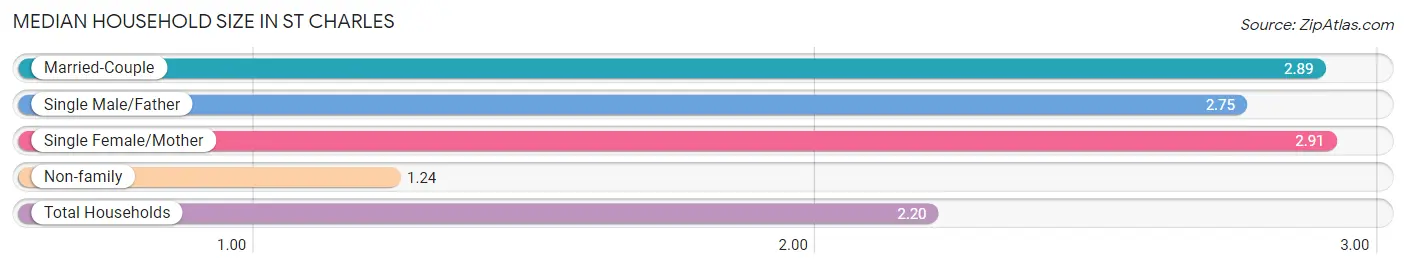
| Household Type | # Households | Household Size |
| Married-Couple | 13,795 (46.4%) | 2.89 |
| Single Male/Father | 952 (3.2%) | 2.75 |
| Single Female/Mother | 2,600 (8.7%) | 2.91 |
| Non-family | 12,413 (41.7%) | 1.24 |
| Total Households | 29,760 (100.0%) | 2.20 |
Household Size by Marriage Status in St Charles
Out of a total of 29,760 households in St Charles, 17,347 (58.3%) are family households, while 12,413 (41.7%) are nonfamily households. The most numerous type of family households are 2-person households, comprising 9,328, and the most common type of nonfamily households are 1-person households, comprising 9,986.
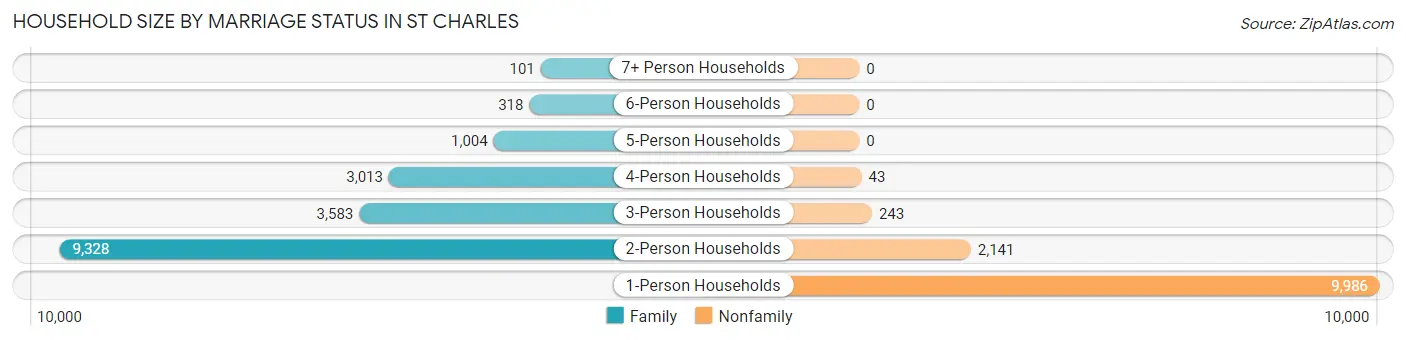
| Household Size | Family Households | Nonfamily Households |
| 1-Person Households | - | 9,986 (33.6%) |
| 2-Person Households | 9,328 (31.3%) | 2,141 (7.2%) |
| 3-Person Households | 3,583 (12.0%) | 243 (0.8%) |
| 4-Person Households | 3,013 (10.1%) | 43 (0.1%) |
| 5-Person Households | 1,004 (3.4%) | 0 (0.0%) |
| 6-Person Households | 318 (1.1%) | 0 (0.0%) |
| 7+ Person Households | 101 (0.3%) | 0 (0.0%) |
| Total | 17,347 (58.3%) | 12,413 (41.7%) |
Female Fertility in St Charles
Fertility by Age in St Charles
Average fertility rate in St Charles is 57.0 births per 1,000 women. Women in the age bracket of 20 to 34 years have the highest fertility rate with 78.0 births per 1,000 women. Women in the age bracket of 20 to 34 years acount for 70.1% of all women with births.
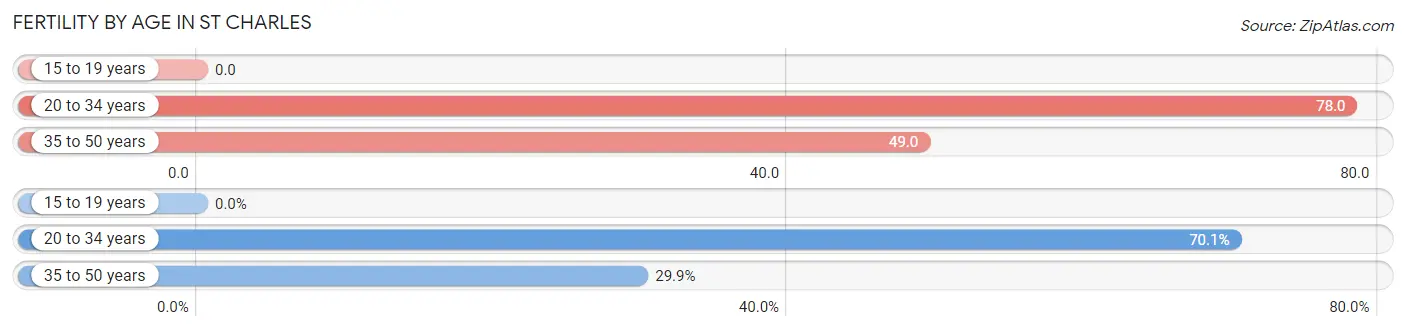
| Age Bracket | Women with Births | Births / 1,000 Women |
| 15 to 19 years | 0 (0.0%) | 0.0 |
| 20 to 34 years | 664 (70.1%) | 78.0 |
| 35 to 50 years | 283 (29.9%) | 49.0 |
| Total | 947 (100.0%) | 57.0 |
Fertility by Age by Marriage Status in St Charles
75.8% of women with births (947) in St Charles are married. The highest percentage of unmarried women with births falls into 20 to 34 years age bracket with 25.6% of them unmarried at the time of birth, while the lowest percentage of unmarried women with births belong to 35 to 50 years age bracket with 20.9% of them unmarried.
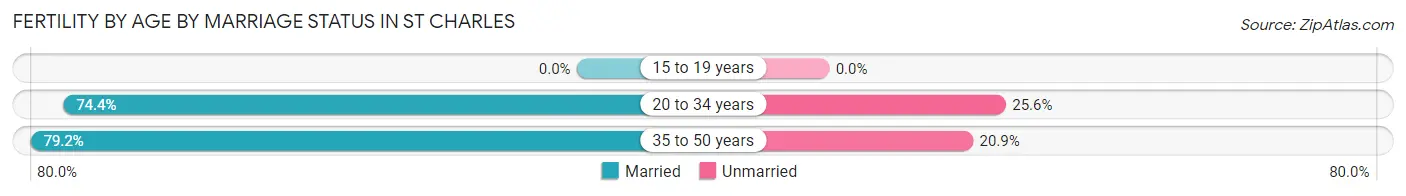
| Age Bracket | Married | Unmarried |
| 15 to 19 years | 0 (0.0%) | 0 (0.0%) |
| 20 to 34 years | 494 (74.4%) | 170 (25.6%) |
| 35 to 50 years | 224 (79.1%) | 59 (20.8%) |
| Total | 718 (75.8%) | 229 (24.2%) |
Fertility by Education in St Charles
Average fertility rate in St Charles is 57.0 births per 1,000 women. Women with the education attainment of graduate degree have the highest fertility rate of 85.0 births per 1,000 women, while women with the education attainment of less than high school have the lowest fertility at 24.0 births per 1,000 women. Women with the education attainment of bachelor's degree represent 37.1% of all women with births.
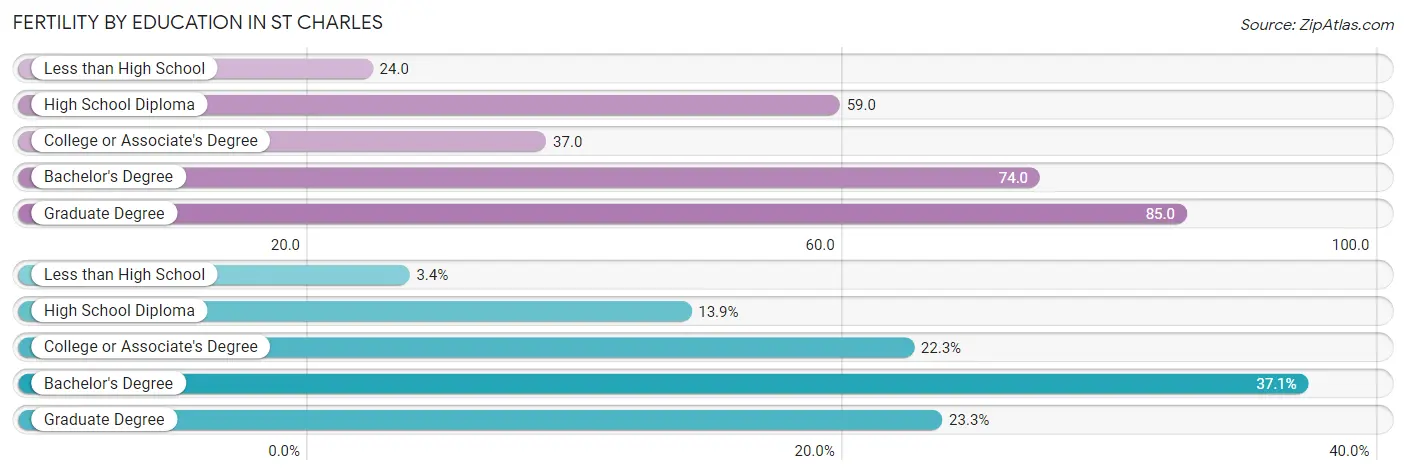
| Educational Attainment | Women with Births | Births / 1,000 Women |
| Less than High School | 32 (3.4%) | 24.0 |
| High School Diploma | 132 (13.9%) | 59.0 |
| College or Associate's Degree | 211 (22.3%) | 37.0 |
| Bachelor's Degree | 351 (37.1%) | 74.0 |
| Graduate Degree | 221 (23.3%) | 85.0 |
| Total | 947 (100.0%) | 57.0 |
Fertility by Education by Marriage Status in St Charles
24.2% of women with births in St Charles are unmarried. Women with the educational attainment of bachelor's degree are most likely to be married with 100.0% of them married at childbirth, while women with the educational attainment of less than high school are least likely to be married with 100.0% of them unmarried at childbirth.
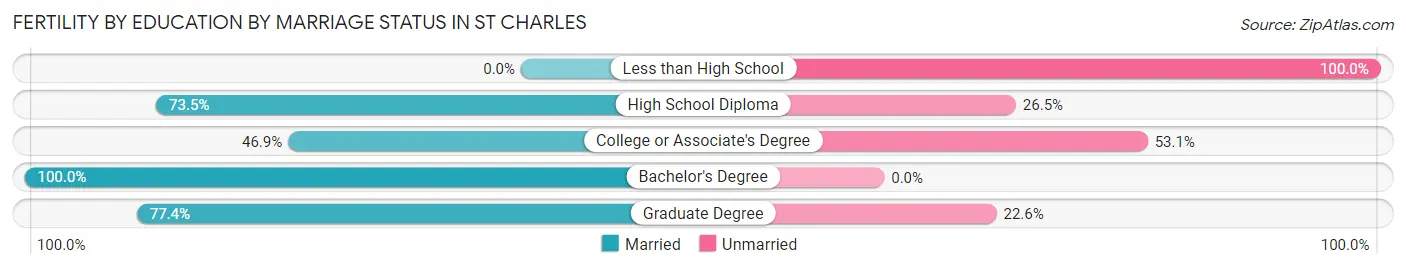
| Educational Attainment | Married | Unmarried |
| Less than High School | 0 (0.0%) | 32 (100.0%) |
| High School Diploma | 97 (73.5%) | 35 (26.5%) |
| College or Associate's Degree | 99 (46.9%) | 112 (53.1%) |
| Bachelor's Degree | 351 (100.0%) | 0 (0.0%) |
| Graduate Degree | 171 (77.4%) | 50 (22.6%) |
| Total | 718 (75.8%) | 229 (24.2%) |
Employment Characteristics in St Charles
Employment by Class of Employer in St Charles
Among the 37,395 employed individuals in St Charles, private company employees (26,285 | 70.3%), not-for-profit organizations (4,206 | 11.3%), and local government employees (2,891 | 7.7%) make up the most common classes of employment.
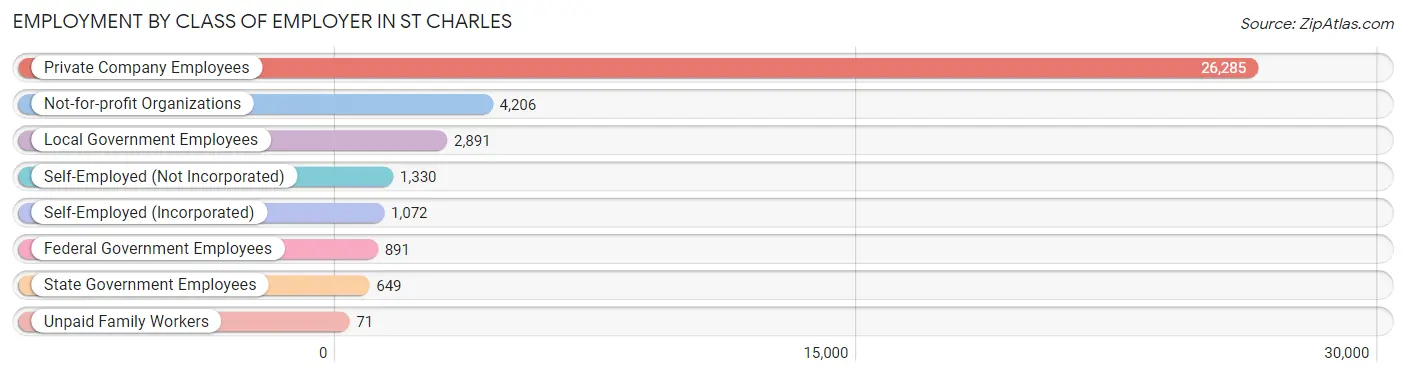
| Employer Class | # Employees | % Employees |
| Private Company Employees | 26,285 | 70.3% |
| Self-Employed (Incorporated) | 1,072 | 2.9% |
| Self-Employed (Not Incorporated) | 1,330 | 3.6% |
| Not-for-profit Organizations | 4,206 | 11.3% |
| Local Government Employees | 2,891 | 7.7% |
| State Government Employees | 649 | 1.7% |
| Federal Government Employees | 891 | 2.4% |
| Unpaid Family Workers | 71 | 0.2% |
| Total | 37,395 | 100.0% |
Employment Status by Age in St Charles
According to the labor force statistics for St Charles, out of the total population over 16 years of age (59,493), 65.7% or 39,087 individuals are in the labor force, with 2.5% or 977 of them unemployed. The age group with the highest labor force participation rate is 25 to 29 years, with 92.3% or 5,411 individuals in the labor force. Within the labor force, the 16 to 19 years age range has the highest percentage of unemployed individuals, with 8.3% or 124 of them being unemployed.
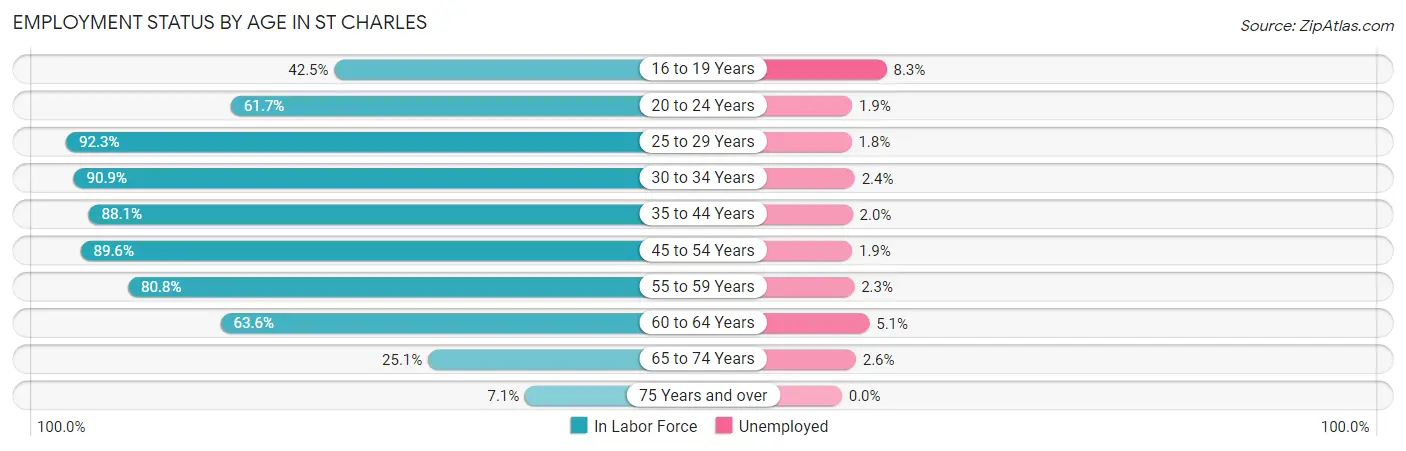
| Age Bracket | In Labor Force | Unemployed |
| 16 to 19 Years | 1,500 (42.5%) | 125 (8.3%) |
| 20 to 24 Years | 4,128 (61.7%) | 78 (1.9%) |
| 25 to 29 Years | 5,411 (92.3%) | 97 (1.8%) |
| 30 to 34 Years | 4,700 (90.9%) | 113 (2.4%) |
| 35 to 44 Years | 7,418 (88.1%) | 148 (2.0%) |
| 45 to 54 Years | 6,334 (89.6%) | 120 (1.9%) |
| 55 to 59 Years | 4,225 (80.8%) | 97 (2.3%) |
| 60 to 64 Years | 3,114 (63.6%) | 159 (5.1%) |
| 65 to 74 Years | 1,838 (25.1%) | 48 (2.6%) |
| 75 Years and over | 377 (7.1%) | 0 (0.0%) |
| Total | 39,087 (65.7%) | 977 (2.5%) |
Employment Status by Educational Attainment in St Charles
According to labor force statistics for St Charles, 85.2% of individuals (31,224) out of the total population between 25 and 64 years of age (36,648) are in the labor force, with 2.3% or 718 of them being unemployed. The group with the highest labor force participation rate are those with the educational attainment of bachelor's degree or higher, with 91.4% or 16,312 individuals in the labor force. Within the labor force, individuals with college / associate degree education have the highest percentage of unemployment, with 3.9% or 345 of them being unemployed.
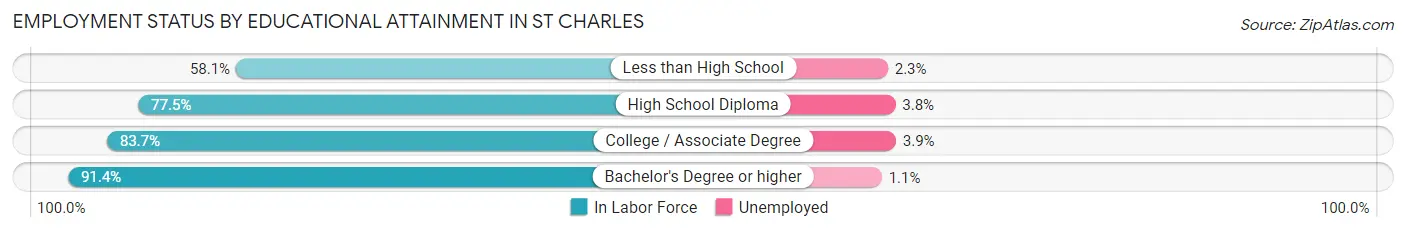
| Educational Attainment | In Labor Force | Unemployed |
| Less than High School | 969 (58.1%) | 38 (2.3%) |
| High School Diploma | 5,099 (77.5%) | 250 (3.8%) |
| College / Associate Degree | 8,835 (83.7%) | 412 (3.9%) |
| Bachelor's Degree or higher | 16,312 (91.4%) | 196 (1.1%) |
| Total | 31,224 (85.2%) | 843 (2.3%) |
Employment Occupations by Sex in St Charles
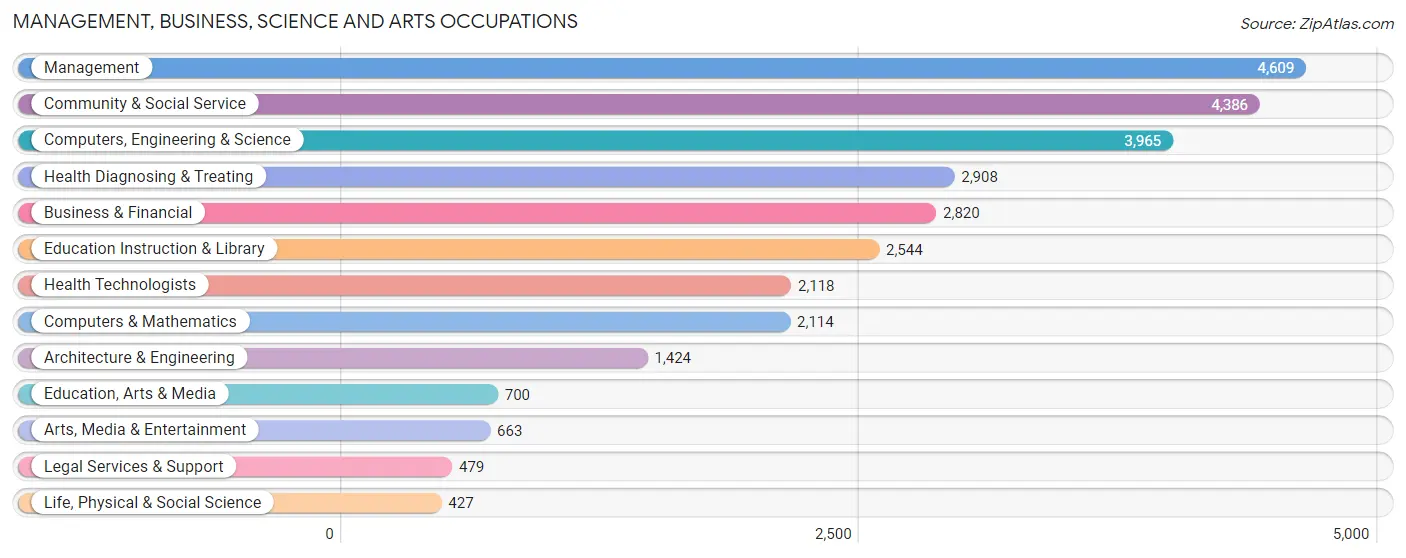
Management, Business, Science and Arts Occupations
The most common Management, Business, Science and Arts occupations in St Charles are Management (4,609 | 12.1%), Community & Social Service (4,386 | 11.5%), Computers, Engineering & Science (3,965 | 10.4%), Health Diagnosing & Treating (2,908 | 7.6%), and Business & Financial (2,820 | 7.4%).
Management, Business, Science and Arts Occupations by Sex
Within the Management, Business, Science and Arts occupations in St Charles, the most male-oriented occupations are Architecture & Engineering (87.5%), Computers & Mathematics (78.4%), and Computers, Engineering & Science (76.6%), while the most female-oriented occupations are Health Diagnosing & Treating (77.0%), Health Technologists (73.7%), and Education Instruction & Library (72.3%).
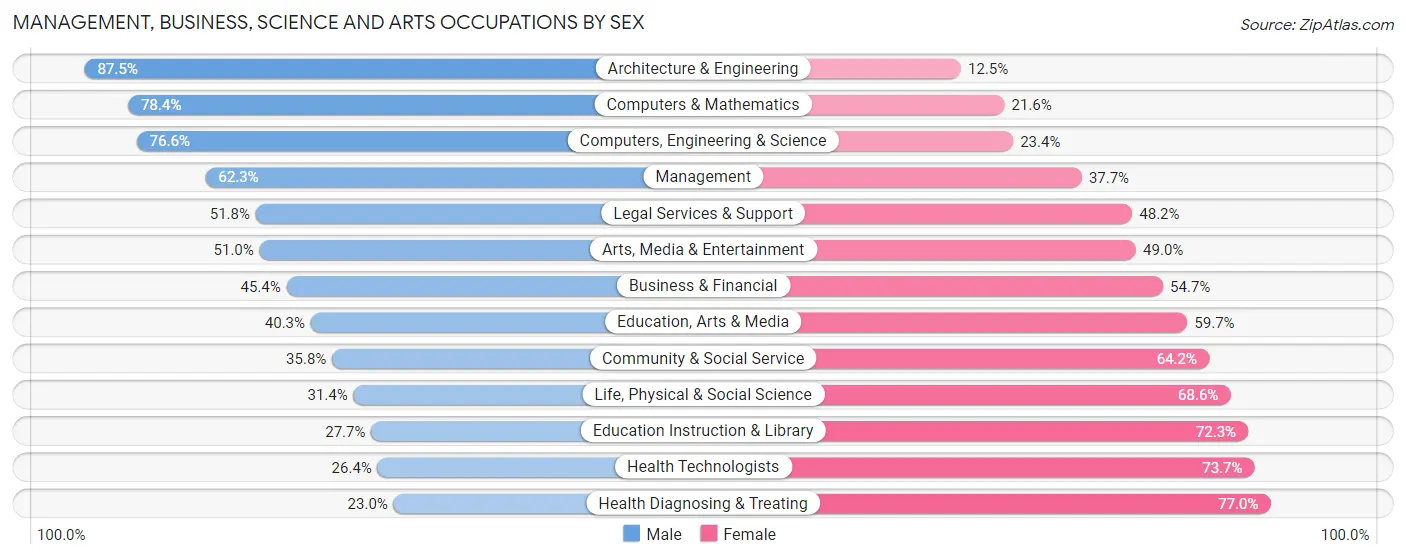
| Occupation | Male | Female |
| Management | 2,871 (62.3%) | 1,738 (37.7%) |
| Business & Financial | 1,279 (45.4%) | 1,541 (54.6%) |
| Computers, Engineering & Science | 3,038 (76.6%) | 927 (23.4%) |
| Computers & Mathematics | 1,658 (78.4%) | 456 (21.6%) |
| Architecture & Engineering | 1,246 (87.5%) | 178 (12.5%) |
| Life, Physical & Social Science | 134 (31.4%) | 293 (68.6%) |
| Community & Social Service | 1,572 (35.8%) | 2,814 (64.2%) |
| Education, Arts & Media | 282 (40.3%) | 418 (59.7%) |
| Legal Services & Support | 248 (51.8%) | 231 (48.2%) |
| Education Instruction & Library | 704 (27.7%) | 1,840 (72.3%) |
| Arts, Media & Entertainment | 338 (51.0%) | 325 (49.0%) |
| Health Diagnosing & Treating | 669 (23.0%) | 2,239 (77.0%) |
| Health Technologists | 558 (26.4%) | 1,560 (73.7%) |
| Total (Category) | 9,429 (50.4%) | 9,259 (49.5%) |
| Total (Overall) | 19,892 (52.3%) | 18,147 (47.7%) |
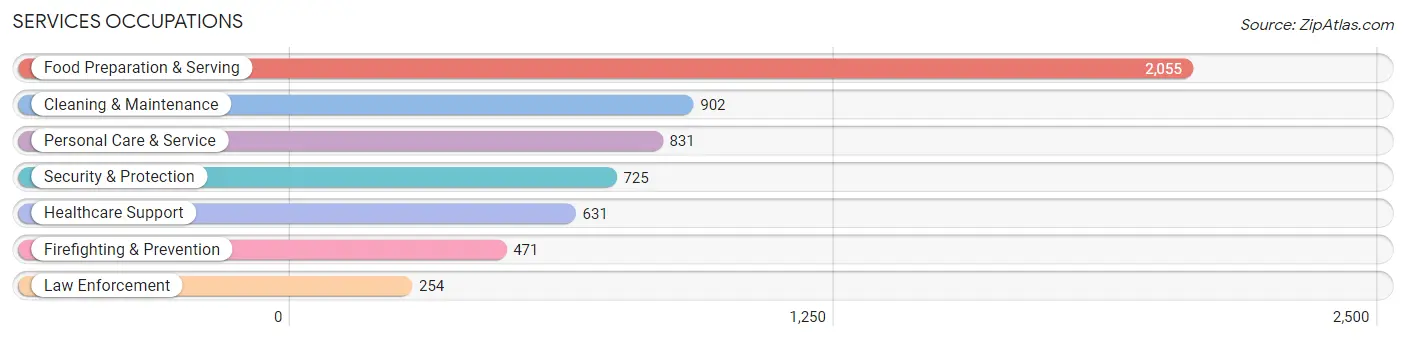
Services Occupations
The most common Services occupations in St Charles are Food Preparation & Serving (2,055 | 5.4%), Cleaning & Maintenance (902 | 2.4%), Personal Care & Service (831 | 2.2%), Security & Protection (725 | 1.9%), and Healthcare Support (631 | 1.7%).
Services Occupations by Sex
Within the Services occupations in St Charles, the most male-oriented occupations are Law Enforcement (74.8%), Security & Protection (62.8%), and Cleaning & Maintenance (56.7%), while the most female-oriented occupations are Healthcare Support (87.5%), Personal Care & Service (80.9%), and Food Preparation & Serving (58.4%).
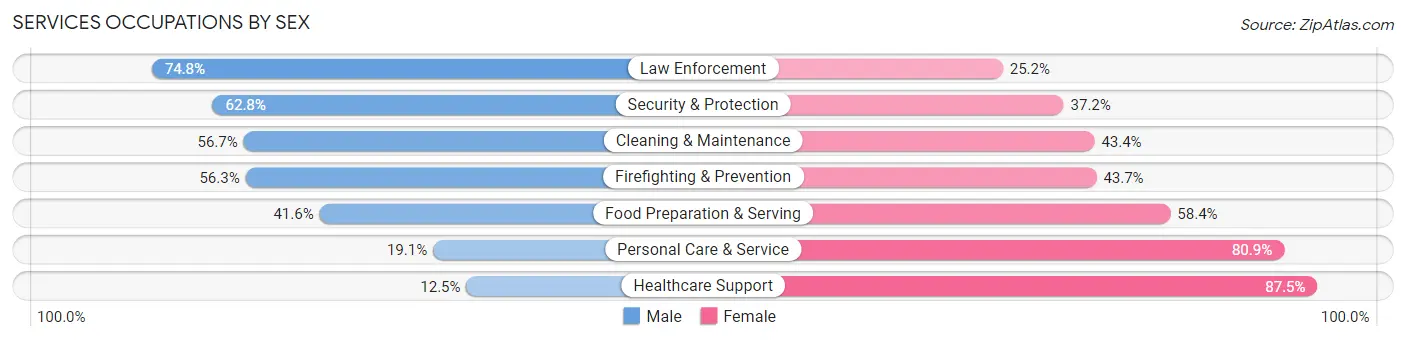
| Occupation | Male | Female |
| Healthcare Support | 79 (12.5%) | 552 (87.5%) |
| Security & Protection | 455 (62.8%) | 270 (37.2%) |
| Firefighting & Prevention | 265 (56.3%) | 206 (43.7%) |
| Law Enforcement | 190 (74.8%) | 64 (25.2%) |
| Food Preparation & Serving | 855 (41.6%) | 1,200 (58.4%) |
| Cleaning & Maintenance | 511 (56.7%) | 391 (43.3%) |
| Personal Care & Service | 159 (19.1%) | 672 (80.9%) |
| Total (Category) | 2,059 (40.0%) | 3,085 (60.0%) |
| Total (Overall) | 19,892 (52.3%) | 18,147 (47.7%) |
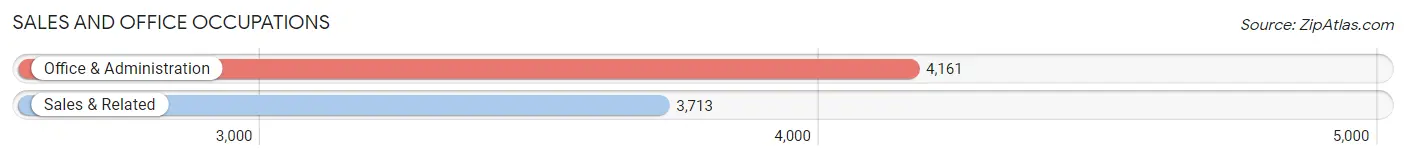
Sales and Office Occupations
The most common Sales and Office occupations in St Charles are Office & Administration (4,161 | 10.9%), and Sales & Related (3,713 | 9.8%).
Sales and Office Occupations by Sex
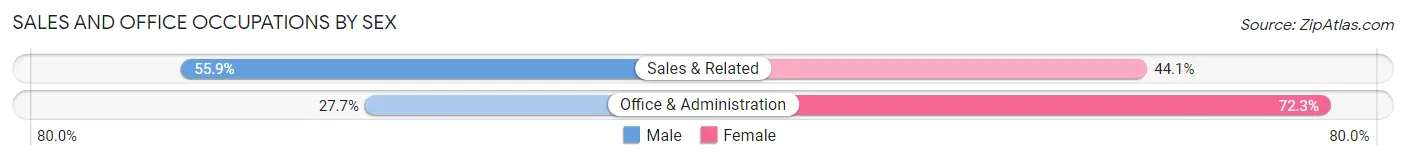
| Occupation | Male | Female |
| Sales & Related | 2,075 (55.9%) | 1,638 (44.1%) |
| Office & Administration | 1,151 (27.7%) | 3,010 (72.3%) |
| Total (Category) | 3,226 (41.0%) | 4,648 (59.0%) |
| Total (Overall) | 19,892 (52.3%) | 18,147 (47.7%) |
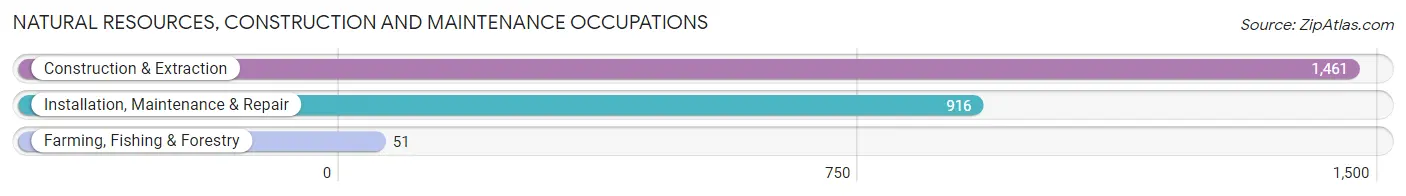
Natural Resources, Construction and Maintenance Occupations
The most common Natural Resources, Construction and Maintenance occupations in St Charles are Construction & Extraction (1,461 | 3.8%), Installation, Maintenance & Repair (916 | 2.4%), and Farming, Fishing & Forestry (51 | 0.1%).
Natural Resources, Construction and Maintenance Occupations by Sex
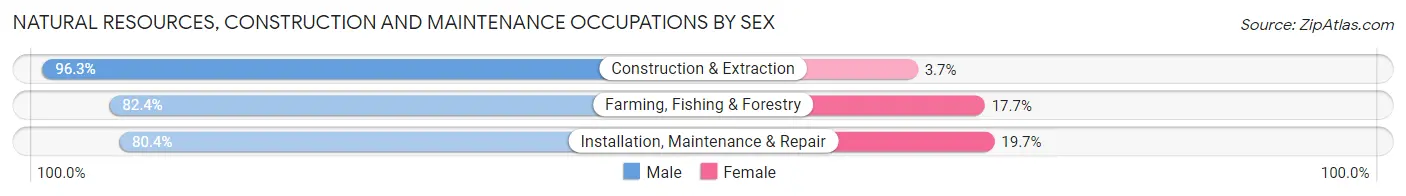
| Occupation | Male | Female |
| Farming, Fishing & Forestry | 42 (82.4%) | 9 (17.6%) |
| Construction & Extraction | 1,407 (96.3%) | 54 (3.7%) |
| Installation, Maintenance & Repair | 736 (80.3%) | 180 (19.7%) |
| Total (Category) | 2,185 (90.0%) | 243 (10.0%) |
| Total (Overall) | 19,892 (52.3%) | 18,147 (47.7%) |
Production, Transportation and Moving Occupations
The most common Production, Transportation and Moving occupations in St Charles are Production (1,554 | 4.1%), Transportation (1,200 | 3.2%), and Material Moving (1,151 | 3.0%).
Production, Transportation and Moving Occupations by Sex
| Occupation | Male | Female |
| Production | 1,234 (79.4%) | 320 (20.6%) |
| Transportation | 997 (83.1%) | 203 (16.9%) |
| Material Moving | 762 (66.2%) | 389 (33.8%) |
| Total (Category) | 2,993 (76.6%) | 912 (23.4%) |
| Total (Overall) | 19,892 (52.3%) | 18,147 (47.7%) |
Employment Industries by Sex in St Charles
Employment Industries in St Charles
The major employment industries in St Charles include Manufacturing (5,129 | 13.5%), Health Care & Social Assistance (4,933 | 13.0%), Educational Services (3,990 | 10.5%), Retail Trade (3,588 | 9.4%), and Professional & Scientific (3,208 | 8.4%).
Employment Industries by Sex in St Charles
The St Charles industries that see more men than women are Mining, Quarrying, & Extraction (100.0%), Agriculture, Fishing & Hunting (95.7%), and Construction (86.6%), whereas the industries that tend to have a higher number of women are Health Care & Social Assistance (76.5%), Educational Services (69.7%), and Enterprise Management (69.2%).
| Industry | Male | Female |
| Agriculture, Fishing & Hunting | 112 (95.7%) | 5 (4.3%) |
| Mining, Quarrying, & Extraction | 31 (100.0%) | 0 (0.0%) |
| Construction | 1,809 (86.6%) | 279 (13.4%) |
| Manufacturing | 3,586 (69.9%) | 1,543 (30.1%) |
| Wholesale Trade | 901 (76.9%) | 271 (23.1%) |
| Retail Trade | 2,006 (55.9%) | 1,582 (44.1%) |
| Transportation & Warehousing | 1,374 (71.1%) | 559 (28.9%) |
| Utilities | 146 (61.3%) | 92 (38.7%) |
| Information | 432 (64.6%) | 237 (35.4%) |
| Finance & Insurance | 1,303 (48.4%) | 1,390 (51.6%) |
| Real Estate, Rental & Leasing | 464 (61.4%) | 292 (38.6%) |
| Professional & Scientific | 1,775 (55.3%) | 1,433 (44.7%) |
| Enterprise Management | 32 (30.8%) | 72 (69.2%) |
| Administrative & Support | 738 (61.1%) | 469 (38.9%) |
| Educational Services | 1,209 (30.3%) | 2,781 (69.7%) |
| Health Care & Social Assistance | 1,161 (23.5%) | 3,772 (76.5%) |
| Arts, Entertainment & Recreation | 344 (41.7%) | 481 (58.3%) |
| Accommodation & Food Services | 1,145 (42.8%) | 1,532 (57.2%) |
| Public Administration | 626 (56.1%) | 489 (43.9%) |
| Total | 19,892 (52.3%) | 18,147 (47.7%) |
Education in St Charles
School Enrollment in St Charles
The most common levels of schooling among the 16,991 students in St Charles are college / undergraduate (6,004 | 35.3%), elementary school (2,880 | 17.0%), and high school (2,466 | 14.5%).
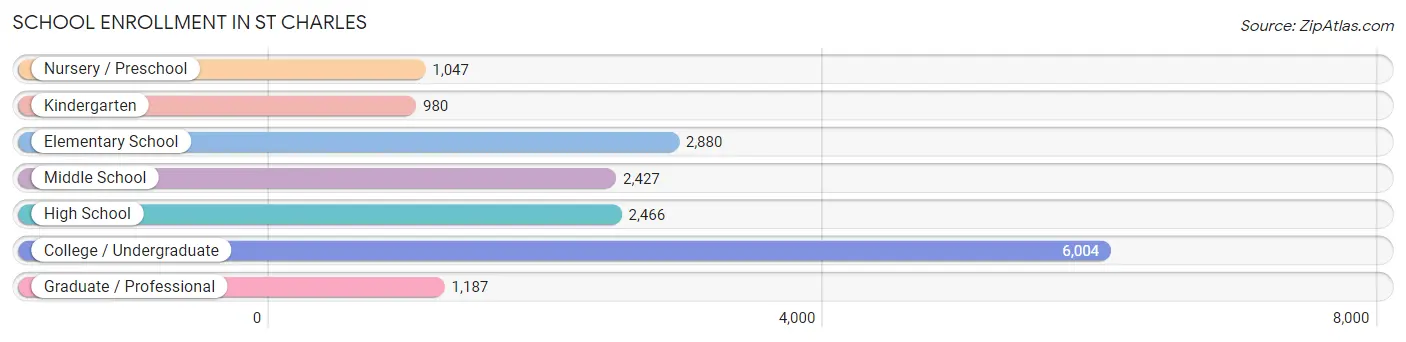
| School Level | # Students | % Students |
| Nursery / Preschool | 1,047 | 6.2% |
| Kindergarten | 980 | 5.8% |
| Elementary School | 2,880 | 17.0% |
| Middle School | 2,427 | 14.3% |
| High School | 2,466 | 14.5% |
| College / Undergraduate | 6,004 | 35.3% |
| Graduate / Professional | 1,187 | 7.0% |
| Total | 16,991 | 100.0% |
School Enrollment by Age by Funding Source in St Charles
Out of a total of 16,991 students who are enrolled in schools in St Charles, 6,474 (38.1%) attend a private institution, while the remaining 10,517 (61.9%) are enrolled in public schools. The age group of 20 to 24 year olds has the highest likelihood of being enrolled in private schools, with 2,679 (71.2% in the age bracket) enrolled. Conversely, the age group of 10 to 14 year olds has the lowest likelihood of being enrolled in a private school, with 2,571 (84.4% in the age bracket) attending a public institution.
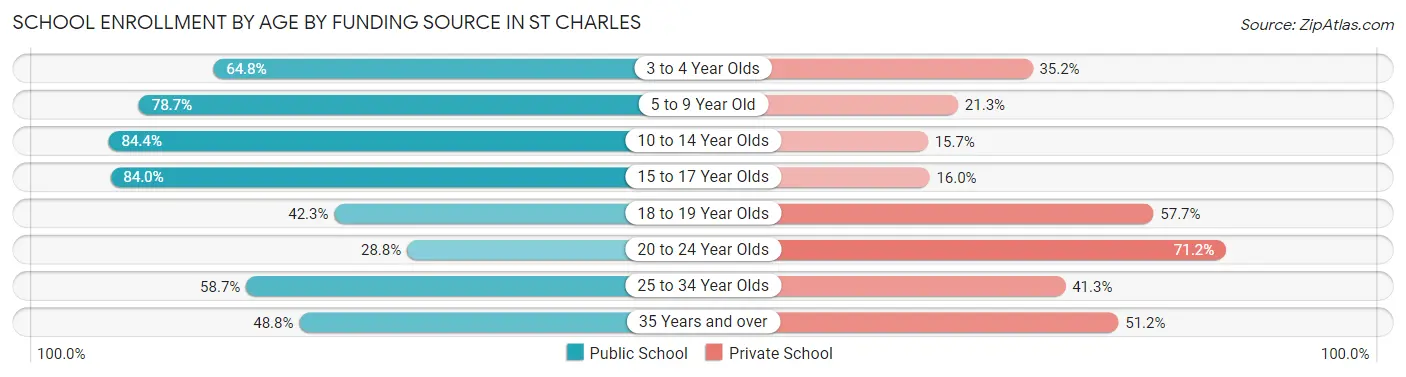
| Age Bracket | Public School | Private School |
| 3 to 4 Year Olds | 498 (64.8%) | 270 (35.2%) |
| 5 to 9 Year Old | 2,926 (78.7%) | 791 (21.3%) |
| 10 to 14 Year Olds | 2,571 (84.4%) | 477 (15.7%) |
| 15 to 17 Year Olds | 1,604 (84.0%) | 305 (16.0%) |
| 18 to 19 Year Olds | 827 (42.3%) | 1,127 (57.7%) |
| 20 to 24 Year Olds | 1,082 (28.8%) | 2,679 (71.2%) |
| 25 to 34 Year Olds | 696 (58.7%) | 489 (41.3%) |
| 35 Years and over | 317 (48.8%) | 332 (51.2%) |
| Total | 10,517 (61.9%) | 6,474 (38.1%) |
Educational Attainment by Field of Study in St Charles
Business (5,431 | 23.2%), education (3,074 | 13.1%), science & technology (2,549 | 10.9%), engineering (2,029 | 8.7%), and arts & humanities (1,462 | 6.2%) are the most common fields of study among 23,427 individuals in St Charles who have obtained a bachelor's degree or higher.
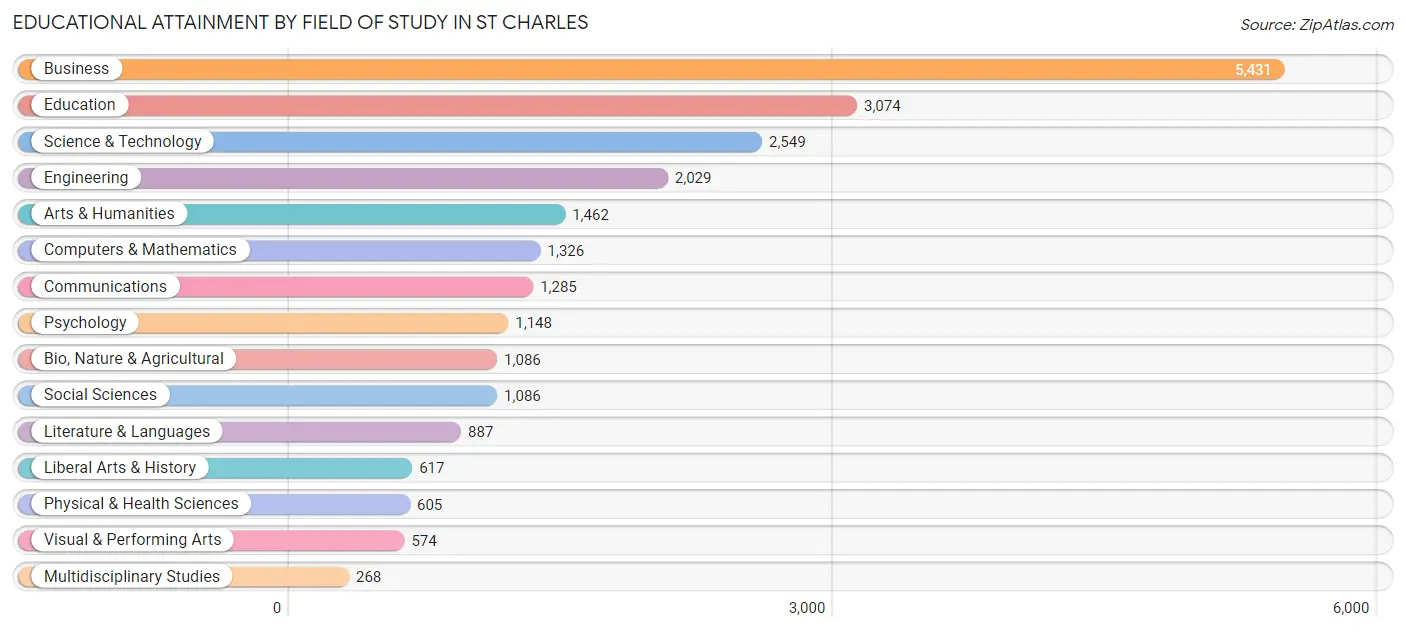
| Field of Study | # Graduates | % Graduates |
| Computers & Mathematics | 1,326 | 5.7% |
| Bio, Nature & Agricultural | 1,086 | 4.6% |
| Physical & Health Sciences | 605 | 2.6% |
| Psychology | 1,148 | 4.9% |
| Social Sciences | 1,086 | 4.6% |
| Engineering | 2,029 | 8.7% |
| Multidisciplinary Studies | 268 | 1.1% |
| Science & Technology | 2,549 | 10.9% |
| Business | 5,431 | 23.2% |
| Education | 3,074 | 13.1% |
| Literature & Languages | 887 | 3.8% |
| Liberal Arts & History | 617 | 2.6% |
| Visual & Performing Arts | 574 | 2.5% |
| Communications | 1,285 | 5.5% |
| Arts & Humanities | 1,462 | 6.2% |
| Total | 23,427 | 100.0% |
Transportation & Commute in St Charles
Vehicle Availability by Sex in St Charles
The most prevalent vehicle ownership categories in St Charles are males with 2 vehicles (10,262, accounting for 53.2%) and females with 2 vehicles (8,257, making up 60.1%).
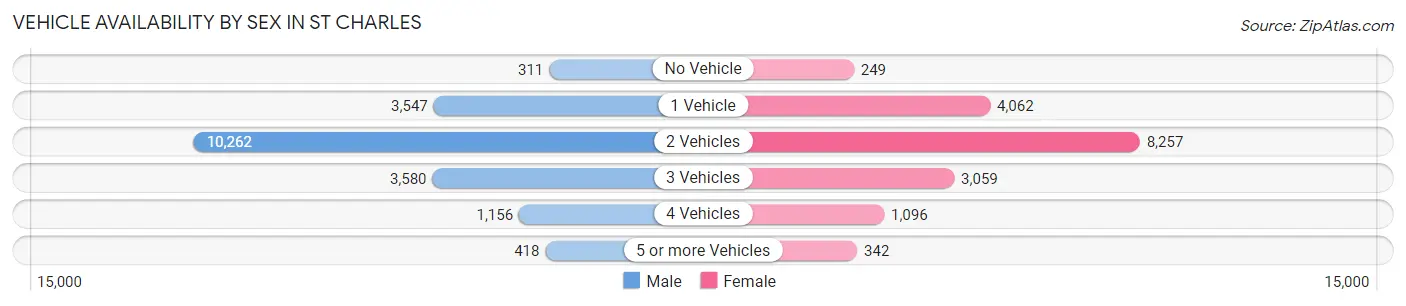
| Vehicles Available | Male | Female |
| No Vehicle | 311 (1.6%) | 249 (1.5%) |
| 1 Vehicle | 3,547 (18.4%) | 4,062 (23.8%) |
| 2 Vehicles | 10,262 (53.2%) | 8,257 (48.4%) |
| 3 Vehicles | 3,580 (18.6%) | 3,059 (17.9%) |
| 4 Vehicles | 1,156 (6.0%) | 1,096 (6.4%) |
| 5 or more Vehicles | 418 (2.2%) | 342 (2.0%) |
| Total | 19,274 (100.0%) | 17,065 (100.0%) |
Commute Time in St Charles
The most frequently occuring commute durations in St Charles are 15 to 19 minutes (6,547 commuters, 20.2%), 20 to 24 minutes (5,986 commuters, 18.5%), and 30 to 34 minutes (4,681 commuters, 14.4%).
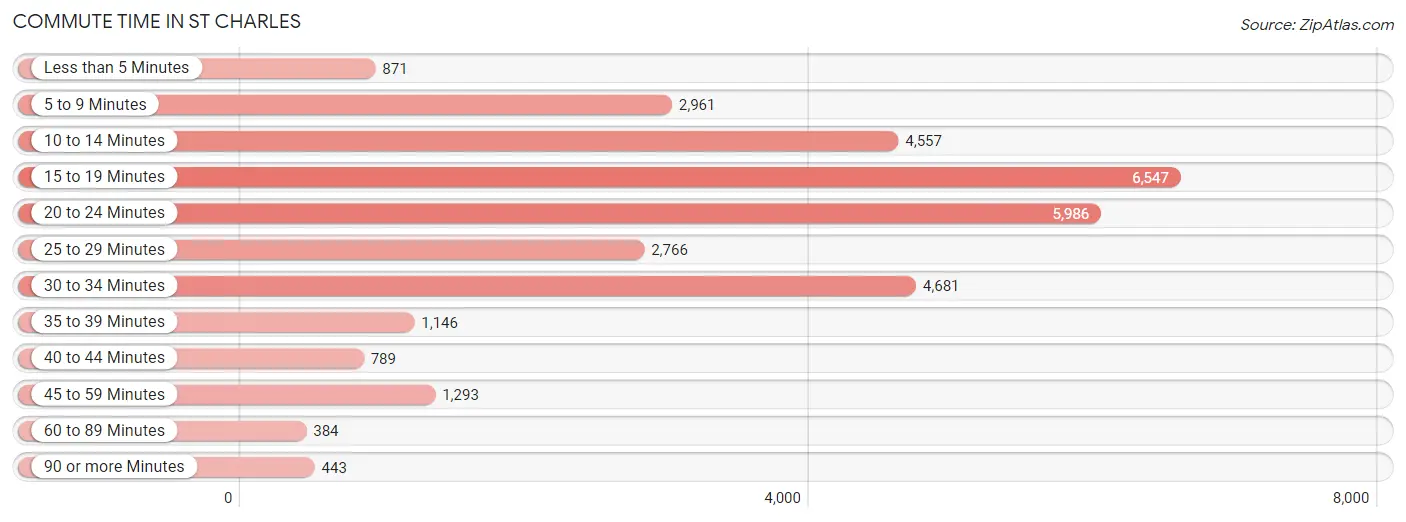
| Commute Time | # Commuters | % Commuters |
| Less than 5 Minutes | 871 | 2.7% |
| 5 to 9 Minutes | 2,961 | 9.1% |
| 10 to 14 Minutes | 4,557 | 14.1% |
| 15 to 19 Minutes | 6,547 | 20.2% |
| 20 to 24 Minutes | 5,986 | 18.5% |
| 25 to 29 Minutes | 2,766 | 8.5% |
| 30 to 34 Minutes | 4,681 | 14.4% |
| 35 to 39 Minutes | 1,146 | 3.5% |
| 40 to 44 Minutes | 789 | 2.4% |
| 45 to 59 Minutes | 1,293 | 4.0% |
| 60 to 89 Minutes | 384 | 1.2% |
| 90 or more Minutes | 443 | 1.4% |
Commute Time by Sex in St Charles
The most common commute times in St Charles are 15 to 19 minutes (3,499 commuters, 20.2%) for males and 15 to 19 minutes (3,048 commuters, 20.2%) for females.
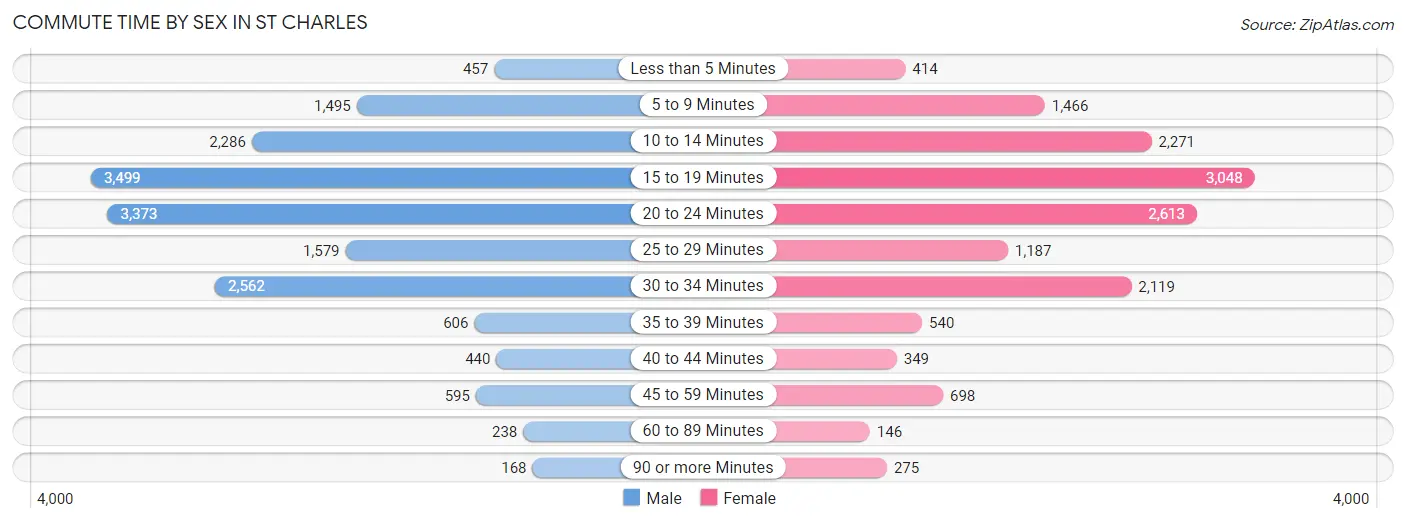
| Commute Time | Male | Female |
| Less than 5 Minutes | 457 (2.6%) | 414 (2.7%) |
| 5 to 9 Minutes | 1,495 (8.6%) | 1,466 (9.7%) |
| 10 to 14 Minutes | 2,286 (13.2%) | 2,271 (15.0%) |
| 15 to 19 Minutes | 3,499 (20.2%) | 3,048 (20.2%) |
| 20 to 24 Minutes | 3,373 (19.5%) | 2,613 (17.3%) |
| 25 to 29 Minutes | 1,579 (9.1%) | 1,187 (7.9%) |
| 30 to 34 Minutes | 2,562 (14.8%) | 2,119 (14.0%) |
| 35 to 39 Minutes | 606 (3.5%) | 540 (3.6%) |
| 40 to 44 Minutes | 440 (2.5%) | 349 (2.3%) |
| 45 to 59 Minutes | 595 (3.4%) | 698 (4.6%) |
| 60 to 89 Minutes | 238 (1.4%) | 146 (1.0%) |
| 90 or more Minutes | 168 (1.0%) | 275 (1.8%) |
Time of Departure to Work by Sex in St Charles
The most frequent times of departure to work in St Charles are 7:30 AM to 7:59 AM (2,453, 14.2%) for males and 7:30 AM to 7:59 AM (2,091, 13.8%) for females.
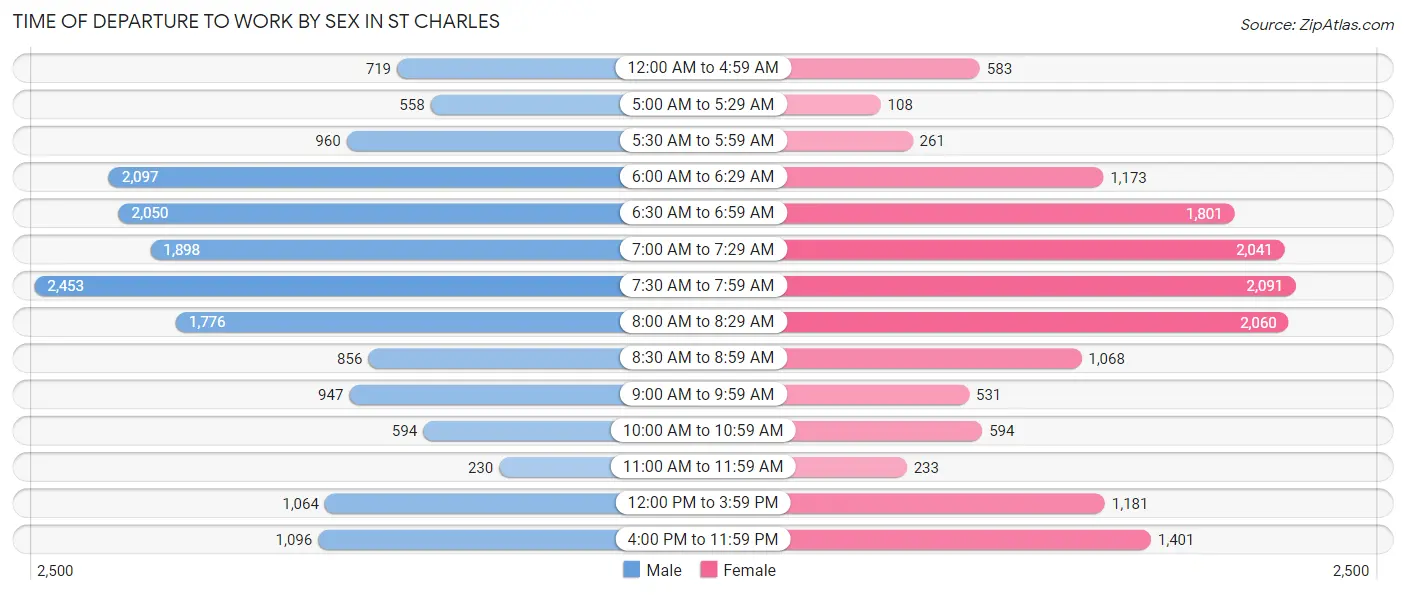
| Time of Departure | Male | Female |
| 12:00 AM to 4:59 AM | 719 (4.2%) | 583 (3.8%) |
| 5:00 AM to 5:29 AM | 558 (3.2%) | 108 (0.7%) |
| 5:30 AM to 5:59 AM | 960 (5.6%) | 261 (1.7%) |
| 6:00 AM to 6:29 AM | 2,097 (12.1%) | 1,173 (7.7%) |
| 6:30 AM to 6:59 AM | 2,050 (11.8%) | 1,801 (11.9%) |
| 7:00 AM to 7:29 AM | 1,898 (11.0%) | 2,041 (13.5%) |
| 7:30 AM to 7:59 AM | 2,453 (14.2%) | 2,091 (13.8%) |
| 8:00 AM to 8:29 AM | 1,776 (10.3%) | 2,060 (13.6%) |
| 8:30 AM to 8:59 AM | 856 (5.0%) | 1,068 (7.1%) |
| 9:00 AM to 9:59 AM | 947 (5.5%) | 531 (3.5%) |
| 10:00 AM to 10:59 AM | 594 (3.4%) | 594 (3.9%) |
| 11:00 AM to 11:59 AM | 230 (1.3%) | 233 (1.5%) |
| 12:00 PM to 3:59 PM | 1,064 (6.1%) | 1,181 (7.8%) |
| 4:00 PM to 11:59 PM | 1,096 (6.3%) | 1,401 (9.3%) |
| Total | 17,298 (100.0%) | 15,126 (100.0%) |
Housing Occupancy in St Charles
Occupancy by Ownership in St Charles
Of the total 29,760 dwellings in St Charles, owner-occupied units account for 19,881 (66.8%), while renter-occupied units make up 9,879 (33.2%).
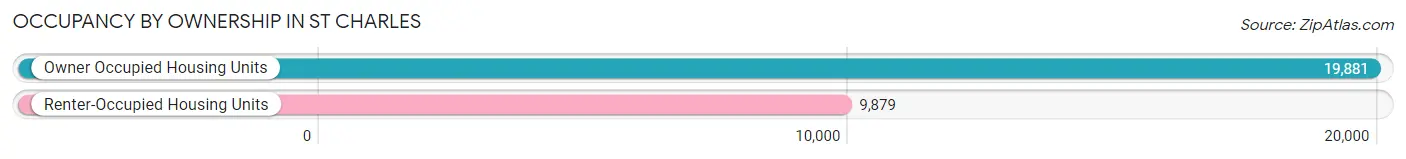
| Occupancy | # Housing Units | % Housing Units |
| Owner Occupied Housing Units | 19,881 | 66.8% |
| Renter-Occupied Housing Units | 9,879 | 33.2% |
| Total Occupied Housing Units | 29,760 | 100.0% |
Occupancy by Household Size in St Charles
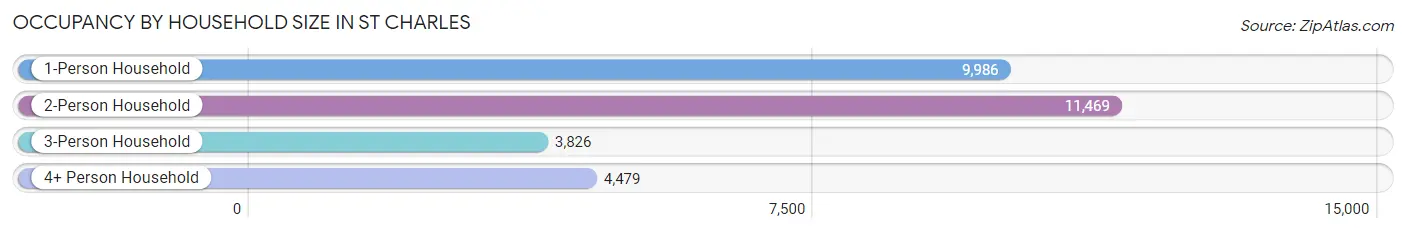
| Household Size | # Housing Units | % Housing Units |
| 1-Person Household | 9,986 | 33.6% |
| 2-Person Household | 11,469 | 38.5% |
| 3-Person Household | 3,826 | 12.9% |
| 4+ Person Household | 4,479 | 15.0% |
| Total Housing Units | 29,760 | 100.0% |
Occupancy by Ownership by Household Size in St Charles
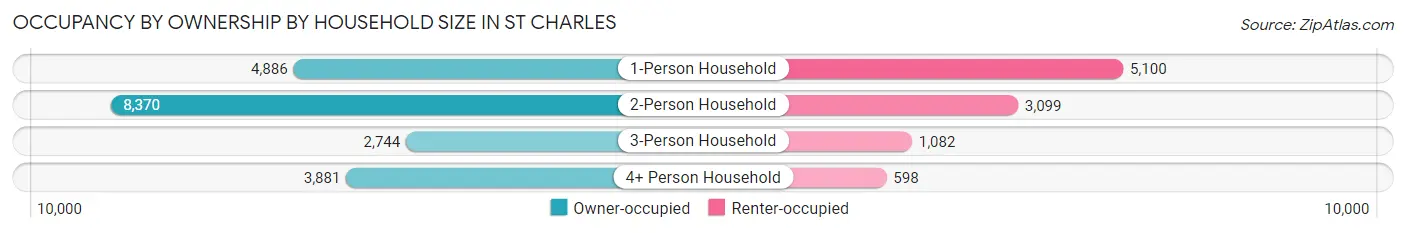
| Household Size | Owner-occupied | Renter-occupied |
| 1-Person Household | 4,886 (48.9%) | 5,100 (51.1%) |
| 2-Person Household | 8,370 (73.0%) | 3,099 (27.0%) |
| 3-Person Household | 2,744 (71.7%) | 1,082 (28.3%) |
| 4+ Person Household | 3,881 (86.7%) | 598 (13.4%) |
| Total Housing Units | 19,881 (66.8%) | 9,879 (33.2%) |
Occupancy by Educational Attainment in St Charles
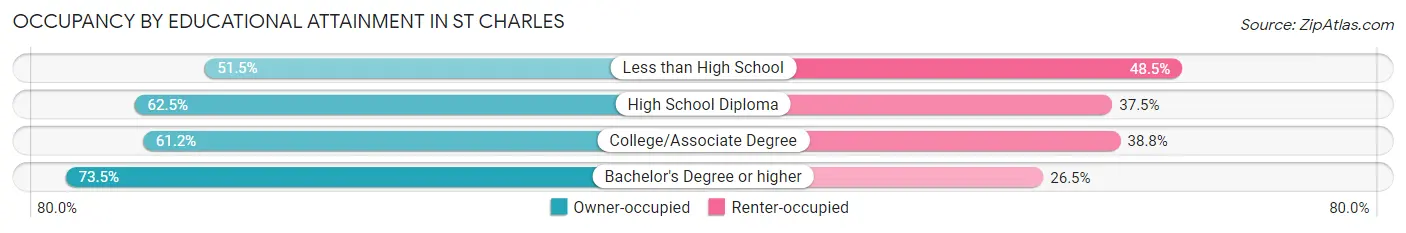
| Household Size | Owner-occupied | Renter-occupied |
| Less than High School | 643 (51.5%) | 606 (48.5%) |
| High School Diploma | 3,524 (62.5%) | 2,111 (37.5%) |
| College/Associate Degree | 5,473 (61.2%) | 3,465 (38.8%) |
| Bachelor's Degree or higher | 10,241 (73.5%) | 3,697 (26.5%) |
Occupancy by Age of Householder in St Charles
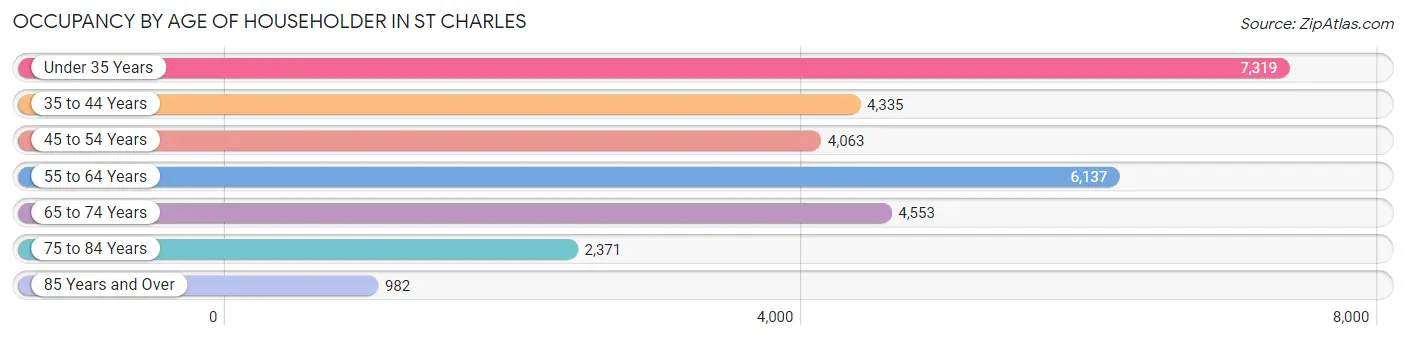
| Age Bracket | # Households | % Households |
| Under 35 Years | 7,319 | 24.6% |
| 35 to 44 Years | 4,335 | 14.6% |
| 45 to 54 Years | 4,063 | 13.7% |
| 55 to 64 Years | 6,137 | 20.6% |
| 65 to 74 Years | 4,553 | 15.3% |
| 75 to 84 Years | 2,371 | 8.0% |
| 85 Years and Over | 982 | 3.3% |
| Total | 29,760 | 100.0% |
Housing Finances in St Charles
Median Income by Occupancy in St Charles
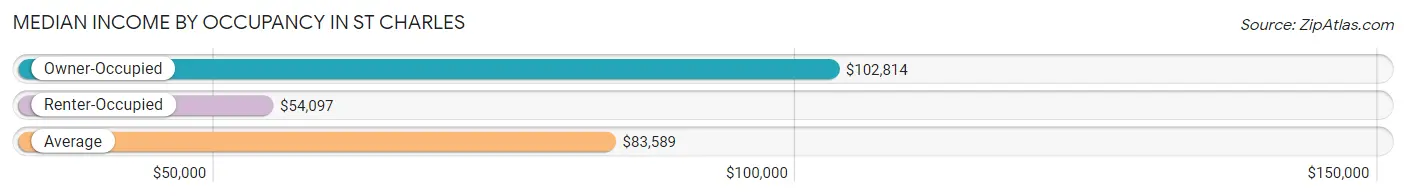
| Occupancy Type | # Households | Median Income |
| Owner-Occupied | 19,881 (66.8%) | $102,814 |
| Renter-Occupied | 9,879 (33.2%) | $54,097 |
| Average | 29,760 (100.0%) | $83,589 |
Occupancy by Householder Income Bracket in St Charles
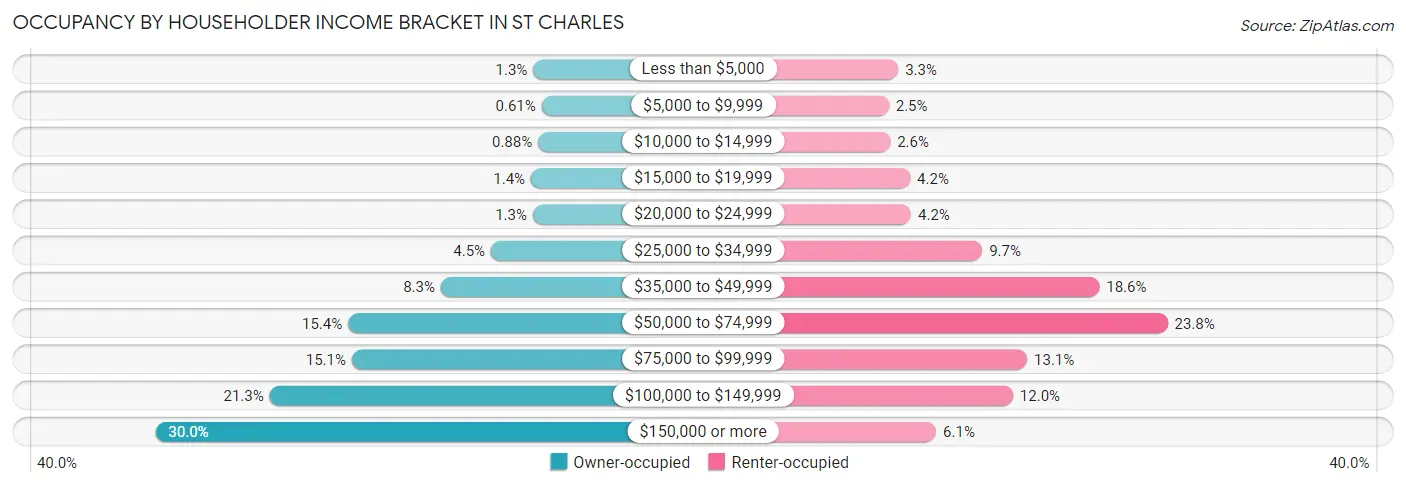
| Income Bracket | Owner-occupied | Renter-occupied |
| Less than $5,000 | 249 (1.3%) | 321 (3.3%) |
| $5,000 to $9,999 | 121 (0.6%) | 250 (2.5%) |
| $10,000 to $14,999 | 174 (0.9%) | 261 (2.6%) |
| $15,000 to $19,999 | 283 (1.4%) | 411 (4.2%) |
| $20,000 to $24,999 | 255 (1.3%) | 418 (4.2%) |
| $25,000 to $34,999 | 888 (4.5%) | 953 (9.7%) |
| $35,000 to $49,999 | 1,649 (8.3%) | 1,835 (18.6%) |
| $50,000 to $74,999 | 3,053 (15.4%) | 2,348 (23.8%) |
| $75,000 to $99,999 | 2,996 (15.1%) | 1,291 (13.1%) |
| $100,000 to $149,999 | 4,242 (21.3%) | 1,184 (12.0%) |
| $150,000 or more | 5,971 (30.0%) | 607 (6.1%) |
| Total | 19,881 (100.0%) | 9,879 (100.0%) |
Monthly Housing Cost Tiers in St Charles
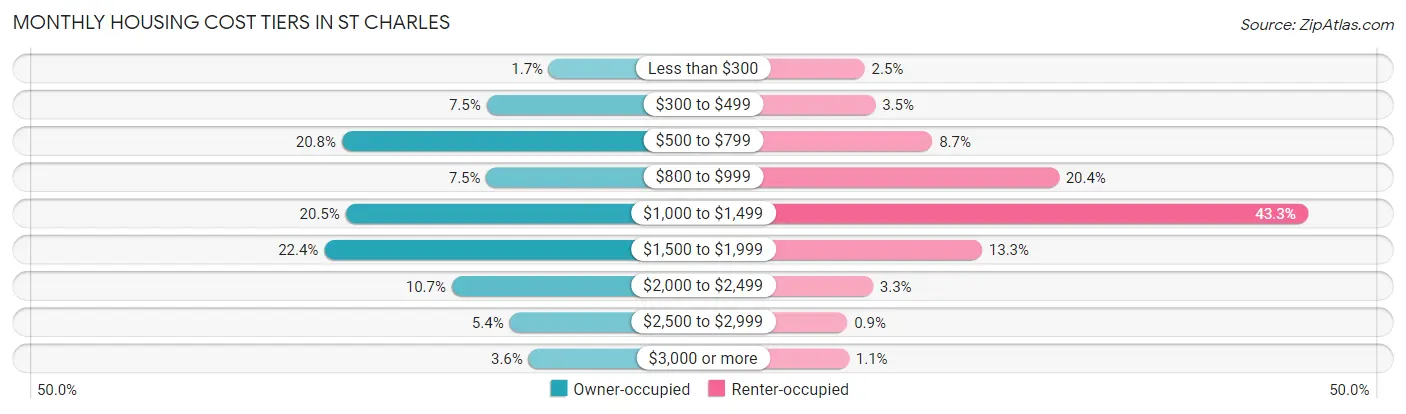
| Monthly Cost | Owner-occupied | Renter-occupied |
| Less than $300 | 344 (1.7%) | 247 (2.5%) |
| $300 to $499 | 1,486 (7.5%) | 344 (3.5%) |
| $500 to $799 | 4,136 (20.8%) | 862 (8.7%) |
| $800 to $999 | 1,490 (7.5%) | 2,012 (20.4%) |
| $1,000 to $1,499 | 4,065 (20.4%) | 4,276 (43.3%) |
| $1,500 to $1,999 | 4,457 (22.4%) | 1,314 (13.3%) |
| $2,000 to $2,499 | 2,122 (10.7%) | 322 (3.3%) |
| $2,500 to $2,999 | 1,065 (5.4%) | 89 (0.9%) |
| $3,000 or more | 716 (3.6%) | 104 (1.1%) |
| Total | 19,881 (100.0%) | 9,879 (100.0%) |
Physical Housing Characteristics in St Charles
Housing Structures in St Charles
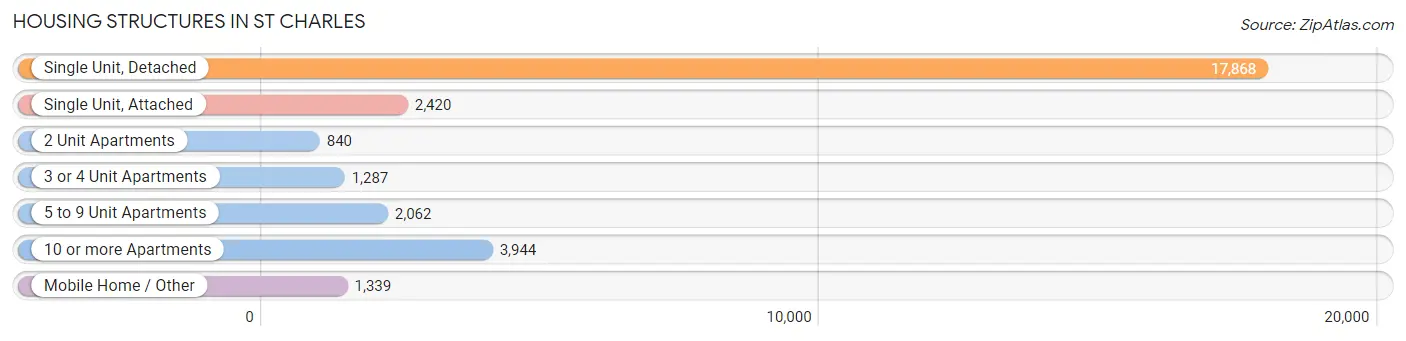
| Structure Type | # Housing Units | % Housing Units |
| Single Unit, Detached | 17,868 | 60.0% |
| Single Unit, Attached | 2,420 | 8.1% |
| 2 Unit Apartments | 840 | 2.8% |
| 3 or 4 Unit Apartments | 1,287 | 4.3% |
| 5 to 9 Unit Apartments | 2,062 | 6.9% |
| 10 or more Apartments | 3,944 | 13.3% |
| Mobile Home / Other | 1,339 | 4.5% |
| Total | 29,760 | 100.0% |
Housing Structures by Occupancy in St Charles
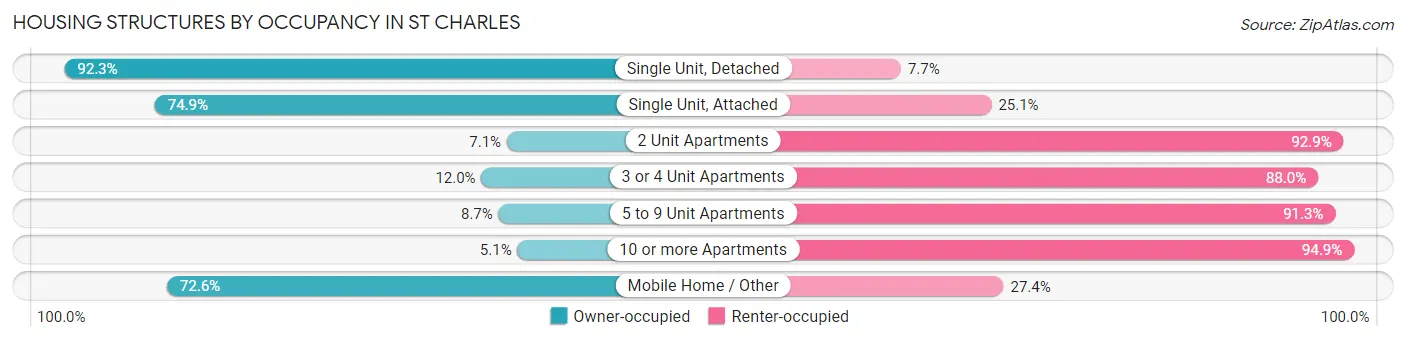
| Structure Type | Owner-occupied | Renter-occupied |
| Single Unit, Detached | 16,500 (92.3%) | 1,368 (7.7%) |
| Single Unit, Attached | 1,813 (74.9%) | 607 (25.1%) |
| 2 Unit Apartments | 60 (7.1%) | 780 (92.9%) |
| 3 or 4 Unit Apartments | 155 (12.0%) | 1,132 (88.0%) |
| 5 to 9 Unit Apartments | 180 (8.7%) | 1,882 (91.3%) |
| 10 or more Apartments | 201 (5.1%) | 3,743 (94.9%) |
| Mobile Home / Other | 972 (72.6%) | 367 (27.4%) |
| Total | 19,881 (66.8%) | 9,879 (33.2%) |
Housing Structures by Number of Rooms in St Charles
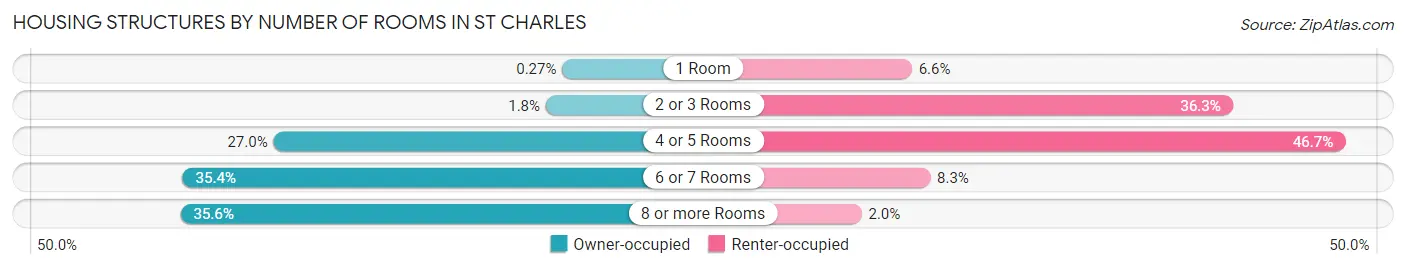
| Number of Rooms | Owner-occupied | Renter-occupied |
| 1 Room | 53 (0.3%) | 656 (6.6%) |
| 2 or 3 Rooms | 356 (1.8%) | 3,587 (36.3%) |
| 4 or 5 Rooms | 5,364 (27.0%) | 4,614 (46.7%) |
| 6 or 7 Rooms | 7,034 (35.4%) | 824 (8.3%) |
| 8 or more Rooms | 7,074 (35.6%) | 198 (2.0%) |
| Total | 19,881 (100.0%) | 9,879 (100.0%) |
Housing Structure by Heating Type in St Charles
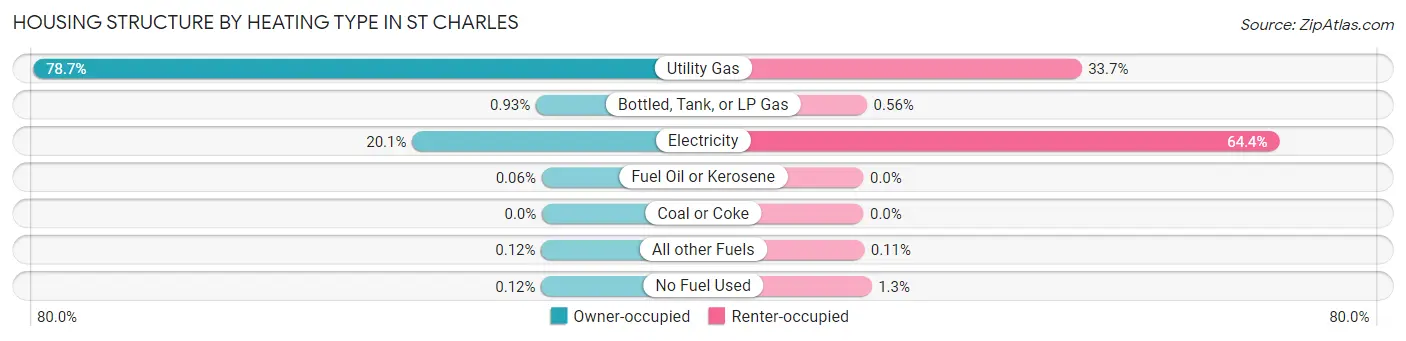
| Heating Type | Owner-occupied | Renter-occupied |
| Utility Gas | 15,646 (78.7%) | 3,332 (33.7%) |
| Bottled, Tank, or LP Gas | 184 (0.9%) | 55 (0.6%) |
| Electricity | 3,991 (20.1%) | 6,357 (64.3%) |
| Fuel Oil or Kerosene | 12 (0.1%) | 0 (0.0%) |
| Coal or Coke | 0 (0.0%) | 0 (0.0%) |
| All other Fuels | 24 (0.1%) | 11 (0.1%) |
| No Fuel Used | 24 (0.1%) | 124 (1.3%) |
| Total | 19,881 (100.0%) | 9,879 (100.0%) |
Household Vehicle Usage in St Charles
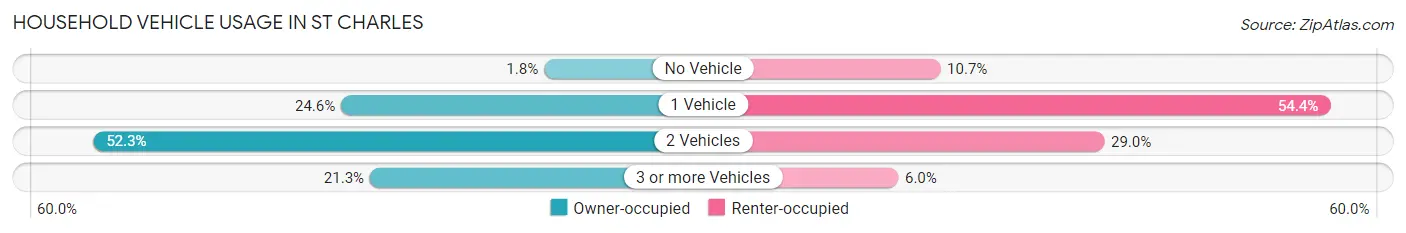
| Vehicles per Household | Owner-occupied | Renter-occupied |
| No Vehicle | 361 (1.8%) | 1,054 (10.7%) |
| 1 Vehicle | 4,881 (24.5%) | 5,369 (54.3%) |
| 2 Vehicles | 10,400 (52.3%) | 2,868 (29.0%) |
| 3 or more Vehicles | 4,239 (21.3%) | 588 (5.9%) |
| Total | 19,881 (100.0%) | 9,879 (100.0%) |
Real Estate & Mortgages in St Charles
Real Estate and Mortgage Overview in St Charles
| Characteristic | Without Mortgage | With Mortgage |
| Housing Units | 6,765 | 13,116 |
| Median Property Value | $244,700 | $266,400 |
| Median Household Income | $74,036 | $4,717 |
| Monthly Housing Costs | $619 | $685 |
| Real Estate Taxes | $2,923 | $208 |
Property Value by Mortgage Status in St Charles
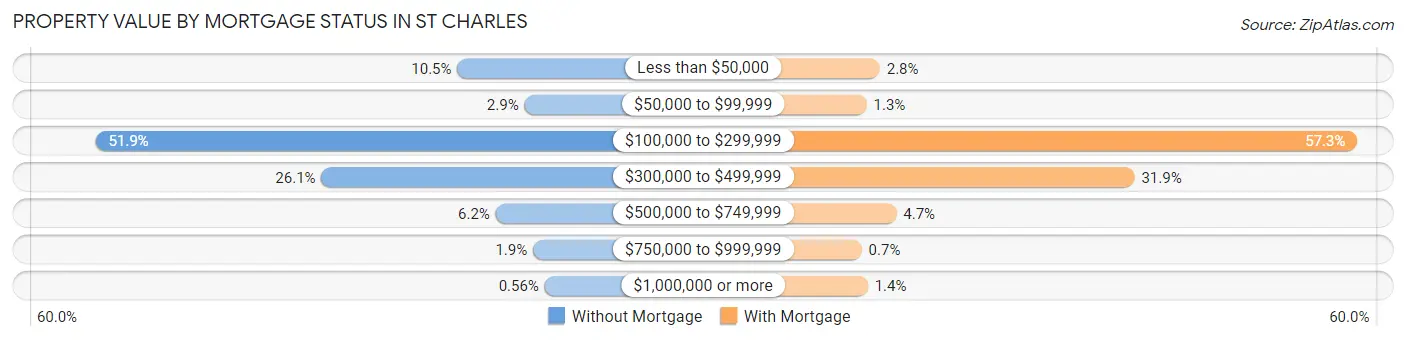
| Property Value | Without Mortgage | With Mortgage |
| Less than $50,000 | 713 (10.5%) | 363 (2.8%) |
| $50,000 to $99,999 | 194 (2.9%) | 165 (1.3%) |
| $100,000 to $299,999 | 3,511 (51.9%) | 7,521 (57.3%) |
| $300,000 to $499,999 | 1,764 (26.1%) | 4,182 (31.9%) |
| $500,000 to $749,999 | 417 (6.2%) | 611 (4.7%) |
| $750,000 to $999,999 | 128 (1.9%) | 92 (0.7%) |
| $1,000,000 or more | 38 (0.6%) | 182 (1.4%) |
| Total | 6,765 (100.0%) | 13,116 (100.0%) |
Household Income by Mortgage Status in St Charles
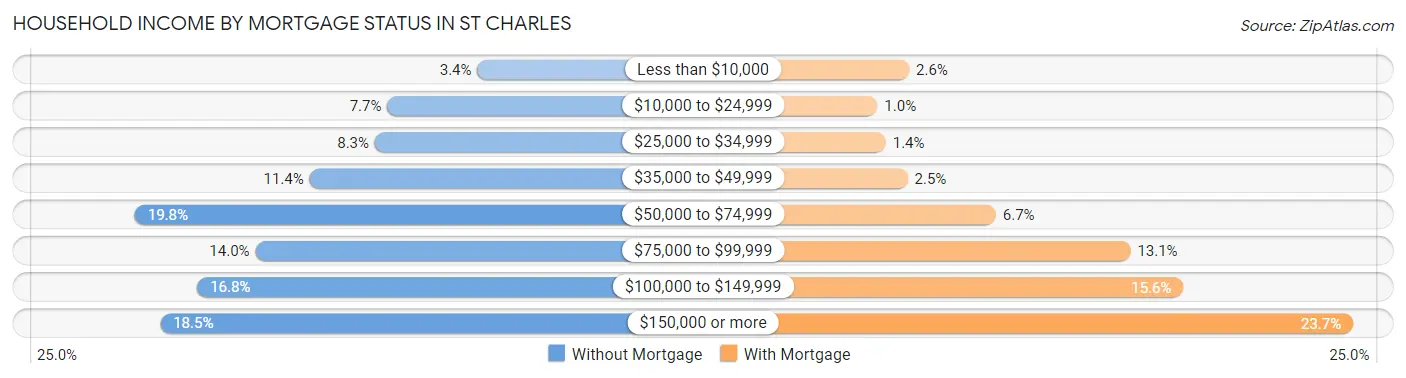
| Household Income | Without Mortgage | With Mortgage |
| Less than $10,000 | 233 (3.4%) | 334 (2.5%) |
| $10,000 to $24,999 | 523 (7.7%) | 137 (1.0%) |
| $25,000 to $34,999 | 563 (8.3%) | 189 (1.4%) |
| $35,000 to $49,999 | 773 (11.4%) | 325 (2.5%) |
| $50,000 to $74,999 | 1,336 (19.8%) | 876 (6.7%) |
| $75,000 to $99,999 | 948 (14.0%) | 1,717 (13.1%) |
| $100,000 to $149,999 | 1,135 (16.8%) | 2,048 (15.6%) |
| $150,000 or more | 1,254 (18.5%) | 3,107 (23.7%) |
| Total | 6,765 (100.0%) | 13,116 (100.0%) |
Property Value to Household Income Ratio in St Charles
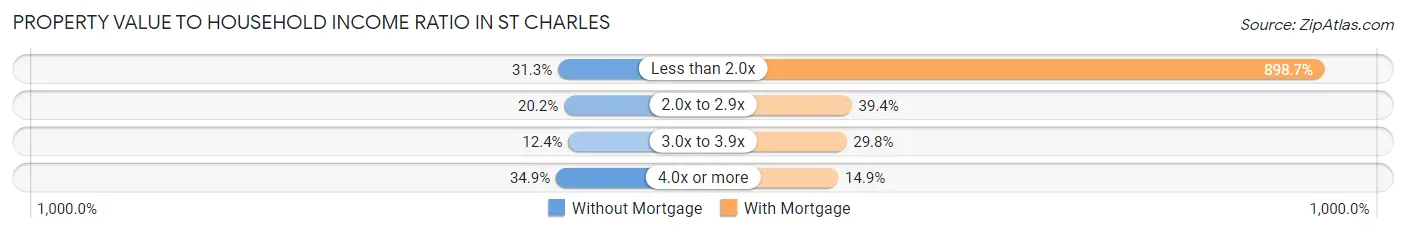
| Value-to-Income Ratio | Without Mortgage | With Mortgage |
| Less than 2.0x | 2,116 (31.3%) | 117,872 (898.7%) |
| 2.0x to 2.9x | 1,368 (20.2%) | 5,167 (39.4%) |
| 3.0x to 3.9x | 839 (12.4%) | 3,902 (29.7%) |
| 4.0x or more | 2,364 (34.9%) | 1,950 (14.9%) |
| Total | 6,765 (100.0%) | 13,116 (100.0%) |
Real Estate Taxes by Mortgage Status in St Charles
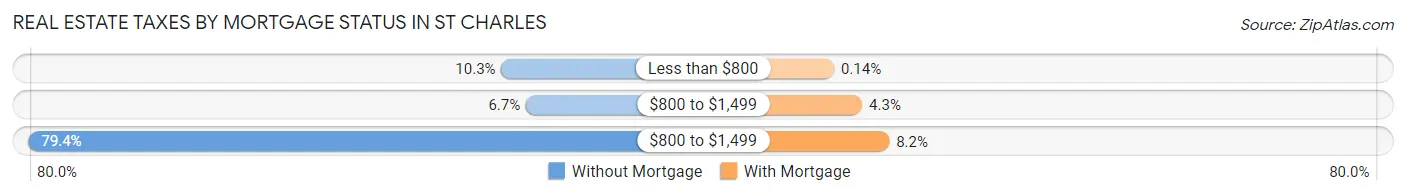
| Property Taxes | Without Mortgage | With Mortgage |
| Less than $800 | 699 (10.3%) | 18 (0.1%) |
| $800 to $1,499 | 455 (6.7%) | 557 (4.3%) |
| $800 to $1,499 | 5,374 (79.4%) | 1,077 (8.2%) |
| Total | 6,765 (100.0%) | 13,116 (100.0%) |
Health & Disability in St Charles
Health Insurance Coverage by Age in St Charles
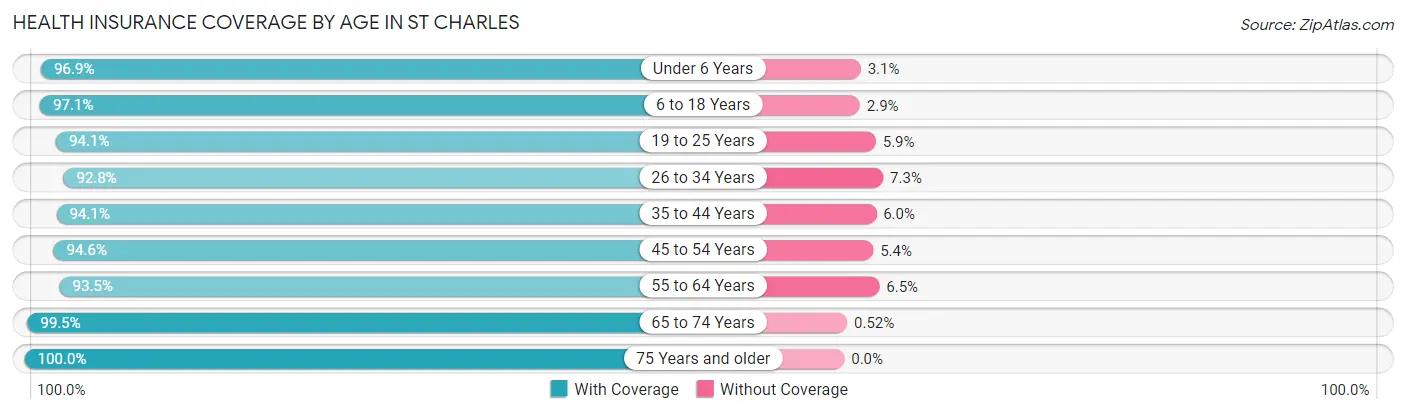
| Age Bracket | With Coverage | Without Coverage |
| Under 6 Years | 4,215 (96.9%) | 133 (3.1%) |
| 6 to 18 Years | 8,839 (97.1%) | 264 (2.9%) |
| 19 to 25 Years | 8,642 (94.1%) | 539 (5.9%) |
| 26 to 34 Years | 8,914 (92.7%) | 697 (7.2%) |
| 35 to 44 Years | 7,811 (94.1%) | 494 (5.9%) |
| 45 to 54 Years | 6,645 (94.6%) | 379 (5.4%) |
| 55 to 64 Years | 9,353 (93.5%) | 655 (6.5%) |
| 65 to 74 Years | 7,223 (99.5%) | 38 (0.5%) |
| 75 Years and older | 4,903 (100.0%) | 0 (0.0%) |
| Total | 66,545 (95.4%) | 3,199 (4.6%) |
Health Insurance Coverage by Citizenship Status in St Charles
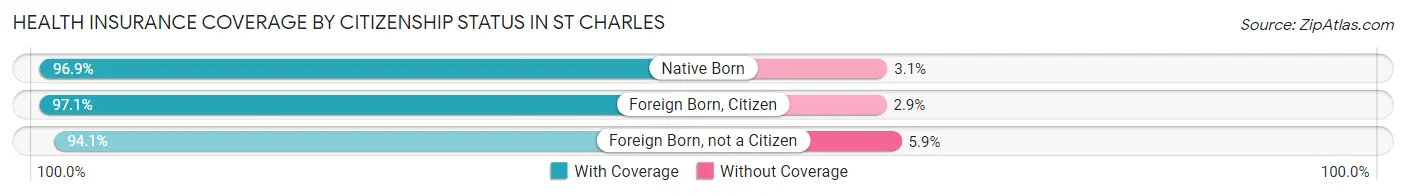
| Citizenship Status | With Coverage | Without Coverage |
| Native Born | 4,215 (96.9%) | 133 (3.1%) |
| Foreign Born, Citizen | 8,839 (97.1%) | 264 (2.9%) |
| Foreign Born, not a Citizen | 8,642 (94.1%) | 539 (5.9%) |
Health Insurance Coverage by Household Income in St Charles
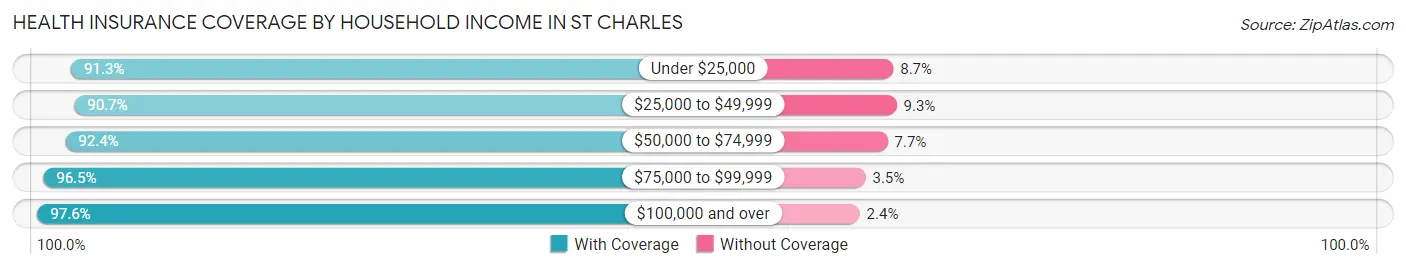
| Household Income | With Coverage | Without Coverage |
| Under $25,000 | 3,626 (91.3%) | 346 (8.7%) |
| $25,000 to $49,999 | 7,906 (90.7%) | 814 (9.3%) |
| $50,000 to $74,999 | 9,595 (92.3%) | 795 (7.6%) |
| $75,000 to $99,999 | 9,301 (96.5%) | 338 (3.5%) |
| $100,000 and over | 31,827 (97.6%) | 786 (2.4%) |
Public vs Private Health Insurance Coverage by Age in St Charles
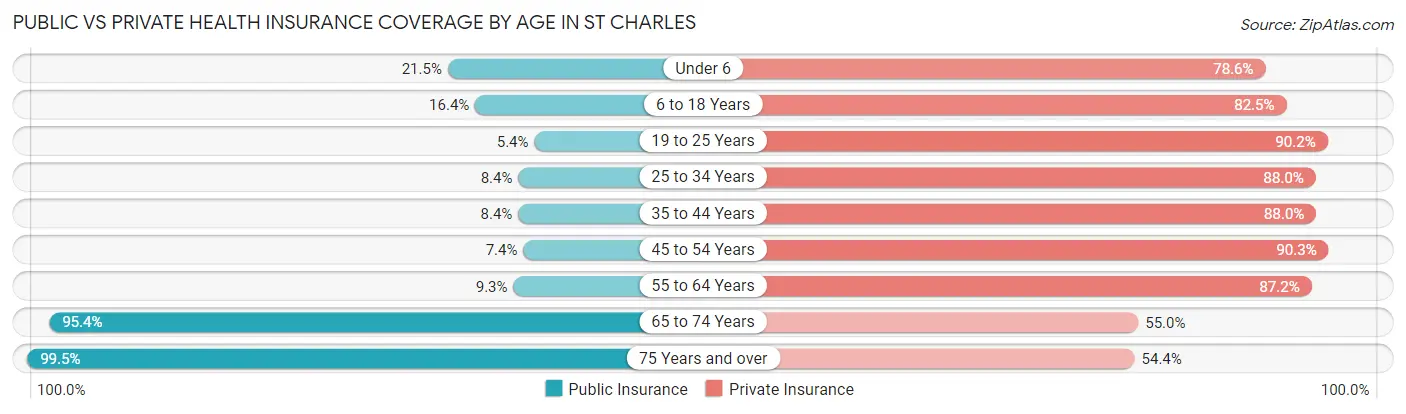
| Age Bracket | Public Insurance | Private Insurance |
| Under 6 | 933 (21.5%) | 3,418 (78.6%) |
| 6 to 18 Years | 1,490 (16.4%) | 7,510 (82.5%) |
| 19 to 25 Years | 494 (5.4%) | 8,277 (90.1%) |
| 25 to 34 Years | 803 (8.4%) | 8,453 (87.9%) |
| 35 to 44 Years | 697 (8.4%) | 7,312 (88.0%) |
| 45 to 54 Years | 522 (7.4%) | 6,345 (90.3%) |
| 55 to 64 Years | 929 (9.3%) | 8,726 (87.2%) |
| 65 to 74 Years | 6,929 (95.4%) | 3,996 (55.0%) |
| 75 Years and over | 4,879 (99.5%) | 2,665 (54.3%) |
| Total | 17,676 (25.3%) | 56,702 (81.3%) |
Disability Status by Sex by Age in St Charles
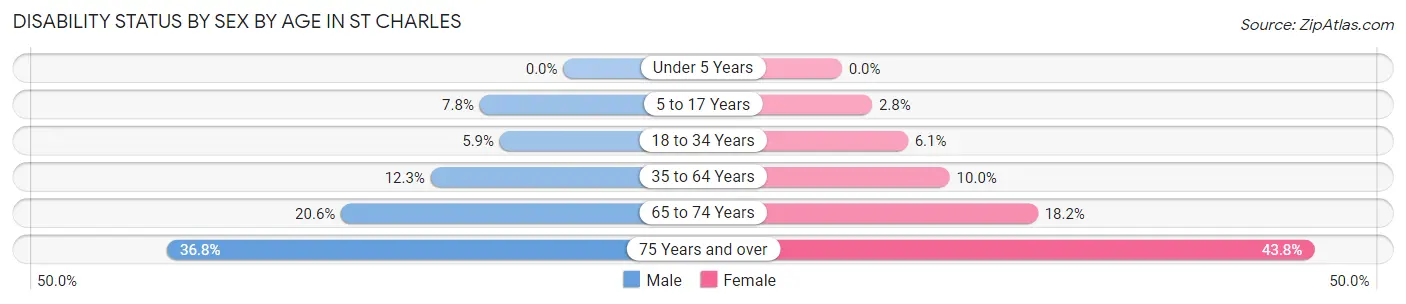
| Age Bracket | Male | Female |
| Under 5 Years | 0 (0.0%) | 0 (0.0%) |
| 5 to 17 Years | 357 (7.8%) | 120 (2.8%) |
| 18 to 34 Years | 590 (5.9%) | 599 (6.1%) |
| 35 to 64 Years | 1,593 (12.3%) | 1,241 (10.0%) |
| 65 to 74 Years | 685 (20.6%) | 716 (18.2%) |
| 75 Years and over | 715 (36.8%) | 1,297 (43.8%) |
Disability Class by Sex by Age in St Charles
Disability Class: Hearing Difficulty
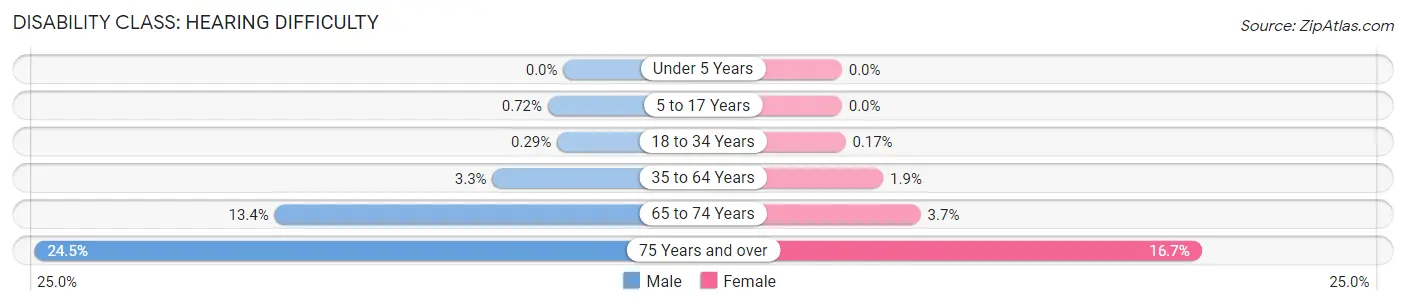
| Age Bracket | Male | Female |
| Under 5 Years | 0 (0.0%) | 0 (0.0%) |
| 5 to 17 Years | 33 (0.7%) | 0 (0.0%) |
| 18 to 34 Years | 29 (0.3%) | 17 (0.2%) |
| 35 to 64 Years | 425 (3.3%) | 238 (1.9%) |
| 65 to 74 Years | 445 (13.4%) | 144 (3.7%) |
| 75 Years and over | 477 (24.5%) | 494 (16.7%) |
Disability Class: Vision Difficulty
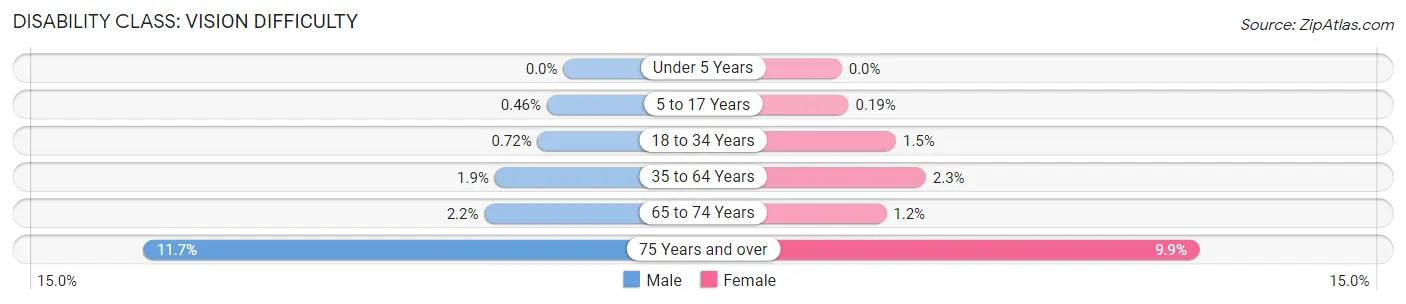
| Age Bracket | Male | Female |
| Under 5 Years | 0 (0.0%) | 0 (0.0%) |
| 5 to 17 Years | 21 (0.5%) | 8 (0.2%) |
| 18 to 34 Years | 72 (0.7%) | 148 (1.5%) |
| 35 to 64 Years | 247 (1.9%) | 290 (2.3%) |
| 65 to 74 Years | 73 (2.2%) | 49 (1.2%) |
| 75 Years and over | 227 (11.7%) | 294 (9.9%) |
Disability Class: Cognitive Difficulty
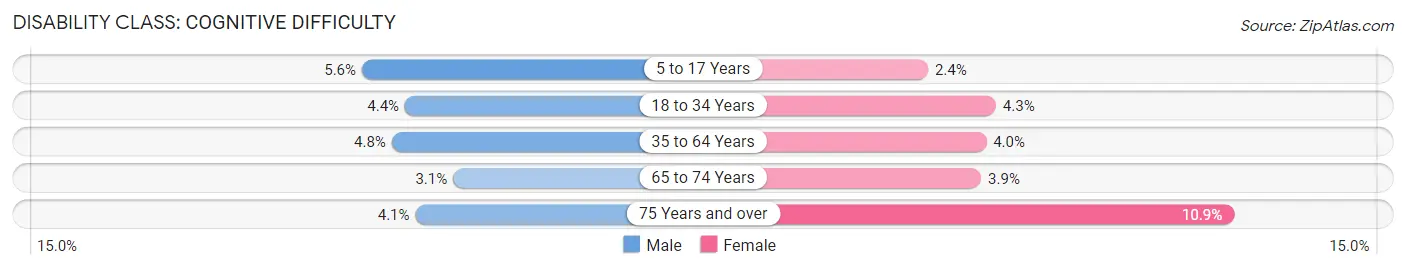
| Age Bracket | Male | Female |
| 5 to 17 Years | 258 (5.6%) | 103 (2.4%) |
| 18 to 34 Years | 442 (4.4%) | 420 (4.3%) |
| 35 to 64 Years | 619 (4.8%) | 498 (4.0%) |
| 65 to 74 Years | 102 (3.1%) | 153 (3.9%) |
| 75 Years and over | 80 (4.1%) | 323 (10.9%) |
Disability Class: Ambulatory Difficulty
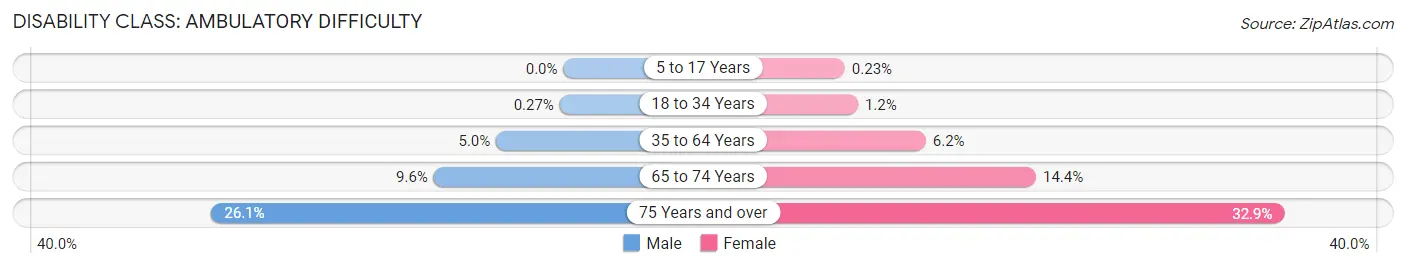
| Age Bracket | Male | Female |
| 5 to 17 Years | 0 (0.0%) | 10 (0.2%) |
| 18 to 34 Years | 27 (0.3%) | 118 (1.2%) |
| 35 to 64 Years | 645 (5.0%) | 774 (6.2%) |
| 65 to 74 Years | 320 (9.6%) | 568 (14.4%) |
| 75 Years and over | 508 (26.1%) | 972 (32.9%) |
Disability Class: Self-Care Difficulty
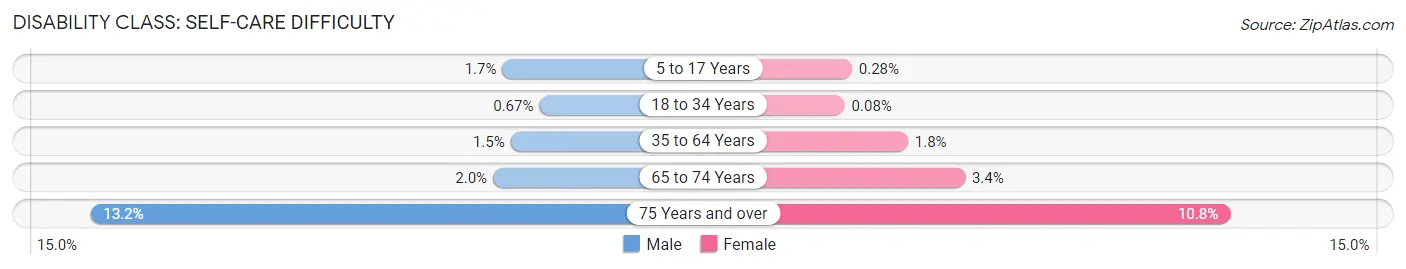
| Age Bracket | Male | Female |
| 5 to 17 Years | 78 (1.7%) | 12 (0.3%) |
| 18 to 34 Years | 67 (0.7%) | 8 (0.1%) |
| 35 to 64 Years | 190 (1.5%) | 228 (1.8%) |
| 65 to 74 Years | 65 (2.0%) | 135 (3.4%) |
| 75 Years and over | 256 (13.2%) | 320 (10.8%) |
Technology Access in St Charles
Computing Device Access in St Charles
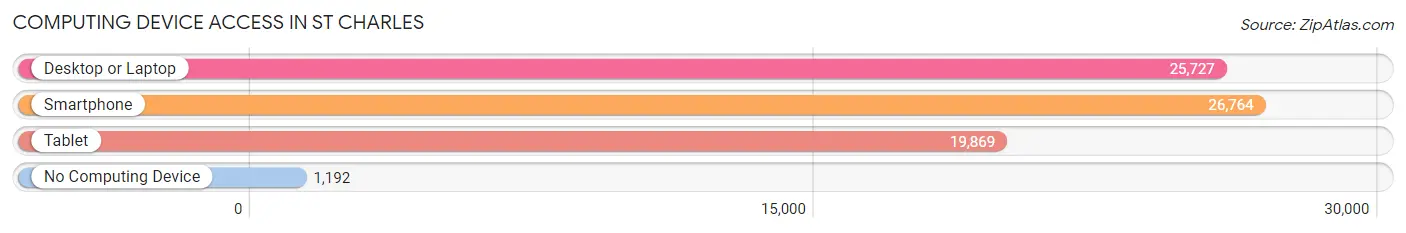
| Device Type | # Households | % Households |
| Desktop or Laptop | 25,727 | 86.5% |
| Smartphone | 26,764 | 89.9% |
| Tablet | 19,869 | 66.8% |
| No Computing Device | 1,192 | 4.0% |
| Total | 29,760 | 100.0% |
Internet Access in St Charles
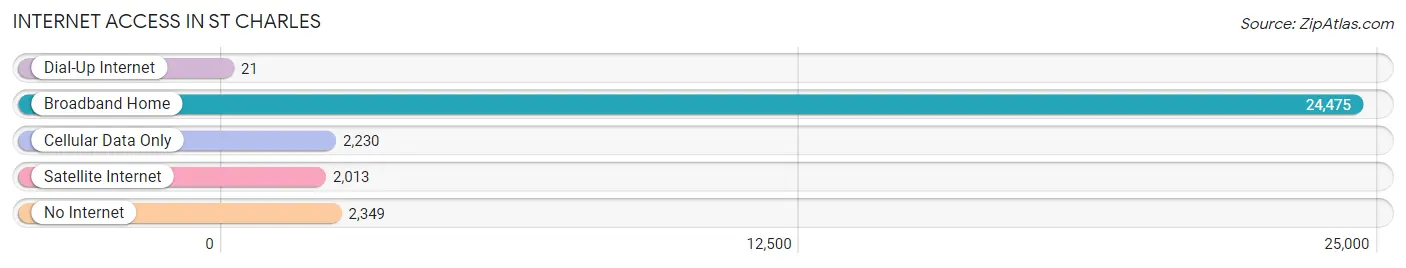
| Internet Type | # Households | % Households |
| Dial-Up Internet | 21 | 0.1% |
| Broadband Home | 24,475 | 82.2% |
| Cellular Data Only | 2,230 | 7.5% |
| Satellite Internet | 2,013 | 6.8% |
| No Internet | 2,349 | 7.9% |
| Total | 29,760 | 100.0% |
St Charles Summary
St. Charles, Missouri is a city located in St. Charles County, Missouri, United States. It is located on the Missouri River, just west of St. Louis. The city is part of the Greater St. Louis metropolitan area and is the county seat of St. Charles County. As of the 2010 census, the city had a population of 65,794, making it the ninth-largest city in Missouri.
History
The area that is now St. Charles was first settled by French-Canadian fur traders in the late 1700s. The city was founded in 1769 by Louis Blanchette, a French-Canadian fur trader. The city was named after Charles Gratiot, a French-Canadian military officer who was stationed in the area.
In 1804, the Lewis and Clark Expedition passed through the area, and in 1808, the first steamboat arrived in St. Charles. The city was incorporated in 1809, and by 1821, it had become the county seat of St. Charles County.
In the mid-1800s, St. Charles was a major port on the Missouri River, and it was a major stop on the Pony Express. During the Civil War, the city was the site of several battles, including the Battle of St. Charles.
Geography
St. Charles is located in St. Charles County, Missouri, at the confluence of the Missouri and Mississippi Rivers. The city has a total area of 24.2 square miles, of which 23.9 square miles is land and 0.3 square miles is water.
The city is located in the Central Lowland region of the United States, and is part of the larger Midwestern United States. The city is located in the humid continental climate zone, and has hot, humid summers and cold, snowy winters.
Economy
St. Charles is a major economic center in the St. Louis metropolitan area. The city is home to several major employers, including Boeing, MasterCard, and Monsanto. The city is also home to several major medical centers, including St. Charles Hospital and Mercy Hospital.
The city is also home to several major shopping centers, including the St. Charles Towne Center and the St. Charles Mall. The city is also home to several major attractions, including the St. Charles Historic District and the Lewis and Clark Boat House and Nature Center.
Demographics
As of the 2010 census, the city had a population of 65,794. The racial makeup of the city was 87.2% White, 6.3% African American, 0.4% Native American, 2.2% Asian, 0.1% Pacific Islander, 1.7% from other races, and 2.1% from two or more races. Hispanic or Latino of any race were 4.3% of the population.
The median income for a household in the city was $50,945, and the median income for a family was $62,917. The per capita income for the city was $25,945. About 6.2% of families and 8.3% of the population were below the poverty line, including 11.2% of those under age 18 and 6.2% of those age 65 or over.
Common Questions
What is Per Capita Income in St Charles?
Per Capita income in St Charles is $47,196.
What is the Median Family Income in St Charles?
Median Family Income in St Charles is $106,426.
What is the Median Household income in St Charles?
Median Household Income in St Charles is $83,589.
What is Income or Wage Gap in St Charles?
Income or Wage Gap in St Charles is 25.6%.
Women in St Charles earn 74.4 cents for every dollar earned by a man.
What is Inequality or Gini Index in St Charles?
Inequality or Gini Index in St Charles is 0.44.
What is the Total Population of St Charles?
Total Population of St Charles is 70,687.
What is the Total Male Population of St Charles?
Total Male Population of St Charles is 34,763.
What is the Total Female Population of St Charles?
Total Female Population of St Charles is 35,924.
What is the Ratio of Males per 100 Females in St Charles?
There are 96.77 Males per 100 Females in St Charles.
What is the Ratio of Females per 100 Males in St Charles?
There are 103.34 Females per 100 Males in St Charles.
What is the Median Population Age in St Charles?
Median Population Age in St Charles is 38.2 Years.
What is the Average Family Size in St Charles
Average Family Size in St Charles is 2.8 People.
What is the Average Household Size in St Charles
Average Household Size in St Charles is 2.2 People.
How Large is the Labor Force in St Charles?
There are 39,087 People in the Labor Forcein in St Charles.
What is the Percentage of People in the Labor Force in St Charles?
65.7% of People are in the Labor Force in St Charles.
What is the Unemployment Rate in St Charles?
Unemployment Rate in St Charles is 2.5%.