Des Peres, MO Map & Demographics
Des Peres Map
Des Peres Overview
$105,354
PER CAPITA INCOME
$234,632
AVG FAMILY INCOME
$214,810
AVG HOUSEHOLD INCOME
54.7%
WAGE / INCOME GAP [ % ]
45.3¢/ $1
WAGE / INCOME GAP [ $ ]
0.45
INEQUALITY / GINI INDEX
9,140
TOTAL POPULATION
4,491
MALE POPULATION
4,649
FEMALE POPULATION
96.60
MALES / 100 FEMALES
103.52
FEMALES / 100 MALES
42.8
MEDIAN AGE
3.0
AVG FAMILY SIZE
2.8
AVG HOUSEHOLD SIZE
4,439
LABOR FORCE [ PEOPLE ]
64.6%
PERCENT IN LABOR FORCE
0.5%
UNEMPLOYMENT RATE
Des Peres Area Codes
Income in Des Peres
Income Overview in Des Peres
Per Capita Income in Des Peres is $105,354, while median incomes of families and households are $234,632 and $214,810 respectively.
| Characteristic | Number | Measure |
| Per Capita Income | 9,140 | $105,354 |
| Median Family Income | 2,785 | $234,632 |
| Mean Family Income | 2,785 | $325,057 |
| Median Household Income | 3,169 | $214,810 |
| Mean Household Income | 3,169 | $300,652 |
| Income Deficit | 2,785 | $0 |
| Wage / Income Gap (%) | 9,140 | 54.69% |
| Wage / Income Gap ($) | 9,140 | 45.31¢ per $1 |
| Gini / Inequality Index | 9,140 | 0.45 |
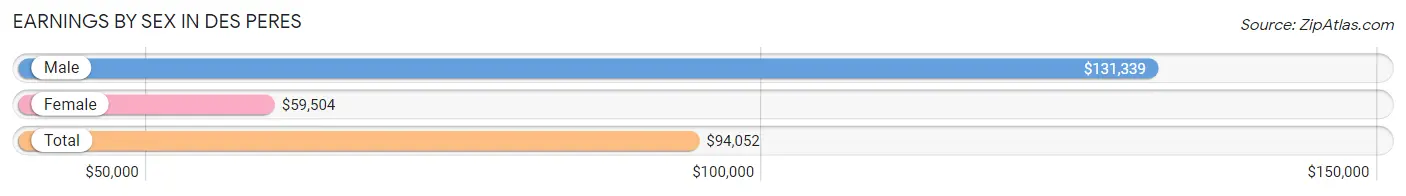
Earnings by Sex in Des Peres
Average Earnings in Des Peres are $94,052, $131,339 for men and $59,504 for women, a difference of 54.7%.
| Sex | Number | Average Earnings |
| Male | 2,732 (57.3%) | $131,339 |
| Female | 2,033 (42.7%) | $59,504 |
| Total | 4,765 (100.0%) | $94,052 |
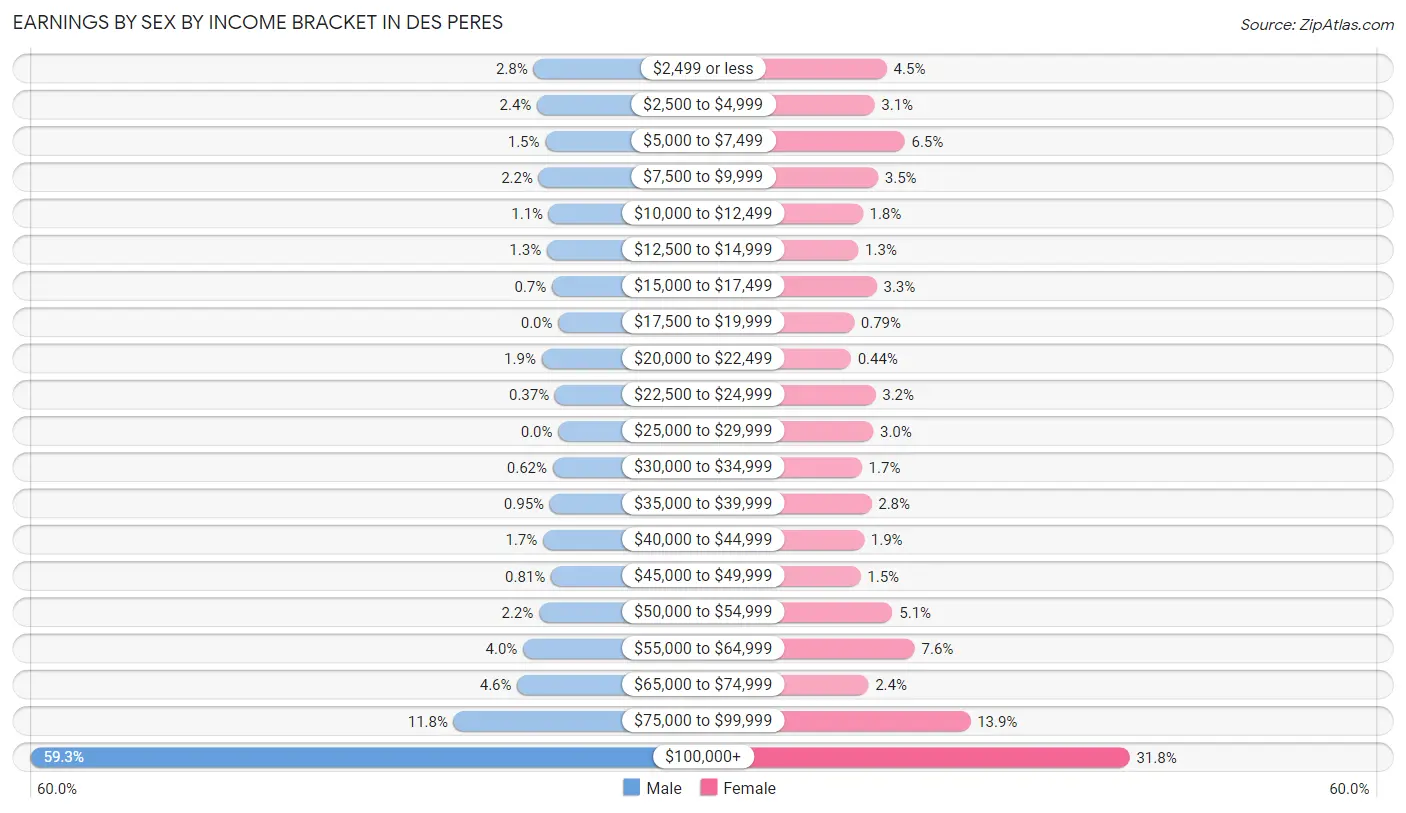
Earnings by Sex by Income Bracket in Des Peres
The most common earnings brackets in Des Peres are $100,000+ for men (1,621 | 59.3%) and $100,000+ for women (646 | 31.8%).
| Income | Male | Female |
| $2,499 or less | 76 (2.8%) | 91 (4.5%) |
| $2,500 to $4,999 | 65 (2.4%) | 63 (3.1%) |
| $5,000 to $7,499 | 40 (1.5%) | 132 (6.5%) |
| $7,500 to $9,999 | 60 (2.2%) | 71 (3.5%) |
| $10,000 to $12,499 | 29 (1.1%) | 36 (1.8%) |
| $12,500 to $14,999 | 35 (1.3%) | 26 (1.3%) |
| $15,000 to $17,499 | 19 (0.7%) | 68 (3.3%) |
| $17,500 to $19,999 | 0 (0.0%) | 16 (0.8%) |
| $20,000 to $22,499 | 51 (1.9%) | 9 (0.4%) |
| $22,500 to $24,999 | 10 (0.4%) | 65 (3.2%) |
| $25,000 to $29,999 | 0 (0.0%) | 60 (2.9%) |
| $30,000 to $34,999 | 17 (0.6%) | 34 (1.7%) |
| $35,000 to $39,999 | 26 (0.9%) | 56 (2.8%) |
| $40,000 to $44,999 | 47 (1.7%) | 39 (1.9%) |
| $45,000 to $49,999 | 22 (0.8%) | 31 (1.5%) |
| $50,000 to $54,999 | 59 (2.2%) | 104 (5.1%) |
| $55,000 to $64,999 | 108 (4.0%) | 155 (7.6%) |
| $65,000 to $74,999 | 126 (4.6%) | 49 (2.4%) |
| $75,000 to $99,999 | 321 (11.7%) | 282 (13.9%) |
| $100,000+ | 1,621 (59.3%) | 646 (31.8%) |
| Total | 2,732 (100.0%) | 2,033 (100.0%) |
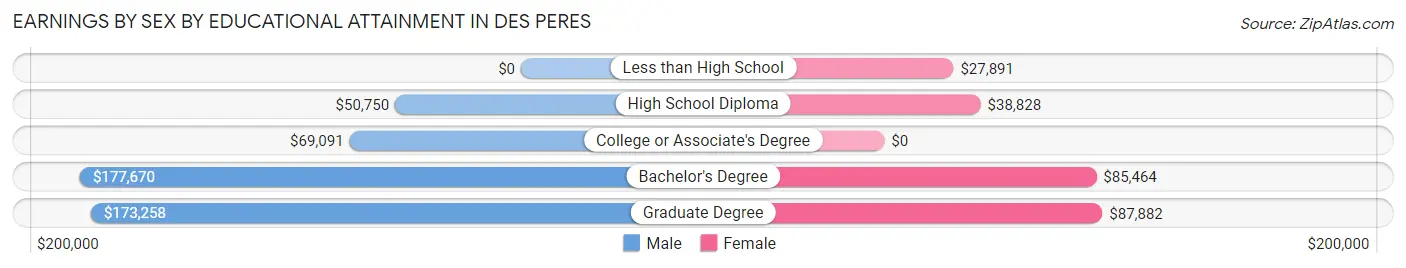
Earnings by Sex by Educational Attainment in Des Peres
Average earnings in Des Peres are $153,533 for men and $75,072 for women, a difference of 51.1%. Men with an educational attainment of bachelor's degree enjoy the highest average annual earnings of $177,670, while those with high school diploma education earn the least with $50,750. Women with an educational attainment of graduate degree earn the most with the average annual earnings of $87,882, while those with less than high school education have the smallest earnings of $27,891.
| Educational Attainment | Male Income | Female Income |
| Less than High School | - | - |
| High School Diploma | $50,750 | $38,828 |
| College or Associate's Degree | $69,091 | $0 |
| Bachelor's Degree | $177,670 | $85,464 |
| Graduate Degree | $173,258 | $87,882 |
| Total | $153,533 | $75,072 |
Family Income in Des Peres
Family Income Brackets in Des Peres
According to the Des Peres family income data, there are 1,621 families falling into the $200,000+ income range, which is the most common income bracket and makes up 58.2% of all families.
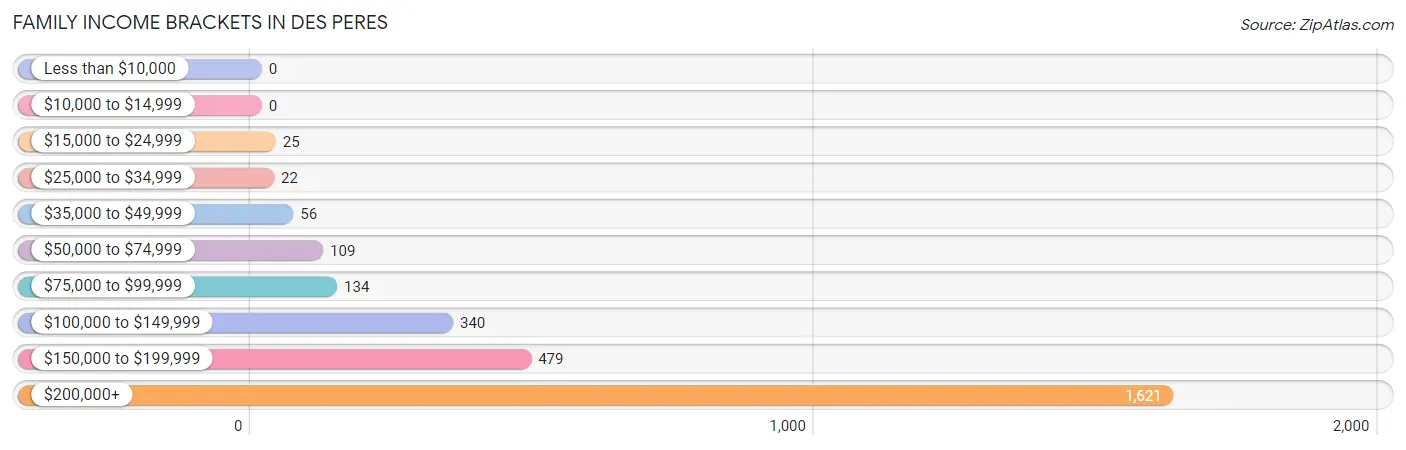
| Income Bracket | # Families | % Families |
| Less than $10,000 | 0 | 0.0% |
| $10,000 to $14,999 | 0 | 0.0% |
| $15,000 to $24,999 | 25 | 0.9% |
| $25,000 to $34,999 | 22 | 0.8% |
| $35,000 to $49,999 | 56 | 2.0% |
| $50,000 to $74,999 | 109 | 3.9% |
| $75,000 to $99,999 | 134 | 4.8% |
| $100,000 to $149,999 | 340 | 12.2% |
| $150,000 to $199,999 | 479 | 17.2% |
| $200,000+ | 1,621 | 58.2% |
Family Income by Famaliy Size in Des Peres
4-person families (753 | 27.0%) account for the highest median family income in Des Peres with $250,001 per family, while 2-person families (1,183 | 42.5%) have the highest median income of $79,018 per family member.
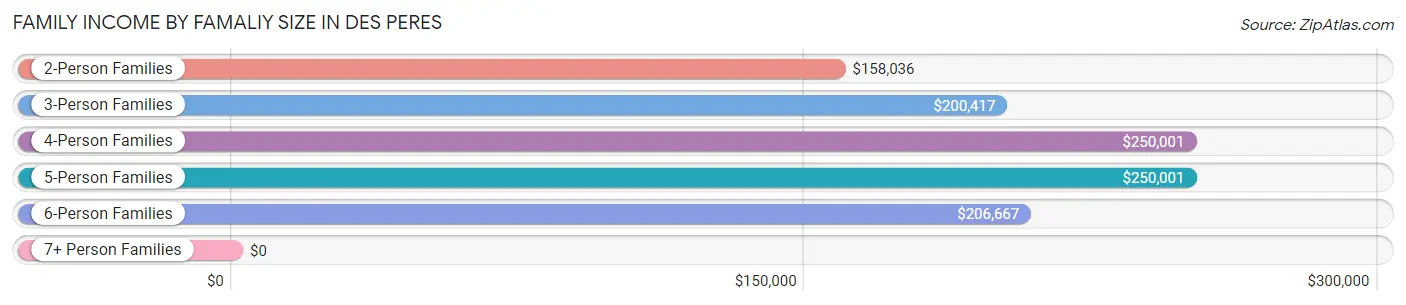
| Income Bracket | # Families | Median Income |
| 2-Person Families | 1,183 (42.5%) | $158,036 |
| 3-Person Families | 550 (19.8%) | $200,417 |
| 4-Person Families | 753 (27.0%) | $250,001 |
| 5-Person Families | 239 (8.6%) | $250,001 |
| 6-Person Families | 38 (1.4%) | $206,667 |
| 7+ Person Families | 22 (0.8%) | $0 |
| Total | 2,785 (100.0%) | $234,632 |
Family Income by Number of Earners in Des Peres
The median family income in Des Peres is $234,632, with families comprising 1 earner (856) having the highest median family income of $250,001, while families with no earners (282) have the lowest median family income of $85,000, accounting for 30.7% and 10.1% of families, respectively.
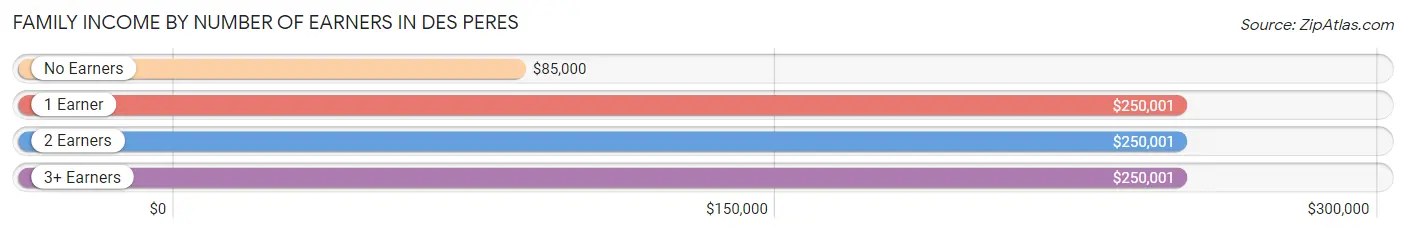
| Number of Earners | # Families | Median Income |
| No Earners | 282 (10.1%) | $85,000 |
| 1 Earner | 856 (30.7%) | $250,001 |
| 2 Earners | 1,389 (49.9%) | $250,001 |
| 3+ Earners | 258 (9.3%) | $250,001 |
| Total | 2,785 (100.0%) | $234,632 |
Household Income in Des Peres
Household Income Brackets in Des Peres
With 1,683 households falling in the category, the $200,000+ income range is the most frequent in Des Peres, accounting for 53.1% of all households. In contrast, only 10 households (0.3%) fall into the $10,000 to $14,999 income bracket, making it the least populous group.
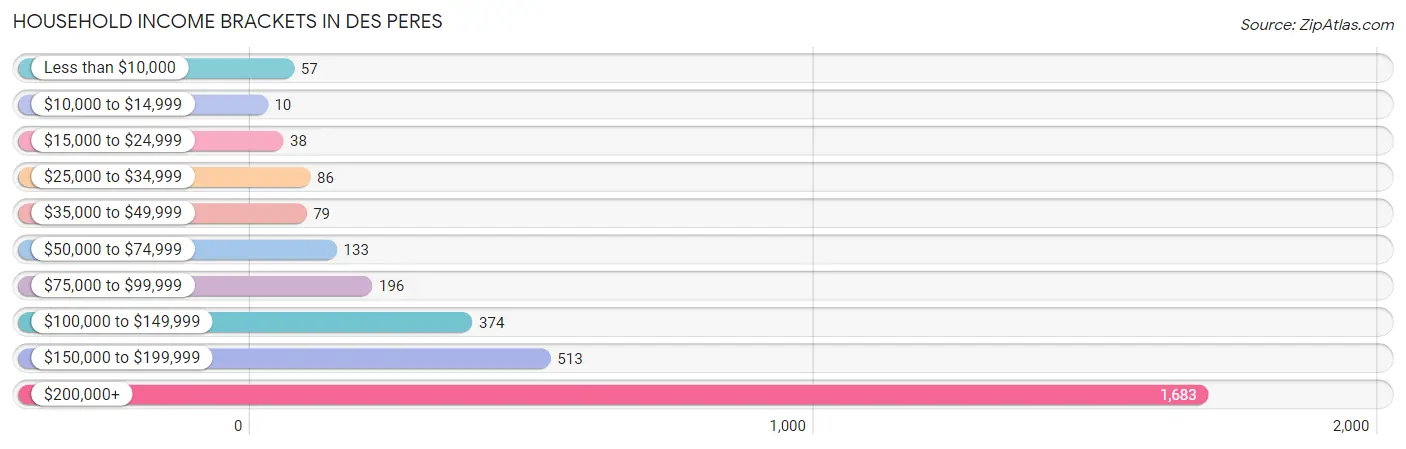
| Income Bracket | # Households | % Households |
| Less than $10,000 | 57 | 1.8% |
| $10,000 to $14,999 | 10 | 0.3% |
| $15,000 to $24,999 | 38 | 1.2% |
| $25,000 to $34,999 | 86 | 2.7% |
| $35,000 to $49,999 | 79 | 2.5% |
| $50,000 to $74,999 | 133 | 4.2% |
| $75,000 to $99,999 | 196 | 6.2% |
| $100,000 to $149,999 | 374 | 11.8% |
| $150,000 to $199,999 | 513 | 16.2% |
| $200,000+ | 1,683 | 53.1% |
Household Income by Householder Age in Des Peres
The median household income in Des Peres is $214,810, with the highest median household income of $250,001 found in the 25 to 44 years age bracket for the primary householder. A total of 910 households (28.7%) fall into this category. Meanwhile, the 15 to 24 years age bracket for the primary householder has the lowest median household income of $0, with 12 households (0.4%) in this group.
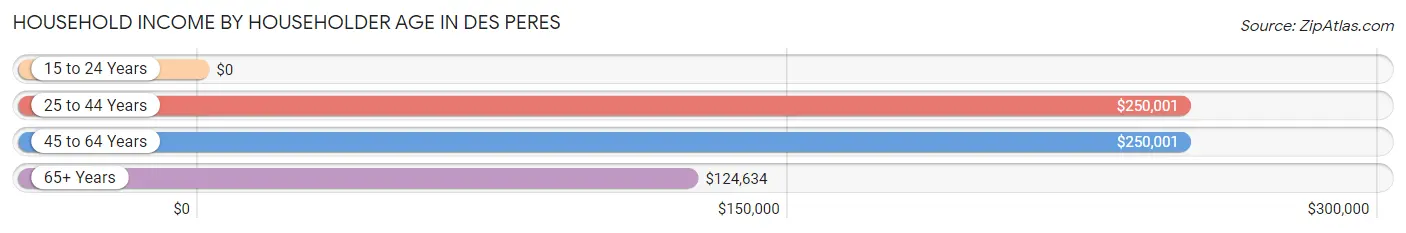
| Income Bracket | # Households | Median Income |
| 15 to 24 Years | 12 (0.4%) | $0 |
| 25 to 44 Years | 910 (28.7%) | $250,001 |
| 45 to 64 Years | 1,233 (38.9%) | $250,001 |
| 65+ Years | 1,014 (32.0%) | $124,634 |
| Total | 3,169 (100.0%) | $214,810 |
Poverty in Des Peres
Income Below Poverty by Sex and Age in Des Peres
With 0.8% poverty level for males and 2.2% for females among the residents of Des Peres, 25 to 34 year old males and 16 and 17 year old females are the most vulnerable to poverty, with 14 males (4.8%) and 11 females (16.4%) in their respective age groups living below the poverty level.
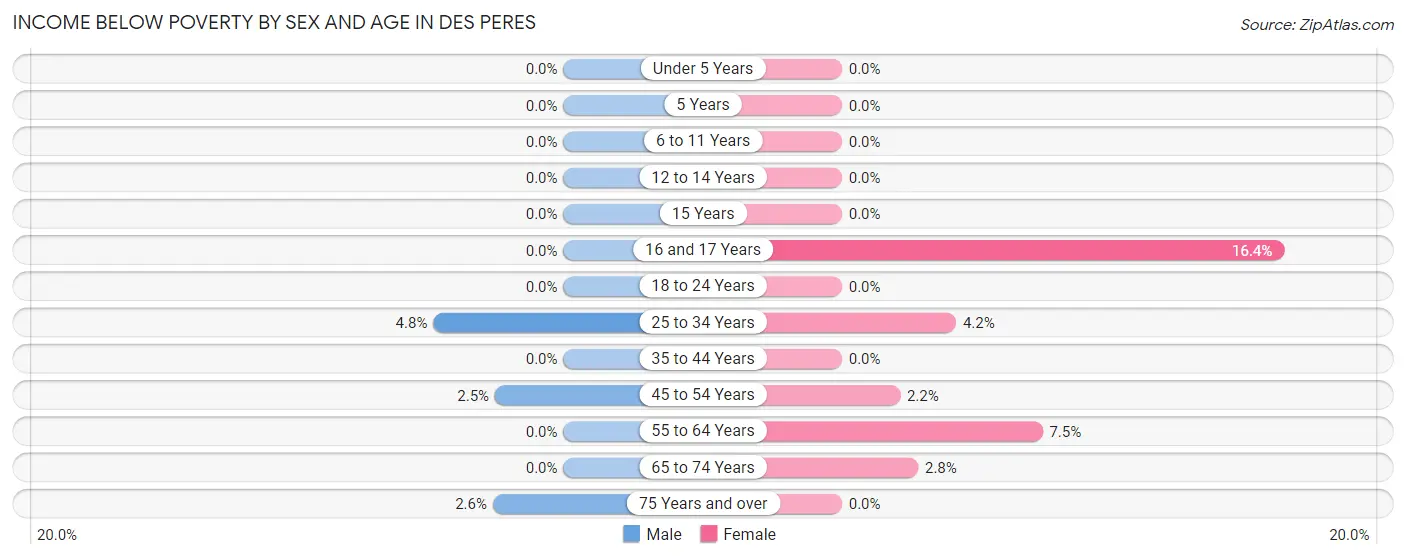
| Age Bracket | Male | Female |
| Under 5 Years | 0 (0.0%) | 0 (0.0%) |
| 5 Years | 0 (0.0%) | 0 (0.0%) |
| 6 to 11 Years | 0 (0.0%) | 0 (0.0%) |
| 12 to 14 Years | 0 (0.0%) | 0 (0.0%) |
| 15 Years | 0 (0.0%) | 0 (0.0%) |
| 16 and 17 Years | 0 (0.0%) | 11 (16.4%) |
| 18 to 24 Years | 0 (0.0%) | 0 (0.0%) |
| 25 to 34 Years | 14 (4.8%) | 12 (4.2%) |
| 35 to 44 Years | 0 (0.0%) | 0 (0.0%) |
| 45 to 54 Years | 12 (2.5%) | 11 (2.2%) |
| 55 to 64 Years | 0 (0.0%) | 49 (7.4%) |
| 65 to 74 Years | 0 (0.0%) | 19 (2.8%) |
| 75 Years and over | 9 (2.6%) | 0 (0.0%) |
| Total | 35 (0.8%) | 102 (2.2%) |
Income Above Poverty by Sex and Age in Des Peres
According to the poverty statistics in Des Peres, males aged under 5 years and females aged under 5 years are the age groups that are most secure financially, with 100.0% of males and 100.0% of females in these age groups living above the poverty line.
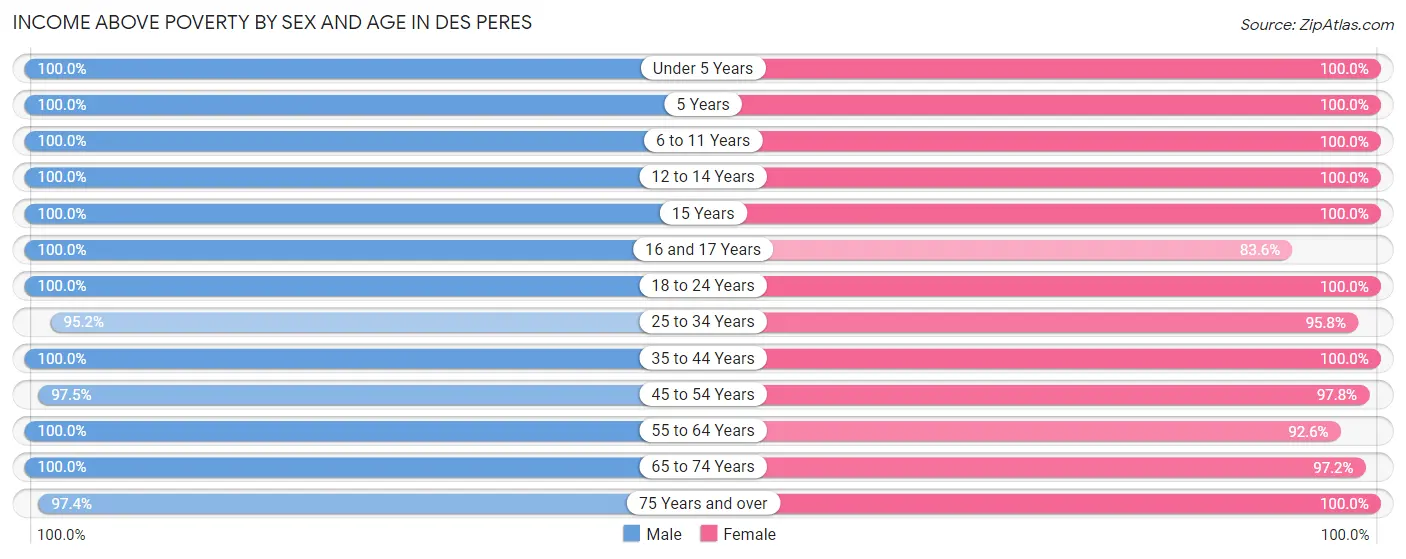
| Age Bracket | Male | Female |
| Under 5 Years | 245 (100.0%) | 295 (100.0%) |
| 5 Years | 67 (100.0%) | 44 (100.0%) |
| 6 to 11 Years | 401 (100.0%) | 566 (100.0%) |
| 12 to 14 Years | 281 (100.0%) | 204 (100.0%) |
| 15 Years | 112 (100.0%) | 16 (100.0%) |
| 16 and 17 Years | 164 (100.0%) | 56 (83.6%) |
| 18 to 24 Years | 166 (100.0%) | 192 (100.0%) |
| 25 to 34 Years | 276 (95.2%) | 271 (95.8%) |
| 35 to 44 Years | 696 (100.0%) | 698 (100.0%) |
| 45 to 54 Years | 460 (97.5%) | 499 (97.8%) |
| 55 to 64 Years | 642 (100.0%) | 609 (92.5%) |
| 65 to 74 Years | 515 (100.0%) | 652 (97.2%) |
| 75 Years and over | 335 (97.4%) | 325 (100.0%) |
| Total | 4,360 (99.2%) | 4,427 (97.8%) |
Income Below Poverty Among Married-Couple Families in Des Peres
The poverty statistics for married-couple families in Des Peres show that 0.6% or 16 of the total 2,649 families live below the poverty line. Families with 1 or 2 children have the highest poverty rate of 1.0%, comprising of 11 families. On the other hand, families with 3 or 4 children have the lowest poverty rate of 0.0%, which includes 0 families.
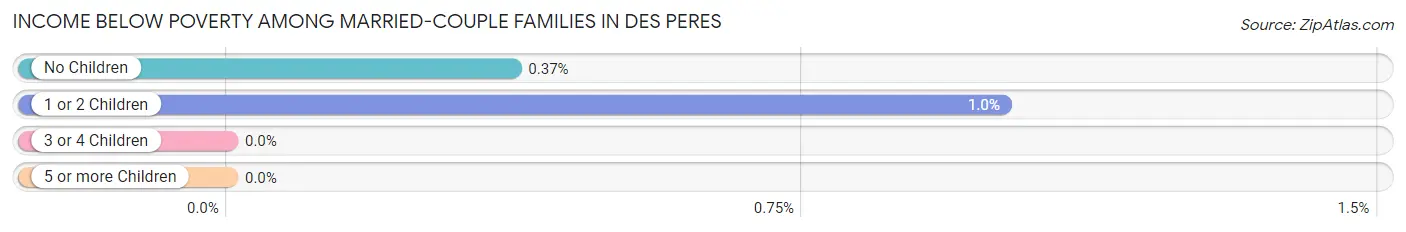
| Children | Above Poverty | Below Poverty |
| No Children | 1,344 (99.6%) | 5 (0.4%) |
| 1 or 2 Children | 1,078 (99.0%) | 11 (1.0%) |
| 3 or 4 Children | 201 (100.0%) | 0 (0.0%) |
| 5 or more Children | 10 (100.0%) | 0 (0.0%) |
| Total | 2,633 (99.4%) | 16 (0.6%) |
Income Below Poverty Among Single-Parent Households in Des Peres
| Children | Single Father | Single Mother |
| No Children | 0 (0.0%) | 0 (0.0%) |
| 1 or 2 Children | 0 (0.0%) | 0 (0.0%) |
| 3 or 4 Children | 0 (0.0%) | 0 (0.0%) |
| 5 or more Children | 0 (0.0%) | 0 (0.0%) |
| Total | 0 (0.0%) | 0 (0.0%) |
Income Below Poverty Among Married-Couple vs Single-Parent Households in Des Peres
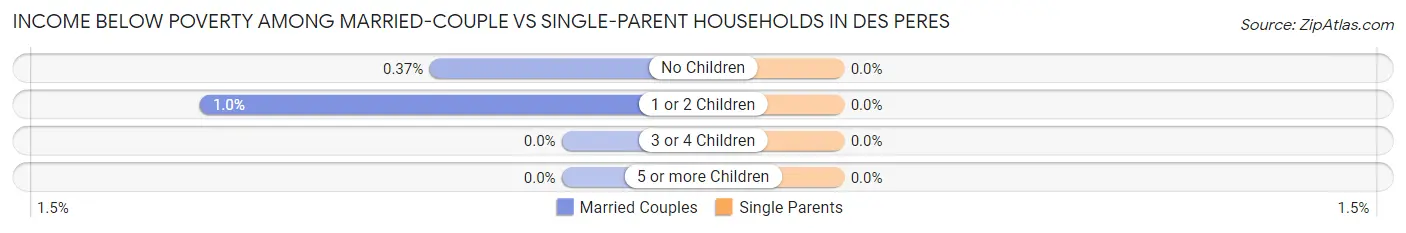
| Children | Married-Couple Families | Single-Parent Households |
| No Children | 5 (0.4%) | 0 (0.0%) |
| 1 or 2 Children | 11 (1.0%) | 0 (0.0%) |
| 3 or 4 Children | 0 (0.0%) | 0 (0.0%) |
| 5 or more Children | 0 (0.0%) | 0 (0.0%) |
| Total | 16 (0.6%) | 0 (0.0%) |
Race in Des Peres
The most populous races in Des Peres are White / Caucasian (8,524 | 93.3%), Two or more Races (338 | 3.7%), and Hispanic or Latino (198 | 2.2%).
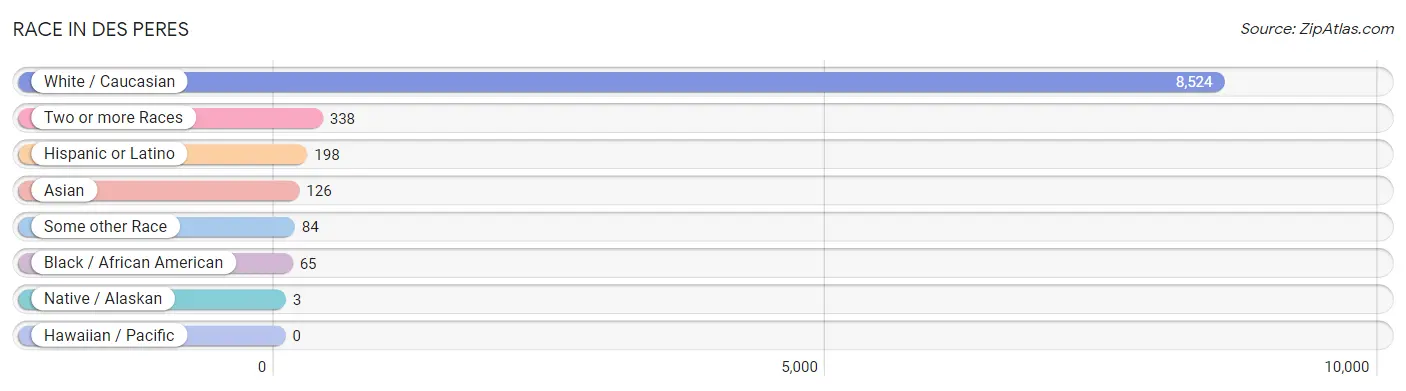
| Race | # Population | % Population |
| Asian | 126 | 1.4% |
| Black / African American | 65 | 0.7% |
| Hawaiian / Pacific | 0 | 0.0% |
| Hispanic or Latino | 198 | 2.2% |
| Native / Alaskan | 3 | 0.0% |
| White / Caucasian | 8,524 | 93.3% |
| Two or more Races | 338 | 3.7% |
| Some other Race | 84 | 0.9% |
| Total | 9,140 | 100.0% |
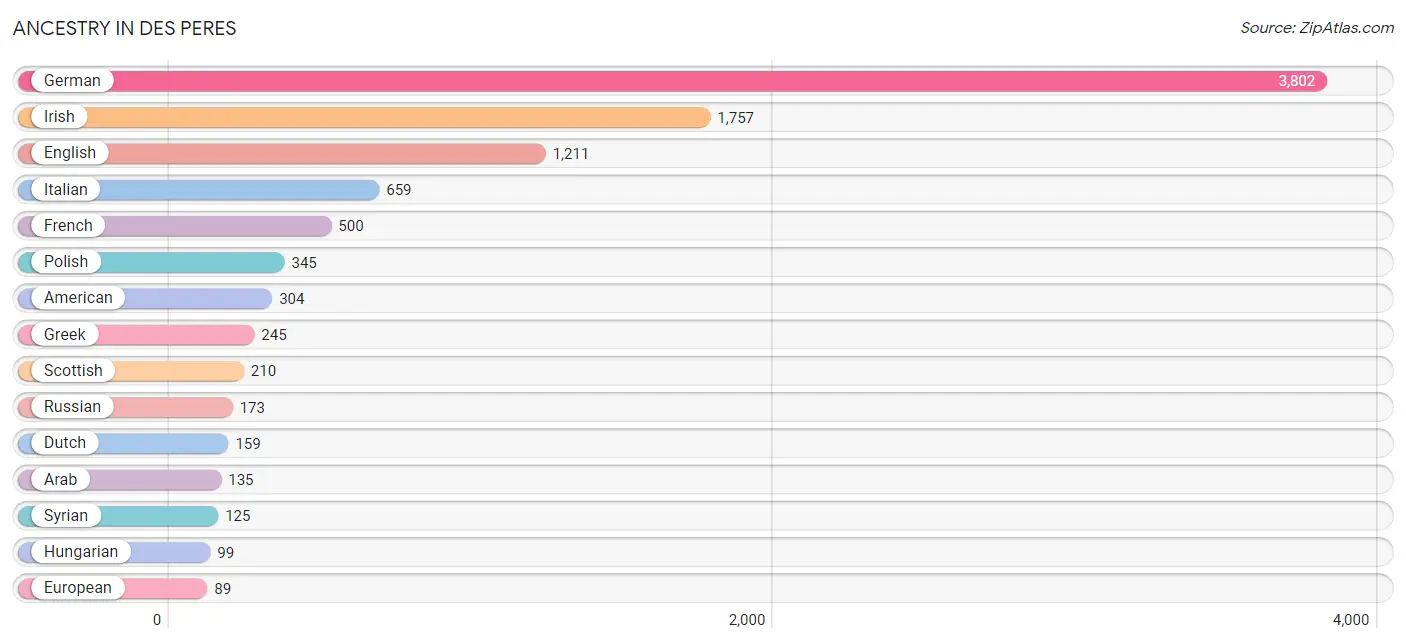
Ancestry in Des Peres
The most populous ancestries reported in Des Peres are German (3,802 | 41.6%), Irish (1,757 | 19.2%), English (1,211 | 13.3%), Italian (659 | 7.2%), and French (500 | 5.5%), together accounting for 86.7% of all Des Peres residents.
| Ancestry | # Population | % Population |
| Albanian | 37 | 0.4% |
| American | 304 | 3.3% |
| Arab | 135 | 1.5% |
| Austrian | 9 | 0.1% |
| Belgian | 14 | 0.2% |
| Bhutanese | 9 | 0.1% |
| British | 46 | 0.5% |
| Bulgarian | 10 | 0.1% |
| Canadian | 9 | 0.1% |
| Central American | 2 | 0.0% |
| Central American Indian | 23 | 0.3% |
| Chilean | 18 | 0.2% |
| Colombian | 23 | 0.3% |
| Croatian | 79 | 0.9% |
| Czech | 66 | 0.7% |
| Czechoslovakian | 31 | 0.3% |
| Danish | 37 | 0.4% |
| Dutch | 159 | 1.7% |
| Eastern European | 12 | 0.1% |
| English | 1,211 | 13.3% |
| European | 89 | 1.0% |
| French | 500 | 5.5% |
| French Canadian | 37 | 0.4% |
| German | 3,802 | 41.6% |
| Greek | 245 | 2.7% |
| Guatemalan | 2 | 0.0% |
| Hungarian | 99 | 1.1% |
| Irish | 1,757 | 19.2% |
| Italian | 659 | 7.2% |
| Jamaican | 15 | 0.2% |
| Korean | 40 | 0.4% |
| Lebanese | 10 | 0.1% |
| Lithuanian | 10 | 0.1% |
| Mexican | 71 | 0.8% |
| Native Hawaiian | 3 | 0.0% |
| Norwegian | 52 | 0.6% |
| Polish | 345 | 3.8% |
| Puerto Rican | 50 | 0.5% |
| Russian | 173 | 1.9% |
| Scotch-Irish | 34 | 0.4% |
| Scottish | 210 | 2.3% |
| Slavic | 10 | 0.1% |
| Slovak | 9 | 0.1% |
| South American | 41 | 0.4% |
| Spaniard | 10 | 0.1% |
| Spanish | 24 | 0.3% |
| Sri Lankan | 12 | 0.1% |
| Swedish | 89 | 1.0% |
| Swiss | 27 | 0.3% |
| Syrian | 125 | 1.4% |
| Thai | 72 | 0.8% |
| Ukrainian | 10 | 0.1% |
| Welsh | 20 | 0.2% | View All 53 Rows |
Immigrants in Des Peres
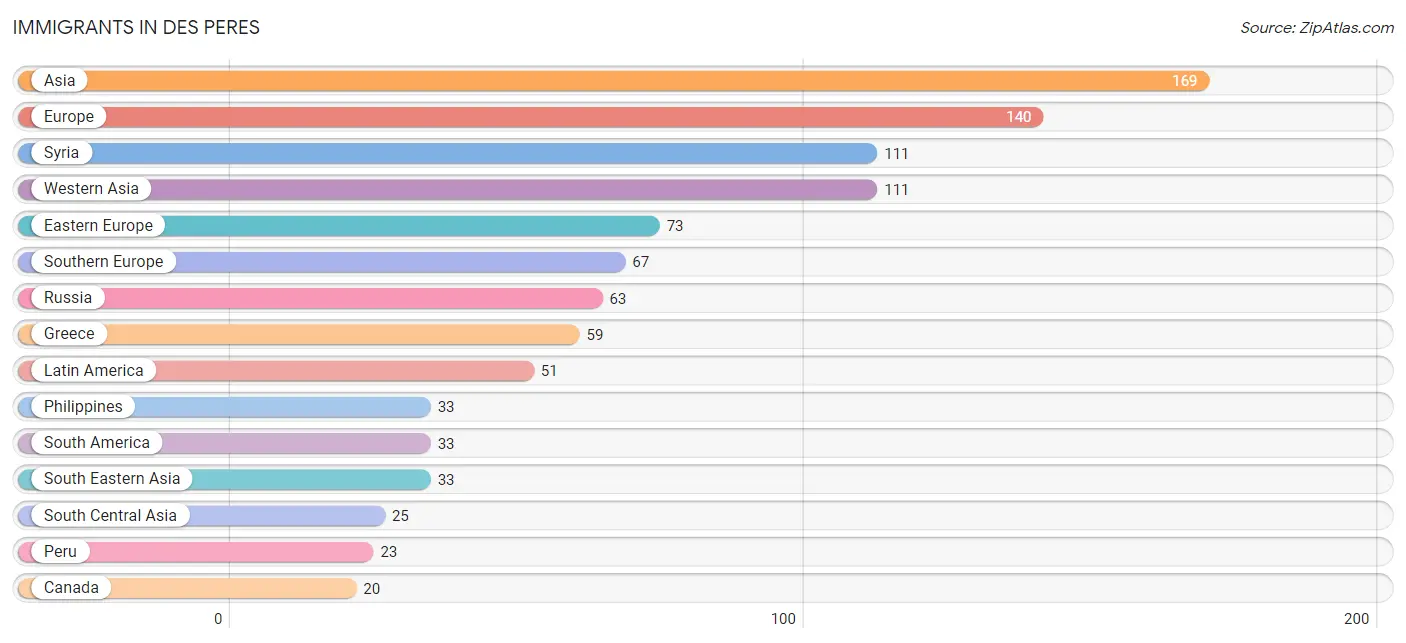
The most numerous immigrant groups reported in Des Peres came from Asia (169 | 1.8%), Europe (140 | 1.5%), Syria (111 | 1.2%), Western Asia (111 | 1.2%), and Eastern Europe (73 | 0.8%), together accounting for 6.6% of all Des Peres residents.
| Immigration Origin | # Population | % Population |
| Asia | 169 | 1.8% |
| Australia | 17 | 0.2% |
| Belize | 1 | 0.0% |
| Canada | 20 | 0.2% |
| Caribbean | 15 | 0.2% |
| Central America | 3 | 0.0% |
| Chile | 10 | 0.1% |
| Eastern Europe | 73 | 0.8% |
| Europe | 140 | 1.5% |
| Greece | 59 | 0.6% |
| Guatemala | 2 | 0.0% |
| India | 14 | 0.2% |
| Italy | 8 | 0.1% |
| Jamaica | 15 | 0.2% |
| Latin America | 51 | 0.6% |
| Oceania | 17 | 0.2% |
| Pakistan | 11 | 0.1% |
| Peru | 23 | 0.3% |
| Philippines | 33 | 0.4% |
| Russia | 63 | 0.7% |
| South America | 33 | 0.4% |
| South Central Asia | 25 | 0.3% |
| South Eastern Asia | 33 | 0.4% |
| Southern Europe | 67 | 0.7% |
| Syria | 111 | 1.2% |
| Ukraine | 10 | 0.1% |
| Western Asia | 111 | 1.2% | View All 27 Rows |
Sex and Age in Des Peres
Sex and Age in Des Peres
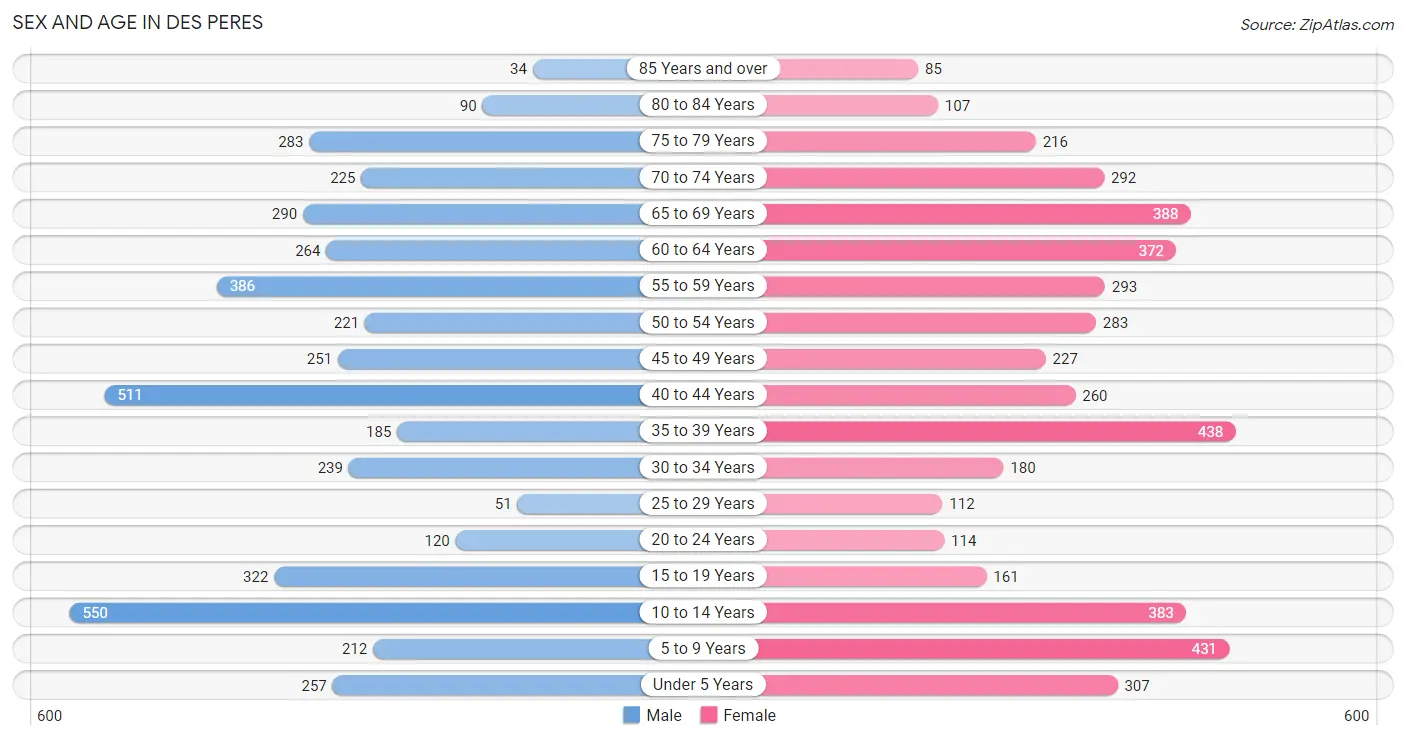
The most populous age groups in Des Peres are 10 to 14 Years (550 | 12.2%) for men and 35 to 39 Years (438 | 9.4%) for women.
| Age Bracket | Male | Female |
| Under 5 Years | 257 (5.7%) | 307 (6.6%) |
| 5 to 9 Years | 212 (4.7%) | 431 (9.3%) |
| 10 to 14 Years | 550 (12.2%) | 383 (8.2%) |
| 15 to 19 Years | 322 (7.2%) | 161 (3.5%) |
| 20 to 24 Years | 120 (2.7%) | 114 (2.5%) |
| 25 to 29 Years | 51 (1.1%) | 112 (2.4%) |
| 30 to 34 Years | 239 (5.3%) | 180 (3.9%) |
| 35 to 39 Years | 185 (4.1%) | 438 (9.4%) |
| 40 to 44 Years | 511 (11.4%) | 260 (5.6%) |
| 45 to 49 Years | 251 (5.6%) | 227 (4.9%) |
| 50 to 54 Years | 221 (4.9%) | 283 (6.1%) |
| 55 to 59 Years | 386 (8.6%) | 293 (6.3%) |
| 60 to 64 Years | 264 (5.9%) | 372 (8.0%) |
| 65 to 69 Years | 290 (6.5%) | 388 (8.4%) |
| 70 to 74 Years | 225 (5.0%) | 292 (6.3%) |
| 75 to 79 Years | 283 (6.3%) | 216 (4.6%) |
| 80 to 84 Years | 90 (2.0%) | 107 (2.3%) |
| 85 Years and over | 34 (0.8%) | 85 (1.8%) |
| Total | 4,491 (100.0%) | 4,649 (100.0%) |
Families and Households in Des Peres
Median Family Size in Des Peres
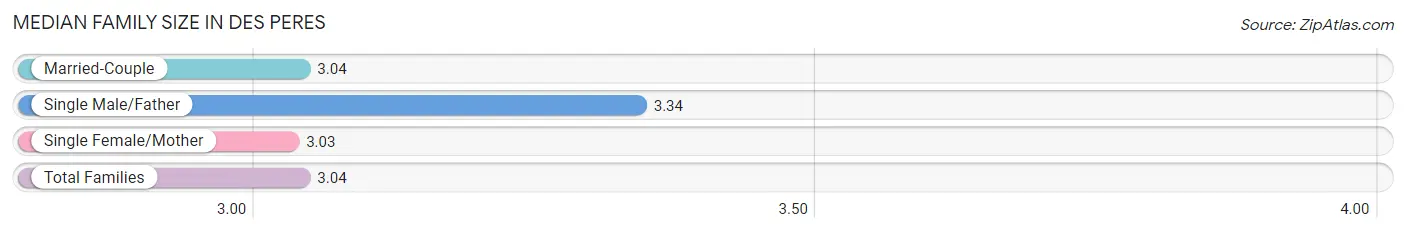
The median family size in Des Peres is 3.04 persons per family, with single male/father families (35 | 1.3%) accounting for the largest median family size of 3.34 persons per family. On the other hand, single female/mother families (101 | 3.6%) represent the smallest median family size with 3.03 persons per family.
| Family Type | # Families | Family Size |
| Married-Couple | 2,649 (95.1%) | 3.04 |
| Single Male/Father | 35 (1.3%) | 3.34 |
| Single Female/Mother | 101 (3.6%) | 3.03 |
| Total Families | 2,785 (100.0%) | 3.04 |
Median Household Size in Des Peres
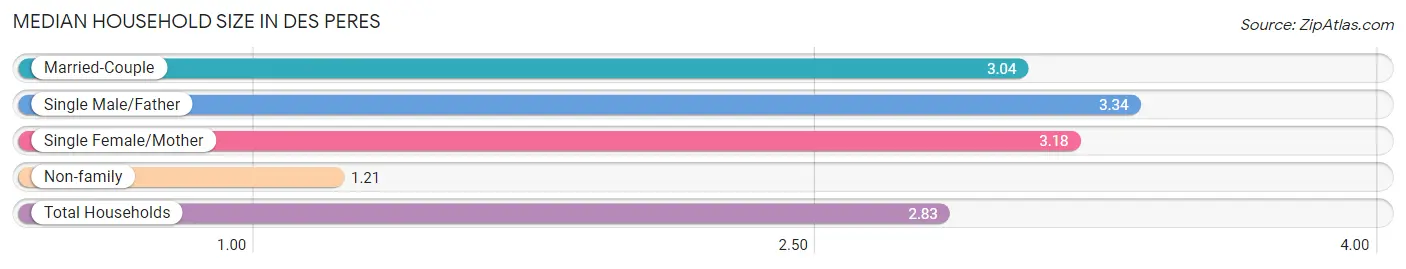
The median household size in Des Peres is 2.83 persons per household, with single male/father households (35 | 1.1%) accounting for the largest median household size of 3.34 persons per household. non-family households (384 | 12.1%) represent the smallest median household size with 1.21 persons per household.
| Household Type | # Households | Household Size |
| Married-Couple | 2,649 (83.6%) | 3.04 |
| Single Male/Father | 35 (1.1%) | 3.34 |
| Single Female/Mother | 101 (3.2%) | 3.18 |
| Non-family | 384 (12.1%) | 1.21 |
| Total Households | 3,169 (100.0%) | 2.83 |
Household Size by Marriage Status in Des Peres
Out of a total of 3,169 households in Des Peres, 2,785 (87.9%) are family households, while 384 (12.1%) are nonfamily households. The most numerous type of family households are 2-person households, comprising 1,183, and the most common type of nonfamily households are 1-person households, comprising 355.
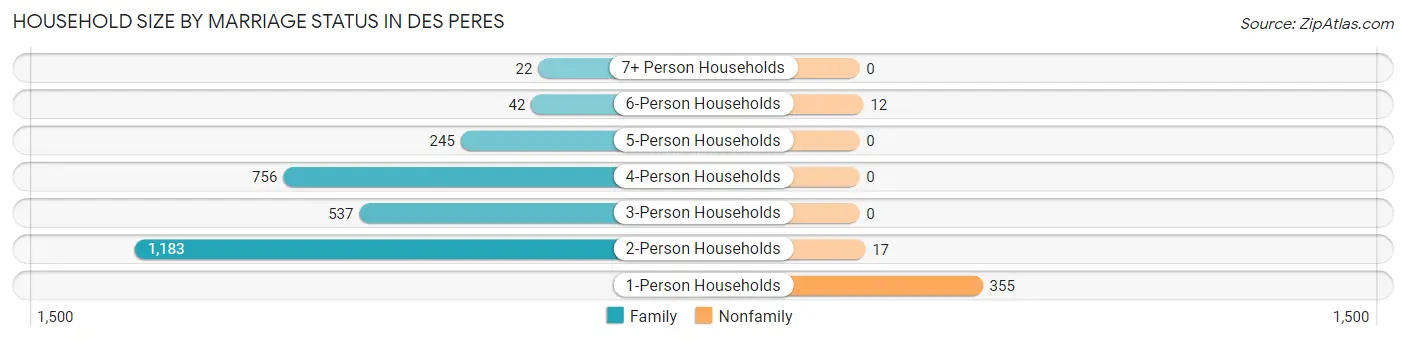
| Household Size | Family Households | Nonfamily Households |
| 1-Person Households | - | 355 (11.2%) |
| 2-Person Households | 1,183 (37.3%) | 17 (0.5%) |
| 3-Person Households | 537 (17.0%) | 0 (0.0%) |
| 4-Person Households | 756 (23.9%) | 0 (0.0%) |
| 5-Person Households | 245 (7.7%) | 0 (0.0%) |
| 6-Person Households | 42 (1.3%) | 12 (0.4%) |
| 7+ Person Households | 22 (0.7%) | 0 (0.0%) |
| Total | 2,785 (87.9%) | 384 (12.1%) |
Female Fertility in Des Peres
Fertility by Age in Des Peres
Average fertility rate in Des Peres is 88.0 births per 1,000 women. Women in the age bracket of 20 to 34 years have the highest fertility rate with 158.0 births per 1,000 women. Women in the age bracket of 35 to 50 years acount for 52.9% of all women with births.
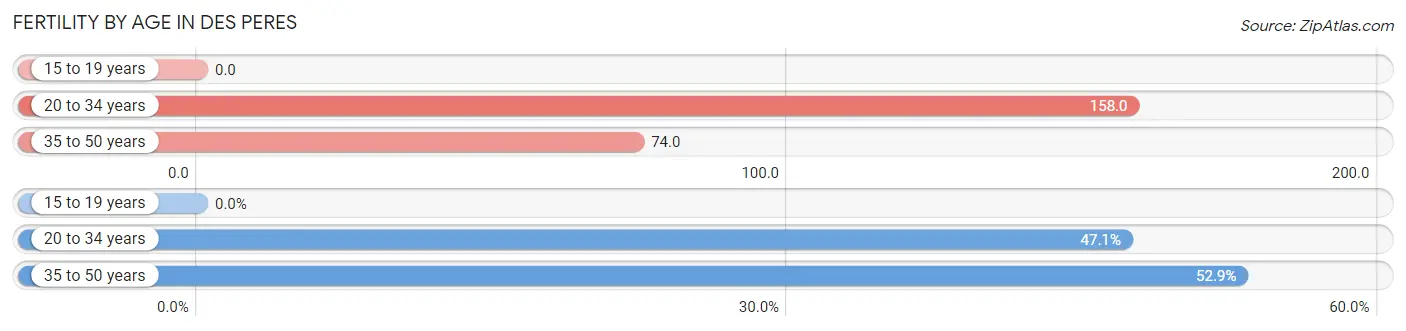
| Age Bracket | Women with Births | Births / 1,000 Women |
| 15 to 19 years | 0 (0.0%) | 0.0 |
| 20 to 34 years | 64 (47.1%) | 158.0 |
| 35 to 50 years | 72 (52.9%) | 74.0 |
| Total | 136 (100.0%) | 88.0 |
Fertility by Age by Marriage Status in Des Peres
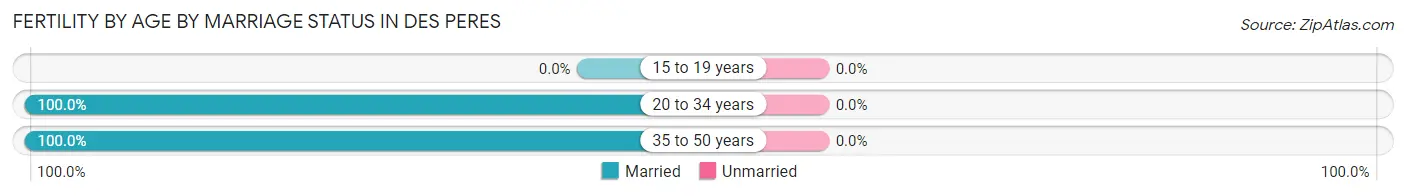
| Age Bracket | Married | Unmarried |
| 15 to 19 years | 0 (0.0%) | 0 (0.0%) |
| 20 to 34 years | 64 (100.0%) | 0 (0.0%) |
| 35 to 50 years | 72 (100.0%) | 0 (0.0%) |
| Total | 136 (100.0%) | 0 (0.0%) |
Fertility by Education in Des Peres
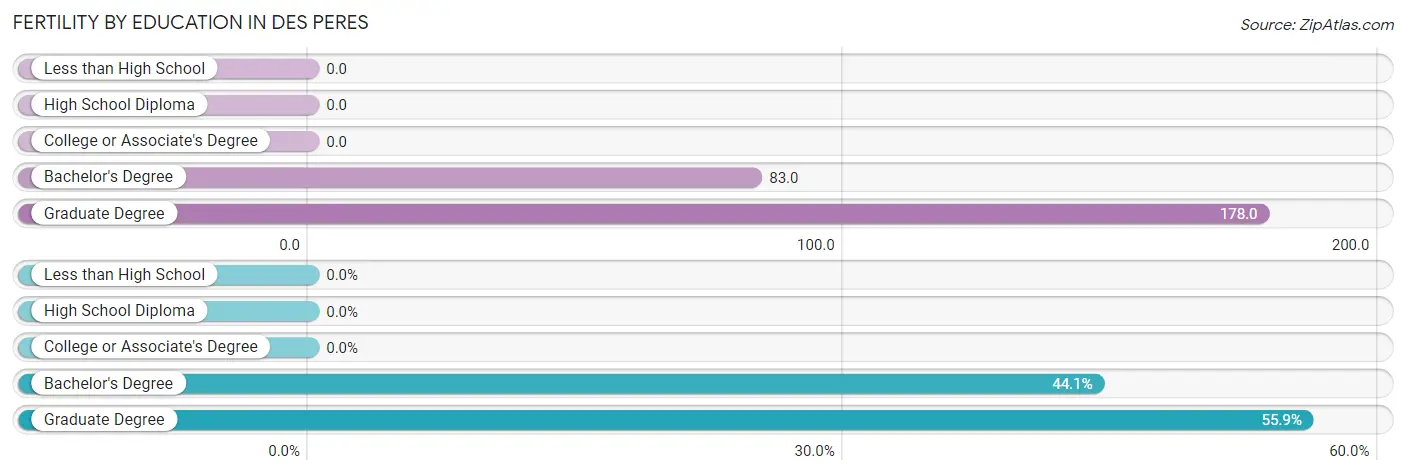
| Educational Attainment | Women with Births | Births / 1,000 Women |
| Less than High School | 0 (0.0%) | 0.0 |
| High School Diploma | 0 (0.0%) | 0.0 |
| College or Associate's Degree | 0 (0.0%) | 0.0 |
| Bachelor's Degree | 60 (44.1%) | 83.0 |
| Graduate Degree | 76 (55.9%) | 178.0 |
| Total | 136 (100.0%) | 88.0 |
Fertility by Education by Marriage Status in Des Peres
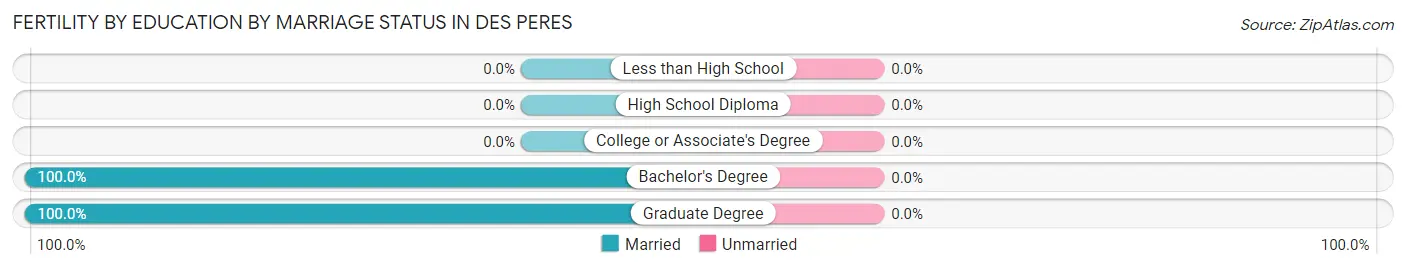
| Educational Attainment | Married | Unmarried |
| Less than High School | 0 (0.0%) | 0 (0.0%) |
| High School Diploma | 0 (0.0%) | 0 (0.0%) |
| College or Associate's Degree | 0 (0.0%) | 0 (0.0%) |
| Bachelor's Degree | 60 (100.0%) | 0 (0.0%) |
| Graduate Degree | 76 (100.0%) | 0 (0.0%) |
| Total | 136 (100.0%) | 0 (0.0%) |
Employment Characteristics in Des Peres
Employment by Class of Employer in Des Peres
Among the 4,366 employed individuals in Des Peres, private company employees (3,093 | 70.8%), not-for-profit organizations (455 | 10.4%), and self-employed (incorporated) (306 | 7.0%) make up the most common classes of employment.
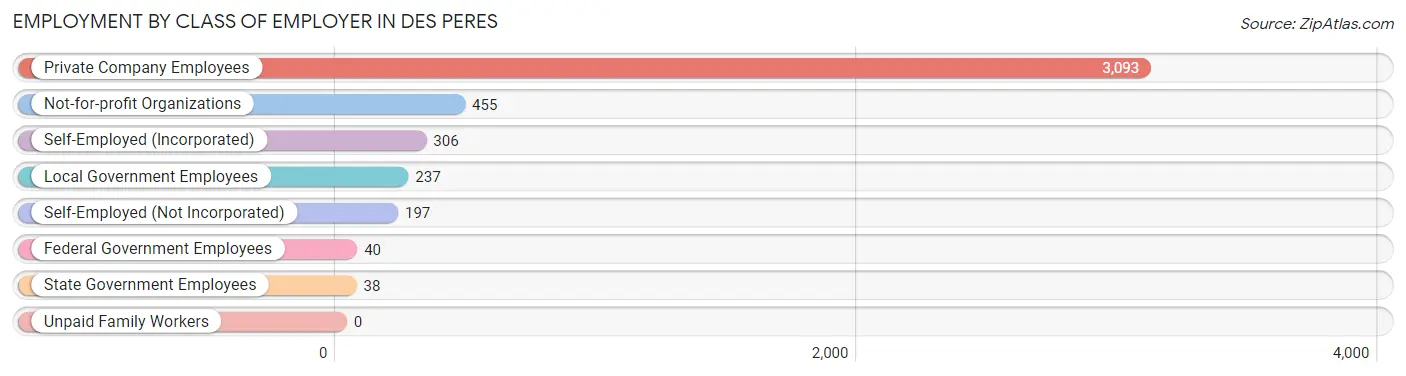
| Employer Class | # Employees | % Employees |
| Private Company Employees | 3,093 | 70.8% |
| Self-Employed (Incorporated) | 306 | 7.0% |
| Self-Employed (Not Incorporated) | 197 | 4.5% |
| Not-for-profit Organizations | 455 | 10.4% |
| Local Government Employees | 237 | 5.4% |
| State Government Employees | 38 | 0.9% |
| Federal Government Employees | 40 | 0.9% |
| Unpaid Family Workers | 0 | 0.0% |
| Total | 4,366 | 100.0% |
Employment Status by Age in Des Peres
According to the labor force statistics for Des Peres, out of the total population over 16 years of age (6,872), 64.6% or 4,439 individuals are in the labor force, with 0.5% or 22 of them unemployed. The age group with the highest labor force participation rate is 30 to 34 years, with 95.0% or 398 individuals in the labor force. Within the labor force, the 55 to 59 years age range has the highest percentage of unemployed individuals, with 3.6% or 21 of them being unemployed.
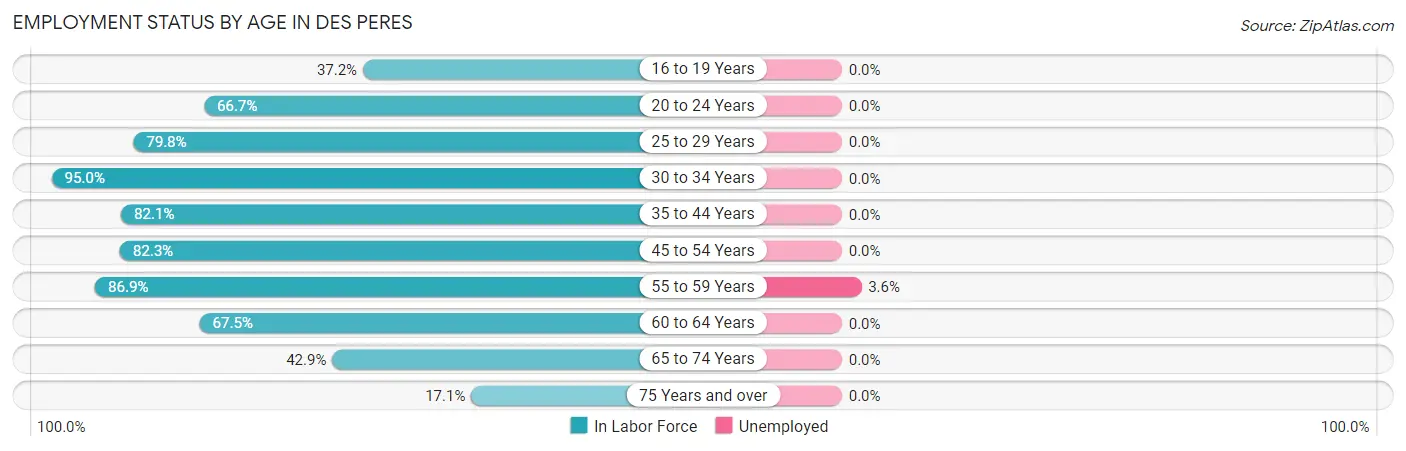
| Age Bracket | In Labor Force | Unemployed |
| 16 to 19 Years | 132 (37.2%) | 0 (0.0%) |
| 20 to 24 Years | 156 (66.7%) | 0 (0.0%) |
| 25 to 29 Years | 130 (79.8%) | 0 (0.0%) |
| 30 to 34 Years | 398 (95.0%) | 0 (0.0%) |
| 35 to 44 Years | 1,144 (82.1%) | 0 (0.0%) |
| 45 to 54 Years | 808 (82.3%) | 0 (0.0%) |
| 55 to 59 Years | 590 (86.9%) | 21 (3.6%) |
| 60 to 64 Years | 429 (67.5%) | 0 (0.0%) |
| 65 to 74 Years | 513 (42.9%) | 0 (0.0%) |
| 75 Years and over | 139 (17.1%) | 0 (0.0%) |
| Total | 4,439 (64.6%) | 22 (0.5%) |
Employment Status by Educational Attainment in Des Peres
According to labor force statistics for Des Peres, 81.9% of individuals (3,500) out of the total population between 25 and 64 years of age (4,273) are in the labor force, with 0.6% or 21 of them being unemployed. The group with the highest labor force participation rate are those with the educational attainment of bachelor's degree or higher, with 84.2% or 2,996 individuals in the labor force. Within the labor force, individuals with bachelor's degree or higher education have the highest percentage of unemployment, with 0.7% or 21 of them being unemployed.
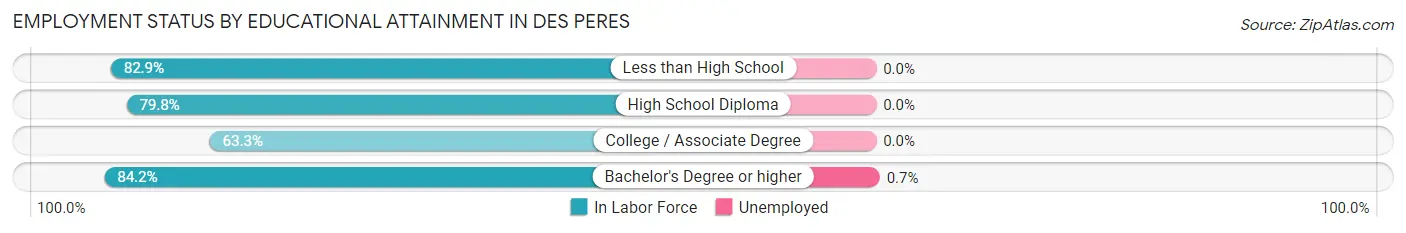
| Educational Attainment | In Labor Force | Unemployed |
| Less than High School | 58 (82.9%) | 0 (0.0%) |
| High School Diploma | 182 (79.8%) | 0 (0.0%) |
| College / Associate Degree | 264 (63.3%) | 0 (0.0%) |
| Bachelor's Degree or higher | 2,996 (84.2%) | 25 (0.7%) |
| Total | 3,500 (81.9%) | 26 (0.6%) |
Employment Occupations by Sex in Des Peres
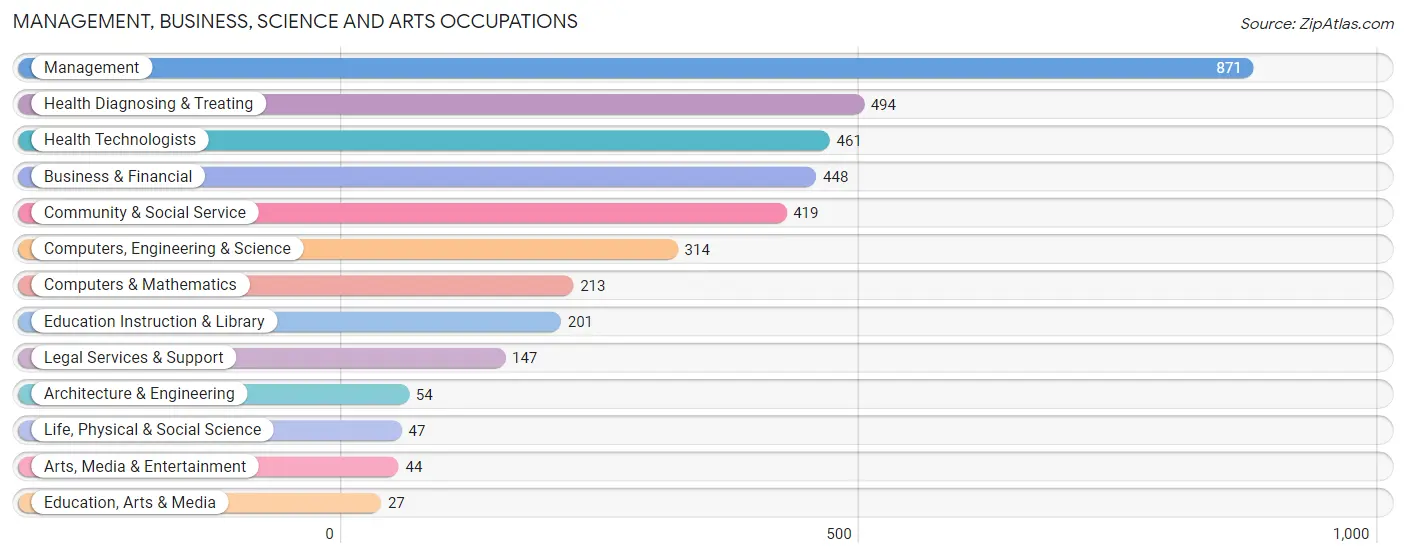
Management, Business, Science and Arts Occupations
The most common Management, Business, Science and Arts occupations in Des Peres are Management (871 | 19.7%), Health Diagnosing & Treating (494 | 11.2%), Health Technologists (461 | 10.4%), Business & Financial (448 | 10.1%), and Community & Social Service (419 | 9.5%).
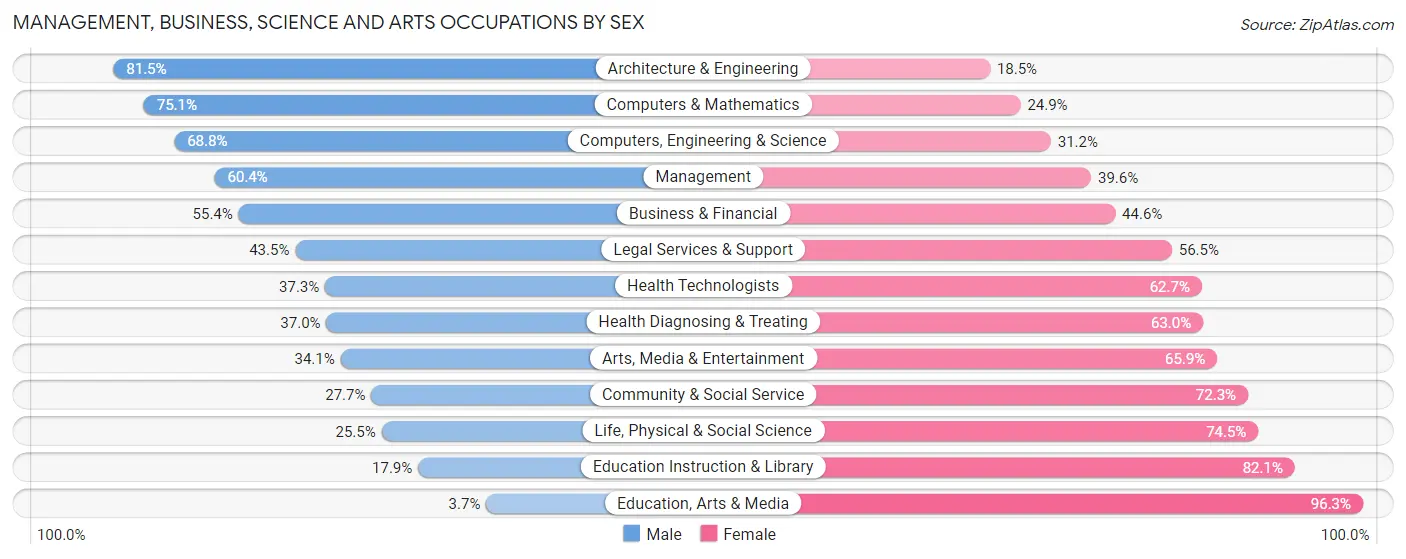
Management, Business, Science and Arts Occupations by Sex
Within the Management, Business, Science and Arts occupations in Des Peres, the most male-oriented occupations are Architecture & Engineering (81.5%), Computers & Mathematics (75.1%), and Computers, Engineering & Science (68.8%), while the most female-oriented occupations are Education, Arts & Media (96.3%), Education Instruction & Library (82.1%), and Life, Physical & Social Science (74.5%).
| Occupation | Male | Female |
| Management | 526 (60.4%) | 345 (39.6%) |
| Business & Financial | 248 (55.4%) | 200 (44.6%) |
| Computers, Engineering & Science | 216 (68.8%) | 98 (31.2%) |
| Computers & Mathematics | 160 (75.1%) | 53 (24.9%) |
| Architecture & Engineering | 44 (81.5%) | 10 (18.5%) |
| Life, Physical & Social Science | 12 (25.5%) | 35 (74.5%) |
| Community & Social Service | 116 (27.7%) | 303 (72.3%) |
| Education, Arts & Media | 1 (3.7%) | 26 (96.3%) |
| Legal Services & Support | 64 (43.5%) | 83 (56.5%) |
| Education Instruction & Library | 36 (17.9%) | 165 (82.1%) |
| Arts, Media & Entertainment | 15 (34.1%) | 29 (65.9%) |
| Health Diagnosing & Treating | 183 (37.0%) | 311 (63.0%) |
| Health Technologists | 172 (37.3%) | 289 (62.7%) |
| Total (Category) | 1,289 (50.6%) | 1,257 (49.4%) |
| Total (Overall) | 2,614 (59.2%) | 1,804 (40.8%) |
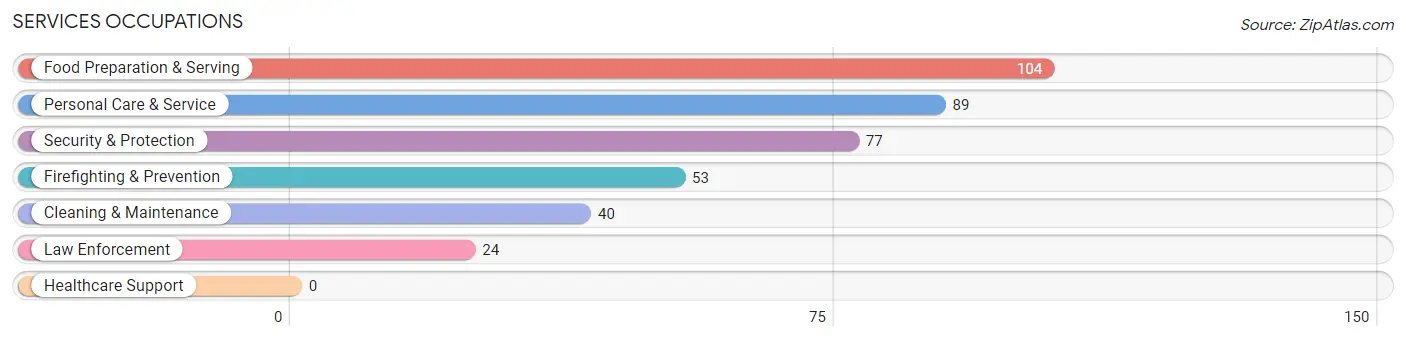
Services Occupations
The most common Services occupations in Des Peres are Food Preparation & Serving (104 | 2.4%), Personal Care & Service (89 | 2.0%), Security & Protection (77 | 1.7%), Firefighting & Prevention (53 | 1.2%), and Cleaning & Maintenance (40 | 0.9%).
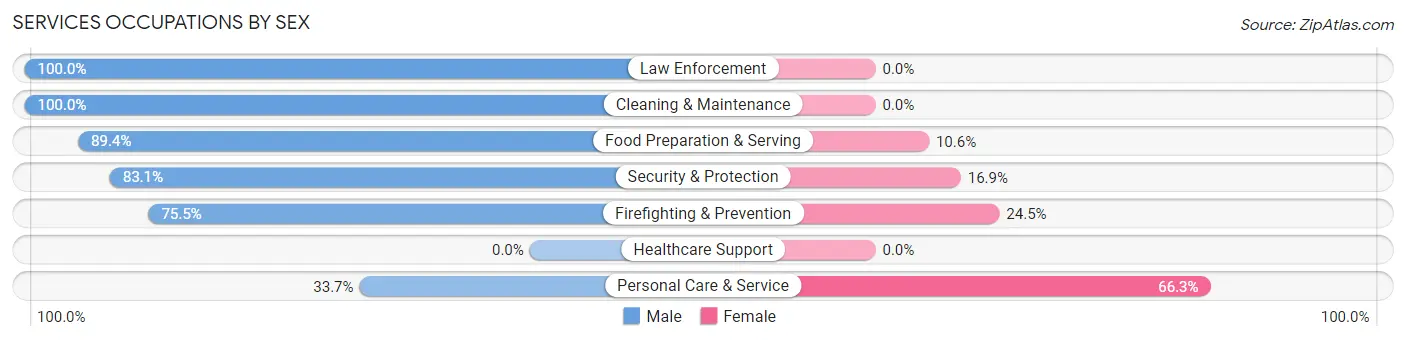
Services Occupations by Sex
Within the Services occupations in Des Peres, the most male-oriented occupations are Law Enforcement (100.0%), Cleaning & Maintenance (100.0%), and Food Preparation & Serving (89.4%), while the most female-oriented occupations are Personal Care & Service (66.3%), Firefighting & Prevention (24.5%), and Security & Protection (16.9%).
| Occupation | Male | Female |
| Healthcare Support | 0 (0.0%) | 0 (0.0%) |
| Security & Protection | 64 (83.1%) | 13 (16.9%) |
| Firefighting & Prevention | 40 (75.5%) | 13 (24.5%) |
| Law Enforcement | 24 (100.0%) | 0 (0.0%) |
| Food Preparation & Serving | 93 (89.4%) | 11 (10.6%) |
| Cleaning & Maintenance | 40 (100.0%) | 0 (0.0%) |
| Personal Care & Service | 30 (33.7%) | 59 (66.3%) |
| Total (Category) | 227 (73.2%) | 83 (26.8%) |
| Total (Overall) | 2,614 (59.2%) | 1,804 (40.8%) |
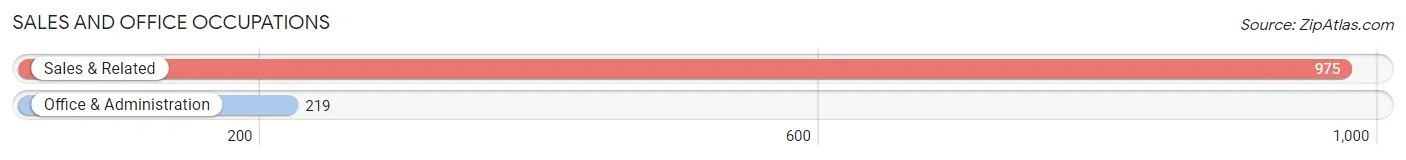
Sales and Office Occupations
The most common Sales and Office occupations in Des Peres are Sales & Related (975 | 22.1%), and Office & Administration (219 | 5.0%).
Sales and Office Occupations by Sex
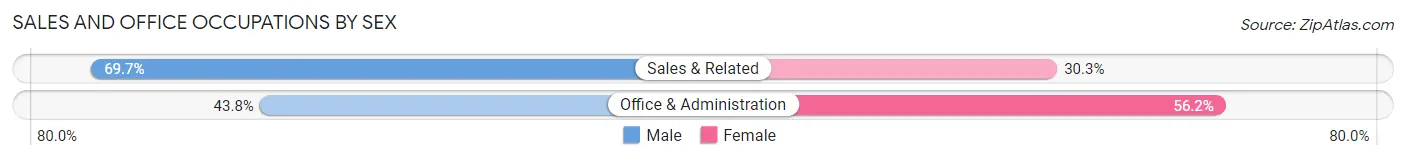
| Occupation | Male | Female |
| Sales & Related | 680 (69.7%) | 295 (30.3%) |
| Office & Administration | 96 (43.8%) | 123 (56.2%) |
| Total (Category) | 776 (65.0%) | 418 (35.0%) |
| Total (Overall) | 2,614 (59.2%) | 1,804 (40.8%) |
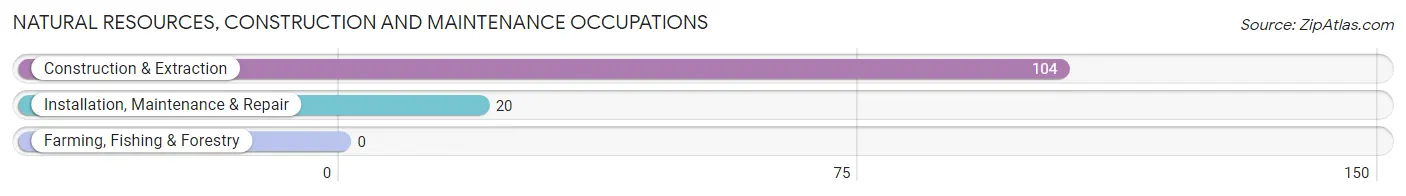
Natural Resources, Construction and Maintenance Occupations
The most common Natural Resources, Construction and Maintenance occupations in Des Peres are Construction & Extraction (104 | 2.4%), and Installation, Maintenance & Repair (20 | 0.4%).
Natural Resources, Construction and Maintenance Occupations by Sex
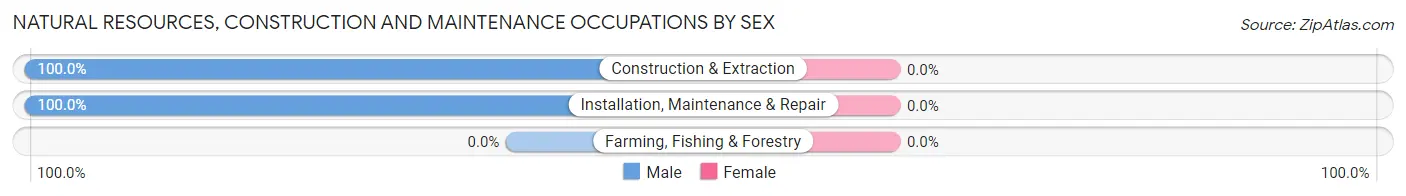
| Occupation | Male | Female |
| Farming, Fishing & Forestry | 0 (0.0%) | 0 (0.0%) |
| Construction & Extraction | 104 (100.0%) | 0 (0.0%) |
| Installation, Maintenance & Repair | 20 (100.0%) | 0 (0.0%) |
| Total (Category) | 124 (100.0%) | 0 (0.0%) |
| Total (Overall) | 2,614 (59.2%) | 1,804 (40.8%) |
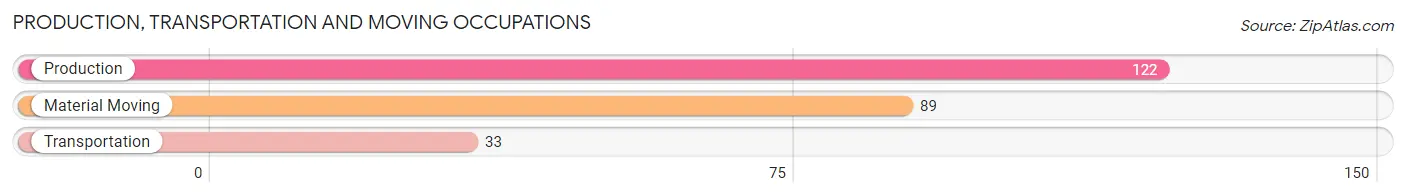
Production, Transportation and Moving Occupations
The most common Production, Transportation and Moving occupations in Des Peres are Production (122 | 2.8%), Material Moving (89 | 2.0%), and Transportation (33 | 0.7%).
Production, Transportation and Moving Occupations by Sex
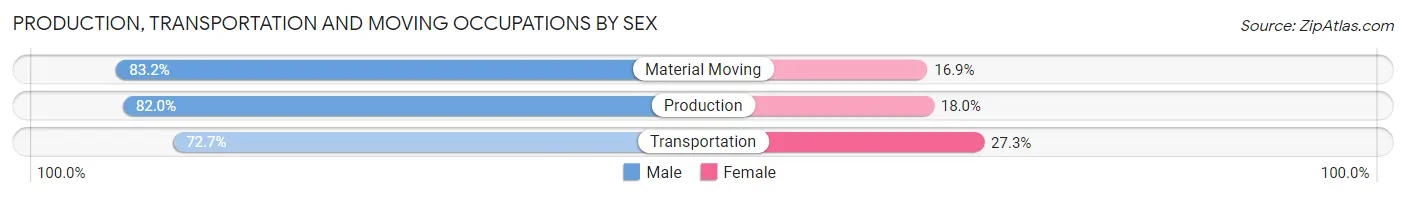
| Occupation | Male | Female |
| Production | 100 (82.0%) | 22 (18.0%) |
| Transportation | 24 (72.7%) | 9 (27.3%) |
| Material Moving | 74 (83.2%) | 15 (16.9%) |
| Total (Category) | 198 (81.1%) | 46 (18.9%) |
| Total (Overall) | 2,614 (59.2%) | 1,804 (40.8%) |
Employment Industries by Sex in Des Peres
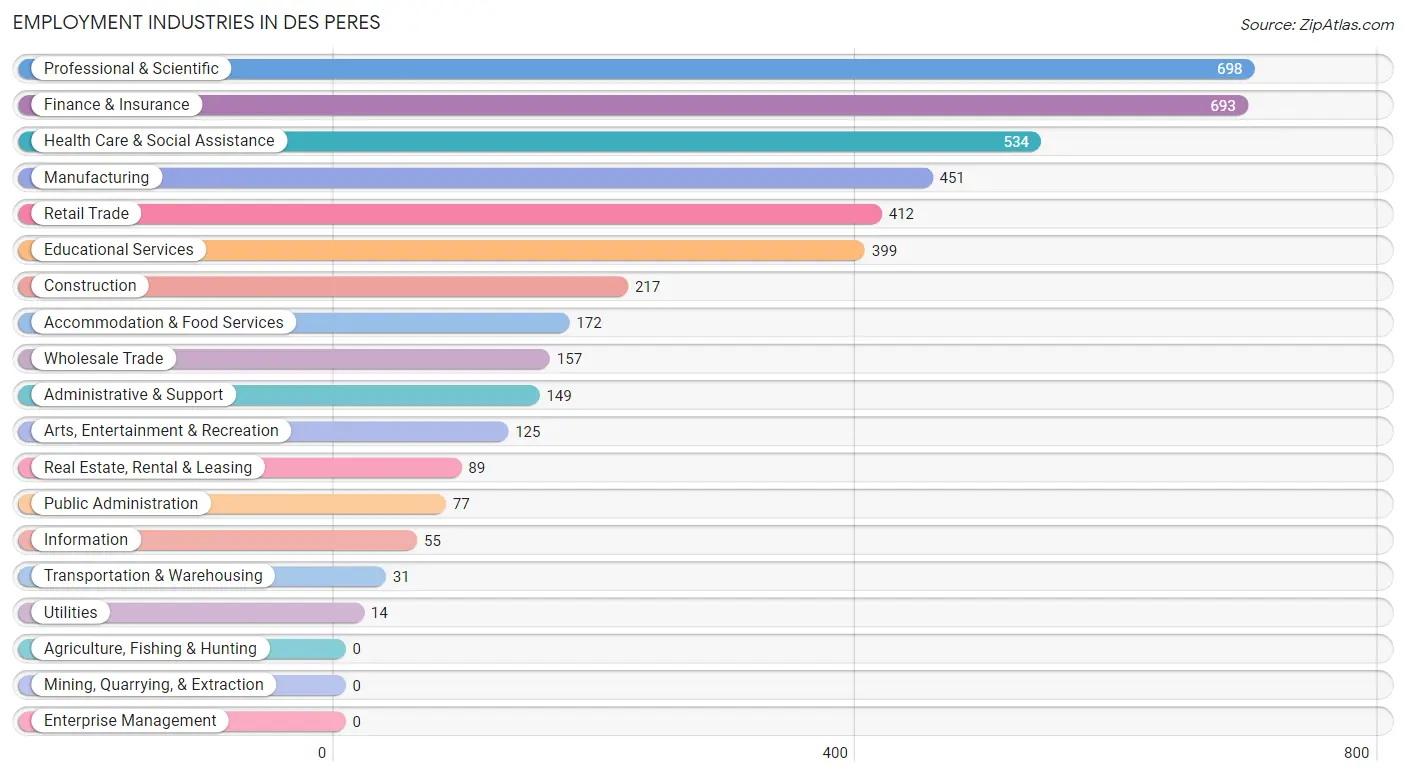
Employment Industries in Des Peres
The major employment industries in Des Peres include Professional & Scientific (698 | 15.8%), Finance & Insurance (693 | 15.7%), Health Care & Social Assistance (534 | 12.1%), Manufacturing (451 | 10.2%), and Retail Trade (412 | 9.3%).
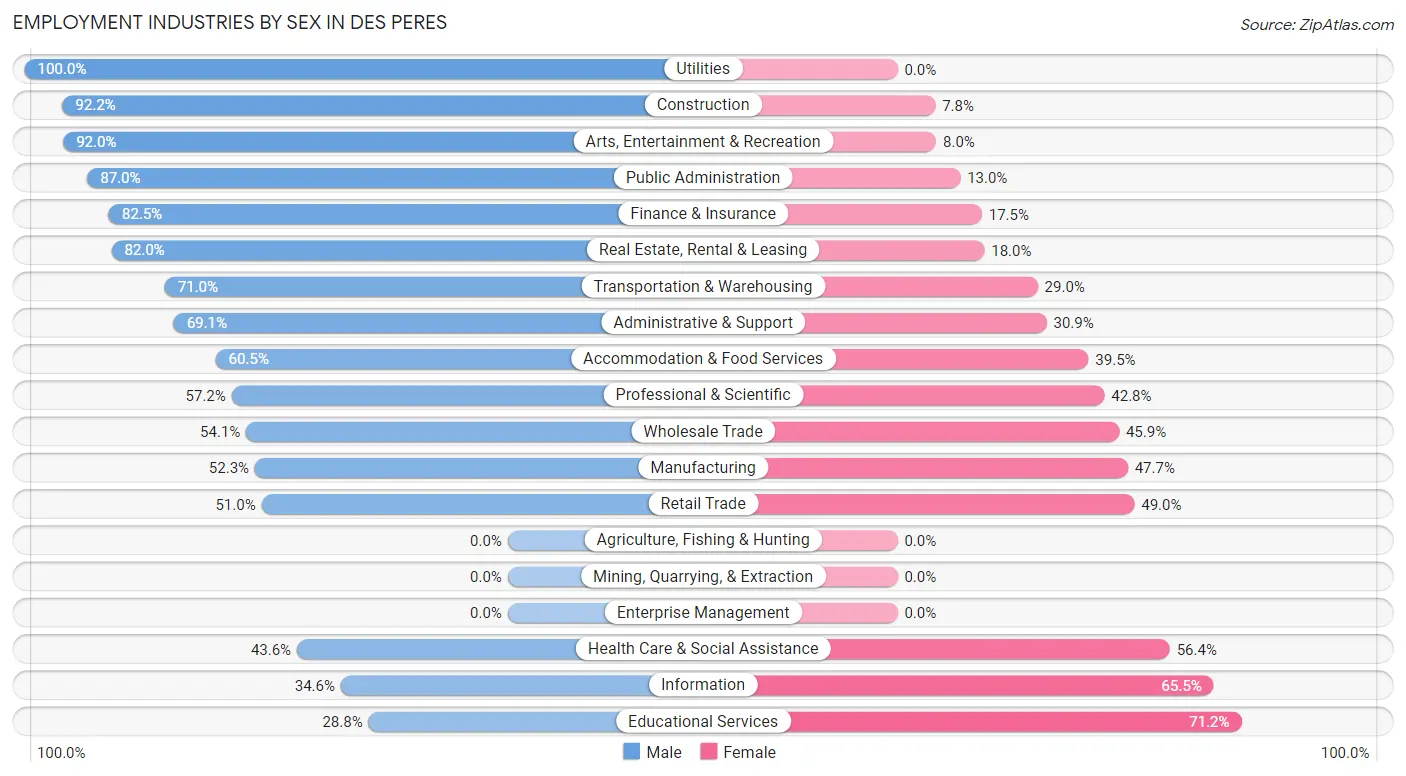
Employment Industries by Sex in Des Peres
The Des Peres industries that see more men than women are Utilities (100.0%), Construction (92.2%), and Arts, Entertainment & Recreation (92.0%), whereas the industries that tend to have a higher number of women are Educational Services (71.2%), Information (65.4%), and Health Care & Social Assistance (56.4%).
| Industry | Male | Female |
| Agriculture, Fishing & Hunting | 0 (0.0%) | 0 (0.0%) |
| Mining, Quarrying, & Extraction | 0 (0.0%) | 0 (0.0%) |
| Construction | 200 (92.2%) | 17 (7.8%) |
| Manufacturing | 236 (52.3%) | 215 (47.7%) |
| Wholesale Trade | 85 (54.1%) | 72 (45.9%) |
| Retail Trade | 210 (51.0%) | 202 (49.0%) |
| Transportation & Warehousing | 22 (71.0%) | 9 (29.0%) |
| Utilities | 14 (100.0%) | 0 (0.0%) |
| Information | 19 (34.5%) | 36 (65.4%) |
| Finance & Insurance | 572 (82.5%) | 121 (17.5%) |
| Real Estate, Rental & Leasing | 73 (82.0%) | 16 (18.0%) |
| Professional & Scientific | 399 (57.2%) | 299 (42.8%) |
| Enterprise Management | 0 (0.0%) | 0 (0.0%) |
| Administrative & Support | 103 (69.1%) | 46 (30.9%) |
| Educational Services | 115 (28.8%) | 284 (71.2%) |
| Health Care & Social Assistance | 233 (43.6%) | 301 (56.4%) |
| Arts, Entertainment & Recreation | 115 (92.0%) | 10 (8.0%) |
| Accommodation & Food Services | 104 (60.5%) | 68 (39.5%) |
| Public Administration | 67 (87.0%) | 10 (13.0%) |
| Total | 2,614 (59.2%) | 1,804 (40.8%) |
Education in Des Peres
School Enrollment in Des Peres
The most common levels of schooling among the 2,415 students in Des Peres are middle school (727 | 30.1%), elementary school (613 | 25.4%), and high school (483 | 20.0%).
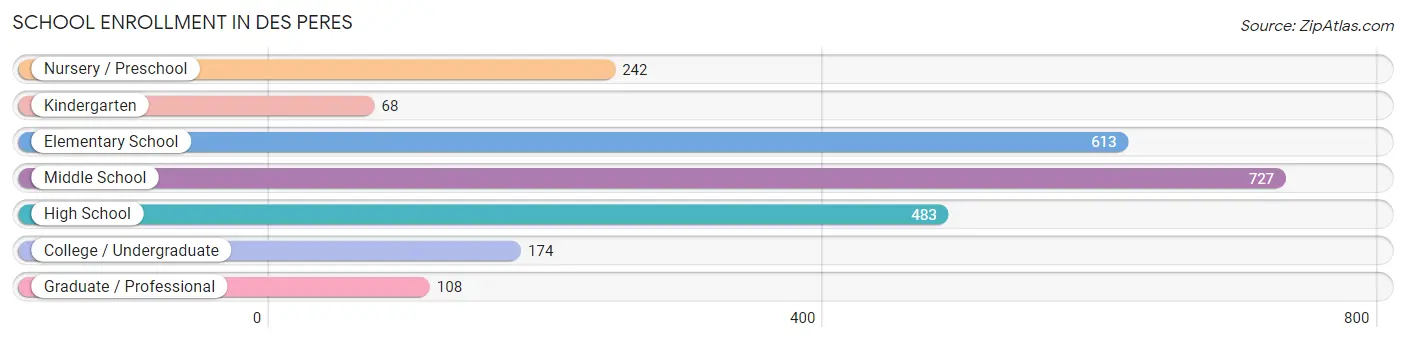
| School Level | # Students | % Students |
| Nursery / Preschool | 242 | 10.0% |
| Kindergarten | 68 | 2.8% |
| Elementary School | 613 | 25.4% |
| Middle School | 727 | 30.1% |
| High School | 483 | 20.0% |
| College / Undergraduate | 174 | 7.2% |
| Graduate / Professional | 108 | 4.5% |
| Total | 2,415 | 100.0% |
School Enrollment by Age by Funding Source in Des Peres
Out of a total of 2,415 students who are enrolled in schools in Des Peres, 1,321 (54.7%) attend a private institution, while the remaining 1,094 (45.3%) are enrolled in public schools. The age group of 3 to 4 year olds has the highest likelihood of being enrolled in private schools, with 122 (88.4% in the age bracket) enrolled. Conversely, the age group of 35 years and over has the lowest likelihood of being enrolled in a private school, with 60 (81.1% in the age bracket) attending a public institution.
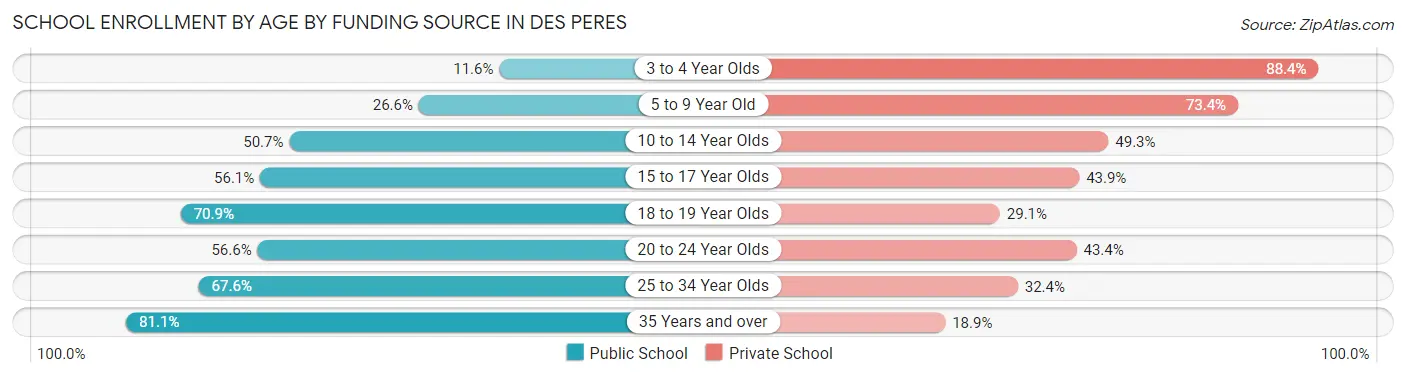
| Age Bracket | Public School | Private School |
| 3 to 4 Year Olds | 16 (11.6%) | 122 (88.4%) |
| 5 to 9 Year Old | 169 (26.6%) | 467 (73.4%) |
| 10 to 14 Year Olds | 473 (50.7%) | 460 (49.3%) |
| 15 to 17 Year Olds | 197 (56.1%) | 154 (43.9%) |
| 18 to 19 Year Olds | 78 (70.9%) | 32 (29.1%) |
| 20 to 24 Year Olds | 77 (56.6%) | 59 (43.4%) |
| 25 to 34 Year Olds | 25 (67.6%) | 12 (32.4%) |
| 35 Years and over | 60 (81.1%) | 14 (18.9%) |
| Total | 1,094 (45.3%) | 1,321 (54.7%) |
Educational Attainment by Field of Study in Des Peres
Business (1,720 | 33.4%), science & technology (565 | 11.0%), communications (396 | 7.7%), engineering (366 | 7.1%), and education (359 | 7.0%) are the most common fields of study among 5,143 individuals in Des Peres who have obtained a bachelor's degree or higher.
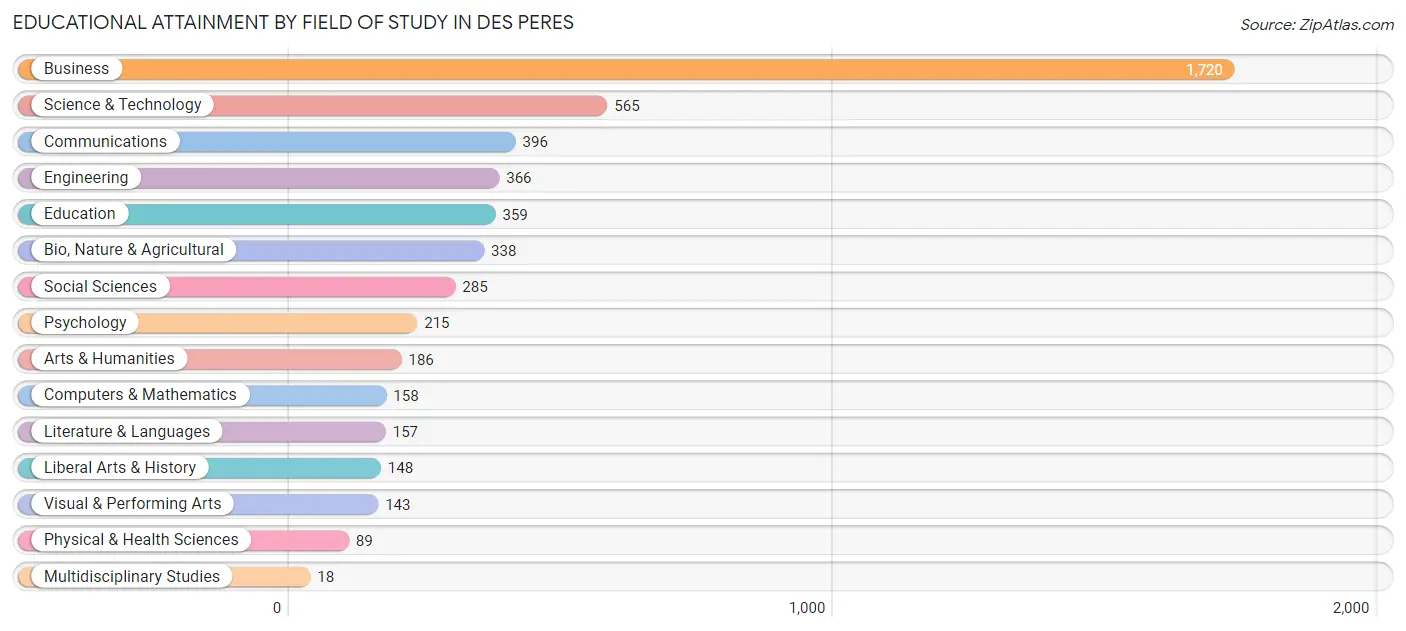
| Field of Study | # Graduates | % Graduates |
| Computers & Mathematics | 158 | 3.1% |
| Bio, Nature & Agricultural | 338 | 6.6% |
| Physical & Health Sciences | 89 | 1.7% |
| Psychology | 215 | 4.2% |
| Social Sciences | 285 | 5.5% |
| Engineering | 366 | 7.1% |
| Multidisciplinary Studies | 18 | 0.4% |
| Science & Technology | 565 | 11.0% |
| Business | 1,720 | 33.4% |
| Education | 359 | 7.0% |
| Literature & Languages | 157 | 3.0% |
| Liberal Arts & History | 148 | 2.9% |
| Visual & Performing Arts | 143 | 2.8% |
| Communications | 396 | 7.7% |
| Arts & Humanities | 186 | 3.6% |
| Total | 5,143 | 100.0% |
Transportation & Commute in Des Peres
Vehicle Availability by Sex in Des Peres
The most prevalent vehicle ownership categories in Des Peres are males with 2 vehicles (1,374, accounting for 52.6%) and females with 2 vehicles (1,032, making up 78.5%).
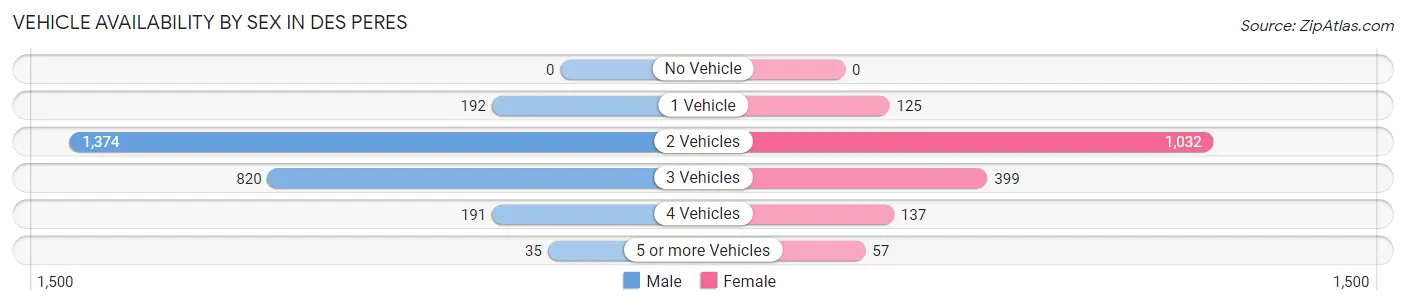
| Vehicles Available | Male | Female |
| No Vehicle | 0 (0.0%) | 0 (0.0%) |
| 1 Vehicle | 192 (7.3%) | 125 (7.1%) |
| 2 Vehicles | 1,374 (52.6%) | 1,032 (59.0%) |
| 3 Vehicles | 820 (31.4%) | 399 (22.8%) |
| 4 Vehicles | 191 (7.3%) | 137 (7.8%) |
| 5 or more Vehicles | 35 (1.3%) | 57 (3.3%) |
| Total | 2,612 (100.0%) | 1,750 (100.0%) |
Commute Time in Des Peres
The most frequently occuring commute durations in Des Peres are 20 to 24 minutes (837 commuters, 22.6%), 15 to 19 minutes (792 commuters, 21.3%), and 10 to 14 minutes (507 commuters, 13.7%).
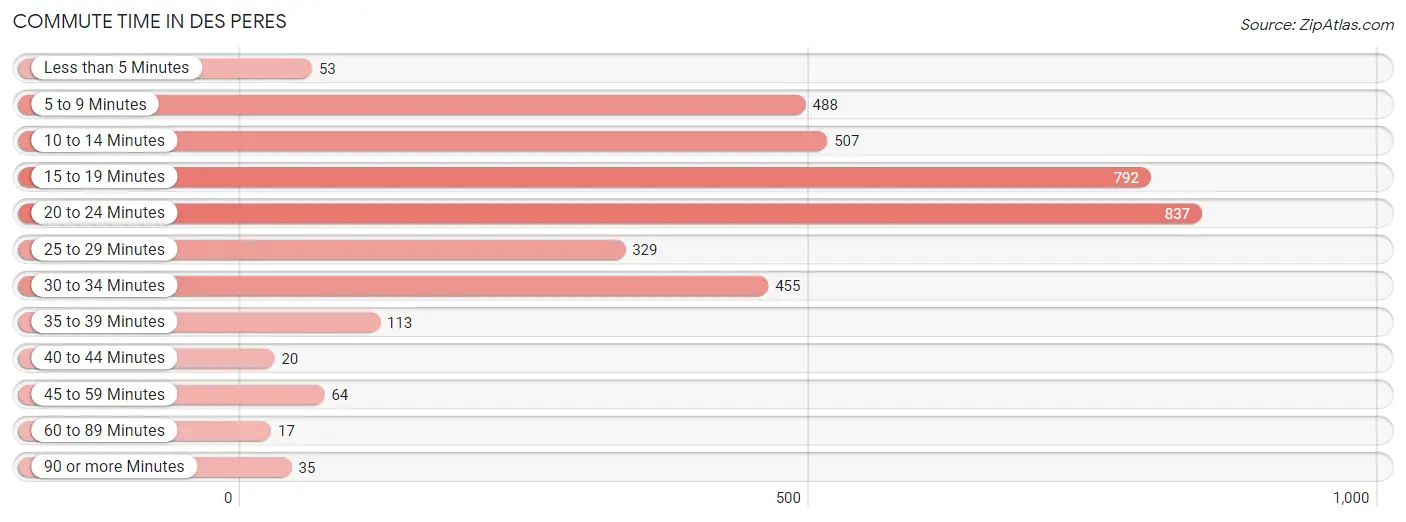
| Commute Time | # Commuters | % Commuters |
| Less than 5 Minutes | 53 | 1.4% |
| 5 to 9 Minutes | 488 | 13.2% |
| 10 to 14 Minutes | 507 | 13.7% |
| 15 to 19 Minutes | 792 | 21.3% |
| 20 to 24 Minutes | 837 | 22.6% |
| 25 to 29 Minutes | 329 | 8.9% |
| 30 to 34 Minutes | 455 | 12.3% |
| 35 to 39 Minutes | 113 | 3.0% |
| 40 to 44 Minutes | 20 | 0.5% |
| 45 to 59 Minutes | 64 | 1.7% |
| 60 to 89 Minutes | 17 | 0.5% |
| 90 or more Minutes | 35 | 0.9% |
Commute Time by Sex in Des Peres
The most common commute times in Des Peres are 15 to 19 minutes (493 commuters, 21.8%) for males and 20 to 24 minutes (396 commuters, 27.2%) for females.
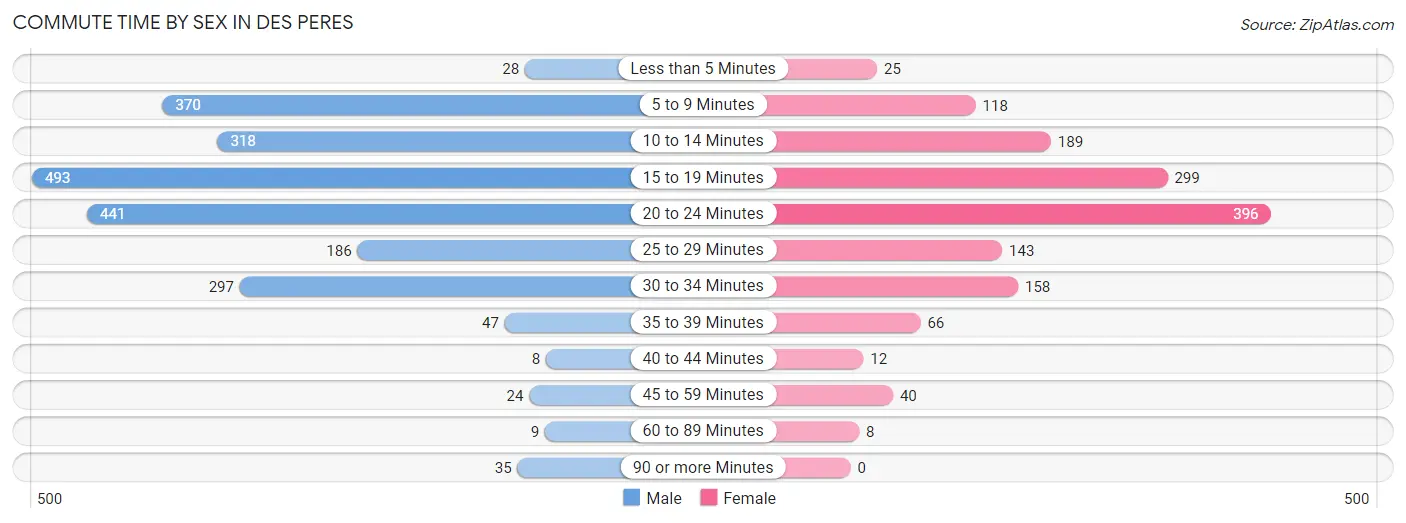
| Commute Time | Male | Female |
| Less than 5 Minutes | 28 (1.2%) | 25 (1.7%) |
| 5 to 9 Minutes | 370 (16.4%) | 118 (8.1%) |
| 10 to 14 Minutes | 318 (14.1%) | 189 (13.0%) |
| 15 to 19 Minutes | 493 (21.8%) | 299 (20.6%) |
| 20 to 24 Minutes | 441 (19.6%) | 396 (27.2%) |
| 25 to 29 Minutes | 186 (8.2%) | 143 (9.8%) |
| 30 to 34 Minutes | 297 (13.2%) | 158 (10.9%) |
| 35 to 39 Minutes | 47 (2.1%) | 66 (4.5%) |
| 40 to 44 Minutes | 8 (0.4%) | 12 (0.8%) |
| 45 to 59 Minutes | 24 (1.1%) | 40 (2.8%) |
| 60 to 89 Minutes | 9 (0.4%) | 8 (0.5%) |
| 90 or more Minutes | 35 (1.5%) | 0 (0.0%) |
Time of Departure to Work by Sex in Des Peres
The most frequent times of departure to work in Des Peres are 7:30 AM to 7:59 AM (490, 21.7%) for males and 7:30 AM to 7:59 AM (396, 27.2%) for females.
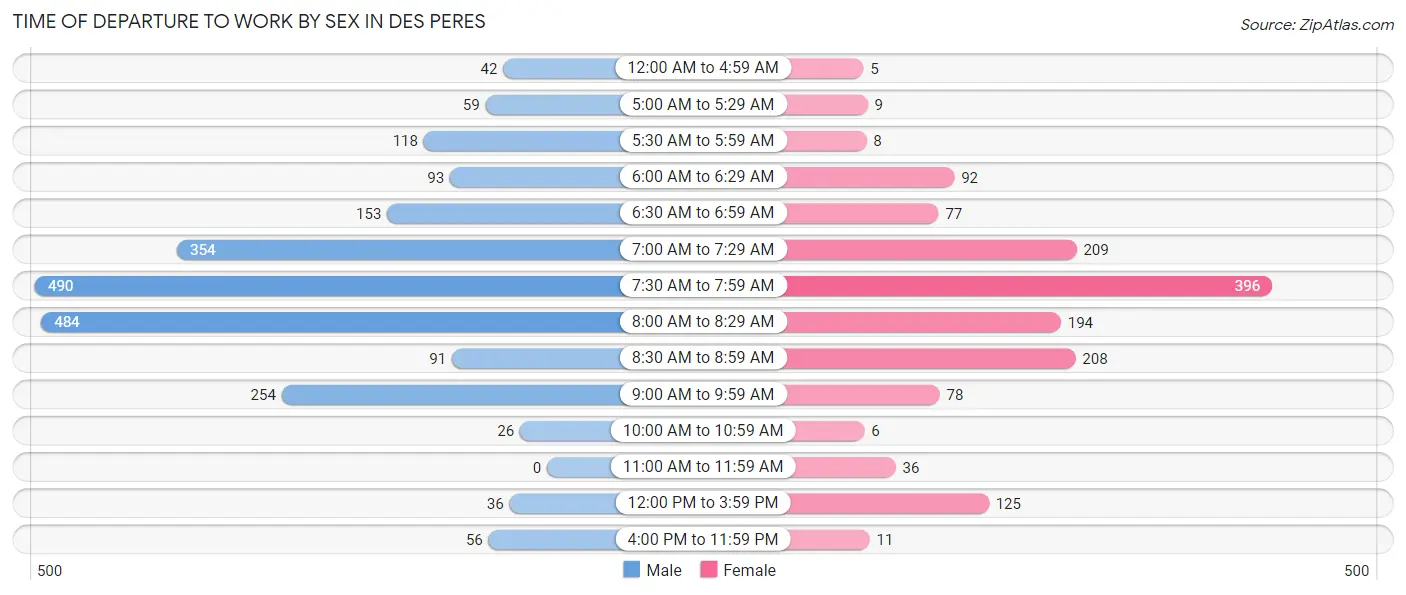
| Time of Departure | Male | Female |
| 12:00 AM to 4:59 AM | 42 (1.9%) | 5 (0.3%) |
| 5:00 AM to 5:29 AM | 59 (2.6%) | 9 (0.6%) |
| 5:30 AM to 5:59 AM | 118 (5.2%) | 8 (0.5%) |
| 6:00 AM to 6:29 AM | 93 (4.1%) | 92 (6.3%) |
| 6:30 AM to 6:59 AM | 153 (6.8%) | 77 (5.3%) |
| 7:00 AM to 7:29 AM | 354 (15.7%) | 209 (14.4%) |
| 7:30 AM to 7:59 AM | 490 (21.7%) | 396 (27.2%) |
| 8:00 AM to 8:29 AM | 484 (21.4%) | 194 (13.3%) |
| 8:30 AM to 8:59 AM | 91 (4.0%) | 208 (14.3%) |
| 9:00 AM to 9:59 AM | 254 (11.3%) | 78 (5.4%) |
| 10:00 AM to 10:59 AM | 26 (1.1%) | 6 (0.4%) |
| 11:00 AM to 11:59 AM | 0 (0.0%) | 36 (2.5%) |
| 12:00 PM to 3:59 PM | 36 (1.6%) | 125 (8.6%) |
| 4:00 PM to 11:59 PM | 56 (2.5%) | 11 (0.8%) |
| Total | 2,256 (100.0%) | 1,454 (100.0%) |
Housing Occupancy in Des Peres
Occupancy by Ownership in Des Peres
Of the total 3,169 dwellings in Des Peres, owner-occupied units account for 3,052 (96.3%), while renter-occupied units make up 117 (3.7%).
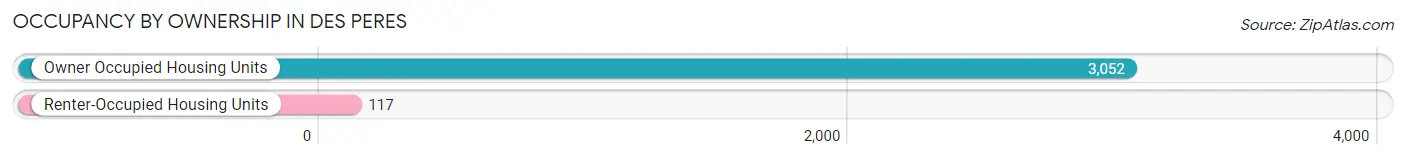
| Occupancy | # Housing Units | % Housing Units |
| Owner Occupied Housing Units | 3,052 | 96.3% |
| Renter-Occupied Housing Units | 117 | 3.7% |
| Total Occupied Housing Units | 3,169 | 100.0% |
Occupancy by Household Size in Des Peres
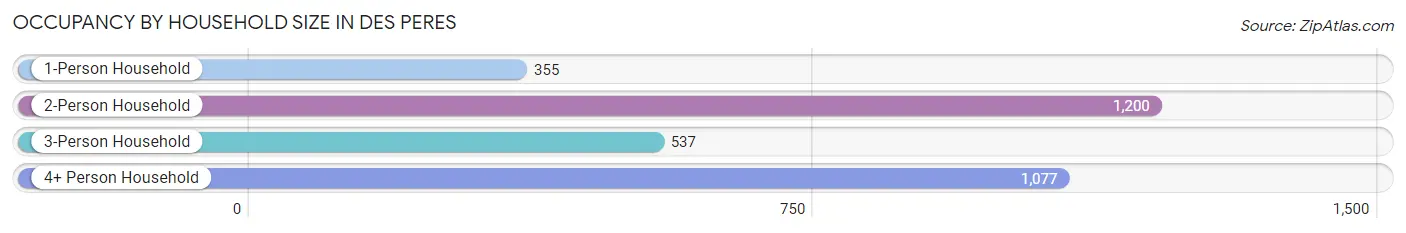
| Household Size | # Housing Units | % Housing Units |
| 1-Person Household | 355 | 11.2% |
| 2-Person Household | 1,200 | 37.9% |
| 3-Person Household | 537 | 17.0% |
| 4+ Person Household | 1,077 | 34.0% |
| Total Housing Units | 3,169 | 100.0% |
Occupancy by Ownership by Household Size in Des Peres
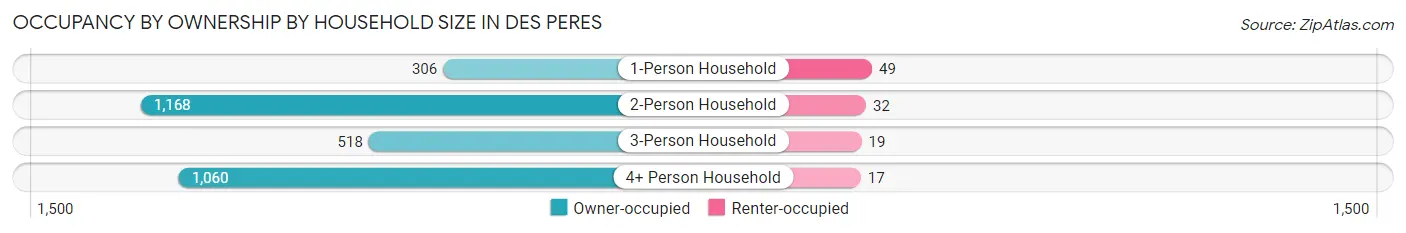
| Household Size | Owner-occupied | Renter-occupied |
| 1-Person Household | 306 (86.2%) | 49 (13.8%) |
| 2-Person Household | 1,168 (97.3%) | 32 (2.7%) |
| 3-Person Household | 518 (96.5%) | 19 (3.5%) |
| 4+ Person Household | 1,060 (98.4%) | 17 (1.6%) |
| Total Housing Units | 3,052 (96.3%) | 117 (3.7%) |
Occupancy by Educational Attainment in Des Peres
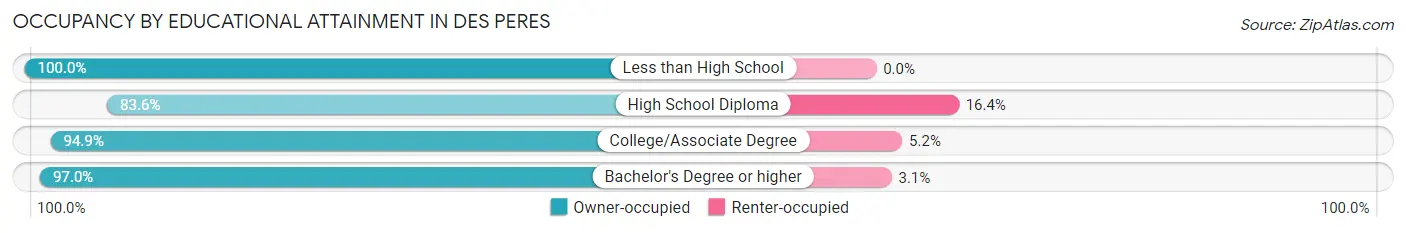
| Household Size | Owner-occupied | Renter-occupied |
| Less than High School | 13 (100.0%) | 0 (0.0%) |
| High School Diploma | 92 (83.6%) | 18 (16.4%) |
| College/Associate Degree | 276 (94.9%) | 15 (5.1%) |
| Bachelor's Degree or higher | 2,671 (97.0%) | 84 (3.0%) |
Occupancy by Age of Householder in Des Peres
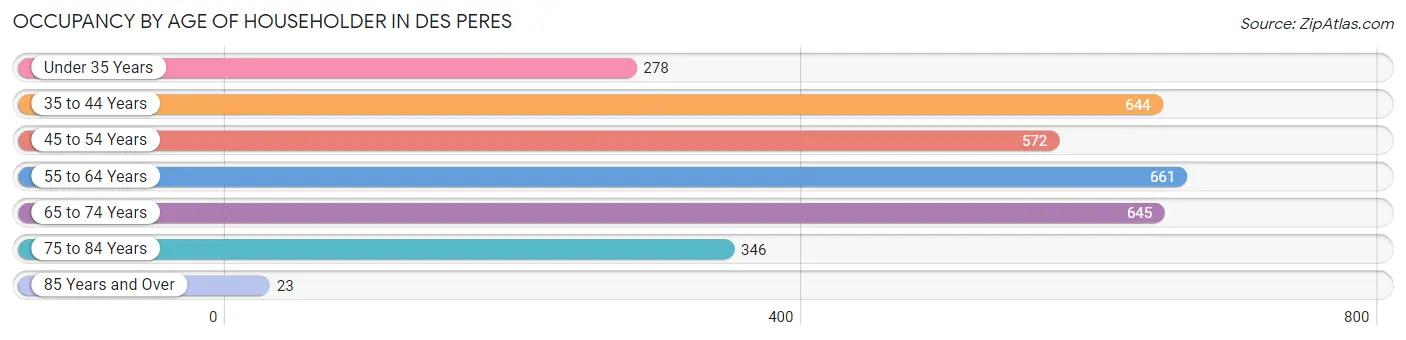
| Age Bracket | # Households | % Households |
| Under 35 Years | 278 | 8.8% |
| 35 to 44 Years | 644 | 20.3% |
| 45 to 54 Years | 572 | 18.0% |
| 55 to 64 Years | 661 | 20.9% |
| 65 to 74 Years | 645 | 20.3% |
| 75 to 84 Years | 346 | 10.9% |
| 85 Years and Over | 23 | 0.7% |
| Total | 3,169 | 100.0% |
Housing Finances in Des Peres
Median Income by Occupancy in Des Peres
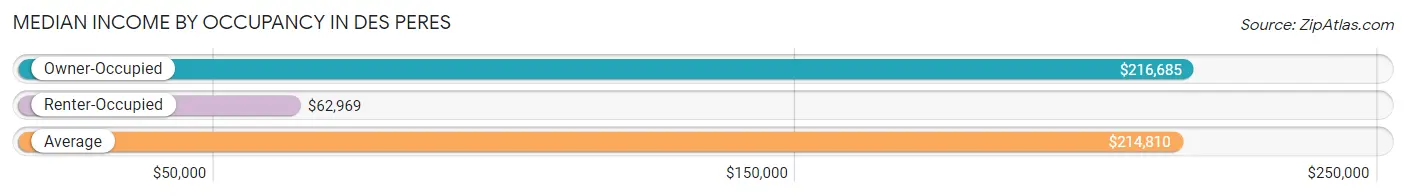
| Occupancy Type | # Households | Median Income |
| Owner-Occupied | 3,052 (96.3%) | $216,685 |
| Renter-Occupied | 117 (3.7%) | $62,969 |
| Average | 3,169 (100.0%) | $214,810 |
Occupancy by Householder Income Bracket in Des Peres
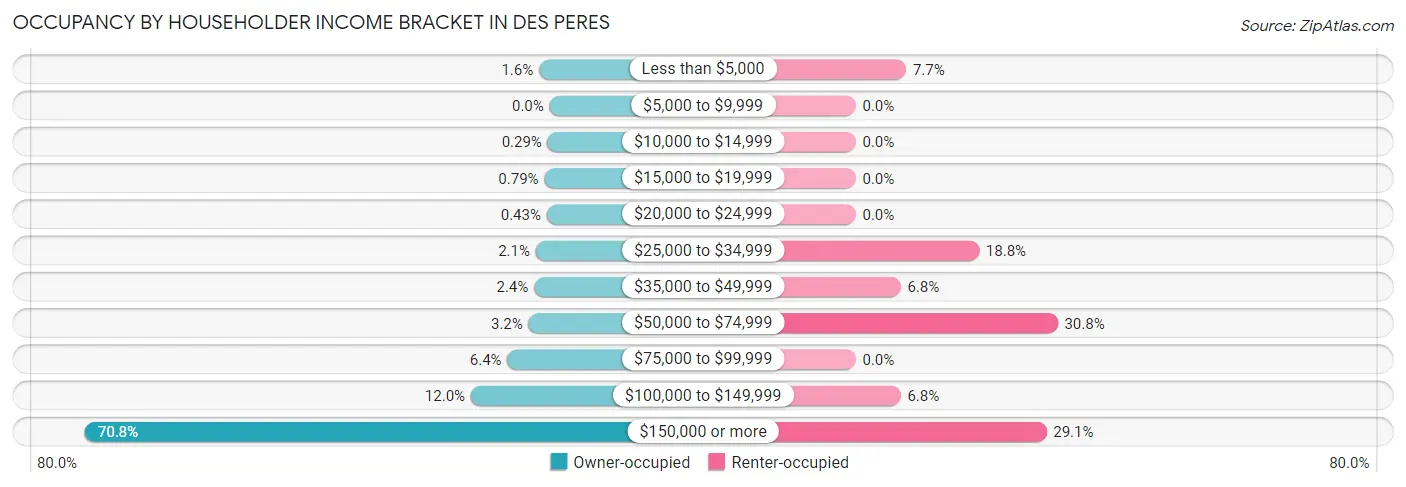
| Income Bracket | Owner-occupied | Renter-occupied |
| Less than $5,000 | 49 (1.6%) | 9 (7.7%) |
| $5,000 to $9,999 | 0 (0.0%) | 0 (0.0%) |
| $10,000 to $14,999 | 9 (0.3%) | 0 (0.0%) |
| $15,000 to $19,999 | 24 (0.8%) | 0 (0.0%) |
| $20,000 to $24,999 | 13 (0.4%) | 0 (0.0%) |
| $25,000 to $34,999 | 64 (2.1%) | 22 (18.8%) |
| $35,000 to $49,999 | 72 (2.4%) | 8 (6.8%) |
| $50,000 to $74,999 | 98 (3.2%) | 36 (30.8%) |
| $75,000 to $99,999 | 196 (6.4%) | 0 (0.0%) |
| $100,000 to $149,999 | 366 (12.0%) | 8 (6.8%) |
| $150,000 or more | 2,161 (70.8%) | 34 (29.1%) |
| Total | 3,052 (100.0%) | 117 (100.0%) |
Monthly Housing Cost Tiers in Des Peres
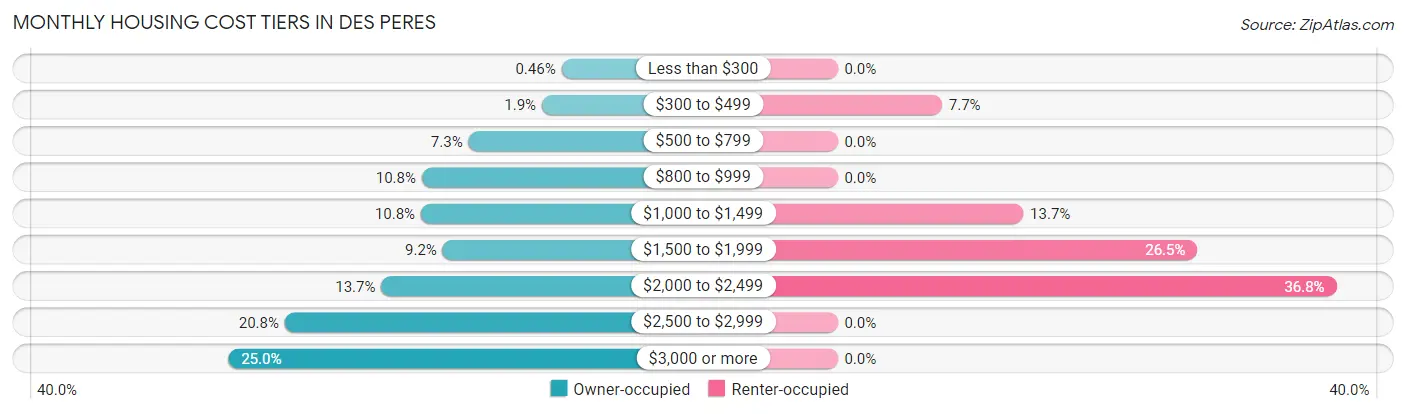
| Monthly Cost | Owner-occupied | Renter-occupied |
| Less than $300 | 14 (0.5%) | 0 (0.0%) |
| $300 to $499 | 58 (1.9%) | 9 (7.7%) |
| $500 to $799 | 223 (7.3%) | 0 (0.0%) |
| $800 to $999 | 328 (10.7%) | 0 (0.0%) |
| $1,000 to $1,499 | 330 (10.8%) | 16 (13.7%) |
| $1,500 to $1,999 | 281 (9.2%) | 31 (26.5%) |
| $2,000 to $2,499 | 419 (13.7%) | 43 (36.7%) |
| $2,500 to $2,999 | 636 (20.8%) | 0 (0.0%) |
| $3,000 or more | 763 (25.0%) | 0 (0.0%) |
| Total | 3,052 (100.0%) | 117 (100.0%) |
Physical Housing Characteristics in Des Peres
Housing Structures in Des Peres
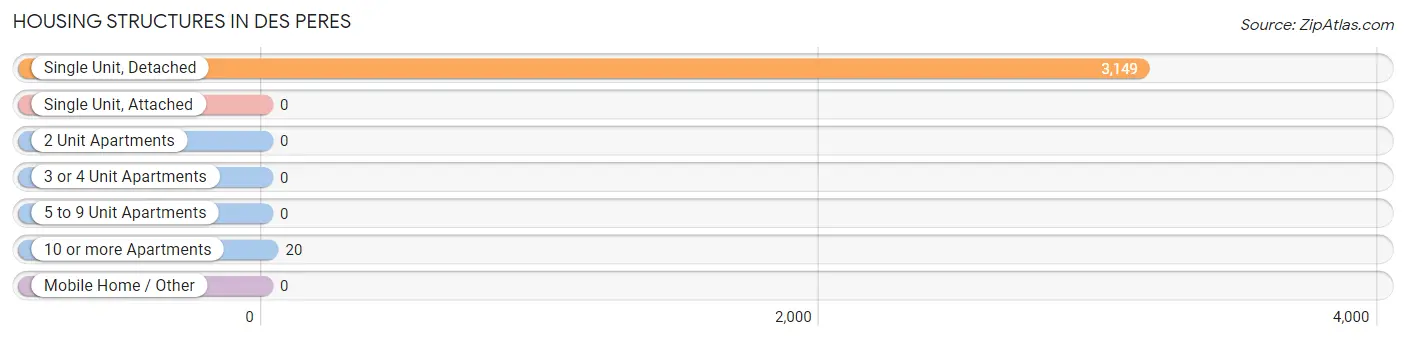
| Structure Type | # Housing Units | % Housing Units |
| Single Unit, Detached | 3,149 | 99.4% |
| Single Unit, Attached | 0 | 0.0% |
| 2 Unit Apartments | 0 | 0.0% |
| 3 or 4 Unit Apartments | 0 | 0.0% |
| 5 to 9 Unit Apartments | 0 | 0.0% |
| 10 or more Apartments | 20 | 0.6% |
| Mobile Home / Other | 0 | 0.0% |
| Total | 3,169 | 100.0% |
Housing Structures by Occupancy in Des Peres
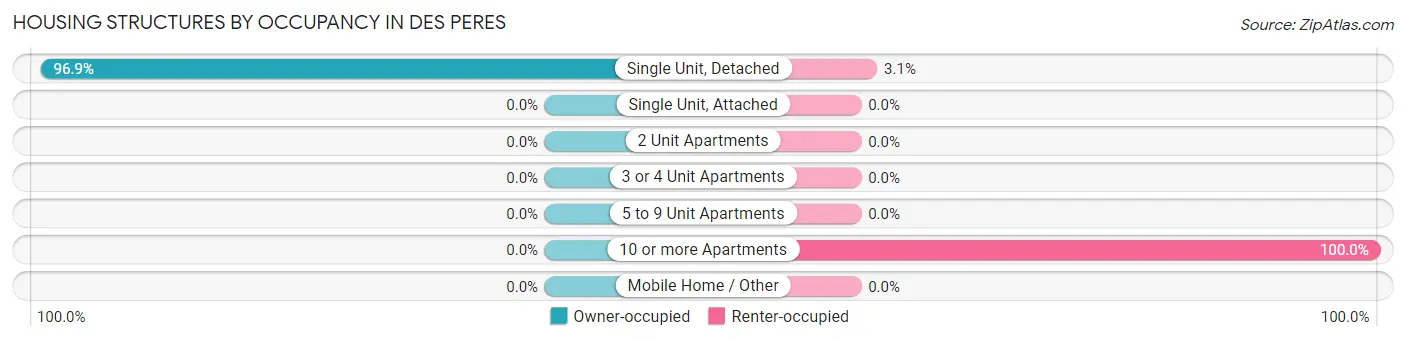
| Structure Type | Owner-occupied | Renter-occupied |
| Single Unit, Detached | 3,052 (96.9%) | 97 (3.1%) |
| Single Unit, Attached | 0 (0.0%) | 0 (0.0%) |
| 2 Unit Apartments | 0 (0.0%) | 0 (0.0%) |
| 3 or 4 Unit Apartments | 0 (0.0%) | 0 (0.0%) |
| 5 to 9 Unit Apartments | 0 (0.0%) | 0 (0.0%) |
| 10 or more Apartments | 0 (0.0%) | 20 (100.0%) |
| Mobile Home / Other | 0 (0.0%) | 0 (0.0%) |
| Total | 3,052 (96.3%) | 117 (3.7%) |
Housing Structures by Number of Rooms in Des Peres
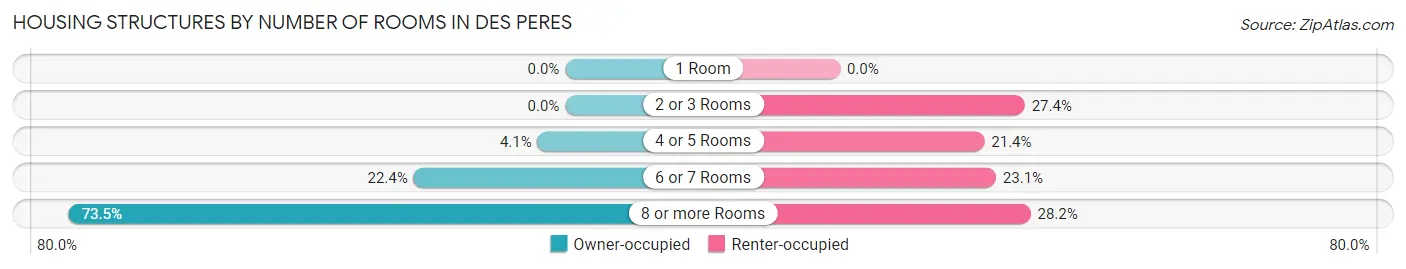
| Number of Rooms | Owner-occupied | Renter-occupied |
| 1 Room | 0 (0.0%) | 0 (0.0%) |
| 2 or 3 Rooms | 0 (0.0%) | 32 (27.4%) |
| 4 or 5 Rooms | 125 (4.1%) | 25 (21.4%) |
| 6 or 7 Rooms | 685 (22.4%) | 27 (23.1%) |
| 8 or more Rooms | 2,242 (73.5%) | 33 (28.2%) |
| Total | 3,052 (100.0%) | 117 (100.0%) |
Housing Structure by Heating Type in Des Peres
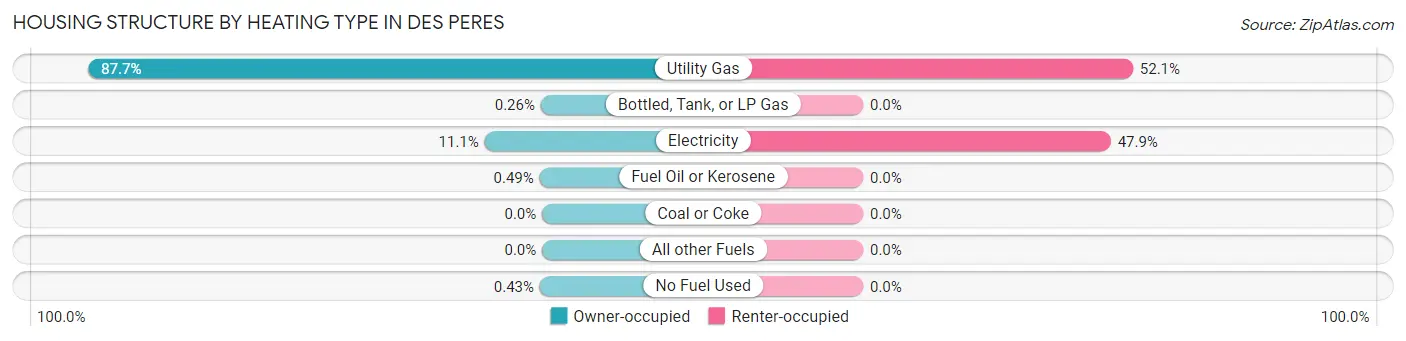
| Heating Type | Owner-occupied | Renter-occupied |
| Utility Gas | 2,677 (87.7%) | 61 (52.1%) |
| Bottled, Tank, or LP Gas | 8 (0.3%) | 0 (0.0%) |
| Electricity | 339 (11.1%) | 56 (47.9%) |
| Fuel Oil or Kerosene | 15 (0.5%) | 0 (0.0%) |
| Coal or Coke | 0 (0.0%) | 0 (0.0%) |
| All other Fuels | 0 (0.0%) | 0 (0.0%) |
| No Fuel Used | 13 (0.4%) | 0 (0.0%) |
| Total | 3,052 (100.0%) | 117 (100.0%) |
Household Vehicle Usage in Des Peres
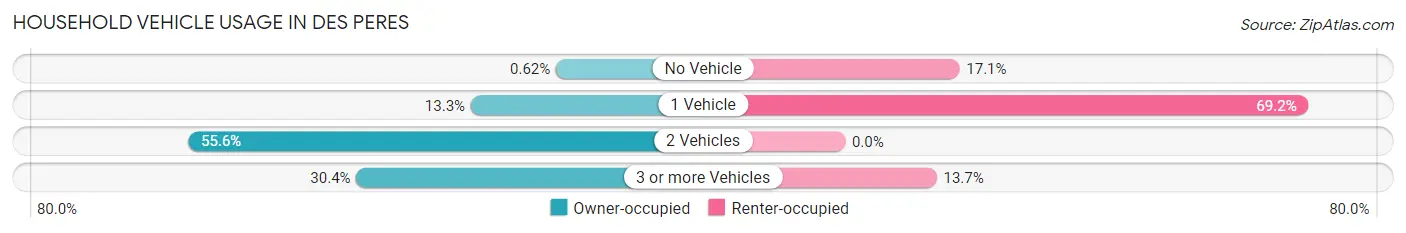
| Vehicles per Household | Owner-occupied | Renter-occupied |
| No Vehicle | 19 (0.6%) | 20 (17.1%) |
| 1 Vehicle | 407 (13.3%) | 81 (69.2%) |
| 2 Vehicles | 1,697 (55.6%) | 0 (0.0%) |
| 3 or more Vehicles | 929 (30.4%) | 16 (13.7%) |
| Total | 3,052 (100.0%) | 117 (100.0%) |
Real Estate & Mortgages in Des Peres
Real Estate and Mortgage Overview in Des Peres
| Characteristic | Without Mortgage | With Mortgage |
| Housing Units | 912 | 2,140 |
| Median Property Value | $489,400 | $590,900 |
| Median Household Income | $156,591 | $1,665 |
| Monthly Housing Costs | $934 | $763 |
| Real Estate Taxes | $5,672 | $11 |
Property Value by Mortgage Status in Des Peres
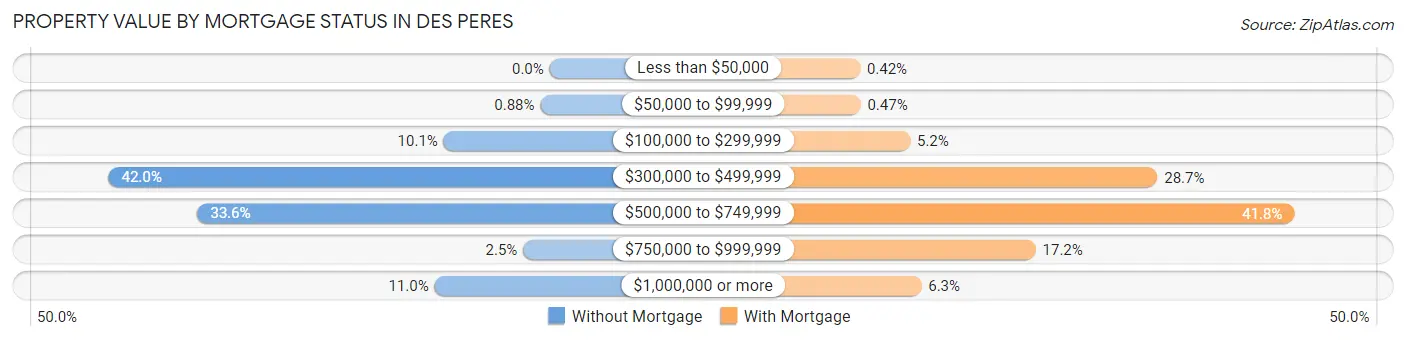
| Property Value | Without Mortgage | With Mortgage |
| Less than $50,000 | 0 (0.0%) | 9 (0.4%) |
| $50,000 to $99,999 | 8 (0.9%) | 10 (0.5%) |
| $100,000 to $299,999 | 92 (10.1%) | 111 (5.2%) |
| $300,000 to $499,999 | 383 (42.0%) | 615 (28.7%) |
| $500,000 to $749,999 | 306 (33.6%) | 894 (41.8%) |
| $750,000 to $999,999 | 23 (2.5%) | 367 (17.2%) |
| $1,000,000 or more | 100 (11.0%) | 134 (6.3%) |
| Total | 912 (100.0%) | 2,140 (100.0%) |
Household Income by Mortgage Status in Des Peres
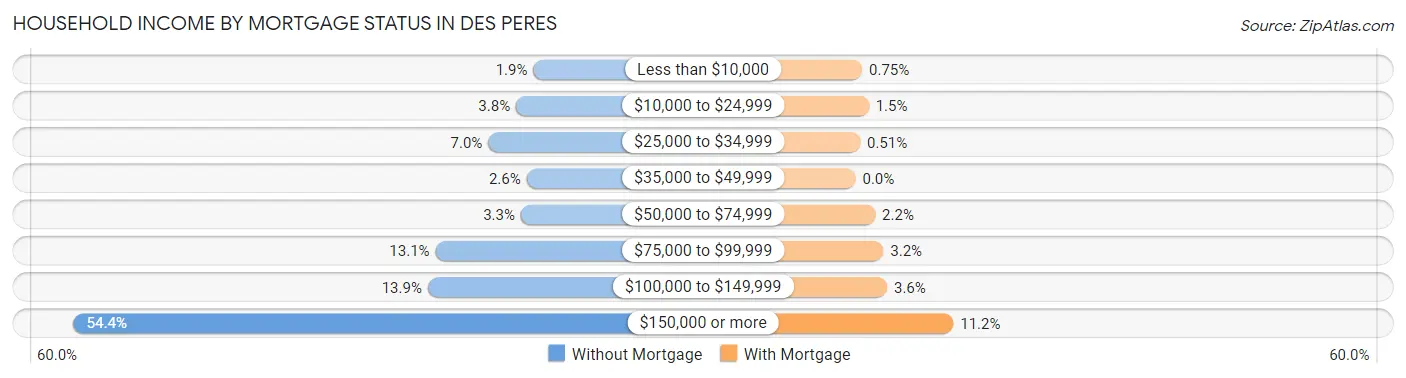
| Household Income | Without Mortgage | With Mortgage |
| Less than $10,000 | 17 (1.9%) | 16 (0.7%) |
| $10,000 to $24,999 | 35 (3.8%) | 32 (1.5%) |
| $25,000 to $34,999 | 64 (7.0%) | 11 (0.5%) |
| $35,000 to $49,999 | 24 (2.6%) | 0 (0.0%) |
| $50,000 to $74,999 | 30 (3.3%) | 48 (2.2%) |
| $75,000 to $99,999 | 119 (13.1%) | 68 (3.2%) |
| $100,000 to $149,999 | 127 (13.9%) | 77 (3.6%) |
| $150,000 or more | 496 (54.4%) | 239 (11.2%) |
| Total | 912 (100.0%) | 2,140 (100.0%) |
Property Value to Household Income Ratio in Des Peres
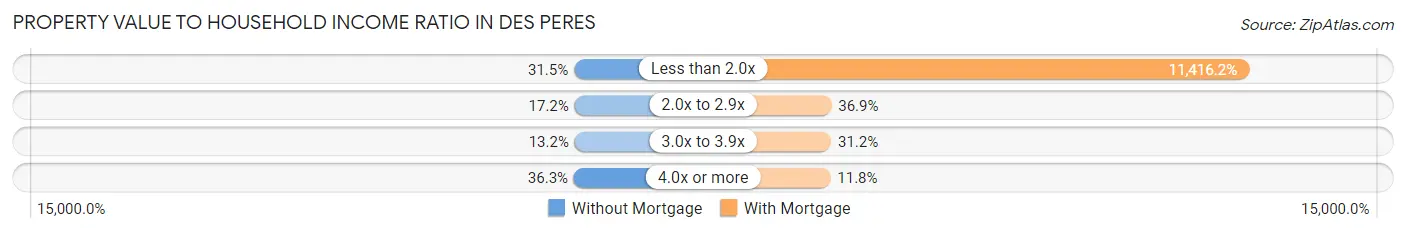
| Value-to-Income Ratio | Without Mortgage | With Mortgage |
| Less than 2.0x | 287 (31.5%) | 244,306 (11,416.2%) |
| 2.0x to 2.9x | 157 (17.2%) | 790 (36.9%) |
| 3.0x to 3.9x | 120 (13.2%) | 667 (31.2%) |
| 4.0x or more | 331 (36.3%) | 253 (11.8%) |
| Total | 912 (100.0%) | 2,140 (100.0%) |
Real Estate Taxes by Mortgage Status in Des Peres
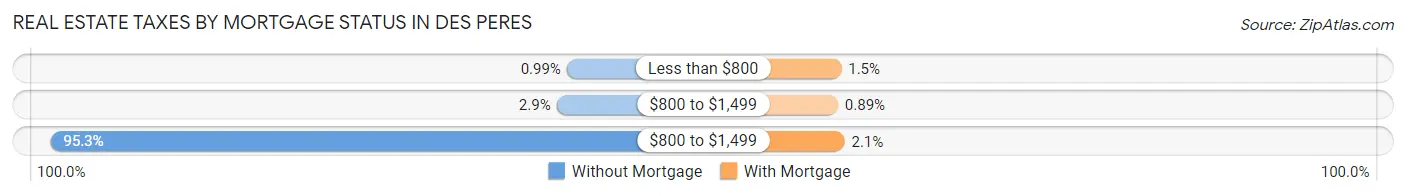
| Property Taxes | Without Mortgage | With Mortgage |
| Less than $800 | 9 (1.0%) | 32 (1.5%) |
| $800 to $1,499 | 26 (2.9%) | 19 (0.9%) |
| $800 to $1,499 | 869 (95.3%) | 45 (2.1%) |
| Total | 912 (100.0%) | 2,140 (100.0%) |
Health & Disability in Des Peres
Health Insurance Coverage by Age in Des Peres
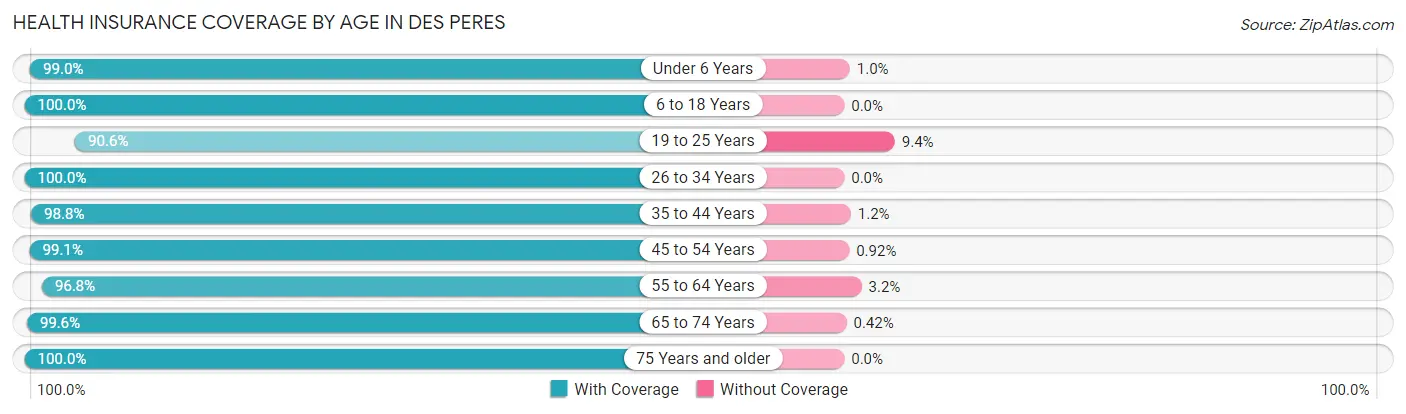
| Age Bracket | With Coverage | Without Coverage |
| Under 6 Years | 668 (99.0%) | 7 (1.0%) |
| 6 to 18 Years | 1,885 (100.0%) | 0 (0.0%) |
| 19 to 25 Years | 279 (90.6%) | 29 (9.4%) |
| 26 to 34 Years | 562 (100.0%) | 0 (0.0%) |
| 35 to 44 Years | 1,377 (98.8%) | 17 (1.2%) |
| 45 to 54 Years | 973 (99.1%) | 9 (0.9%) |
| 55 to 64 Years | 1,258 (96.8%) | 42 (3.2%) |
| 65 to 74 Years | 1,181 (99.6%) | 5 (0.4%) |
| 75 Years and older | 669 (100.0%) | 0 (0.0%) |
| Total | 8,852 (98.8%) | 109 (1.2%) |
Health Insurance Coverage by Citizenship Status in Des Peres
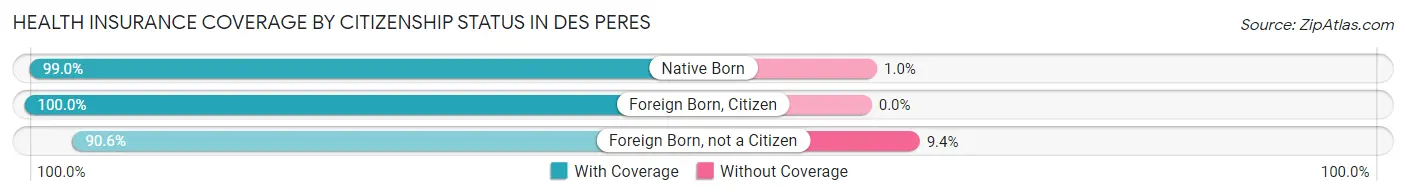
| Citizenship Status | With Coverage | Without Coverage |
| Native Born | 668 (99.0%) | 7 (1.0%) |
| Foreign Born, Citizen | 1,885 (100.0%) | 0 (0.0%) |
| Foreign Born, not a Citizen | 279 (90.6%) | 29 (9.4%) |
Health Insurance Coverage by Household Income in Des Peres
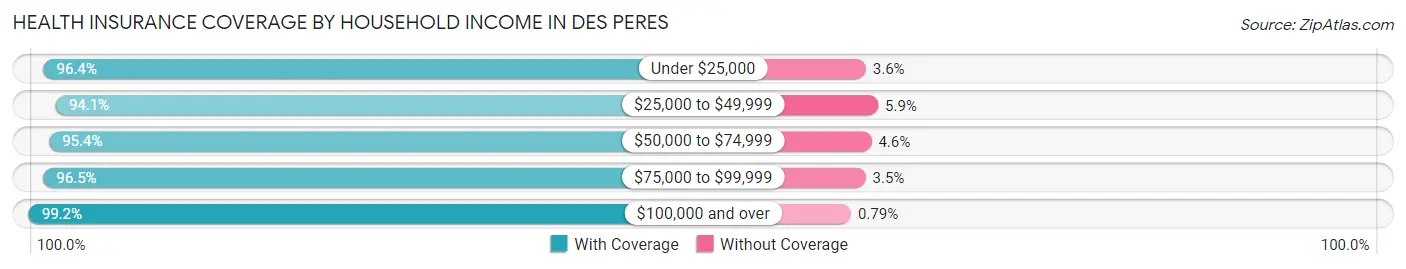
| Household Income | With Coverage | Without Coverage |
| Under $25,000 | 135 (96.4%) | 5 (3.6%) |
| $25,000 to $49,999 | 240 (94.1%) | 15 (5.9%) |
| $50,000 to $74,999 | 289 (95.4%) | 14 (4.6%) |
| $75,000 to $99,999 | 355 (96.5%) | 13 (3.5%) |
| $100,000 and over | 7,828 (99.2%) | 62 (0.8%) |
Public vs Private Health Insurance Coverage by Age in Des Peres
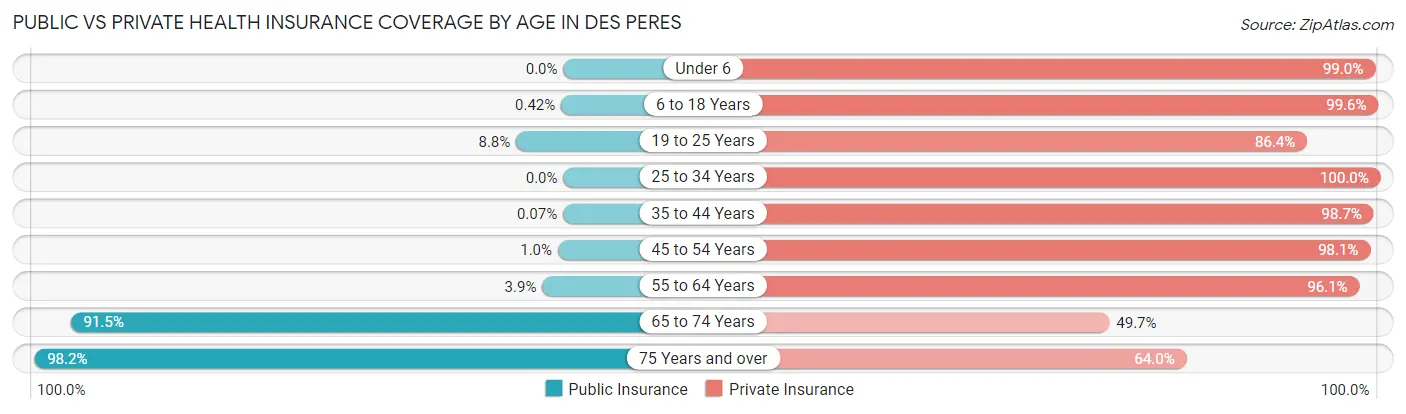
| Age Bracket | Public Insurance | Private Insurance |
| Under 6 | 0 (0.0%) | 668 (99.0%) |
| 6 to 18 Years | 8 (0.4%) | 1,877 (99.6%) |
| 19 to 25 Years | 27 (8.8%) | 266 (86.4%) |
| 25 to 34 Years | 0 (0.0%) | 562 (100.0%) |
| 35 to 44 Years | 1 (0.1%) | 1,376 (98.7%) |
| 45 to 54 Years | 10 (1.0%) | 963 (98.1%) |
| 55 to 64 Years | 51 (3.9%) | 1,249 (96.1%) |
| 65 to 74 Years | 1,085 (91.5%) | 589 (49.7%) |
| 75 Years and over | 657 (98.2%) | 428 (64.0%) |
| Total | 1,839 (20.5%) | 7,978 (89.0%) |
Disability Status by Sex by Age in Des Peres
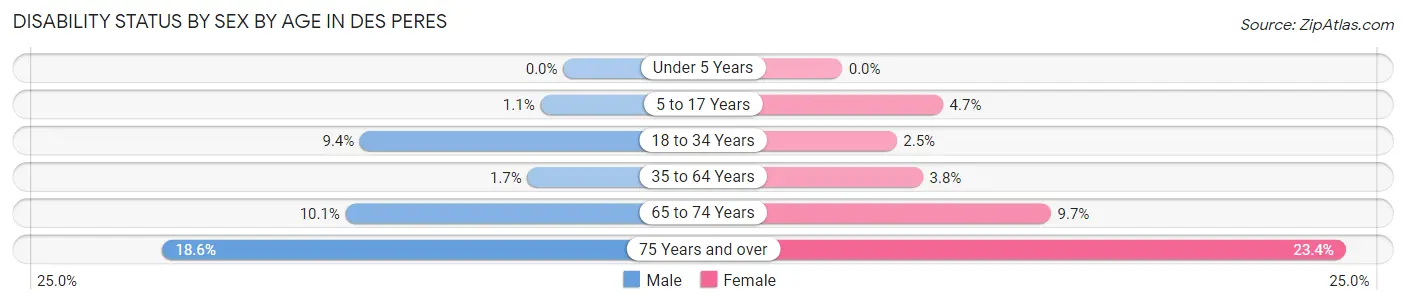
| Age Bracket | Male | Female |
| Under 5 Years | 0 (0.0%) | 0 (0.0%) |
| 5 to 17 Years | 11 (1.1%) | 42 (4.7%) |
| 18 to 34 Years | 43 (9.4%) | 12 (2.5%) |
| 35 to 64 Years | 30 (1.7%) | 70 (3.7%) |
| 65 to 74 Years | 52 (10.1%) | 65 (9.7%) |
| 75 Years and over | 64 (18.6%) | 76 (23.4%) |
Disability Class by Sex by Age in Des Peres
Disability Class: Hearing Difficulty
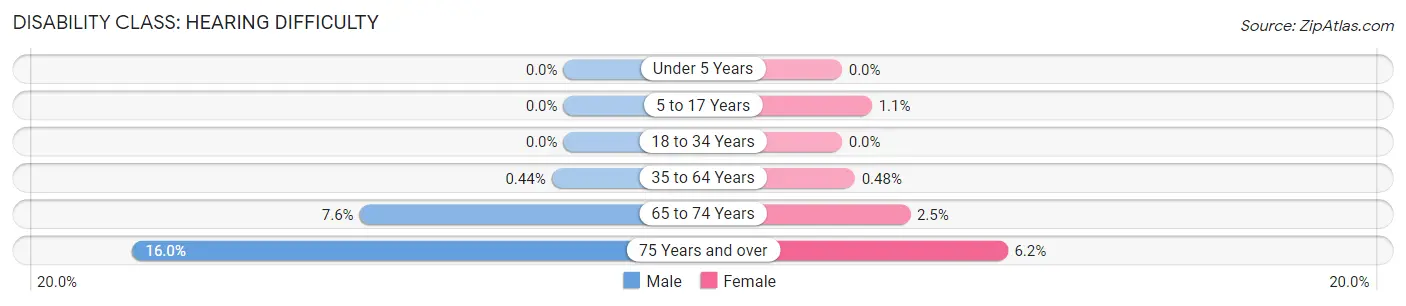
| Age Bracket | Male | Female |
| Under 5 Years | 0 (0.0%) | 0 (0.0%) |
| 5 to 17 Years | 0 (0.0%) | 10 (1.1%) |
| 18 to 34 Years | 0 (0.0%) | 0 (0.0%) |
| 35 to 64 Years | 8 (0.4%) | 9 (0.5%) |
| 65 to 74 Years | 39 (7.6%) | 17 (2.5%) |
| 75 Years and over | 55 (16.0%) | 20 (6.1%) |
Disability Class: Vision Difficulty
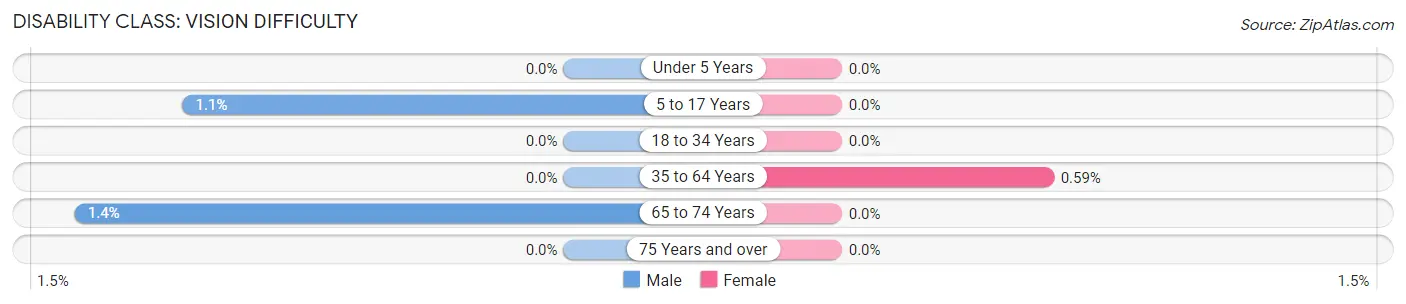
| Age Bracket | Male | Female |
| Under 5 Years | 0 (0.0%) | 0 (0.0%) |
| 5 to 17 Years | 11 (1.1%) | 0 (0.0%) |
| 18 to 34 Years | 0 (0.0%) | 0 (0.0%) |
| 35 to 64 Years | 0 (0.0%) | 11 (0.6%) |
| 65 to 74 Years | 7 (1.4%) | 0 (0.0%) |
| 75 Years and over | 0 (0.0%) | 0 (0.0%) |
Disability Class: Cognitive Difficulty
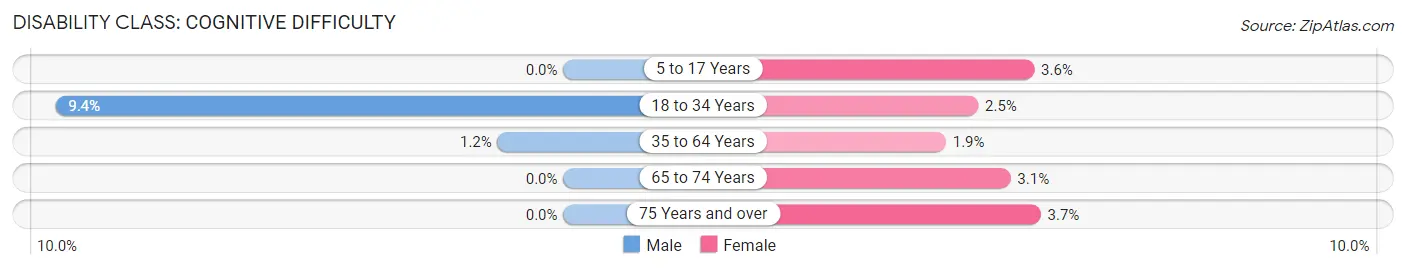
| Age Bracket | Male | Female |
| 5 to 17 Years | 0 (0.0%) | 32 (3.6%) |
| 18 to 34 Years | 43 (9.4%) | 12 (2.5%) |
| 35 to 64 Years | 22 (1.2%) | 36 (1.9%) |
| 65 to 74 Years | 0 (0.0%) | 21 (3.1%) |
| 75 Years and over | 0 (0.0%) | 12 (3.7%) |
Disability Class: Ambulatory Difficulty
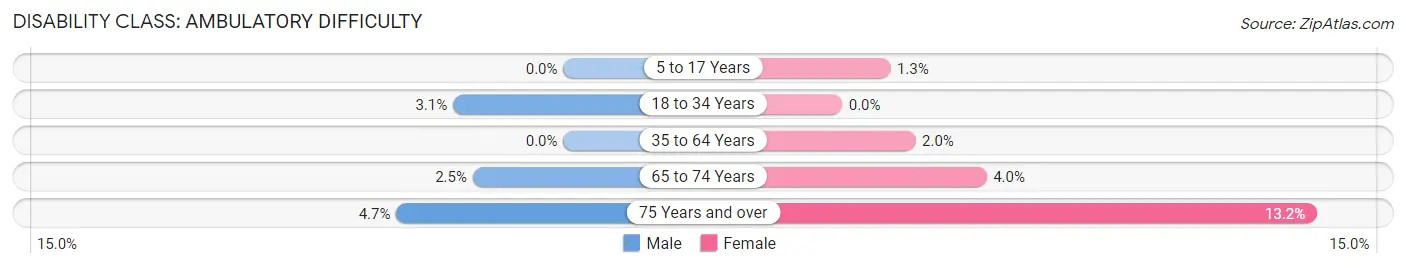
| Age Bracket | Male | Female |
| 5 to 17 Years | 0 (0.0%) | 12 (1.3%) |
| 18 to 34 Years | 14 (3.1%) | 0 (0.0%) |
| 35 to 64 Years | 0 (0.0%) | 38 (2.0%) |
| 65 to 74 Years | 13 (2.5%) | 27 (4.0%) |
| 75 Years and over | 16 (4.6%) | 43 (13.2%) |
Disability Class: Self-Care Difficulty
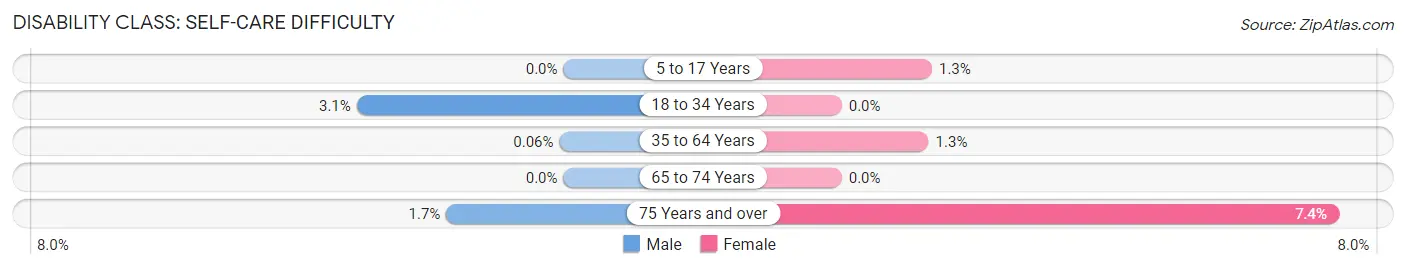
| Age Bracket | Male | Female |
| 5 to 17 Years | 0 (0.0%) | 12 (1.3%) |
| 18 to 34 Years | 14 (3.1%) | 0 (0.0%) |
| 35 to 64 Years | 1 (0.1%) | 24 (1.3%) |
| 65 to 74 Years | 0 (0.0%) | 0 (0.0%) |
| 75 Years and over | 6 (1.7%) | 24 (7.4%) |
Technology Access in Des Peres
Computing Device Access in Des Peres
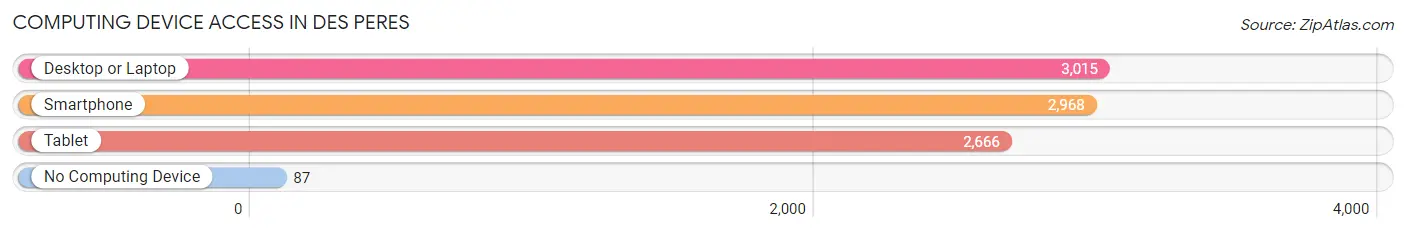
| Device Type | # Households | % Households |
| Desktop or Laptop | 3,015 | 95.1% |
| Smartphone | 2,968 | 93.7% |
| Tablet | 2,666 | 84.1% |
| No Computing Device | 87 | 2.8% |
| Total | 3,169 | 100.0% |
Internet Access in Des Peres
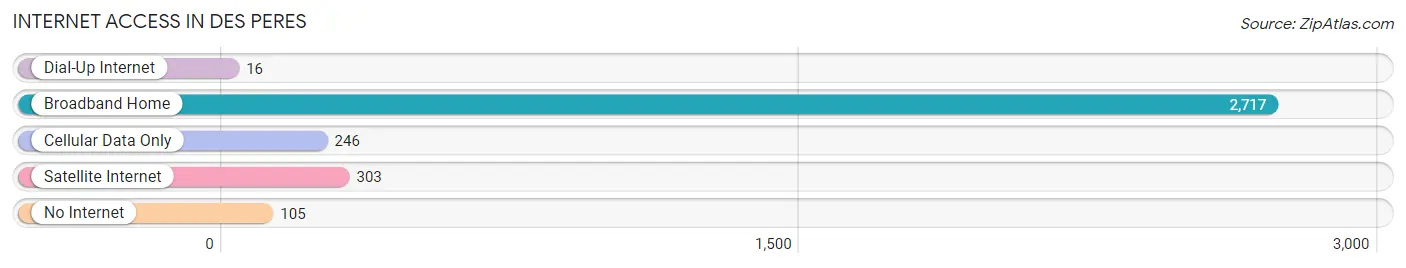
| Internet Type | # Households | % Households |
| Dial-Up Internet | 16 | 0.5% |
| Broadband Home | 2,717 | 85.7% |
| Cellular Data Only | 246 | 7.8% |
| Satellite Internet | 303 | 9.6% |
| No Internet | 105 | 3.3% |
| Total | 3,169 | 100.0% |
Des Peres Summary
Peres, Missouri is a small city located in St. Louis County, Missouri. It is a suburb of St. Louis and is located approximately 15 miles west of the city. The city was incorporated in 1950 and has a population of 8,573 as of the 2010 census.
History
The area that is now Peres was originally inhabited by the Osage Indians. The first European settlers arrived in the area in the early 1800s. The area was originally known as "Gravois Settlement" and was named after the Gravois Creek which runs through the area. The area was later renamed "Des Peres" after the French phrase meaning "of the fathers".
The area was primarily agricultural until the 1950s when it began to experience rapid growth due to its proximity to St. Louis. The city was officially incorporated in 1950 and has since grown to its current population of 8,573.
Geography
Peres is located in St. Louis County, Missouri. It is situated approximately 15 miles west of St. Louis and is bordered by the cities of Ballwin, Manchester, and Kirkwood. The city has a total area of 4.2 square miles, all of which is land.
The city is located in the Missouri River Valley and is surrounded by rolling hills. The city is home to several parks and recreational areas, including Des Peres Park, which is the largest park in the city.
Economy
The economy of Peres is largely based on retail and services. The city is home to several shopping centers and retail stores, including West County Center, which is the largest shopping mall in the St. Louis area. The city is also home to several corporate headquarters, including Express Scripts, which is the largest employer in the city.
The city also has a strong manufacturing sector, with several factories located in the city. The city is home to several automotive parts manufacturers, including the Ford Motor Company.
Demographics
As of the 2010 census, the population of Peres was 8,573. The racial makeup of the city was 87.3% White, 5.3% African American, 0.3% Native American, 3.2% Asian, and 3.9% from other races. Hispanic or Latino of any race were 6.2% of the population.
The median household income in Peres was $76,945 in 2017. The median home value was $310,000 in 2017. The city has a high rate of homeownership, with 73.3% of residents owning their homes.
Conclusion
Peres, Missouri is a small city located in St. Louis County, Missouri. It is a suburb of St. Louis and is located approximately 15 miles west of the city. The city was incorporated in 1950 and has a population of 8,573 as of the 2010 census. The economy of Peres is largely based on retail and services, with several shopping centers and corporate headquarters located in the city. The city also has a strong manufacturing sector, with several factories located in the city. The racial makeup of the city is 87.3% White, 5.3% African American, 0.3% Native American, 3.2% Asian, and 3.9% from other races. The median household income in Peres was $76,945 in 2017 and the median home value was $310,000 in 2017.
Common Questions
What is Per Capita Income in Des Peres?
Per Capita income in Des Peres is $105,354.
What is the Median Family Income in Des Peres?
Median Family Income in Des Peres is $234,632.
What is the Median Household income in Des Peres?
Median Household Income in Des Peres is $214,810.
What is Income or Wage Gap in Des Peres?
Income or Wage Gap in Des Peres is 54.7%.
Women in Des Peres earn 45.3 cents for every dollar earned by a man.
What is Inequality or Gini Index in Des Peres?
Inequality or Gini Index in Des Peres is 0.45.
What is the Total Population of Des Peres?
Total Population of Des Peres is 9,140.
What is the Total Male Population of Des Peres?
Total Male Population of Des Peres is 4,491.
What is the Total Female Population of Des Peres?
Total Female Population of Des Peres is 4,649.
What is the Ratio of Males per 100 Females in Des Peres?
There are 96.60 Males per 100 Females in Des Peres.
What is the Ratio of Females per 100 Males in Des Peres?
There are 103.52 Females per 100 Males in Des Peres.
What is the Median Population Age in Des Peres?
Median Population Age in Des Peres is 42.8 Years.
What is the Average Family Size in Des Peres
Average Family Size in Des Peres is 3.0 People.
What is the Average Household Size in Des Peres
Average Household Size in Des Peres is 2.8 People.
How Large is the Labor Force in Des Peres?
There are 4,439 People in the Labor Forcein in Des Peres.
What is the Percentage of People in the Labor Force in Des Peres?
64.6% of People are in the Labor Force in Des Peres.
What is the Unemployment Rate in Des Peres?
Unemployment Rate in Des Peres is 0.5%.