Town and Country, MO Map & Demographics
Town and Country Map
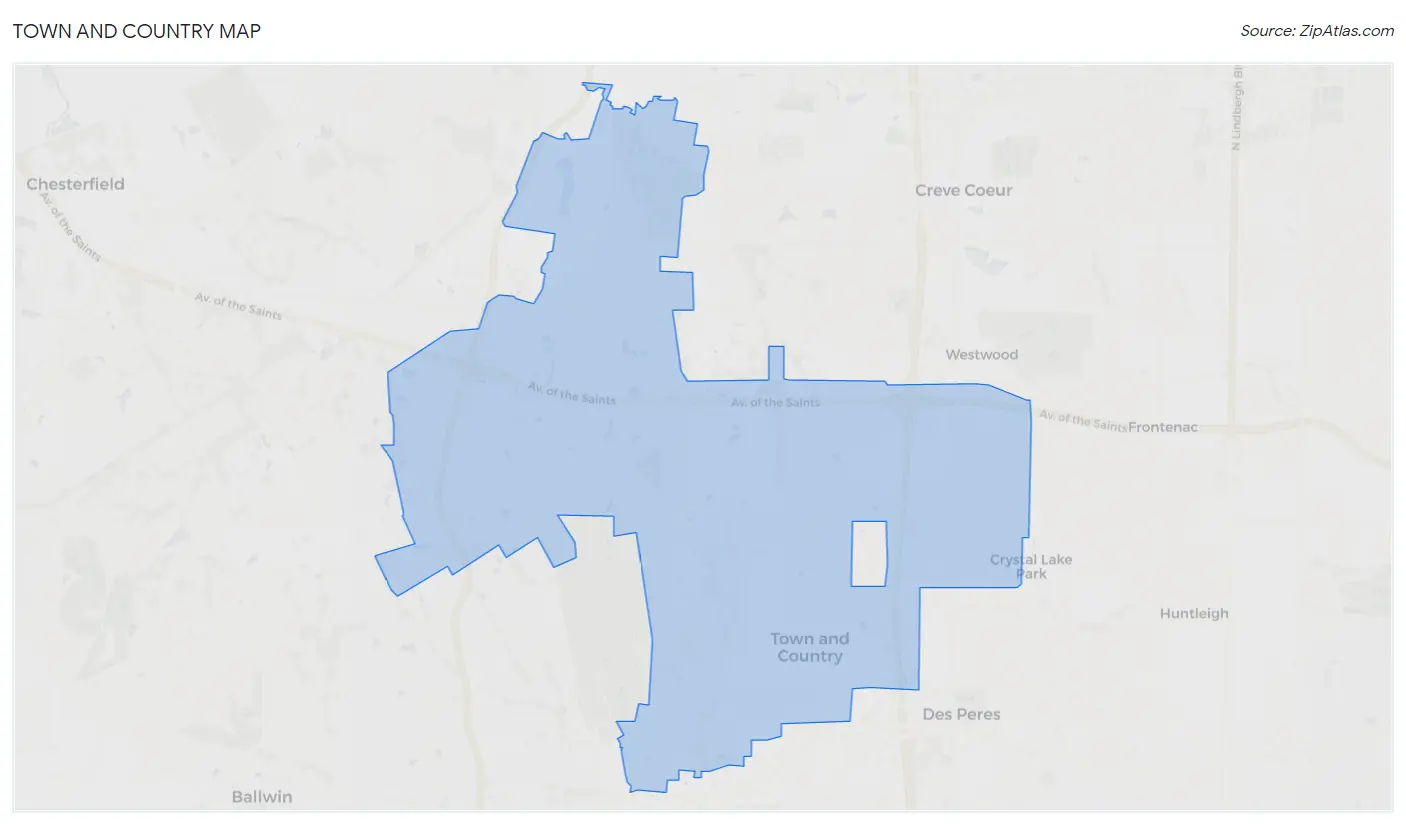
Town and Country Overview
$116,907
PER CAPITA INCOME
$250,001
AVG FAMILY INCOME
$231,382
AVG HOUSEHOLD INCOME
74.1%
WAGE / INCOME GAP [ % ]
25.9¢/ $1
WAGE / INCOME GAP [ $ ]
0.48
INEQUALITY / GINI INDEX
11,575
TOTAL POPULATION
5,891
MALE POPULATION
5,684
FEMALE POPULATION
103.64
MALES / 100 FEMALES
96.49
FEMALES / 100 MALES
50.6
MEDIAN AGE
2.9
AVG FAMILY SIZE
2.5
AVG HOUSEHOLD SIZE
5,135
LABOR FORCE [ PEOPLE ]
53.2%
PERCENT IN LABOR FORCE
3.3%
UNEMPLOYMENT RATE
Income in Town and Country
Income Overview in Town and Country
Per Capita Income in Town and Country is $116,907, while median incomes of families and households are $250,001 and $231,382 respectively.
| Characteristic | Number | Measure |
| Per Capita Income | 11,575 | $116,907 |
| Median Family Income | 3,364 | $250,001 |
| Mean Family Income | 3,364 | $367,202 |
| Median Household Income | 4,147 | $231,382 |
| Mean Household Income | 4,147 | $321,572 |
| Income Deficit | 3,364 | $0 |
| Wage / Income Gap (%) | 11,575 | 74.15% |
| Wage / Income Gap ($) | 11,575 | 25.85¢ per $1 |
| Gini / Inequality Index | 11,575 | 0.48 |
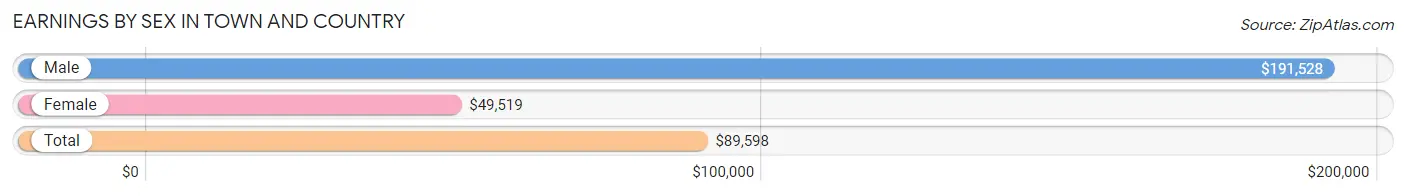
Earnings by Sex in Town and Country
Average Earnings in Town and Country are $89,598, $191,528 for men and $49,519 for women, a difference of 74.2%.
| Sex | Number | Average Earnings |
| Male | 3,325 (59.3%) | $191,528 |
| Female | 2,283 (40.7%) | $49,519 |
| Total | 5,608 (100.0%) | $89,598 |
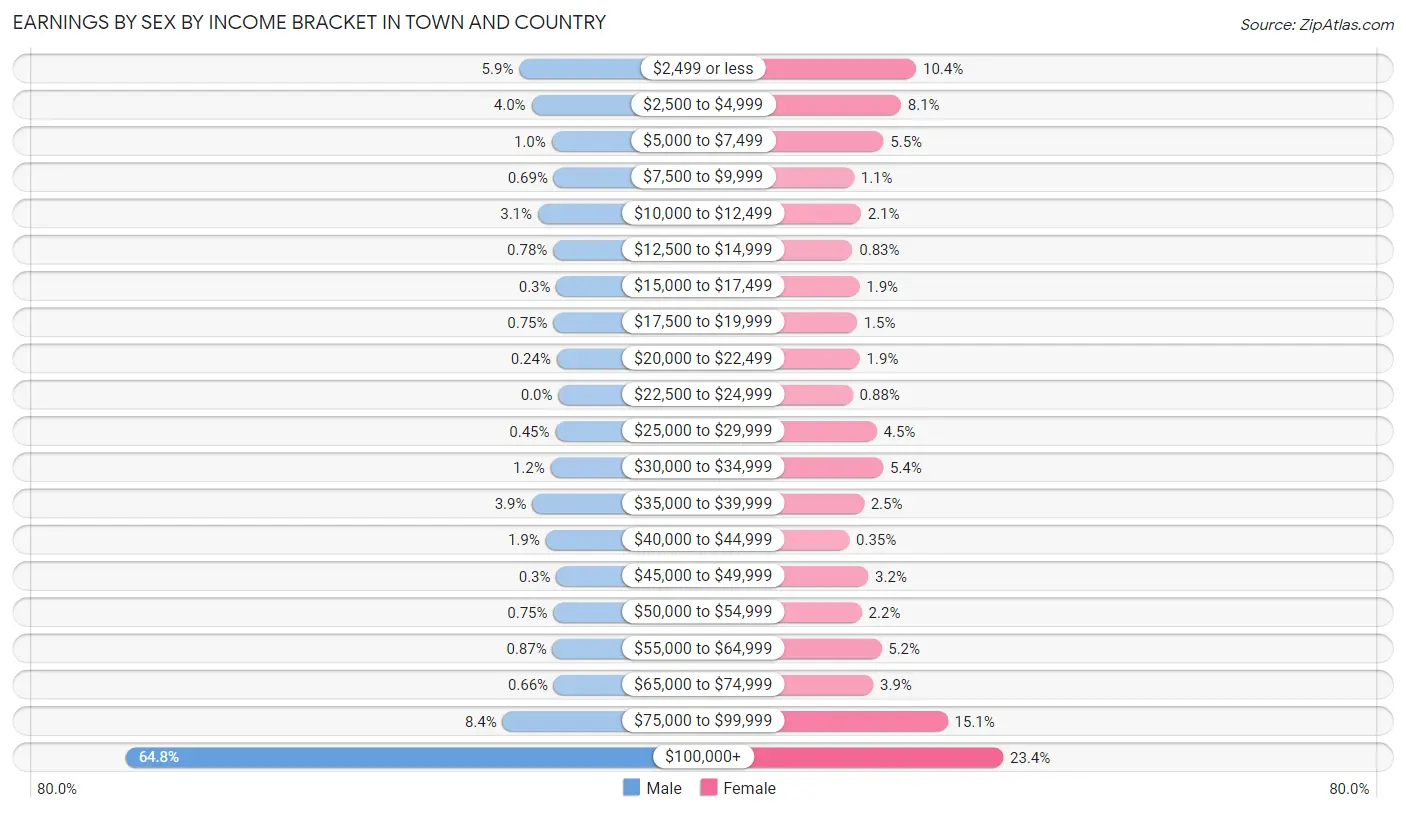
Earnings by Sex by Income Bracket in Town and Country
The most common earnings brackets in Town and Country are $100,000+ for men (2,156 | 64.8%) and $100,000+ for women (535 | 23.4%).
| Income | Male | Female |
| $2,499 or less | 195 (5.9%) | 237 (10.4%) |
| $2,500 to $4,999 | 134 (4.0%) | 185 (8.1%) |
| $5,000 to $7,499 | 34 (1.0%) | 125 (5.5%) |
| $7,500 to $9,999 | 23 (0.7%) | 24 (1.1%) |
| $10,000 to $12,499 | 102 (3.1%) | 48 (2.1%) |
| $12,500 to $14,999 | 26 (0.8%) | 19 (0.8%) |
| $15,000 to $17,499 | 10 (0.3%) | 43 (1.9%) |
| $17,500 to $19,999 | 25 (0.7%) | 34 (1.5%) |
| $20,000 to $22,499 | 8 (0.2%) | 44 (1.9%) |
| $22,500 to $24,999 | 0 (0.0%) | 20 (0.9%) |
| $25,000 to $29,999 | 15 (0.4%) | 102 (4.5%) |
| $30,000 to $34,999 | 39 (1.2%) | 124 (5.4%) |
| $35,000 to $39,999 | 130 (3.9%) | 58 (2.5%) |
| $40,000 to $44,999 | 64 (1.9%) | 8 (0.4%) |
| $45,000 to $49,999 | 10 (0.3%) | 73 (3.2%) |
| $50,000 to $54,999 | 25 (0.7%) | 51 (2.2%) |
| $55,000 to $64,999 | 29 (0.9%) | 118 (5.2%) |
| $65,000 to $74,999 | 22 (0.7%) | 90 (3.9%) |
| $75,000 to $99,999 | 278 (8.4%) | 345 (15.1%) |
| $100,000+ | 2,156 (64.8%) | 535 (23.4%) |
| Total | 3,325 (100.0%) | 2,283 (100.0%) |
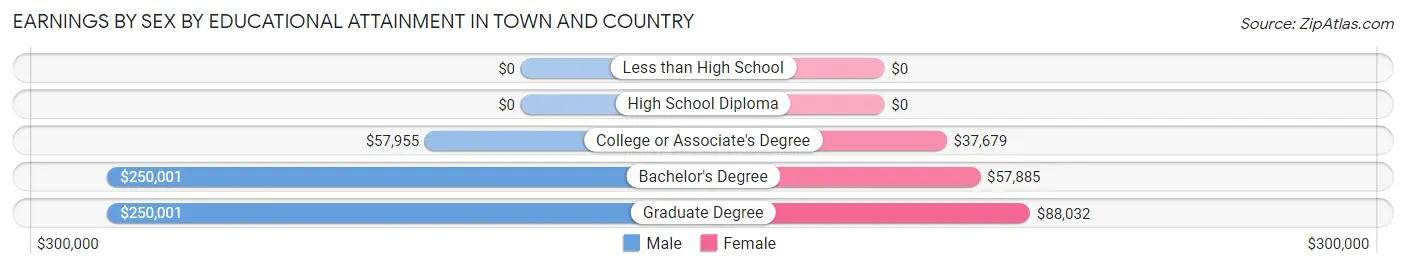
Earnings by Sex by Educational Attainment in Town and Country
Average earnings in Town and Country are $235,203 for men and $70,463 for women, a difference of 70.0%. Men with an educational attainment of bachelor's degree enjoy the highest average annual earnings of $250,001, while those with college or associate's degree education earn the least with $57,955. Women with an educational attainment of graduate degree earn the most with the average annual earnings of $88,032, while those with college or associate's degree education have the smallest earnings of $37,679.
| Educational Attainment | Male Income | Female Income |
| Less than High School | - | - |
| High School Diploma | - | - |
| College or Associate's Degree | $57,955 | $37,679 |
| Bachelor's Degree | $250,001 | $57,885 |
| Graduate Degree | $250,001 | $88,032 |
| Total | $235,203 | $70,463 |
Family Income in Town and Country
Family Income Brackets in Town and Country
According to the Town and Country family income data, there are 2,136 families falling into the $200,000+ income range, which is the most common income bracket and makes up 63.5% of all families.
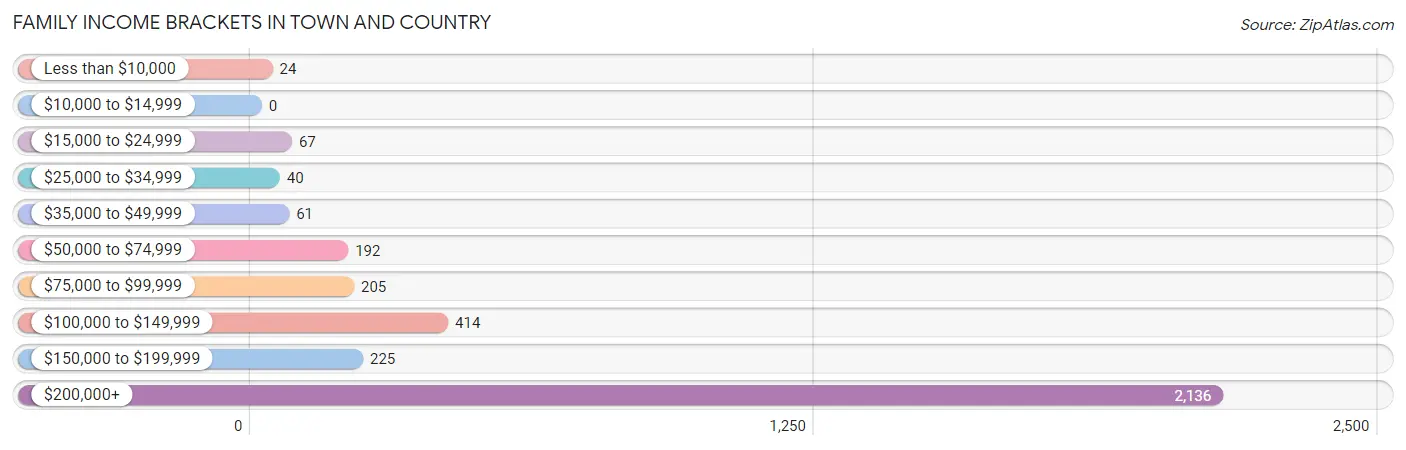
| Income Bracket | # Families | % Families |
| Less than $10,000 | 24 | 0.7% |
| $10,000 to $14,999 | 0 | 0.0% |
| $15,000 to $24,999 | 67 | 2.0% |
| $25,000 to $34,999 | 40 | 1.2% |
| $35,000 to $49,999 | 61 | 1.8% |
| $50,000 to $74,999 | 192 | 5.7% |
| $75,000 to $99,999 | 205 | 6.1% |
| $100,000 to $149,999 | 414 | 12.3% |
| $150,000 to $199,999 | 225 | 6.7% |
| $200,000+ | 2,136 | 63.5% |
Family Income by Famaliy Size in Town and Country
3-person families (616 | 18.3%) account for the highest median family income in Town and Country with $250,001 per family, while 2-person families (1,766 | 52.5%) have the highest median income of $112,647 per family member.
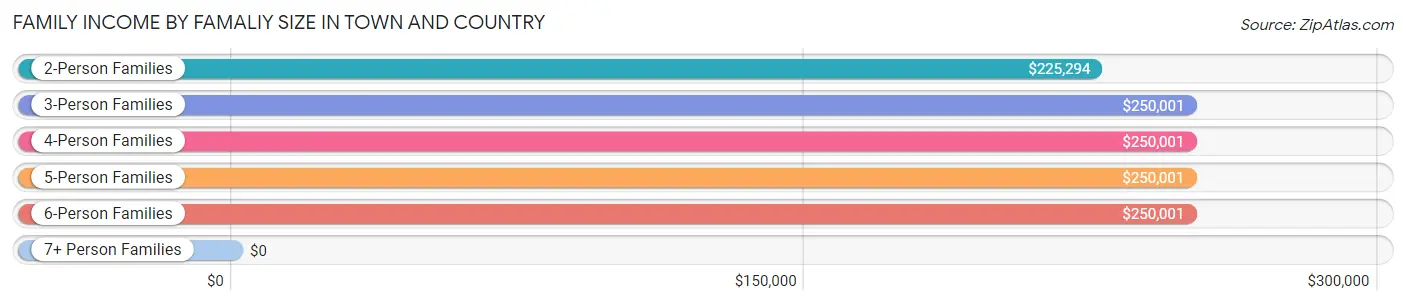
| Income Bracket | # Families | Median Income |
| 2-Person Families | 1,766 (52.5%) | $225,294 |
| 3-Person Families | 616 (18.3%) | $250,001 |
| 4-Person Families | 651 (19.4%) | $250,001 |
| 5-Person Families | 254 (7.5%) | $250,001 |
| 6-Person Families | 77 (2.3%) | $250,001 |
| 7+ Person Families | 0 (0.0%) | $0 |
| Total | 3,364 (100.0%) | $250,001 |
Family Income by Number of Earners in Town and Country
The median family income in Town and Country is $250,001, with families comprising 1 earner (872) having the highest median family income of $250,001, while families with no earners (620) have the lowest median family income of $89,821, accounting for 25.9% and 18.4% of families, respectively.
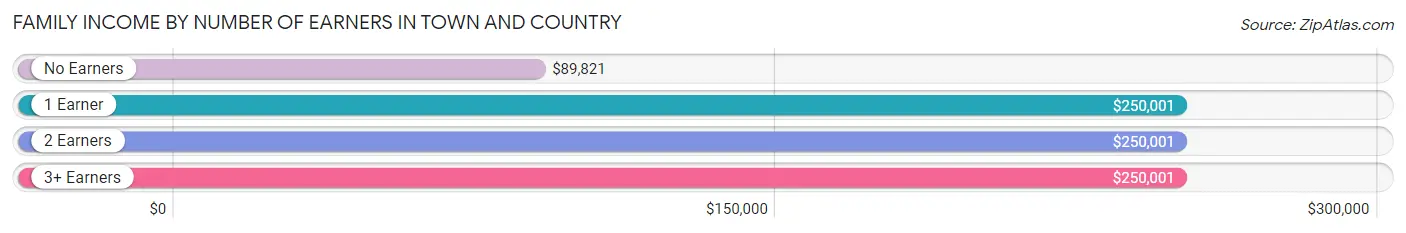
| Number of Earners | # Families | Median Income |
| No Earners | 620 (18.4%) | $89,821 |
| 1 Earner | 872 (25.9%) | $250,001 |
| 2 Earners | 1,645 (48.9%) | $250,001 |
| 3+ Earners | 227 (6.8%) | $250,001 |
| Total | 3,364 (100.0%) | $250,001 |
Household Income in Town and Country
Household Income Brackets in Town and Country
With 2,252 households falling in the category, the $200,000+ income range is the most frequent in Town and Country, accounting for 54.3% of all households. In contrast, only 37 households (0.9%) fall into the $10,000 to $14,999 income bracket, making it the least populous group.
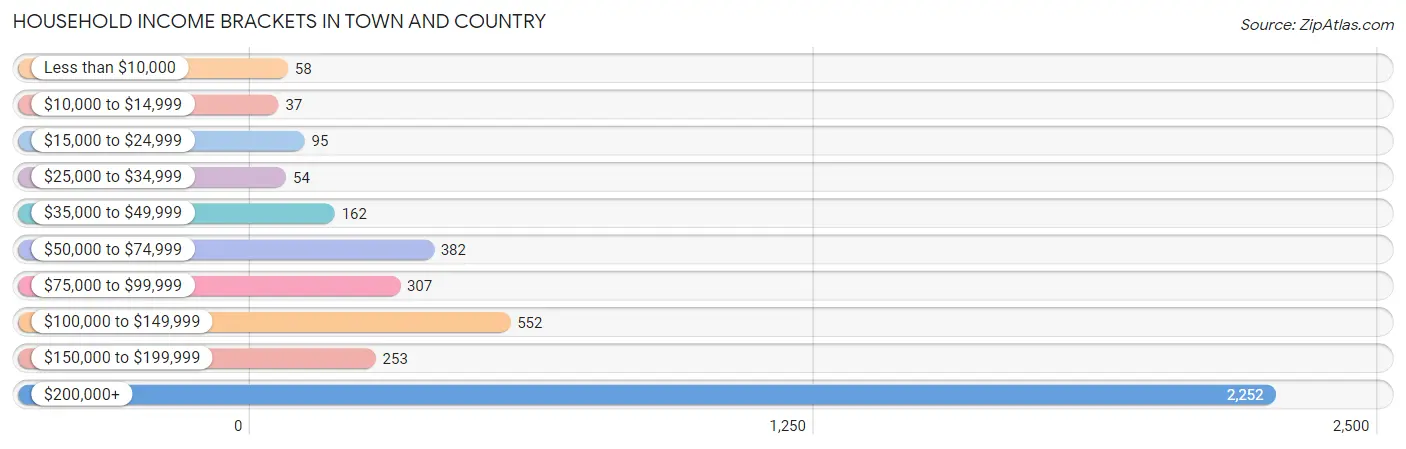
| Income Bracket | # Households | % Households |
| Less than $10,000 | 58 | 1.4% |
| $10,000 to $14,999 | 37 | 0.9% |
| $15,000 to $24,999 | 95 | 2.3% |
| $25,000 to $34,999 | 54 | 1.3% |
| $35,000 to $49,999 | 162 | 3.9% |
| $50,000 to $74,999 | 382 | 9.2% |
| $75,000 to $99,999 | 307 | 7.4% |
| $100,000 to $149,999 | 552 | 13.3% |
| $150,000 to $199,999 | 253 | 6.1% |
| $200,000+ | 2,252 | 54.3% |
Household Income by Householder Age in Town and Country
The median household income in Town and Country is $231,382, with the highest median household income of $250,001 found in the 25 to 44 years age bracket for the primary householder. A total of 730 households (17.6%) fall into this category. Meanwhile, the 15 to 24 years age bracket for the primary householder has the lowest median household income of $0, with 47 households (1.1%) in this group.
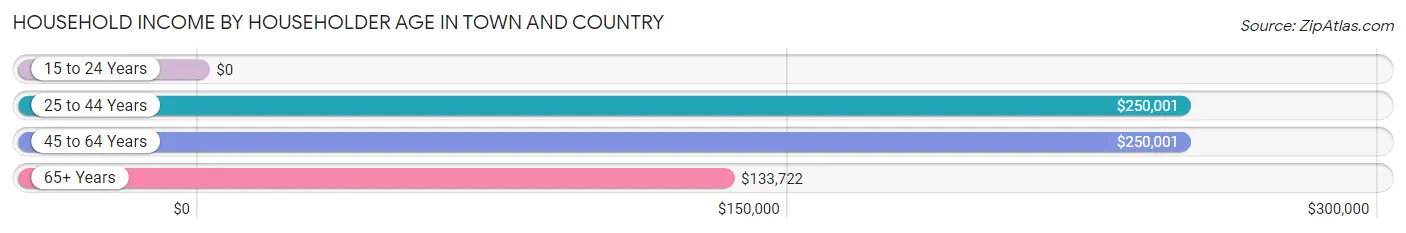
| Income Bracket | # Households | Median Income |
| 15 to 24 Years | 47 (1.1%) | $0 |
| 25 to 44 Years | 730 (17.6%) | $250,001 |
| 45 to 64 Years | 1,634 (39.4%) | $250,001 |
| 65+ Years | 1,736 (41.9%) | $133,722 |
| Total | 4,147 (100.0%) | $231,382 |
Poverty in Town and Country
Income Below Poverty by Sex and Age in Town and Country
With 3.2% poverty level for males and 3.8% for females among the residents of Town and Country, 25 to 34 year old males and 16 and 17 year old females are the most vulnerable to poverty, with 16 males (6.9%) and 15 females (13.5%) in their respective age groups living below the poverty level.
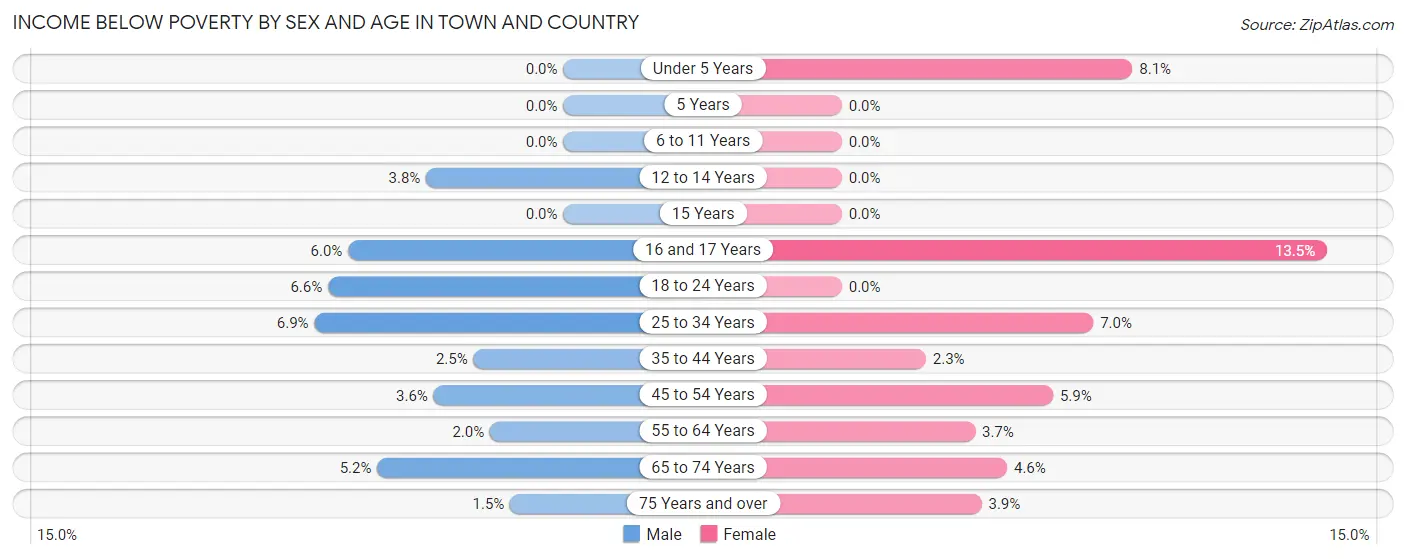
| Age Bracket | Male | Female |
| Under 5 Years | 0 (0.0%) | 11 (8.1%) |
| 5 Years | 0 (0.0%) | 0 (0.0%) |
| 6 to 11 Years | 0 (0.0%) | 0 (0.0%) |
| 12 to 14 Years | 12 (3.8%) | 0 (0.0%) |
| 15 Years | 0 (0.0%) | 0 (0.0%) |
| 16 and 17 Years | 13 (6.0%) | 15 (13.5%) |
| 18 to 24 Years | 19 (6.6%) | 0 (0.0%) |
| 25 to 34 Years | 16 (6.9%) | 18 (7.0%) |
| 35 to 44 Years | 17 (2.5%) | 13 (2.3%) |
| 45 to 54 Years | 31 (3.6%) | 54 (5.9%) |
| 55 to 64 Years | 15 (2.0%) | 21 (3.7%) |
| 65 to 74 Years | 40 (5.2%) | 37 (4.6%) |
| 75 Years and over | 10 (1.5%) | 28 (3.9%) |
| Total | 173 (3.2%) | 197 (3.8%) |
Income Above Poverty by Sex and Age in Town and Country
According to the poverty statistics in Town and Country, males aged under 5 years and females aged 5 years are the age groups that are most secure financially, with 100.0% of males and 100.0% of females in these age groups living above the poverty line.
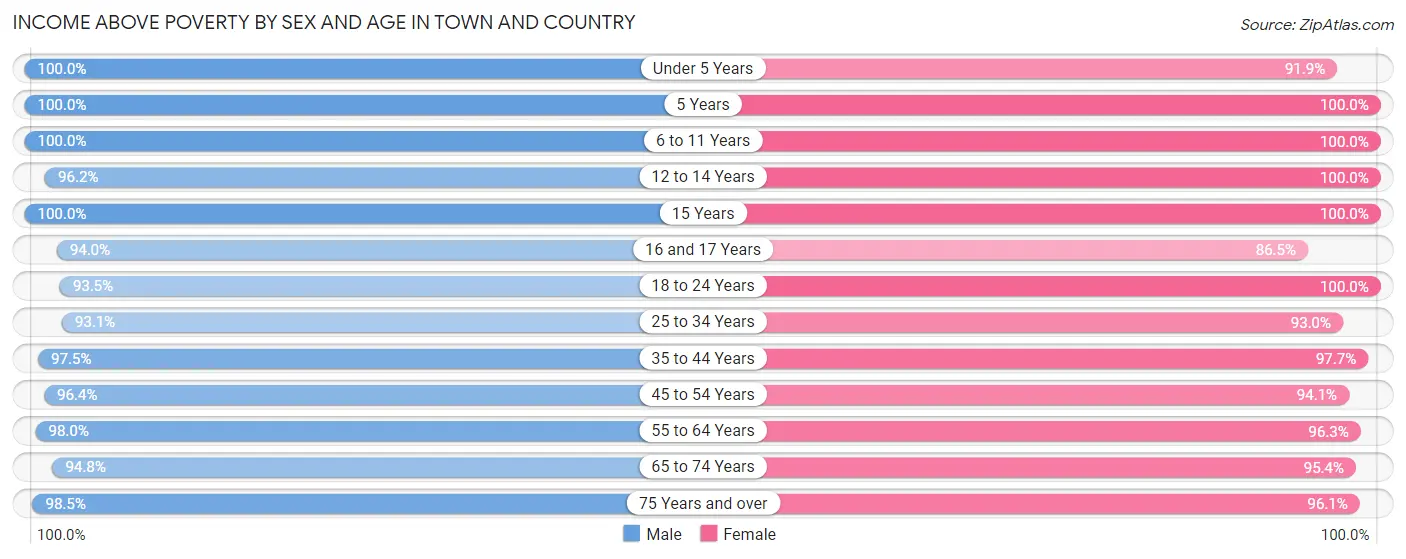
| Age Bracket | Male | Female |
| Under 5 Years | 137 (100.0%) | 125 (91.9%) |
| 5 Years | 34 (100.0%) | 44 (100.0%) |
| 6 to 11 Years | 415 (100.0%) | 402 (100.0%) |
| 12 to 14 Years | 302 (96.2%) | 227 (100.0%) |
| 15 Years | 70 (100.0%) | 115 (100.0%) |
| 16 and 17 Years | 204 (94.0%) | 96 (86.5%) |
| 18 to 24 Years | 271 (93.4%) | 265 (100.0%) |
| 25 to 34 Years | 215 (93.1%) | 239 (93.0%) |
| 35 to 44 Years | 664 (97.5%) | 543 (97.7%) |
| 45 to 54 Years | 828 (96.4%) | 865 (94.1%) |
| 55 to 64 Years | 719 (98.0%) | 545 (96.3%) |
| 65 to 74 Years | 732 (94.8%) | 768 (95.4%) |
| 75 Years and over | 665 (98.5%) | 691 (96.1%) |
| Total | 5,256 (96.8%) | 4,925 (96.2%) |
Income Below Poverty Among Married-Couple Families in Town and Country
The poverty statistics for married-couple families in Town and Country show that 2.4% or 77 of the total 3,216 families live below the poverty line. Families with 1 or 2 children have the highest poverty rate of 3.0%, comprising of 30 families. On the other hand, families with 3 or 4 children have the lowest poverty rate of 0.0%, which includes 0 families.
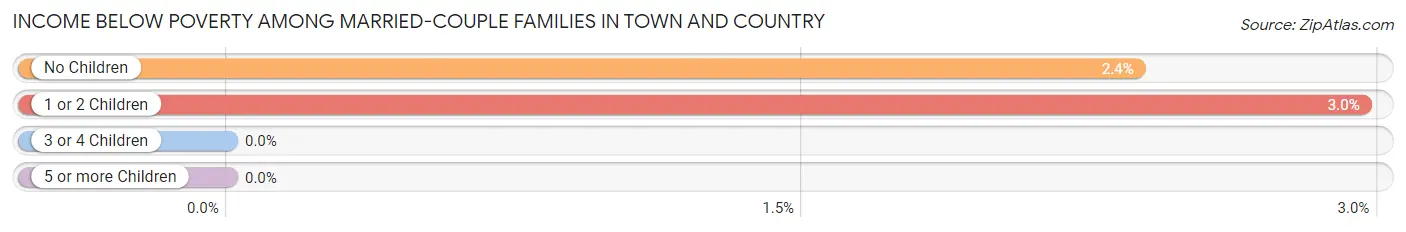
| Children | Above Poverty | Below Poverty |
| No Children | 1,940 (97.6%) | 47 (2.4%) |
| 1 or 2 Children | 984 (97.0%) | 30 (3.0%) |
| 3 or 4 Children | 215 (100.0%) | 0 (0.0%) |
| 5 or more Children | 0 (0.0%) | 0 (0.0%) |
| Total | 3,139 (97.6%) | 77 (2.4%) |
Income Below Poverty Among Single-Parent Households in Town and Country
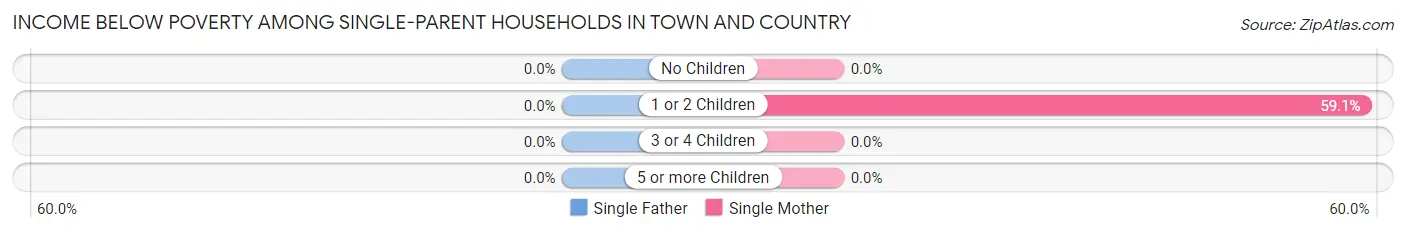
| Children | Single Father | Single Mother |
| No Children | 0 (0.0%) | 0 (0.0%) |
| 1 or 2 Children | 0 (0.0%) | 13 (59.1%) |
| 3 or 4 Children | 0 (0.0%) | 0 (0.0%) |
| 5 or more Children | 0 (0.0%) | 0 (0.0%) |
| Total | 0 (0.0%) | 13 (23.2%) |
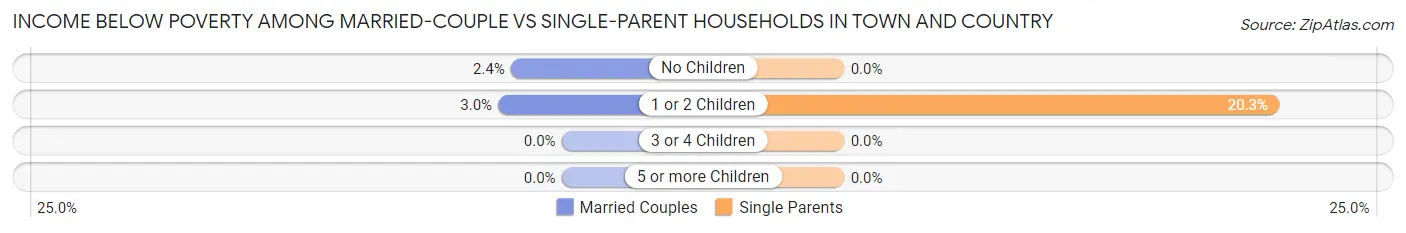
Income Below Poverty Among Married-Couple vs Single-Parent Households in Town and Country
The poverty data for Town and Country shows that 77 of the married-couple family households (2.4%) and 13 of the single-parent households (8.8%) are living below the poverty level. Within the married-couple family households, those with 1 or 2 children have the highest poverty rate, with 30 households (3.0%) falling below the poverty line. Among the single-parent households, those with 1 or 2 children have the highest poverty rate, with 13 household (20.3%) living below poverty.
| Children | Married-Couple Families | Single-Parent Households |
| No Children | 47 (2.4%) | 0 (0.0%) |
| 1 or 2 Children | 30 (3.0%) | 13 (20.3%) |
| 3 or 4 Children | 0 (0.0%) | 0 (0.0%) |
| 5 or more Children | 0 (0.0%) | 0 (0.0%) |
| Total | 77 (2.4%) | 13 (8.8%) |
Race in Town and Country
The most populous races in Town and Country are White / Caucasian (9,579 | 82.8%), Asian (1,206 | 10.4%), and Two or more Races (476 | 4.1%).
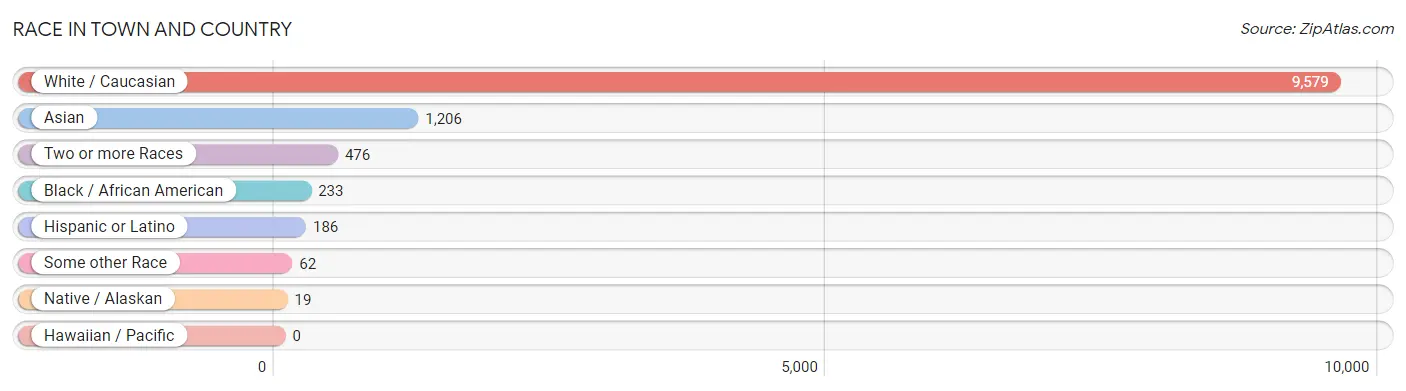
| Race | # Population | % Population |
| Asian | 1,206 | 10.4% |
| Black / African American | 233 | 2.0% |
| Hawaiian / Pacific | 0 | 0.0% |
| Hispanic or Latino | 186 | 1.6% |
| Native / Alaskan | 19 | 0.2% |
| White / Caucasian | 9,579 | 82.8% |
| Two or more Races | 476 | 4.1% |
| Some other Race | 62 | 0.5% |
| Total | 11,575 | 100.0% |
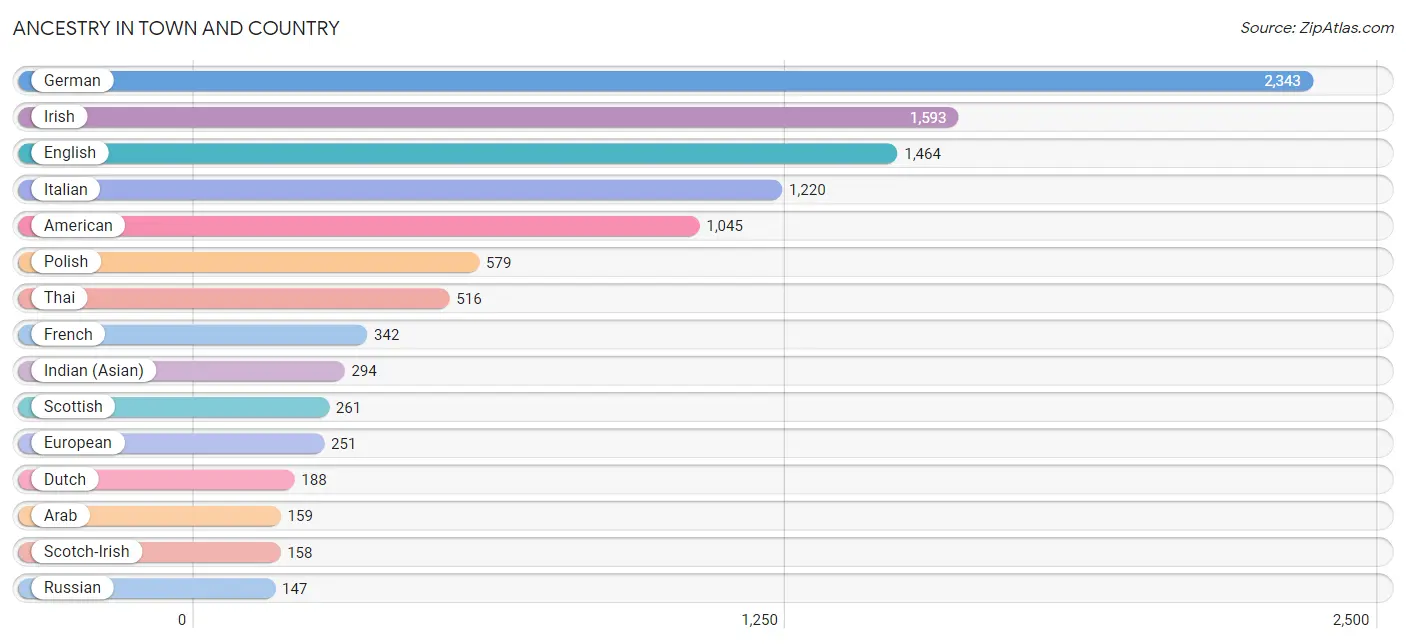
Ancestry in Town and Country
The most populous ancestries reported in Town and Country are German (2,343 | 20.2%), Irish (1,593 | 13.8%), English (1,464 | 12.7%), Italian (1,220 | 10.5%), and American (1,045 | 9.0%), together accounting for 66.2% of all Town and Country residents.
| Ancestry | # Population | % Population |
| American | 1,045 | 9.0% |
| Arab | 159 | 1.4% |
| Armenian | 76 | 0.7% |
| Austrian | 89 | 0.8% |
| Brazilian | 15 | 0.1% |
| British | 67 | 0.6% |
| Burmese | 18 | 0.2% |
| Central American | 11 | 0.1% |
| Cherokee | 7 | 0.1% |
| Croatian | 51 | 0.4% |
| Cuban | 97 | 0.8% |
| Czech | 9 | 0.1% |
| Czechoslovakian | 24 | 0.2% |
| Danish | 33 | 0.3% |
| Dutch | 188 | 1.6% |
| Eastern European | 73 | 0.6% |
| Ecuadorian | 13 | 0.1% |
| English | 1,464 | 12.7% |
| European | 251 | 2.2% |
| Finnish | 10 | 0.1% |
| French | 342 | 2.9% |
| French Canadian | 8 | 0.1% |
| German | 2,343 | 20.2% |
| Greek | 96 | 0.8% |
| Guatemalan | 11 | 0.1% |
| Hungarian | 124 | 1.1% |
| Indian (Asian) | 294 | 2.5% |
| Indonesian | 2 | 0.0% |
| Iranian | 17 | 0.2% |
| Iraqi | 34 | 0.3% |
| Irish | 1,593 | 13.8% |
| Italian | 1,220 | 10.5% |
| Jordanian | 39 | 0.3% |
| Korean | 55 | 0.5% |
| Lithuanian | 12 | 0.1% |
| Mexican | 54 | 0.5% |
| Northern European | 64 | 0.5% |
| Norwegian | 106 | 0.9% |
| Osage | 6 | 0.1% |
| Pakistani | 11 | 0.1% |
| Polish | 579 | 5.0% |
| Portuguese | 15 | 0.1% |
| Russian | 147 | 1.3% |
| Scandinavian | 21 | 0.2% |
| Scotch-Irish | 158 | 1.4% |
| Scottish | 261 | 2.2% |
| Slovak | 15 | 0.1% |
| South African | 18 | 0.2% |
| South American | 13 | 0.1% |
| Spanish | 11 | 0.1% |
| Sri Lankan | 3 | 0.0% |
| Subsaharan African | 18 | 0.2% |
| Swedish | 132 | 1.1% |
| Swiss | 64 | 0.5% |
| Syrian | 86 | 0.7% |
| Thai | 516 | 4.5% |
| Turkish | 13 | 0.1% |
| Ukrainian | 7 | 0.1% |
| Welsh | 64 | 0.5% | View All 59 Rows |
Immigrants in Town and Country
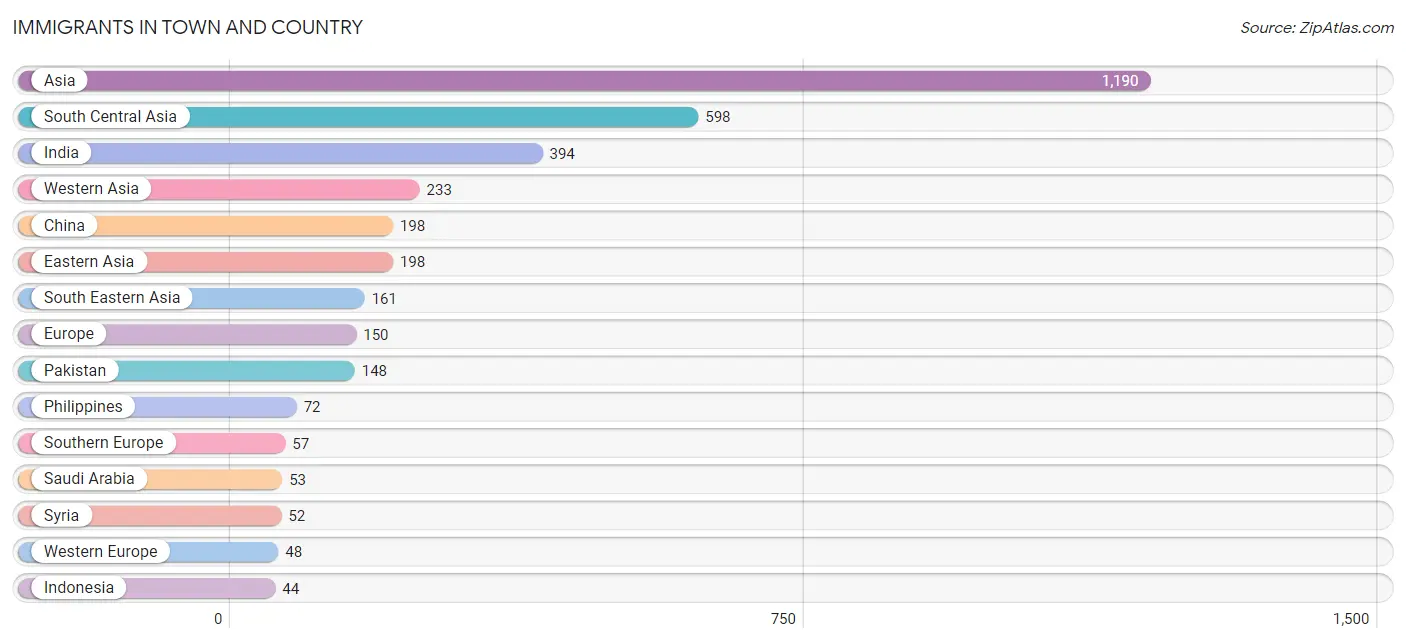
The most numerous immigrant groups reported in Town and Country came from Asia (1,190 | 10.3%), South Central Asia (598 | 5.2%), India (394 | 3.4%), Western Asia (233 | 2.0%), and China (198 | 1.7%), together accounting for 22.6% of all Town and Country residents.
| Immigration Origin | # Population | % Population |
| Africa | 19 | 0.2% |
| Asia | 1,190 | 10.3% |
| Belarus | 8 | 0.1% |
| Brazil | 15 | 0.1% |
| Canada | 19 | 0.2% |
| Central America | 11 | 0.1% |
| China | 198 | 1.7% |
| Eastern Asia | 198 | 1.7% |
| Eastern Europe | 38 | 0.3% |
| England | 7 | 0.1% |
| Europe | 150 | 1.3% |
| Germany | 10 | 0.1% |
| Greece | 34 | 0.3% |
| Guatemala | 11 | 0.1% |
| Hong Kong | 20 | 0.2% |
| India | 394 | 3.4% |
| Indonesia | 44 | 0.4% |
| Iran | 17 | 0.2% |
| Iraq | 22 | 0.2% |
| Israel | 41 | 0.4% |
| Italy | 23 | 0.2% |
| Jordan | 39 | 0.3% |
| Latin America | 26 | 0.2% |
| Northern Africa | 1 | 0.0% |
| Northern Europe | 7 | 0.1% |
| Pakistan | 148 | 1.3% |
| Philippines | 72 | 0.6% |
| Poland | 20 | 0.2% |
| Russia | 10 | 0.1% |
| Saudi Arabia | 53 | 0.5% |
| Singapore | 11 | 0.1% |
| South Africa | 18 | 0.2% |
| South America | 15 | 0.1% |
| South Central Asia | 598 | 5.2% |
| South Eastern Asia | 161 | 1.4% |
| Southern Europe | 57 | 0.5% |
| Sudan | 1 | 0.0% |
| Switzerland | 38 | 0.3% |
| Syria | 52 | 0.4% |
| Taiwan | 10 | 0.1% |
| Thailand | 30 | 0.3% |
| Turkey | 26 | 0.2% |
| Uzbekistan | 39 | 0.3% |
| Vietnam | 2 | 0.0% |
| Western Asia | 233 | 2.0% |
| Western Europe | 48 | 0.4% | View All 46 Rows |
Sex and Age in Town and Country
Sex and Age in Town and Country
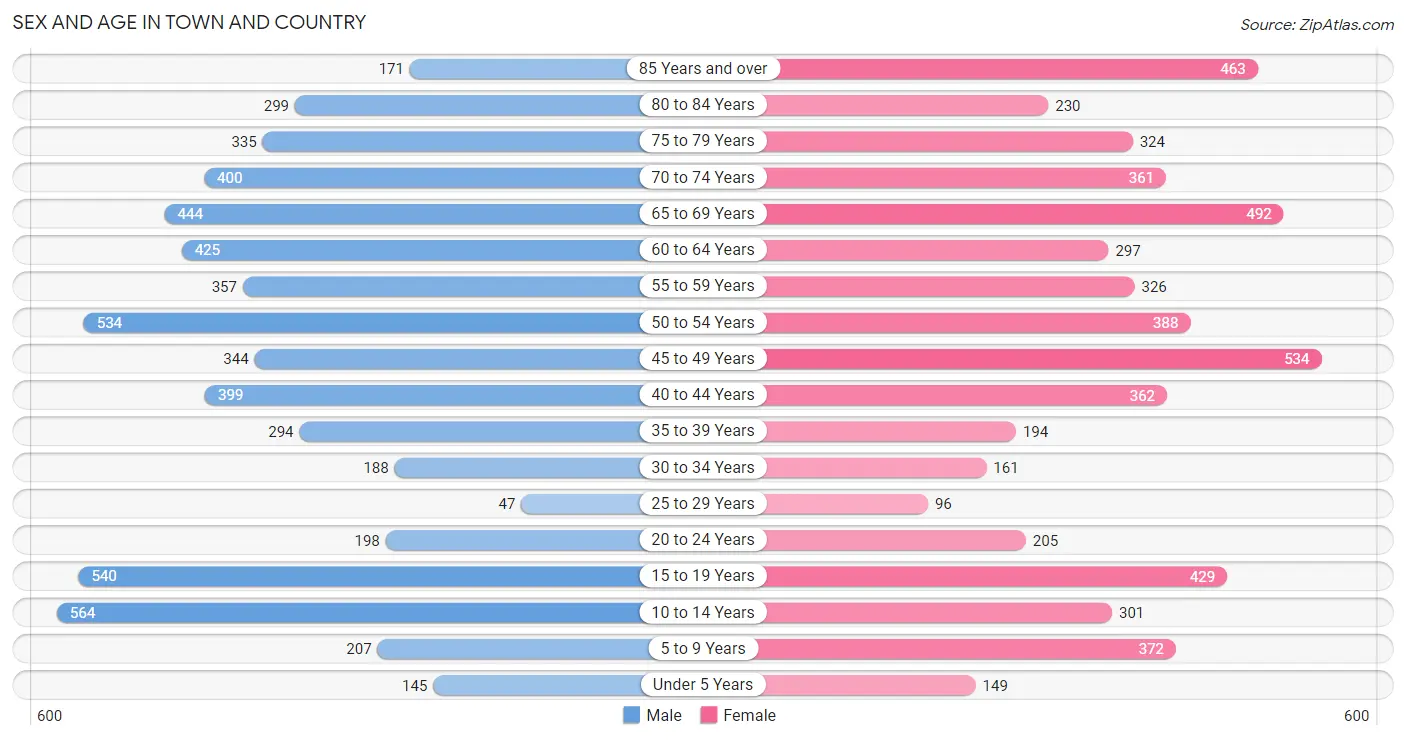
The most populous age groups in Town and Country are 10 to 14 Years (564 | 9.6%) for men and 45 to 49 Years (534 | 9.4%) for women.
| Age Bracket | Male | Female |
| Under 5 Years | 145 (2.5%) | 149 (2.6%) |
| 5 to 9 Years | 207 (3.5%) | 372 (6.5%) |
| 10 to 14 Years | 564 (9.6%) | 301 (5.3%) |
| 15 to 19 Years | 540 (9.2%) | 429 (7.5%) |
| 20 to 24 Years | 198 (3.4%) | 205 (3.6%) |
| 25 to 29 Years | 47 (0.8%) | 96 (1.7%) |
| 30 to 34 Years | 188 (3.2%) | 161 (2.8%) |
| 35 to 39 Years | 294 (5.0%) | 194 (3.4%) |
| 40 to 44 Years | 399 (6.8%) | 362 (6.4%) |
| 45 to 49 Years | 344 (5.8%) | 534 (9.4%) |
| 50 to 54 Years | 534 (9.1%) | 388 (6.8%) |
| 55 to 59 Years | 357 (6.1%) | 326 (5.7%) |
| 60 to 64 Years | 425 (7.2%) | 297 (5.2%) |
| 65 to 69 Years | 444 (7.5%) | 492 (8.7%) |
| 70 to 74 Years | 400 (6.8%) | 361 (6.4%) |
| 75 to 79 Years | 335 (5.7%) | 324 (5.7%) |
| 80 to 84 Years | 299 (5.1%) | 230 (4.1%) |
| 85 Years and over | 171 (2.9%) | 463 (8.2%) |
| Total | 5,891 (100.0%) | 5,684 (100.0%) |
Families and Households in Town and Country
Median Family Size in Town and Country
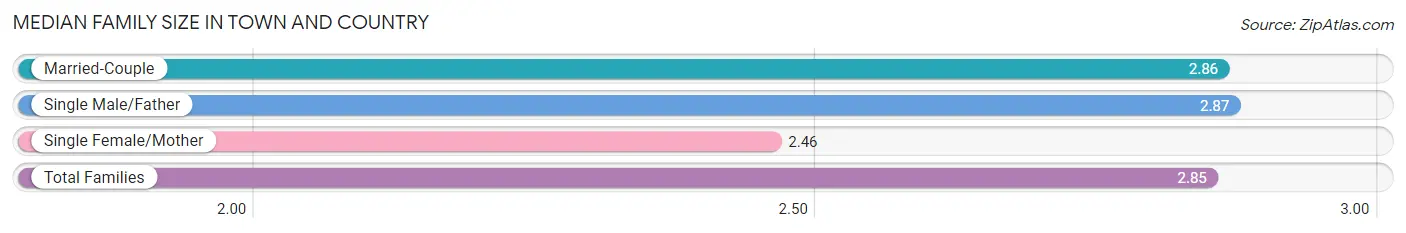
The median family size in Town and Country is 2.85 persons per family, with single male/father families (92 | 2.7%) accounting for the largest median family size of 2.87 persons per family. On the other hand, single female/mother families (56 | 1.7%) represent the smallest median family size with 2.46 persons per family.
| Family Type | # Families | Family Size |
| Married-Couple | 3,216 (95.6%) | 2.86 |
| Single Male/Father | 92 (2.7%) | 2.87 |
| Single Female/Mother | 56 (1.7%) | 2.46 |
| Total Families | 3,364 (100.0%) | 2.85 |
Median Household Size in Town and Country
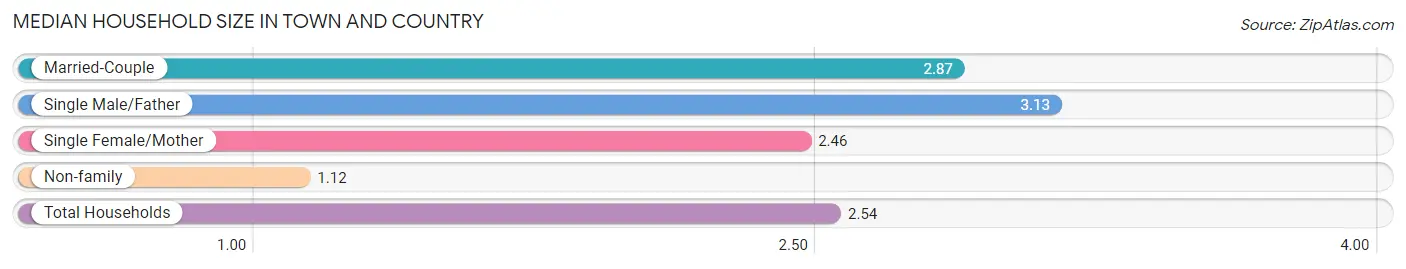
The median household size in Town and Country is 2.54 persons per household, with single male/father households (92 | 2.2%) accounting for the largest median household size of 3.13 persons per household. non-family households (783 | 18.9%) represent the smallest median household size with 1.12 persons per household.
| Household Type | # Households | Household Size |
| Married-Couple | 3,216 (77.5%) | 2.87 |
| Single Male/Father | 92 (2.2%) | 3.13 |
| Single Female/Mother | 56 (1.3%) | 2.46 |
| Non-family | 783 (18.9%) | 1.12 |
| Total Households | 4,147 (100.0%) | 2.54 |
Household Size by Marriage Status in Town and Country
Out of a total of 4,147 households in Town and Country, 3,364 (81.1%) are family households, while 783 (18.9%) are nonfamily households. The most numerous type of family households are 2-person households, comprising 1,766, and the most common type of nonfamily households are 1-person households, comprising 687.
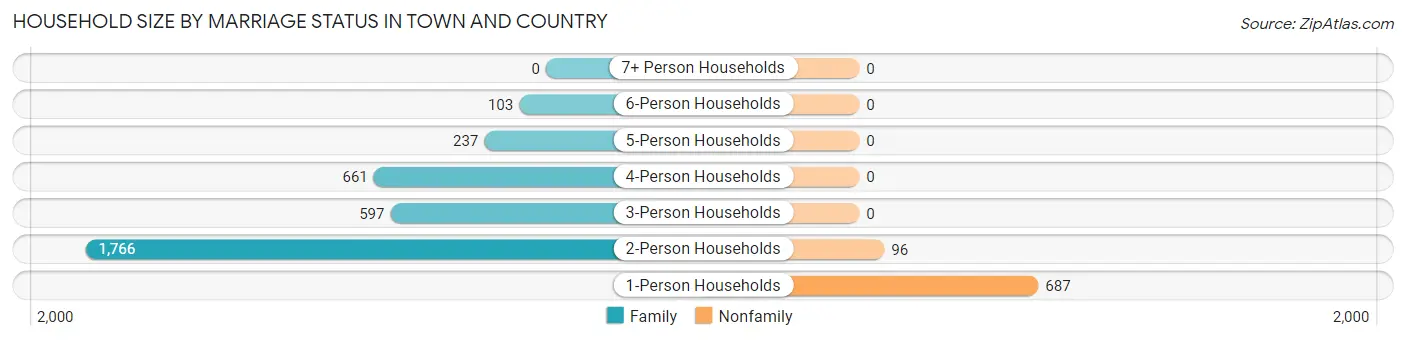
| Household Size | Family Households | Nonfamily Households |
| 1-Person Households | - | 687 (16.6%) |
| 2-Person Households | 1,766 (42.6%) | 96 (2.3%) |
| 3-Person Households | 597 (14.4%) | 0 (0.0%) |
| 4-Person Households | 661 (15.9%) | 0 (0.0%) |
| 5-Person Households | 237 (5.7%) | 0 (0.0%) |
| 6-Person Households | 103 (2.5%) | 0 (0.0%) |
| 7+ Person Households | 0 (0.0%) | 0 (0.0%) |
| Total | 3,364 (81.1%) | 783 (18.9%) |
Female Fertility in Town and Country
Fertility by Age in Town and Country
Average fertility rate in Town and Country is 26.0 births per 1,000 women. Women in the age bracket of 20 to 34 years have the highest fertility rate with 56.0 births per 1,000 women. Women in the age bracket of 35 to 50 years acount for 51.8% of all women with births.
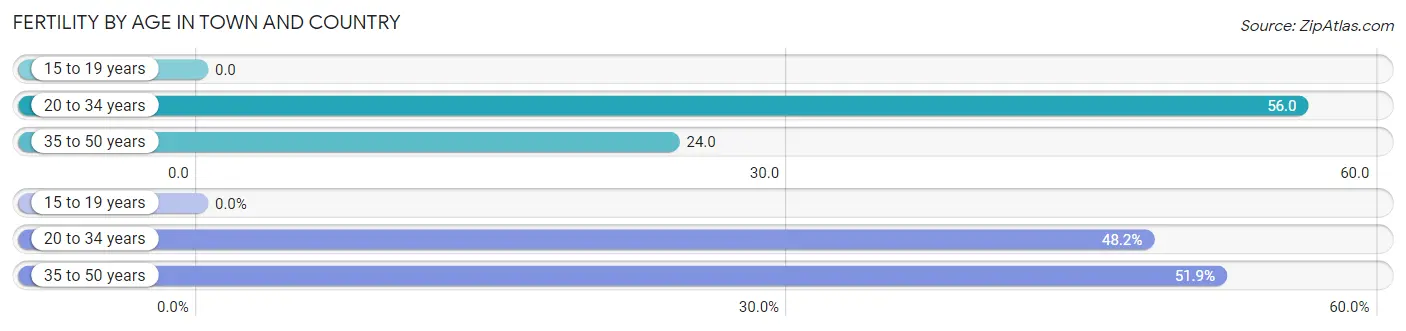
| Age Bracket | Women with Births | Births / 1,000 Women |
| 15 to 19 years | 0 (0.0%) | 0.0 |
| 20 to 34 years | 26 (48.1%) | 56.0 |
| 35 to 50 years | 28 (51.8%) | 24.0 |
| Total | 54 (100.0%) | 26.0 |
Fertility by Age by Marriage Status in Town and Country
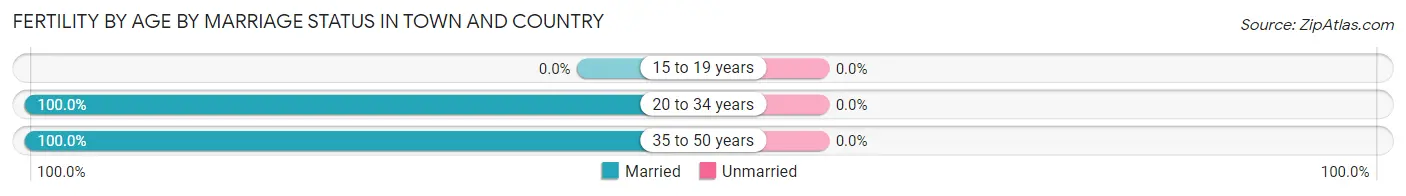
| Age Bracket | Married | Unmarried |
| 15 to 19 years | 0 (0.0%) | 0 (0.0%) |
| 20 to 34 years | 26 (100.0%) | 0 (0.0%) |
| 35 to 50 years | 28 (100.0%) | 0 (0.0%) |
| Total | 54 (100.0%) | 0 (0.0%) |
Fertility by Education in Town and Country
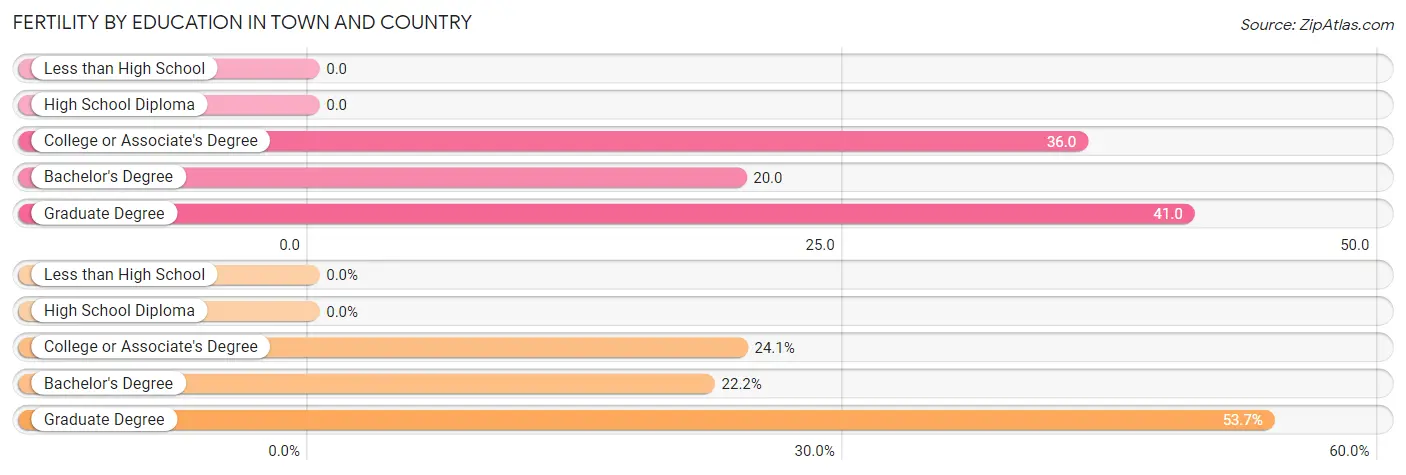
| Educational Attainment | Women with Births | Births / 1,000 Women |
| Less than High School | 0 (0.0%) | 0.0 |
| High School Diploma | 0 (0.0%) | 0.0 |
| College or Associate's Degree | 13 (24.1%) | 36.0 |
| Bachelor's Degree | 12 (22.2%) | 20.0 |
| Graduate Degree | 29 (53.7%) | 41.0 |
| Total | 54 (100.0%) | 26.0 |
Fertility by Education by Marriage Status in Town and Country
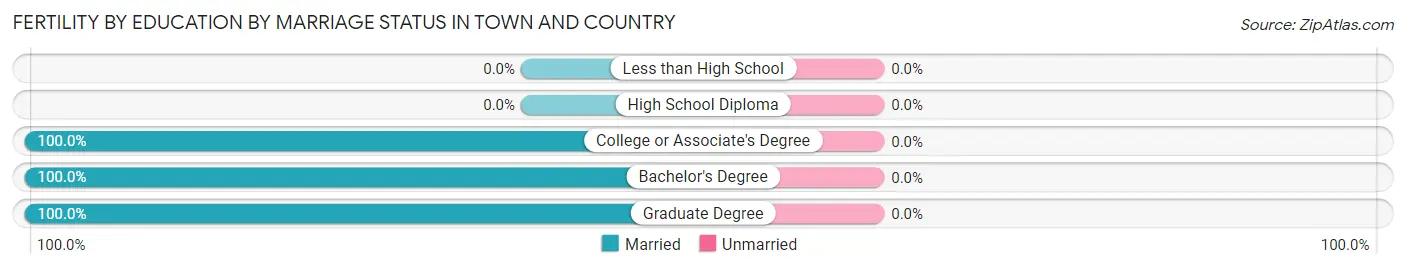
| Educational Attainment | Married | Unmarried |
| Less than High School | 0 (0.0%) | 0 (0.0%) |
| High School Diploma | 0 (0.0%) | 0 (0.0%) |
| College or Associate's Degree | 13 (100.0%) | 0 (0.0%) |
| Bachelor's Degree | 12 (100.0%) | 0 (0.0%) |
| Graduate Degree | 29 (100.0%) | 0 (0.0%) |
| Total | 54 (100.0%) | 0 (0.0%) |
Employment Characteristics in Town and Country
Employment by Class of Employer in Town and Country
Among the 4,922 employed individuals in Town and Country, private company employees (2,636 | 53.6%), self-employed (incorporated) (770 | 15.6%), and not-for-profit organizations (723 | 14.7%) make up the most common classes of employment.
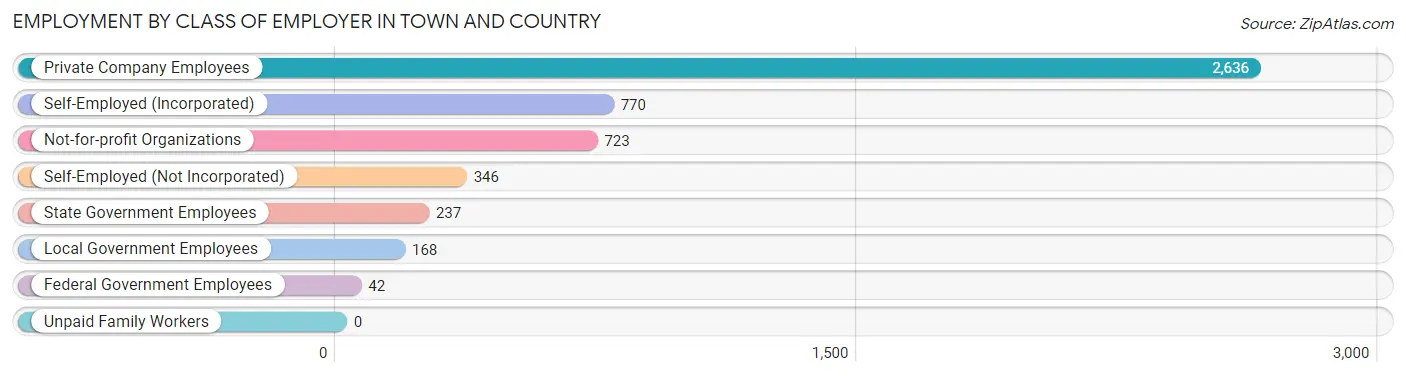
| Employer Class | # Employees | % Employees |
| Private Company Employees | 2,636 | 53.6% |
| Self-Employed (Incorporated) | 770 | 15.6% |
| Self-Employed (Not Incorporated) | 346 | 7.0% |
| Not-for-profit Organizations | 723 | 14.7% |
| Local Government Employees | 168 | 3.4% |
| State Government Employees | 237 | 4.8% |
| Federal Government Employees | 42 | 0.9% |
| Unpaid Family Workers | 0 | 0.0% |
| Total | 4,922 | 100.0% |
Employment Status by Age in Town and Country
According to the labor force statistics for Town and Country, out of the total population over 16 years of age (9,652), 53.2% or 5,135 individuals are in the labor force, with 3.3% or 169 of them unemployed. The age group with the highest labor force participation rate is 35 to 44 years, with 80.6% or 1,007 individuals in the labor force. Within the labor force, the 75 years and over age range has the highest percentage of unemployed individuals, with 21.1% or 31 of them being unemployed.
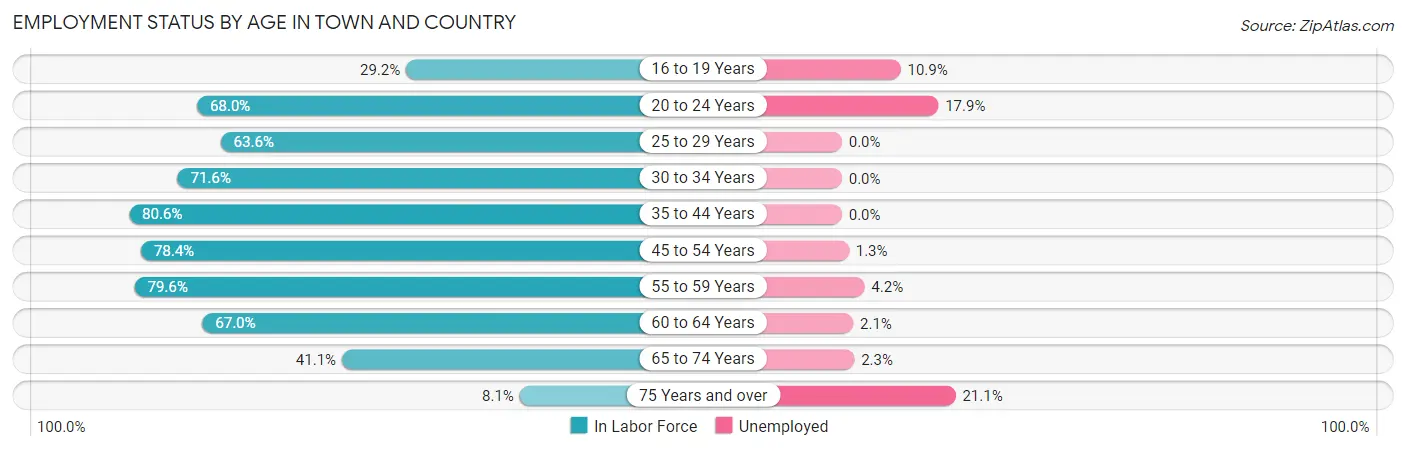
| Age Bracket | In Labor Force | Unemployed |
| 16 to 19 Years | 229 (29.2%) | 25 (10.9%) |
| 20 to 24 Years | 274 (68.0%) | 49 (17.9%) |
| 25 to 29 Years | 91 (63.6%) | 0 (0.0%) |
| 30 to 34 Years | 250 (71.6%) | 0 (0.0%) |
| 35 to 44 Years | 1,007 (80.6%) | 0 (0.0%) |
| 45 to 54 Years | 1,411 (78.4%) | 18 (1.3%) |
| 55 to 59 Years | 544 (79.6%) | 23 (4.2%) |
| 60 to 64 Years | 484 (67.0%) | 10 (2.1%) |
| 65 to 74 Years | 697 (41.1%) | 16 (2.3%) |
| 75 Years and over | 148 (8.1%) | 31 (21.1%) |
| Total | 5,135 (53.2%) | 169 (3.3%) |
Employment Status by Educational Attainment in Town and Country
According to labor force statistics for Town and Country, 76.6% of individuals (3,789) out of the total population between 25 and 64 years of age (4,946) are in the labor force, with 1.3% or 49 of them being unemployed. The group with the highest labor force participation rate are those with the educational attainment of bachelor's degree or higher, with 81.3% or 3,245 individuals in the labor force. Within the labor force, individuals with college / associate degree education have the highest percentage of unemployment, with 3.9% or 18 of them being unemployed.
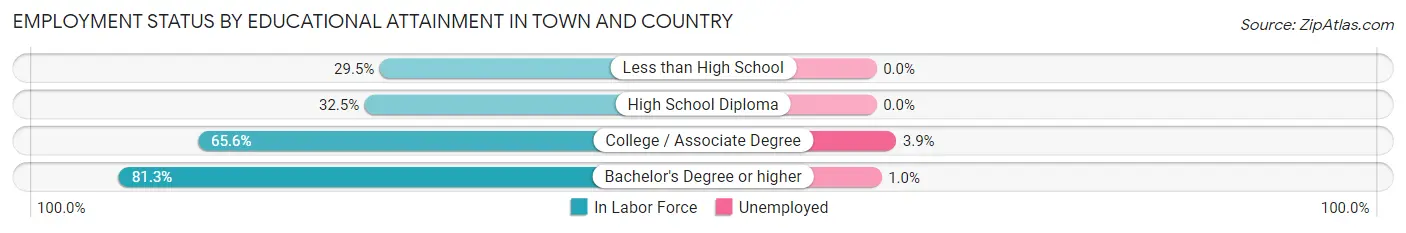
| Educational Attainment | In Labor Force | Unemployed |
| Less than High School | 13 (29.5%) | 0 (0.0%) |
| High School Diploma | 67 (32.5%) | 0 (0.0%) |
| College / Associate Degree | 462 (65.6%) | 27 (3.9%) |
| Bachelor's Degree or higher | 3,245 (81.3%) | 40 (1.0%) |
| Total | 3,789 (76.6%) | 64 (1.3%) |
Employment Occupations by Sex in Town and Country
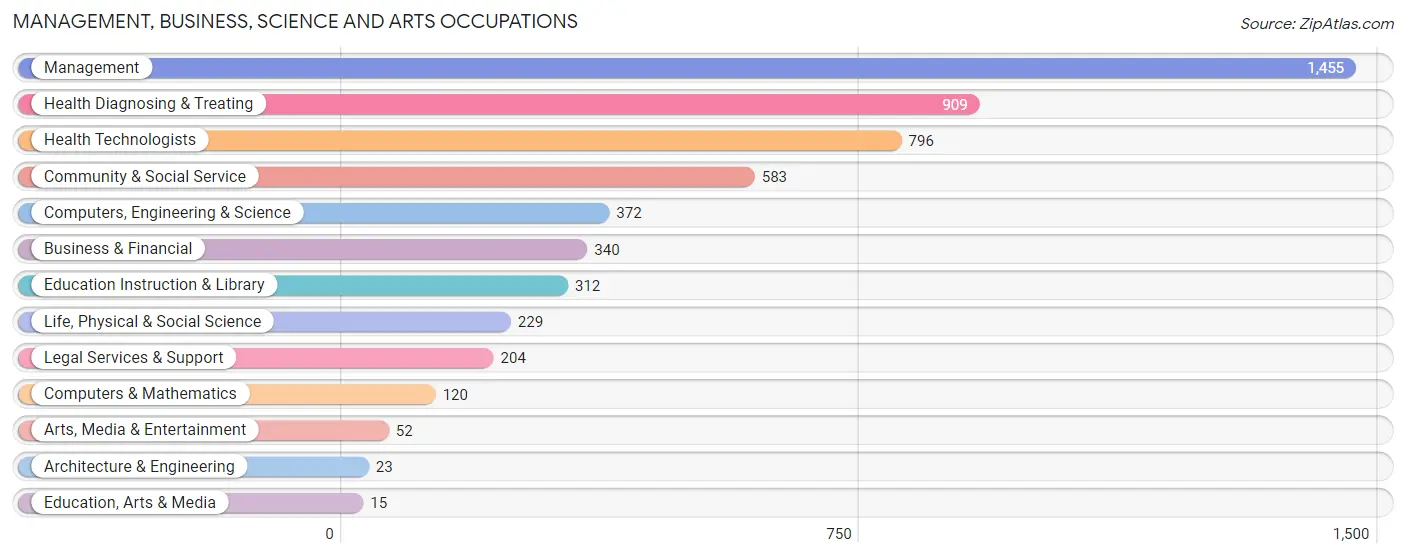
Management, Business, Science and Arts Occupations
The most common Management, Business, Science and Arts occupations in Town and Country are Management (1,455 | 29.3%), Health Diagnosing & Treating (909 | 18.3%), Health Technologists (796 | 16.0%), Community & Social Service (583 | 11.7%), and Computers, Engineering & Science (372 | 7.5%).
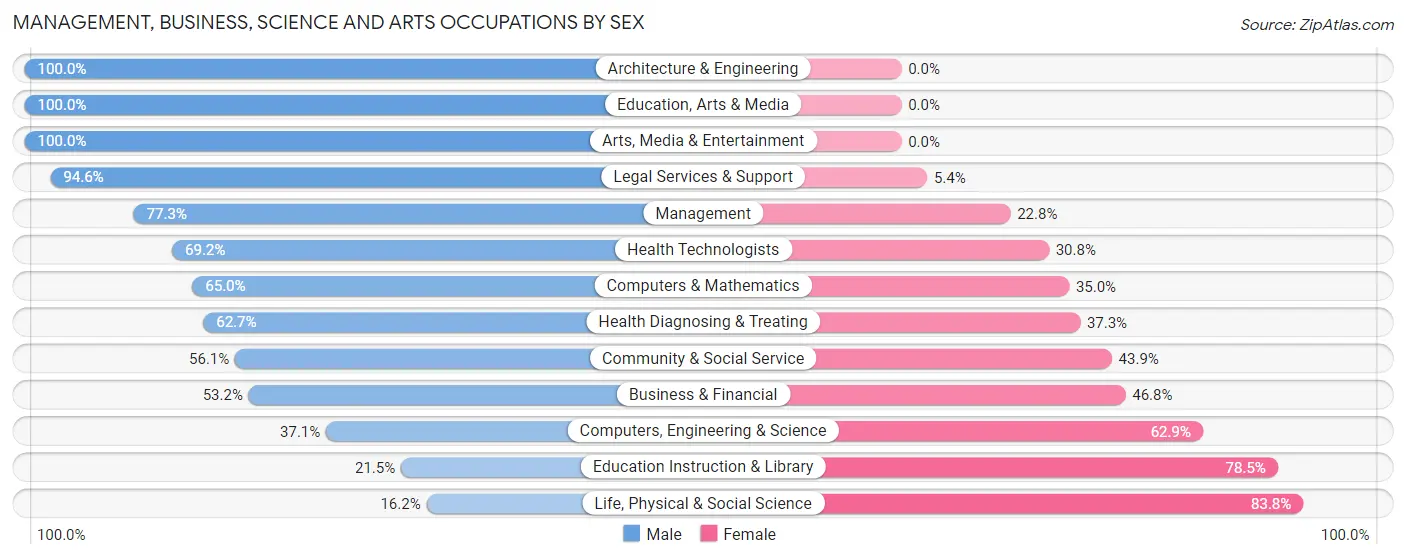
Management, Business, Science and Arts Occupations by Sex
Within the Management, Business, Science and Arts occupations in Town and Country, the most male-oriented occupations are Architecture & Engineering (100.0%), Education, Arts & Media (100.0%), and Arts, Media & Entertainment (100.0%), while the most female-oriented occupations are Life, Physical & Social Science (83.8%), Education Instruction & Library (78.5%), and Computers, Engineering & Science (62.9%).
| Occupation | Male | Female |
| Management | 1,124 (77.2%) | 331 (22.8%) |
| Business & Financial | 181 (53.2%) | 159 (46.8%) |
| Computers, Engineering & Science | 138 (37.1%) | 234 (62.9%) |
| Computers & Mathematics | 78 (65.0%) | 42 (35.0%) |
| Architecture & Engineering | 23 (100.0%) | 0 (0.0%) |
| Life, Physical & Social Science | 37 (16.2%) | 192 (83.8%) |
| Community & Social Service | 327 (56.1%) | 256 (43.9%) |
| Education, Arts & Media | 15 (100.0%) | 0 (0.0%) |
| Legal Services & Support | 193 (94.6%) | 11 (5.4%) |
| Education Instruction & Library | 67 (21.5%) | 245 (78.5%) |
| Arts, Media & Entertainment | 52 (100.0%) | 0 (0.0%) |
| Health Diagnosing & Treating | 570 (62.7%) | 339 (37.3%) |
| Health Technologists | 551 (69.2%) | 245 (30.8%) |
| Total (Category) | 2,340 (63.9%) | 1,319 (36.0%) |
| Total (Overall) | 3,072 (61.9%) | 1,892 (38.1%) |
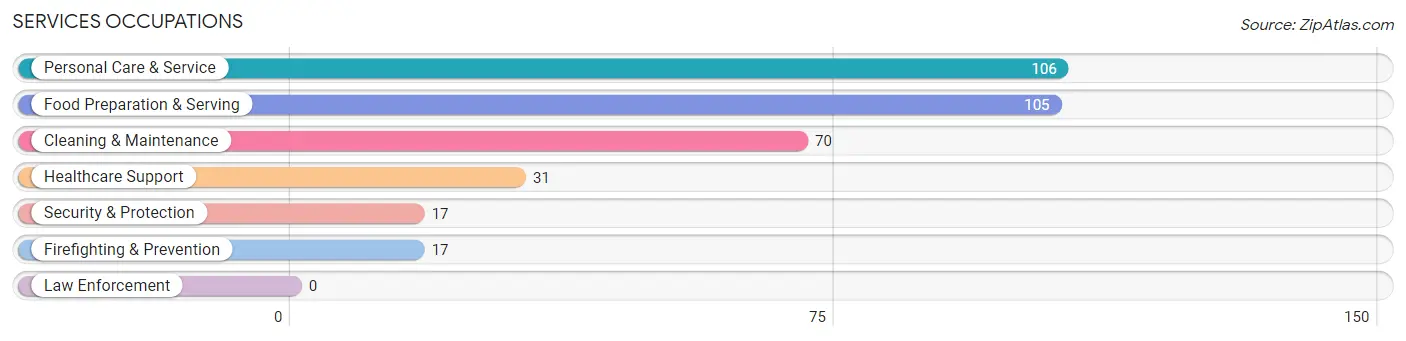
Services Occupations
The most common Services occupations in Town and Country are Personal Care & Service (106 | 2.1%), Food Preparation & Serving (105 | 2.1%), Cleaning & Maintenance (70 | 1.4%), Healthcare Support (31 | 0.6%), and Security & Protection (17 | 0.3%).
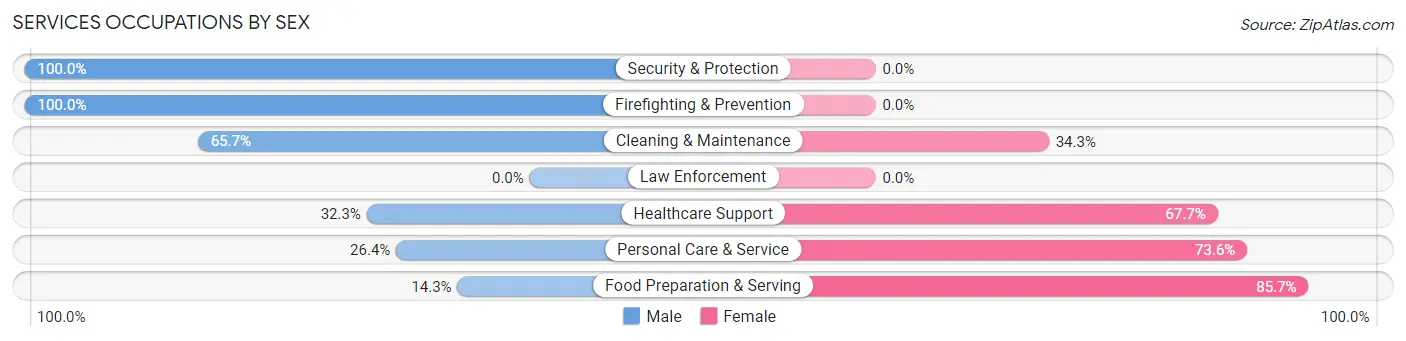
Services Occupations by Sex
Within the Services occupations in Town and Country, the most male-oriented occupations are Security & Protection (100.0%), Firefighting & Prevention (100.0%), and Cleaning & Maintenance (65.7%), while the most female-oriented occupations are Food Preparation & Serving (85.7%), Personal Care & Service (73.6%), and Healthcare Support (67.7%).
| Occupation | Male | Female |
| Healthcare Support | 10 (32.3%) | 21 (67.7%) |
| Security & Protection | 17 (100.0%) | 0 (0.0%) |
| Firefighting & Prevention | 17 (100.0%) | 0 (0.0%) |
| Law Enforcement | 0 (0.0%) | 0 (0.0%) |
| Food Preparation & Serving | 15 (14.3%) | 90 (85.7%) |
| Cleaning & Maintenance | 46 (65.7%) | 24 (34.3%) |
| Personal Care & Service | 28 (26.4%) | 78 (73.6%) |
| Total (Category) | 116 (35.3%) | 213 (64.7%) |
| Total (Overall) | 3,072 (61.9%) | 1,892 (38.1%) |
Sales and Office Occupations
The most common Sales and Office occupations in Town and Country are Sales & Related (619 | 12.5%), and Office & Administration (217 | 4.4%).

Sales and Office Occupations by Sex
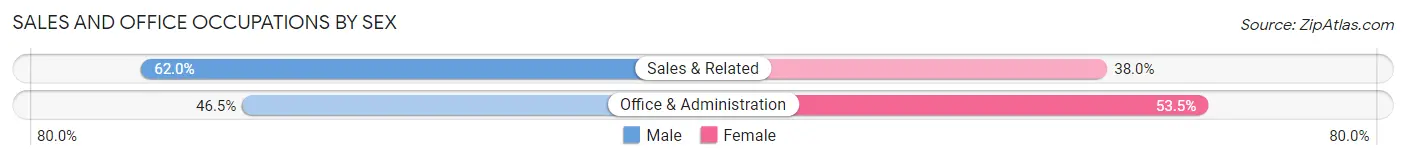
| Occupation | Male | Female |
| Sales & Related | 384 (62.0%) | 235 (38.0%) |
| Office & Administration | 101 (46.5%) | 116 (53.5%) |
| Total (Category) | 485 (58.0%) | 351 (42.0%) |
| Total (Overall) | 3,072 (61.9%) | 1,892 (38.1%) |
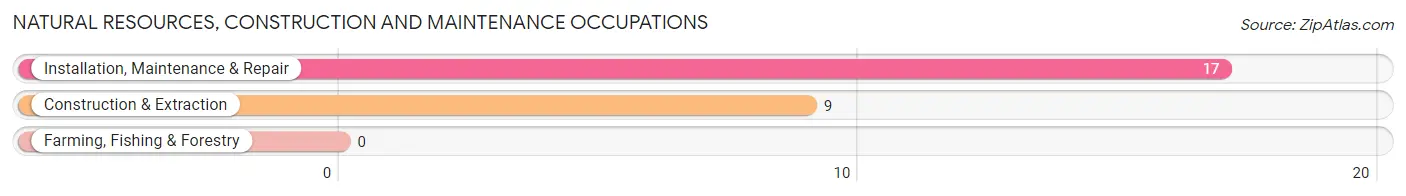
Natural Resources, Construction and Maintenance Occupations
The most common Natural Resources, Construction and Maintenance occupations in Town and Country are Installation, Maintenance & Repair (17 | 0.3%), and Construction & Extraction (9 | 0.2%).
Natural Resources, Construction and Maintenance Occupations by Sex
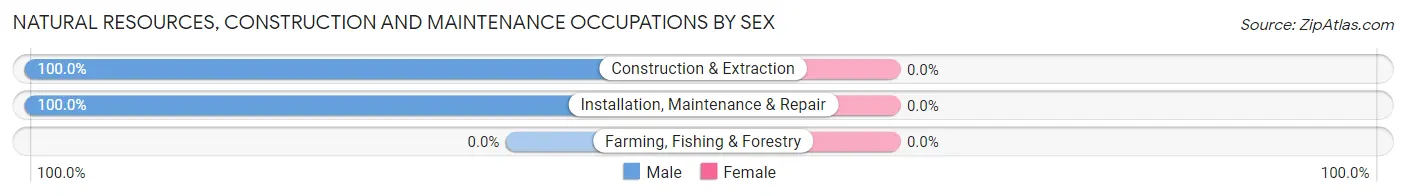
| Occupation | Male | Female |
| Farming, Fishing & Forestry | 0 (0.0%) | 0 (0.0%) |
| Construction & Extraction | 9 (100.0%) | 0 (0.0%) |
| Installation, Maintenance & Repair | 17 (100.0%) | 0 (0.0%) |
| Total (Category) | 26 (100.0%) | 0 (0.0%) |
| Total (Overall) | 3,072 (61.9%) | 1,892 (38.1%) |
Production, Transportation and Moving Occupations
The most common Production, Transportation and Moving occupations in Town and Country are Transportation (87 | 1.8%), Material Moving (17 | 0.3%), and Production (10 | 0.2%).
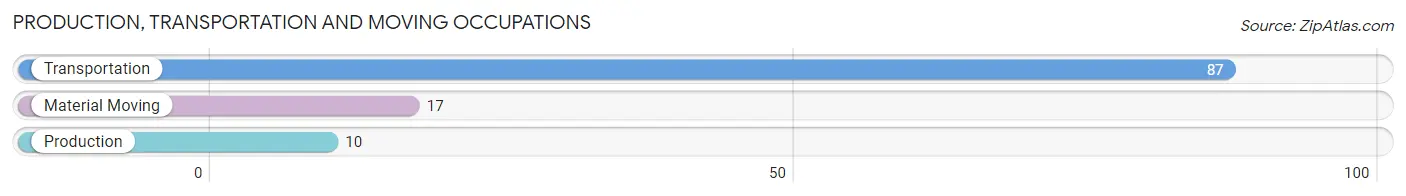
Production, Transportation and Moving Occupations by Sex
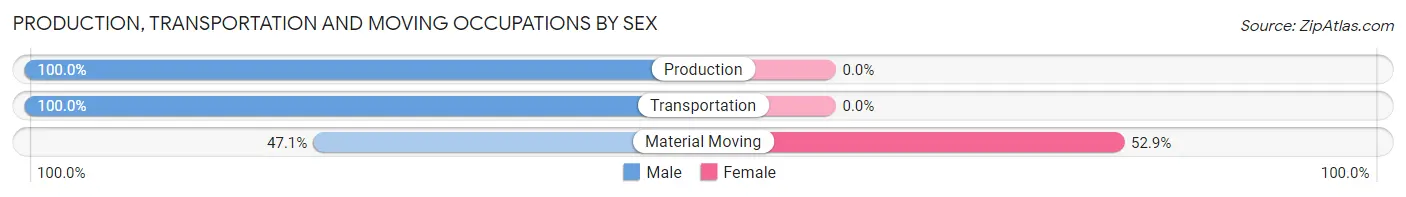
| Occupation | Male | Female |
| Production | 10 (100.0%) | 0 (0.0%) |
| Transportation | 87 (100.0%) | 0 (0.0%) |
| Material Moving | 8 (47.1%) | 9 (52.9%) |
| Total (Category) | 105 (92.1%) | 9 (7.9%) |
| Total (Overall) | 3,072 (61.9%) | 1,892 (38.1%) |
Employment Industries by Sex in Town and Country
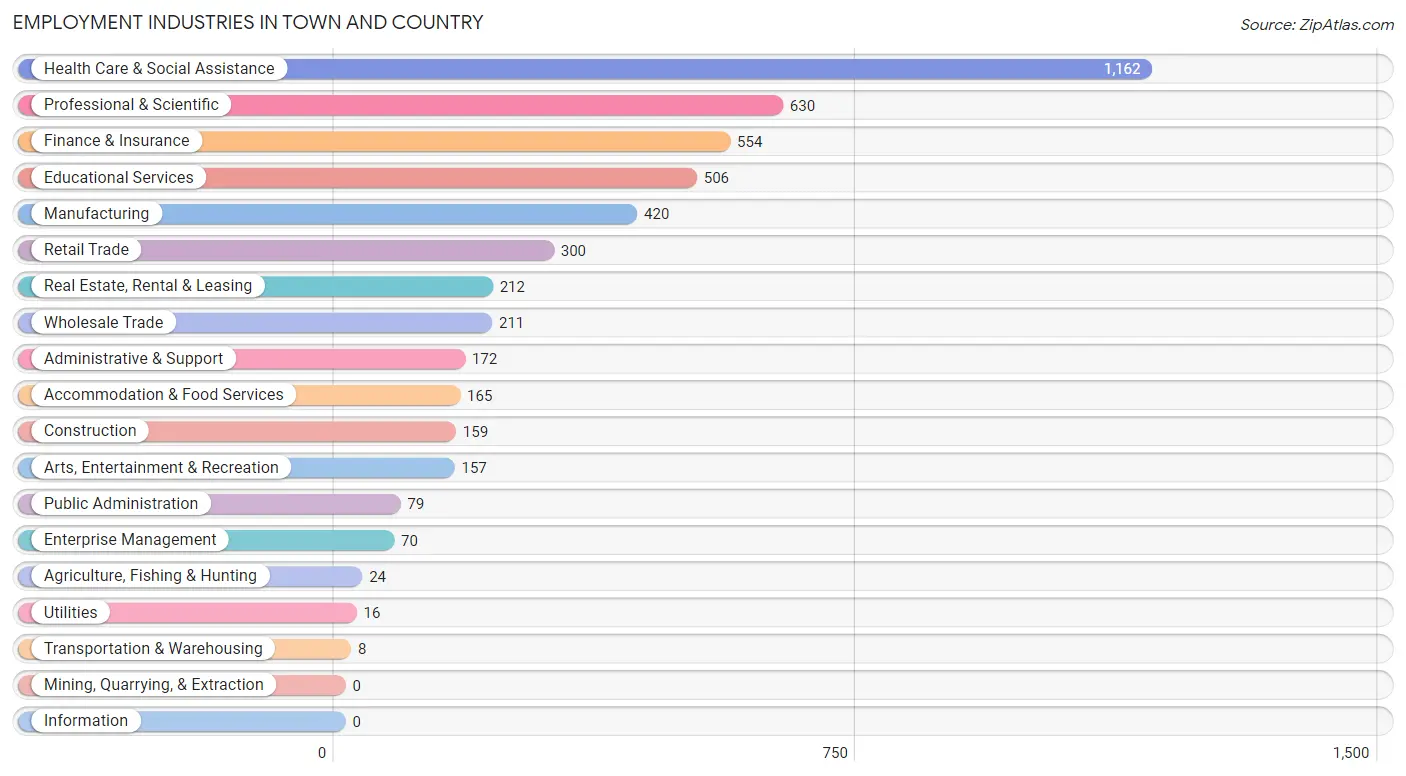
Employment Industries in Town and Country
The major employment industries in Town and Country include Health Care & Social Assistance (1,162 | 23.4%), Professional & Scientific (630 | 12.7%), Finance & Insurance (554 | 11.2%), Educational Services (506 | 10.2%), and Manufacturing (420 | 8.5%).
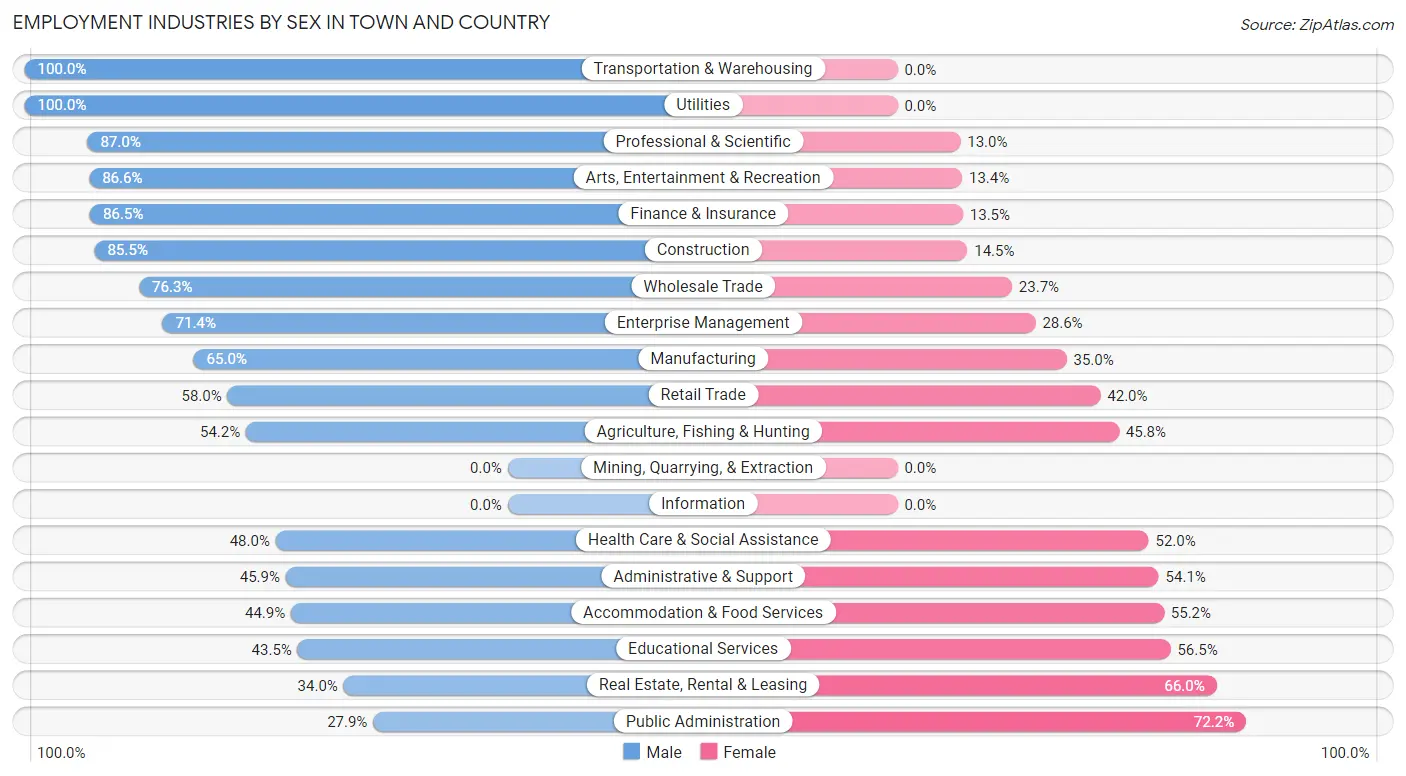
Employment Industries by Sex in Town and Country
The Town and Country industries that see more men than women are Transportation & Warehousing (100.0%), Utilities (100.0%), and Professional & Scientific (87.0%), whereas the industries that tend to have a higher number of women are Public Administration (72.2%), Real Estate, Rental & Leasing (66.0%), and Educational Services (56.5%).
| Industry | Male | Female |
| Agriculture, Fishing & Hunting | 13 (54.2%) | 11 (45.8%) |
| Mining, Quarrying, & Extraction | 0 (0.0%) | 0 (0.0%) |
| Construction | 136 (85.5%) | 23 (14.5%) |
| Manufacturing | 273 (65.0%) | 147 (35.0%) |
| Wholesale Trade | 161 (76.3%) | 50 (23.7%) |
| Retail Trade | 174 (58.0%) | 126 (42.0%) |
| Transportation & Warehousing | 8 (100.0%) | 0 (0.0%) |
| Utilities | 16 (100.0%) | 0 (0.0%) |
| Information | 0 (0.0%) | 0 (0.0%) |
| Finance & Insurance | 479 (86.5%) | 75 (13.5%) |
| Real Estate, Rental & Leasing | 72 (34.0%) | 140 (66.0%) |
| Professional & Scientific | 548 (87.0%) | 82 (13.0%) |
| Enterprise Management | 50 (71.4%) | 20 (28.6%) |
| Administrative & Support | 79 (45.9%) | 93 (54.1%) |
| Educational Services | 220 (43.5%) | 286 (56.5%) |
| Health Care & Social Assistance | 558 (48.0%) | 604 (52.0%) |
| Arts, Entertainment & Recreation | 136 (86.6%) | 21 (13.4%) |
| Accommodation & Food Services | 74 (44.9%) | 91 (55.1%) |
| Public Administration | 22 (27.9%) | 57 (72.2%) |
| Total | 3,072 (61.9%) | 1,892 (38.1%) |
Education in Town and Country
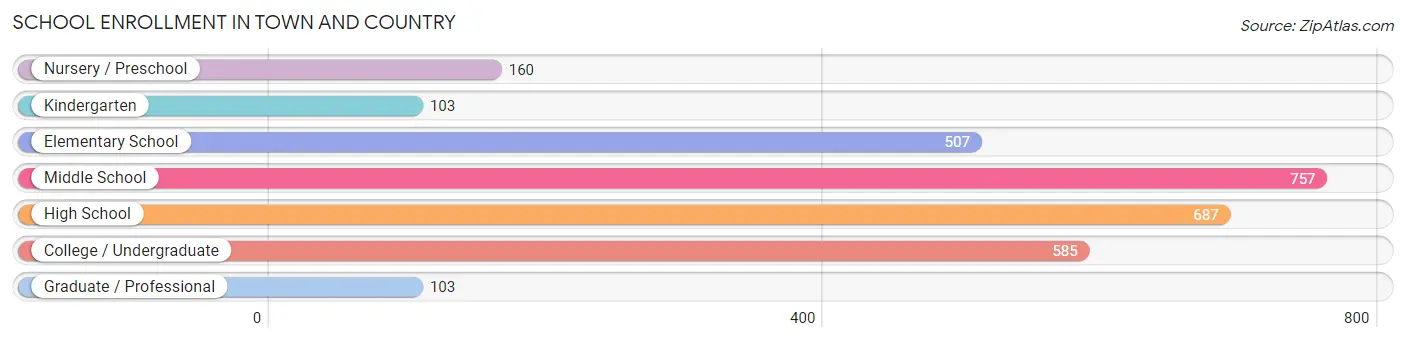
School Enrollment in Town and Country
The most common levels of schooling among the 2,902 students in Town and Country are middle school (757 | 26.1%), high school (687 | 23.7%), and college / undergraduate (585 | 20.2%).
| School Level | # Students | % Students |
| Nursery / Preschool | 160 | 5.5% |
| Kindergarten | 103 | 3.5% |
| Elementary School | 507 | 17.5% |
| Middle School | 757 | 26.1% |
| High School | 687 | 23.7% |
| College / Undergraduate | 585 | 20.2% |
| Graduate / Professional | 103 | 3.5% |
| Total | 2,902 | 100.0% |
School Enrollment by Age by Funding Source in Town and Country
Out of a total of 2,902 students who are enrolled in schools in Town and Country, 1,735 (59.8%) attend a private institution, while the remaining 1,167 (40.2%) are enrolled in public schools. The age group of 3 to 4 year olds has the highest likelihood of being enrolled in private schools, with 132 (92.3% in the age bracket) enrolled. Conversely, the age group of 10 to 14 year olds has the lowest likelihood of being enrolled in a private school, with 466 (53.9% in the age bracket) attending a public institution.
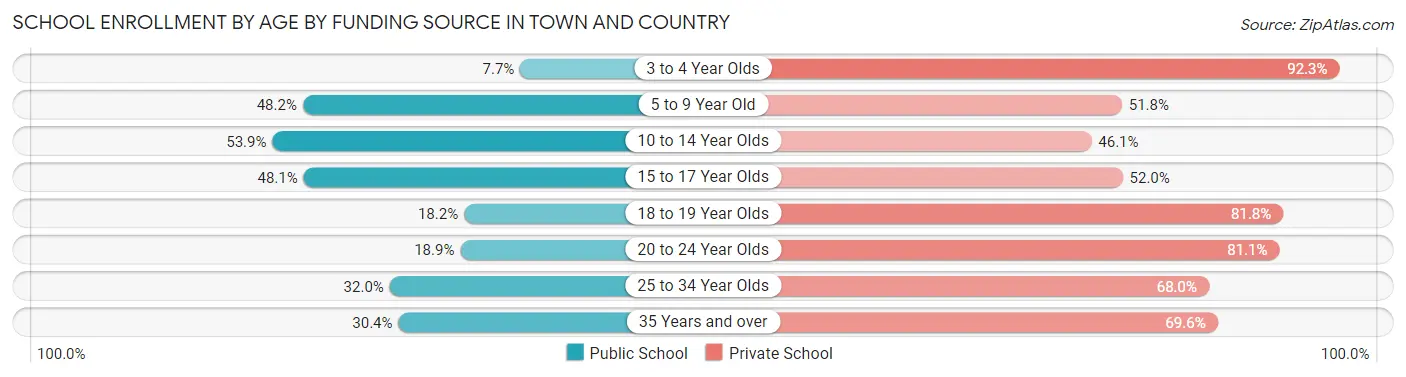
| Age Bracket | Public School | Private School |
| 3 to 4 Year Olds | 11 (7.7%) | 132 (92.3%) |
| 5 to 9 Year Old | 279 (48.2%) | 300 (51.8%) |
| 10 to 14 Year Olds | 466 (53.9%) | 399 (46.1%) |
| 15 to 17 Year Olds | 246 (48.0%) | 266 (51.9%) |
| 18 to 19 Year Olds | 81 (18.2%) | 365 (81.8%) |
| 20 to 24 Year Olds | 43 (18.9%) | 185 (81.1%) |
| 25 to 34 Year Olds | 16 (32.0%) | 34 (68.0%) |
| 35 Years and over | 24 (30.4%) | 55 (69.6%) |
| Total | 1,167 (40.2%) | 1,735 (59.8%) |
Educational Attainment by Field of Study in Town and Country
Business (1,781 | 25.4%), science & technology (672 | 9.6%), social sciences (622 | 8.9%), bio, nature & agricultural (560 | 8.0%), and education (518 | 7.4%) are the most common fields of study among 7,008 individuals in Town and Country who have obtained a bachelor's degree or higher.
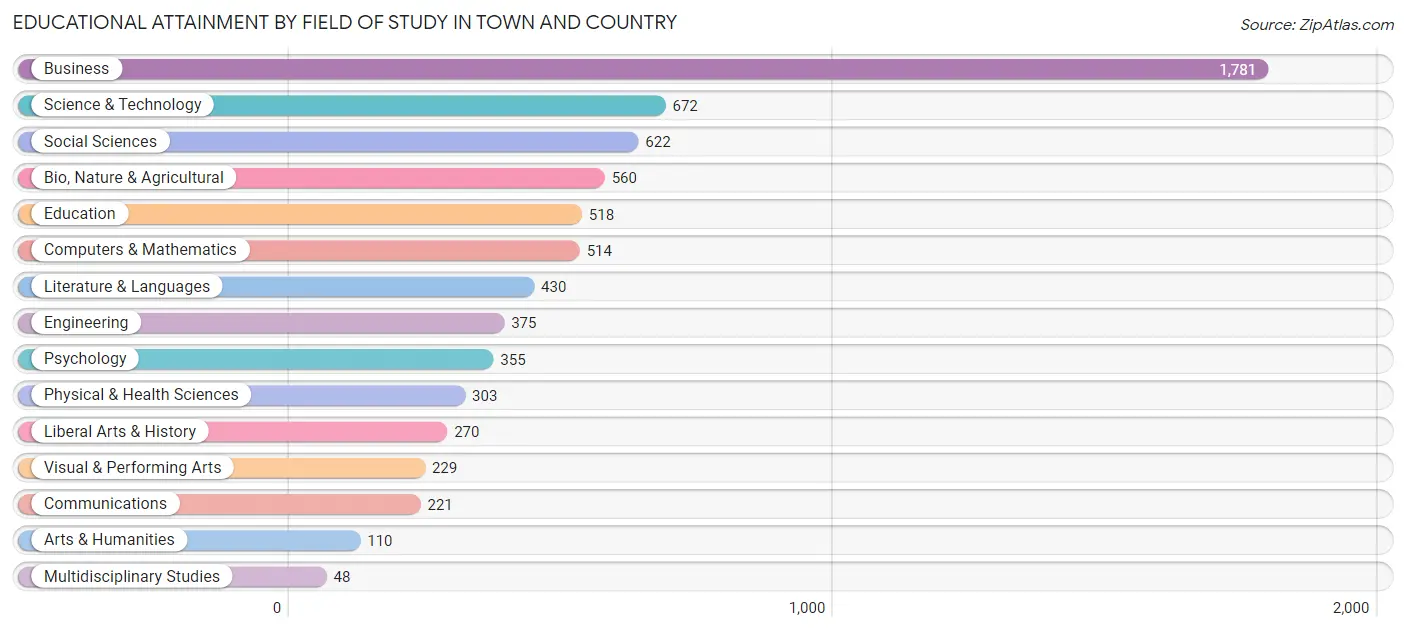
| Field of Study | # Graduates | % Graduates |
| Computers & Mathematics | 514 | 7.3% |
| Bio, Nature & Agricultural | 560 | 8.0% |
| Physical & Health Sciences | 303 | 4.3% |
| Psychology | 355 | 5.1% |
| Social Sciences | 622 | 8.9% |
| Engineering | 375 | 5.3% |
| Multidisciplinary Studies | 48 | 0.7% |
| Science & Technology | 672 | 9.6% |
| Business | 1,781 | 25.4% |
| Education | 518 | 7.4% |
| Literature & Languages | 430 | 6.1% |
| Liberal Arts & History | 270 | 3.8% |
| Visual & Performing Arts | 229 | 3.3% |
| Communications | 221 | 3.2% |
| Arts & Humanities | 110 | 1.6% |
| Total | 7,008 | 100.0% |
Transportation & Commute in Town and Country
Vehicle Availability by Sex in Town and Country
The most prevalent vehicle ownership categories in Town and Country are males with 2 vehicles (1,408, accounting for 47.0%) and females with 2 vehicles (954, making up 76.5%).
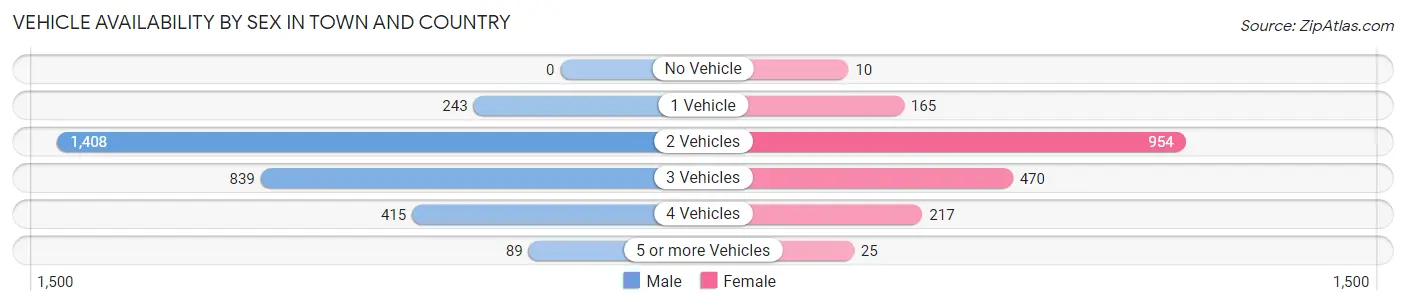
| Vehicles Available | Male | Female |
| No Vehicle | 0 (0.0%) | 10 (0.5%) |
| 1 Vehicle | 243 (8.1%) | 165 (9.0%) |
| 2 Vehicles | 1,408 (47.0%) | 954 (51.8%) |
| 3 Vehicles | 839 (28.0%) | 470 (25.5%) |
| 4 Vehicles | 415 (13.9%) | 217 (11.8%) |
| 5 or more Vehicles | 89 (3.0%) | 25 (1.4%) |
| Total | 2,994 (100.0%) | 1,841 (100.0%) |
Commute Time in Town and Country
The most frequently occuring commute durations in Town and Country are 15 to 19 minutes (1,182 commuters, 27.9%), 20 to 24 minutes (1,039 commuters, 24.5%), and 10 to 14 minutes (469 commuters, 11.1%).
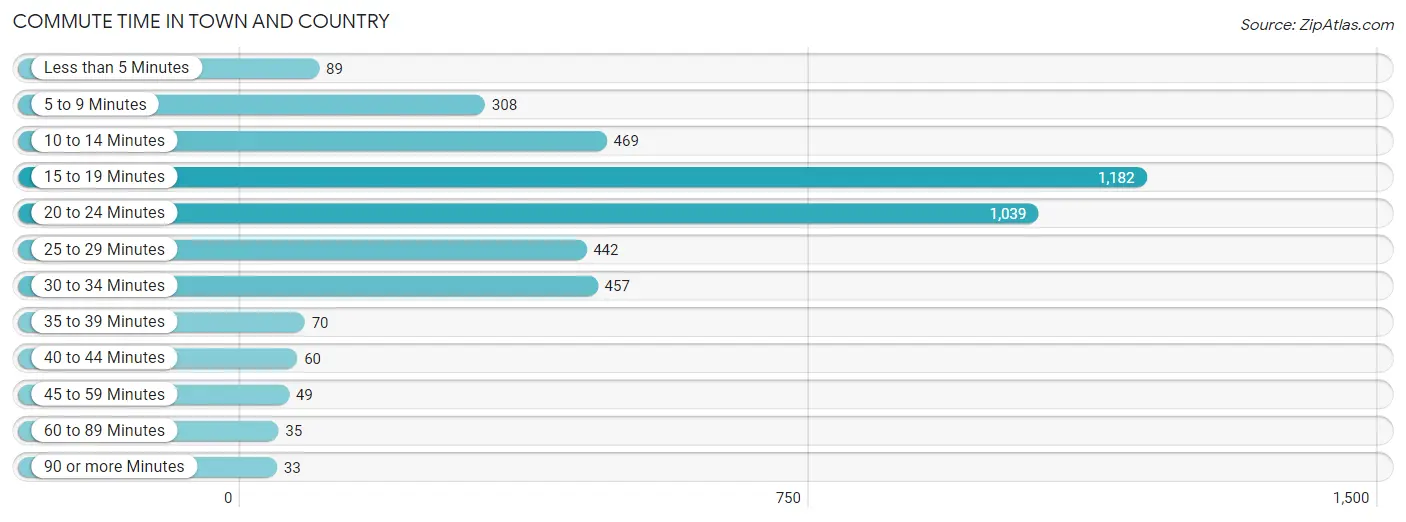
| Commute Time | # Commuters | % Commuters |
| Less than 5 Minutes | 89 | 2.1% |
| 5 to 9 Minutes | 308 | 7.3% |
| 10 to 14 Minutes | 469 | 11.1% |
| 15 to 19 Minutes | 1,182 | 27.9% |
| 20 to 24 Minutes | 1,039 | 24.5% |
| 25 to 29 Minutes | 442 | 10.4% |
| 30 to 34 Minutes | 457 | 10.8% |
| 35 to 39 Minutes | 70 | 1.7% |
| 40 to 44 Minutes | 60 | 1.4% |
| 45 to 59 Minutes | 49 | 1.2% |
| 60 to 89 Minutes | 35 | 0.8% |
| 90 or more Minutes | 33 | 0.8% |
Commute Time by Sex in Town and Country
The most common commute times in Town and Country are 15 to 19 minutes (825 commuters, 30.7%) for males and 20 to 24 minutes (367 commuters, 23.7%) for females.
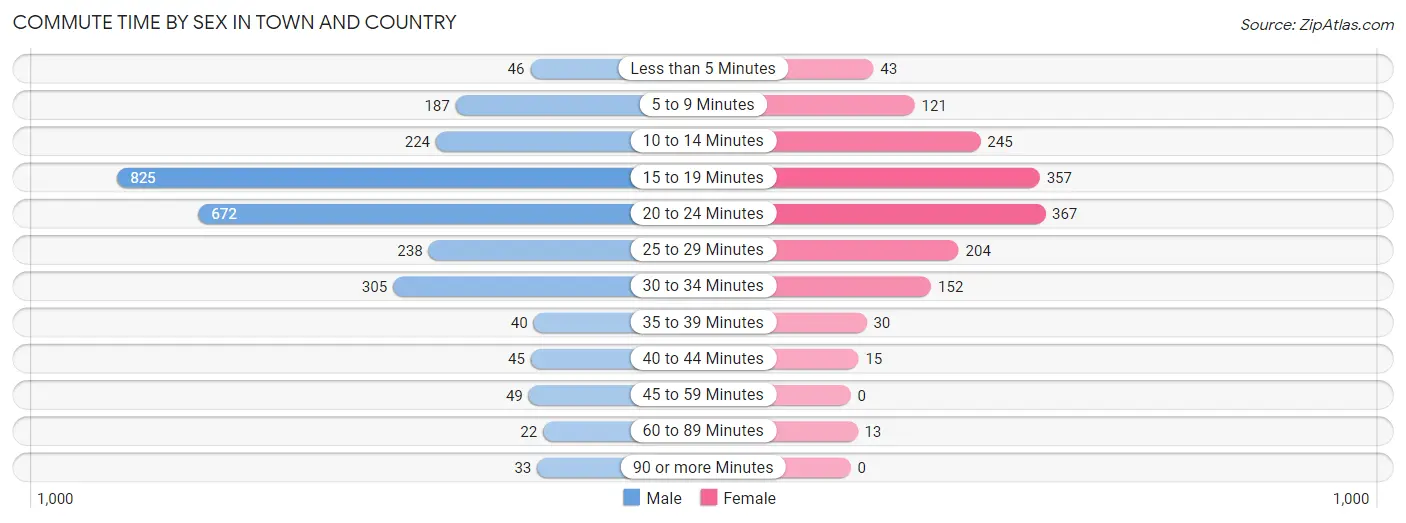
| Commute Time | Male | Female |
| Less than 5 Minutes | 46 (1.7%) | 43 (2.8%) |
| 5 to 9 Minutes | 187 (7.0%) | 121 (7.8%) |
| 10 to 14 Minutes | 224 (8.3%) | 245 (15.8%) |
| 15 to 19 Minutes | 825 (30.7%) | 357 (23.1%) |
| 20 to 24 Minutes | 672 (25.0%) | 367 (23.7%) |
| 25 to 29 Minutes | 238 (8.9%) | 204 (13.2%) |
| 30 to 34 Minutes | 305 (11.4%) | 152 (9.8%) |
| 35 to 39 Minutes | 40 (1.5%) | 30 (1.9%) |
| 40 to 44 Minutes | 45 (1.7%) | 15 (1.0%) |
| 45 to 59 Minutes | 49 (1.8%) | 0 (0.0%) |
| 60 to 89 Minutes | 22 (0.8%) | 13 (0.8%) |
| 90 or more Minutes | 33 (1.2%) | 0 (0.0%) |
Time of Departure to Work by Sex in Town and Country
The most frequent times of departure to work in Town and Country are 7:00 AM to 7:29 AM (712, 26.5%) for males and 7:00 AM to 7:29 AM (388, 25.1%) for females.
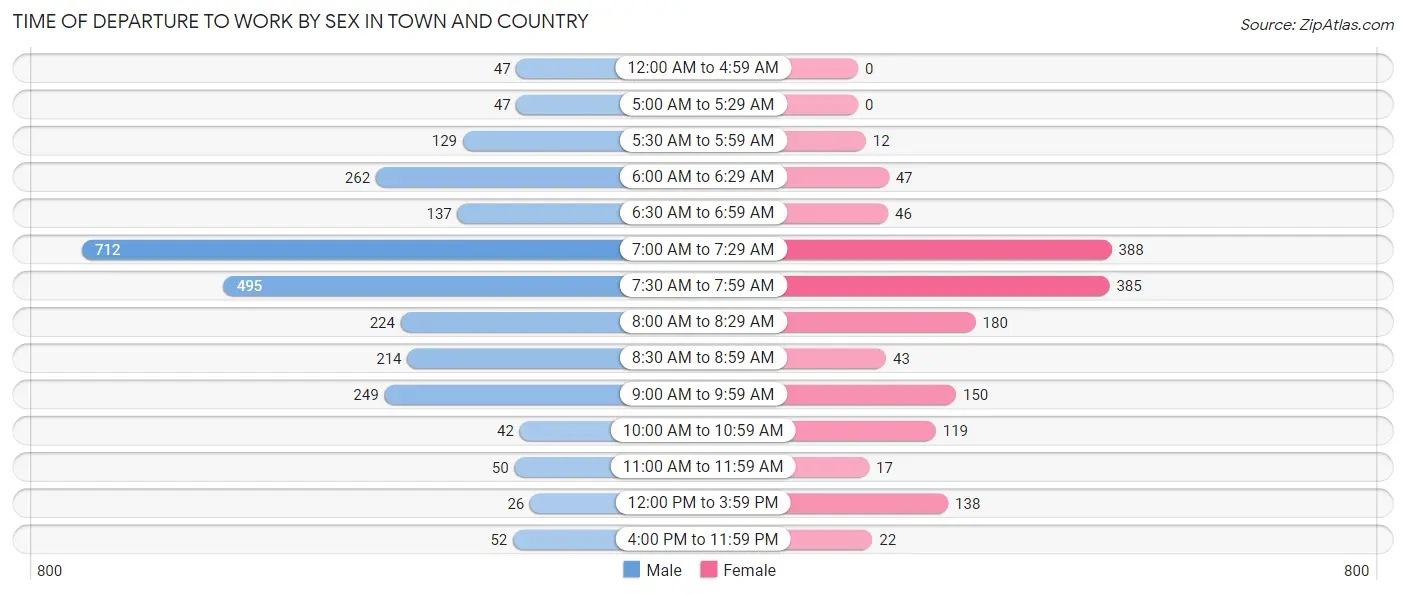
| Time of Departure | Male | Female |
| 12:00 AM to 4:59 AM | 47 (1.8%) | 0 (0.0%) |
| 5:00 AM to 5:29 AM | 47 (1.8%) | 0 (0.0%) |
| 5:30 AM to 5:59 AM | 129 (4.8%) | 12 (0.8%) |
| 6:00 AM to 6:29 AM | 262 (9.8%) | 47 (3.0%) |
| 6:30 AM to 6:59 AM | 137 (5.1%) | 46 (3.0%) |
| 7:00 AM to 7:29 AM | 712 (26.5%) | 388 (25.1%) |
| 7:30 AM to 7:59 AM | 495 (18.4%) | 385 (24.9%) |
| 8:00 AM to 8:29 AM | 224 (8.3%) | 180 (11.6%) |
| 8:30 AM to 8:59 AM | 214 (8.0%) | 43 (2.8%) |
| 9:00 AM to 9:59 AM | 249 (9.3%) | 150 (9.7%) |
| 10:00 AM to 10:59 AM | 42 (1.6%) | 119 (7.7%) |
| 11:00 AM to 11:59 AM | 50 (1.9%) | 17 (1.1%) |
| 12:00 PM to 3:59 PM | 26 (1.0%) | 138 (8.9%) |
| 4:00 PM to 11:59 PM | 52 (1.9%) | 22 (1.4%) |
| Total | 2,686 (100.0%) | 1,547 (100.0%) |
Housing Occupancy in Town and Country
Occupancy by Ownership in Town and Country
Of the total 4,147 dwellings in Town and Country, owner-occupied units account for 3,651 (88.0%), while renter-occupied units make up 496 (12.0%).
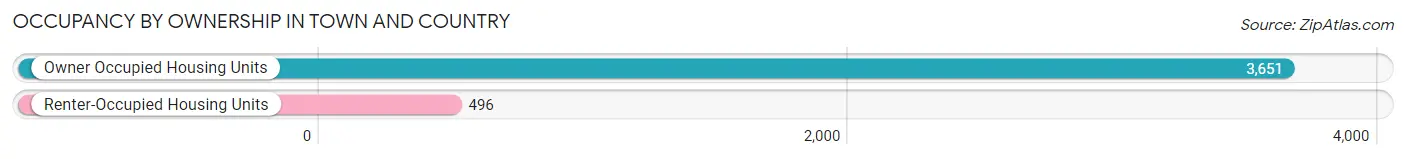
| Occupancy | # Housing Units | % Housing Units |
| Owner Occupied Housing Units | 3,651 | 88.0% |
| Renter-Occupied Housing Units | 496 | 12.0% |
| Total Occupied Housing Units | 4,147 | 100.0% |
Occupancy by Household Size in Town and Country
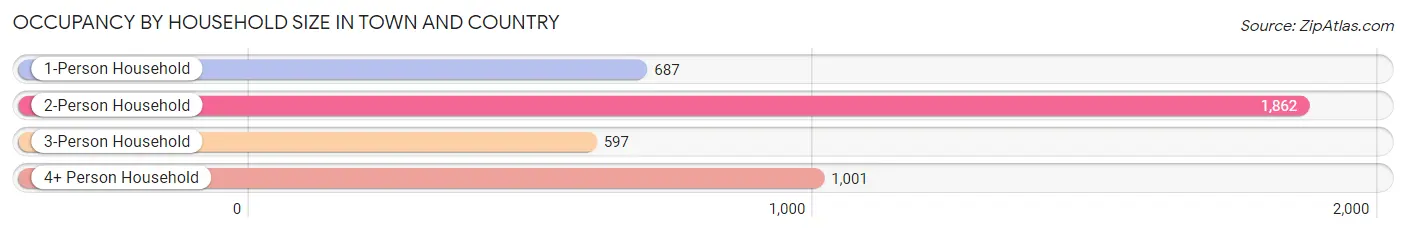
| Household Size | # Housing Units | % Housing Units |
| 1-Person Household | 687 | 16.6% |
| 2-Person Household | 1,862 | 44.9% |
| 3-Person Household | 597 | 14.4% |
| 4+ Person Household | 1,001 | 24.1% |
| Total Housing Units | 4,147 | 100.0% |
Occupancy by Ownership by Household Size in Town and Country
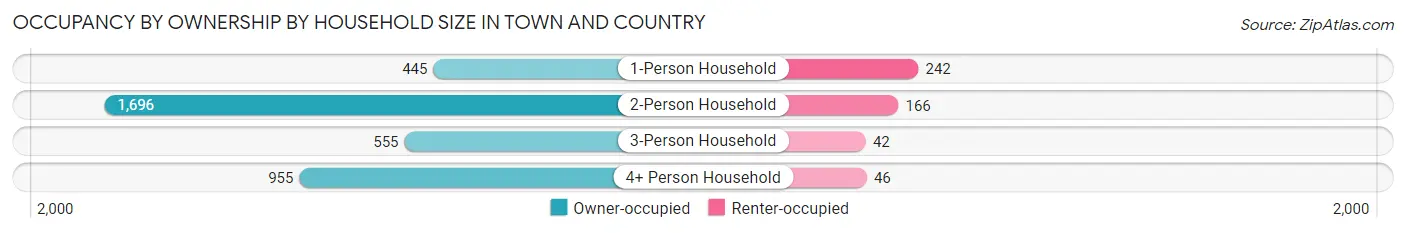
| Household Size | Owner-occupied | Renter-occupied |
| 1-Person Household | 445 (64.8%) | 242 (35.2%) |
| 2-Person Household | 1,696 (91.1%) | 166 (8.9%) |
| 3-Person Household | 555 (93.0%) | 42 (7.0%) |
| 4+ Person Household | 955 (95.4%) | 46 (4.6%) |
| Total Housing Units | 3,651 (88.0%) | 496 (12.0%) |
Occupancy by Educational Attainment in Town and Country
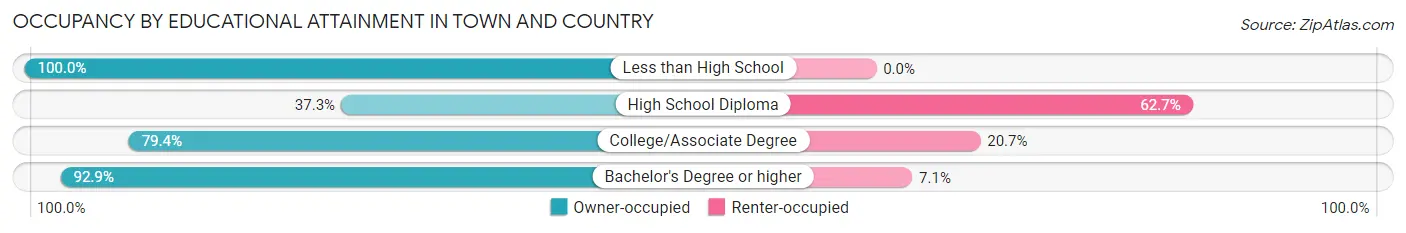
| Household Size | Owner-occupied | Renter-occupied |
| Less than High School | 20 (100.0%) | 0 (0.0%) |
| High School Diploma | 88 (37.3%) | 148 (62.7%) |
| College/Associate Degree | 415 (79.3%) | 108 (20.6%) |
| Bachelor's Degree or higher | 3,128 (92.9%) | 240 (7.1%) |
Occupancy by Age of Householder in Town and Country
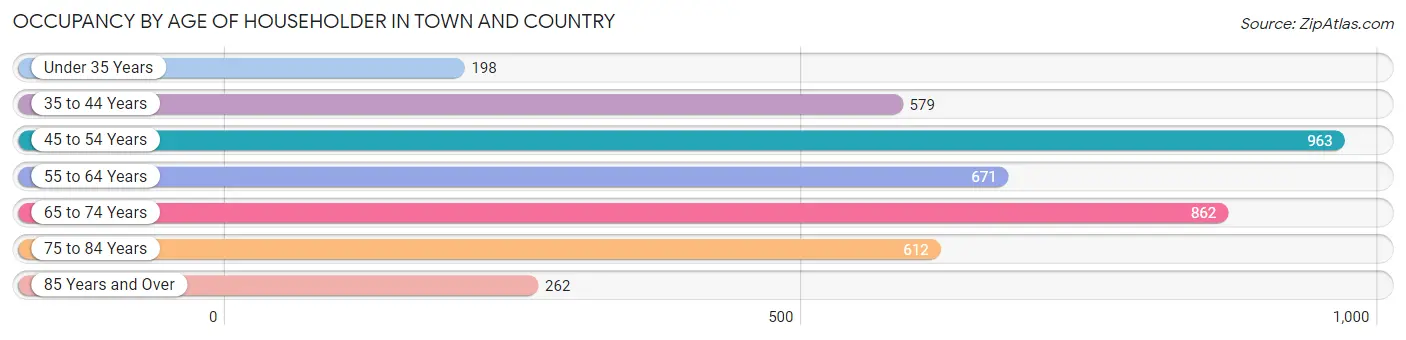
| Age Bracket | # Households | % Households |
| Under 35 Years | 198 | 4.8% |
| 35 to 44 Years | 579 | 14.0% |
| 45 to 54 Years | 963 | 23.2% |
| 55 to 64 Years | 671 | 16.2% |
| 65 to 74 Years | 862 | 20.8% |
| 75 to 84 Years | 612 | 14.8% |
| 85 Years and Over | 262 | 6.3% |
| Total | 4,147 | 100.0% |
Housing Finances in Town and Country
Median Income by Occupancy in Town and Country
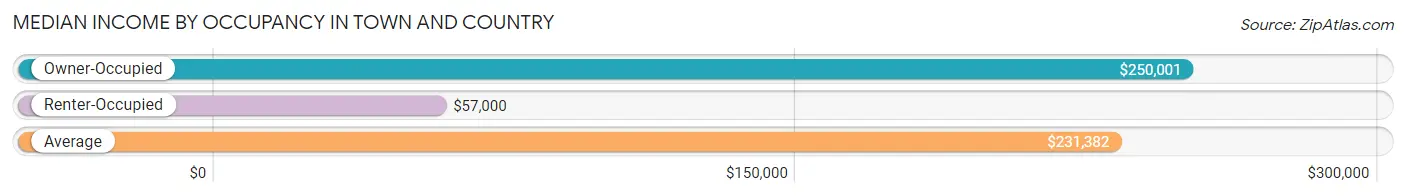
| Occupancy Type | # Households | Median Income |
| Owner-Occupied | 3,651 (88.0%) | $250,001 |
| Renter-Occupied | 496 (12.0%) | $57,000 |
| Average | 4,147 (100.0%) | $231,382 |
Occupancy by Householder Income Bracket in Town and Country
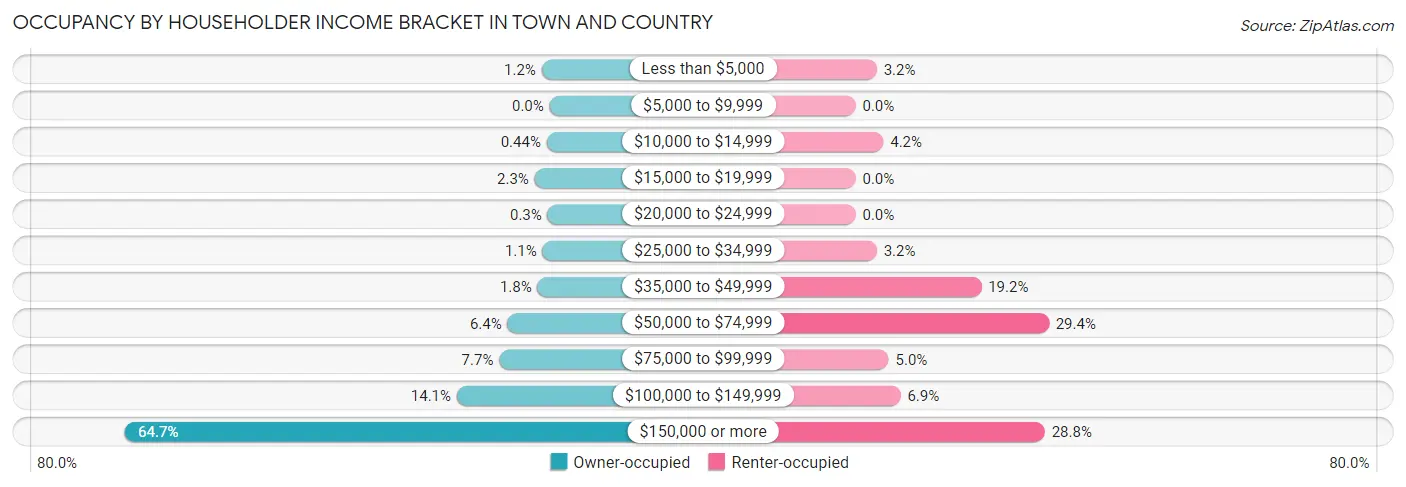
| Income Bracket | Owner-occupied | Renter-occupied |
| Less than $5,000 | 44 (1.2%) | 16 (3.2%) |
| $5,000 to $9,999 | 0 (0.0%) | 0 (0.0%) |
| $10,000 to $14,999 | 16 (0.4%) | 21 (4.2%) |
| $15,000 to $19,999 | 83 (2.3%) | 0 (0.0%) |
| $20,000 to $24,999 | 11 (0.3%) | 0 (0.0%) |
| $25,000 to $34,999 | 39 (1.1%) | 16 (3.2%) |
| $35,000 to $49,999 | 67 (1.8%) | 95 (19.2%) |
| $50,000 to $74,999 | 234 (6.4%) | 146 (29.4%) |
| $75,000 to $99,999 | 280 (7.7%) | 25 (5.0%) |
| $100,000 to $149,999 | 516 (14.1%) | 34 (6.9%) |
| $150,000 or more | 2,361 (64.7%) | 143 (28.8%) |
| Total | 3,651 (100.0%) | 496 (100.0%) |
Monthly Housing Cost Tiers in Town and Country
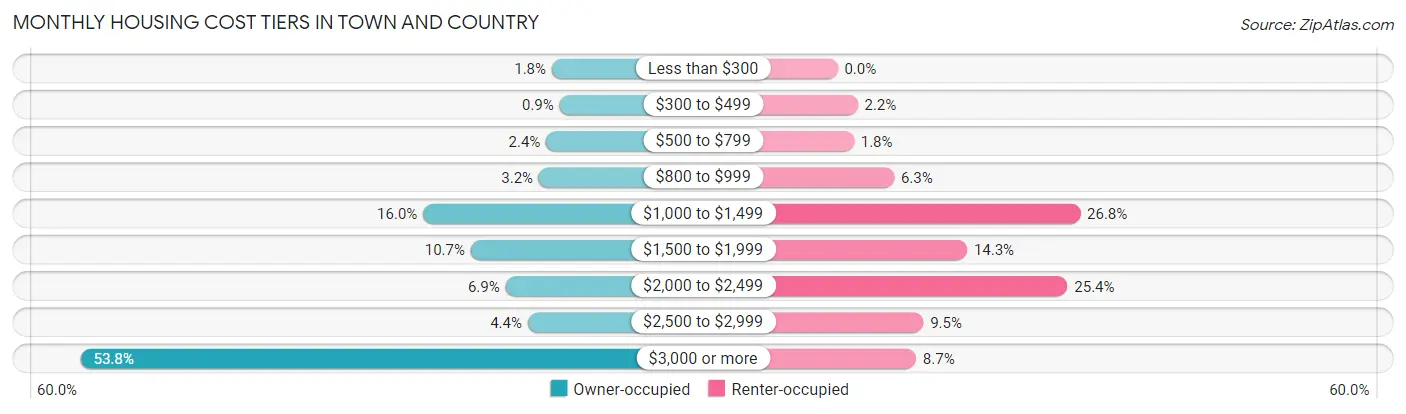
| Monthly Cost | Owner-occupied | Renter-occupied |
| Less than $300 | 64 (1.8%) | 0 (0.0%) |
| $300 to $499 | 33 (0.9%) | 11 (2.2%) |
| $500 to $799 | 87 (2.4%) | 9 (1.8%) |
| $800 to $999 | 116 (3.2%) | 31 (6.2%) |
| $1,000 to $1,499 | 583 (16.0%) | 133 (26.8%) |
| $1,500 to $1,999 | 391 (10.7%) | 71 (14.3%) |
| $2,000 to $2,499 | 251 (6.9%) | 126 (25.4%) |
| $2,500 to $2,999 | 161 (4.4%) | 47 (9.5%) |
| $3,000 or more | 1,965 (53.8%) | 43 (8.7%) |
| Total | 3,651 (100.0%) | 496 (100.0%) |
Physical Housing Characteristics in Town and Country
Housing Structures in Town and Country
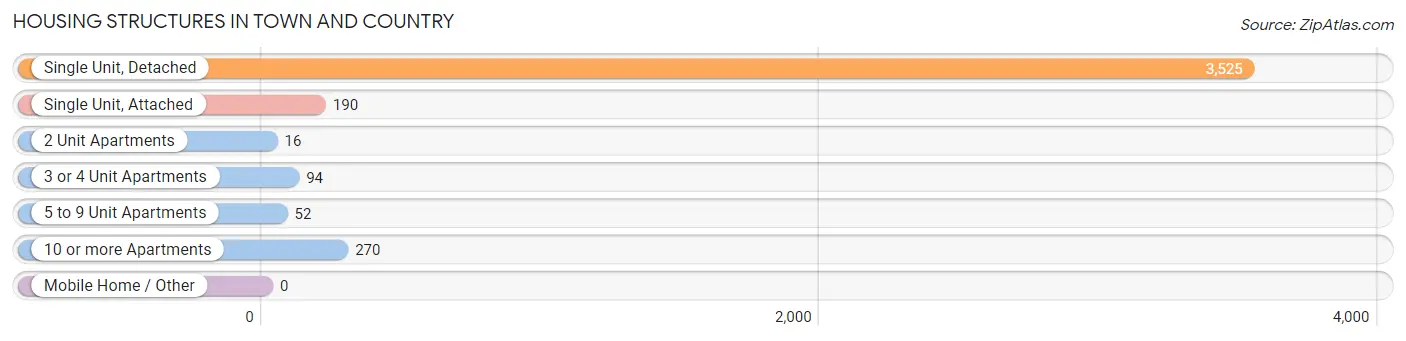
| Structure Type | # Housing Units | % Housing Units |
| Single Unit, Detached | 3,525 | 85.0% |
| Single Unit, Attached | 190 | 4.6% |
| 2 Unit Apartments | 16 | 0.4% |
| 3 or 4 Unit Apartments | 94 | 2.3% |
| 5 to 9 Unit Apartments | 52 | 1.3% |
| 10 or more Apartments | 270 | 6.5% |
| Mobile Home / Other | 0 | 0.0% |
| Total | 4,147 | 100.0% |
Housing Structures by Occupancy in Town and Country
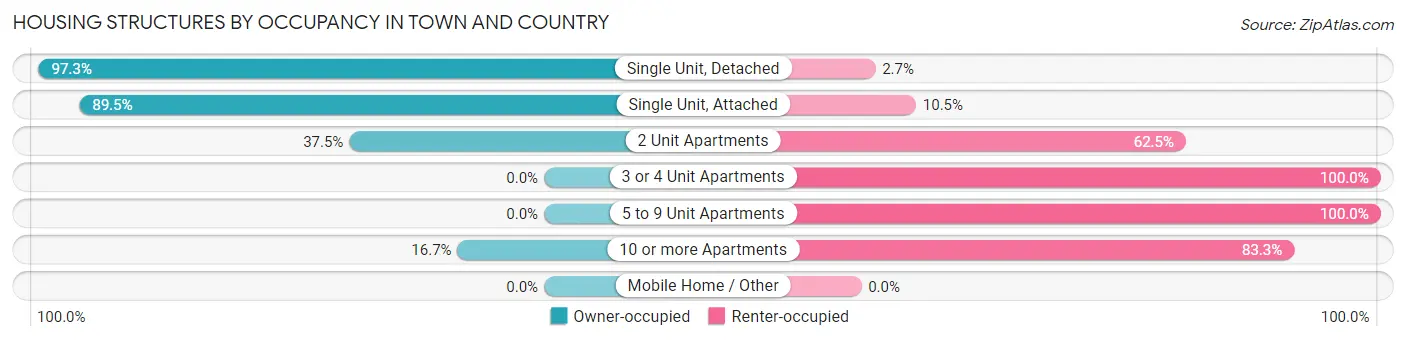
| Structure Type | Owner-occupied | Renter-occupied |
| Single Unit, Detached | 3,430 (97.3%) | 95 (2.7%) |
| Single Unit, Attached | 170 (89.5%) | 20 (10.5%) |
| 2 Unit Apartments | 6 (37.5%) | 10 (62.5%) |
| 3 or 4 Unit Apartments | 0 (0.0%) | 94 (100.0%) |
| 5 to 9 Unit Apartments | 0 (0.0%) | 52 (100.0%) |
| 10 or more Apartments | 45 (16.7%) | 225 (83.3%) |
| Mobile Home / Other | 0 (0.0%) | 0 (0.0%) |
| Total | 3,651 (88.0%) | 496 (12.0%) |
Housing Structures by Number of Rooms in Town and Country
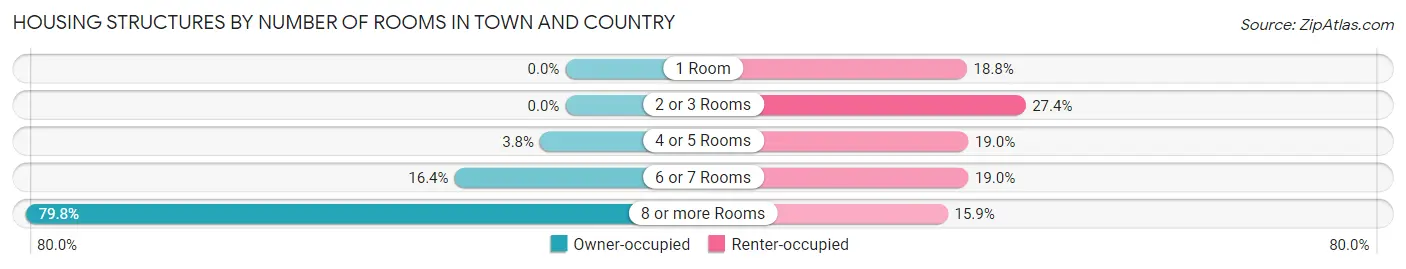
| Number of Rooms | Owner-occupied | Renter-occupied |
| 1 Room | 0 (0.0%) | 93 (18.8%) |
| 2 or 3 Rooms | 0 (0.0%) | 136 (27.4%) |
| 4 or 5 Rooms | 137 (3.7%) | 94 (19.0%) |
| 6 or 7 Rooms | 599 (16.4%) | 94 (19.0%) |
| 8 or more Rooms | 2,915 (79.8%) | 79 (15.9%) |
| Total | 3,651 (100.0%) | 496 (100.0%) |
Housing Structure by Heating Type in Town and Country
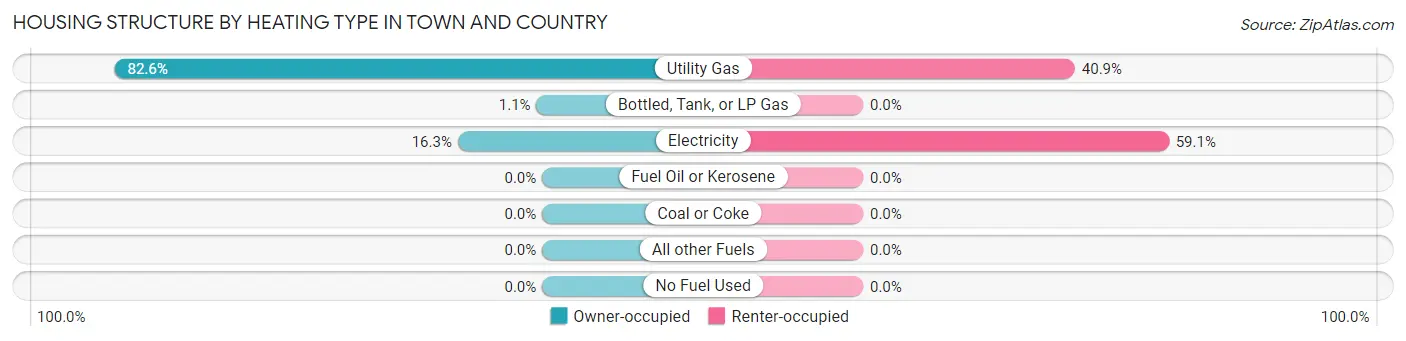
| Heating Type | Owner-occupied | Renter-occupied |
| Utility Gas | 3,016 (82.6%) | 203 (40.9%) |
| Bottled, Tank, or LP Gas | 40 (1.1%) | 0 (0.0%) |
| Electricity | 595 (16.3%) | 293 (59.1%) |
| Fuel Oil or Kerosene | 0 (0.0%) | 0 (0.0%) |
| Coal or Coke | 0 (0.0%) | 0 (0.0%) |
| All other Fuels | 0 (0.0%) | 0 (0.0%) |
| No Fuel Used | 0 (0.0%) | 0 (0.0%) |
| Total | 3,651 (100.0%) | 496 (100.0%) |
Household Vehicle Usage in Town and Country
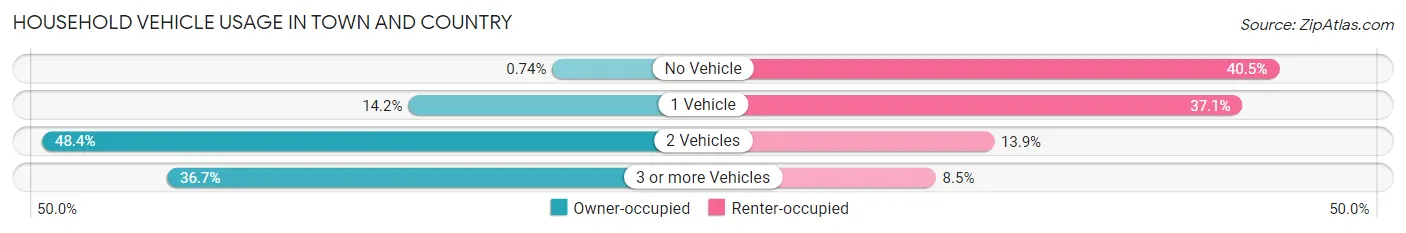
| Vehicles per Household | Owner-occupied | Renter-occupied |
| No Vehicle | 27 (0.7%) | 201 (40.5%) |
| 1 Vehicle | 518 (14.2%) | 184 (37.1%) |
| 2 Vehicles | 1,766 (48.4%) | 69 (13.9%) |
| 3 or more Vehicles | 1,340 (36.7%) | 42 (8.5%) |
| Total | 3,651 (100.0%) | 496 (100.0%) |
Real Estate & Mortgages in Town and Country
Real Estate and Mortgage Overview in Town and Country
| Characteristic | Without Mortgage | With Mortgage |
| Housing Units | 1,427 | 2,224 |
| Median Property Value | $753,700 | $941,300 |
| Median Household Income | $155,268 | $1,646 |
| Monthly Housing Costs | $1,343 | $1,863 |
| Real Estate Taxes | $8,878 | $0 |
Property Value by Mortgage Status in Town and Country
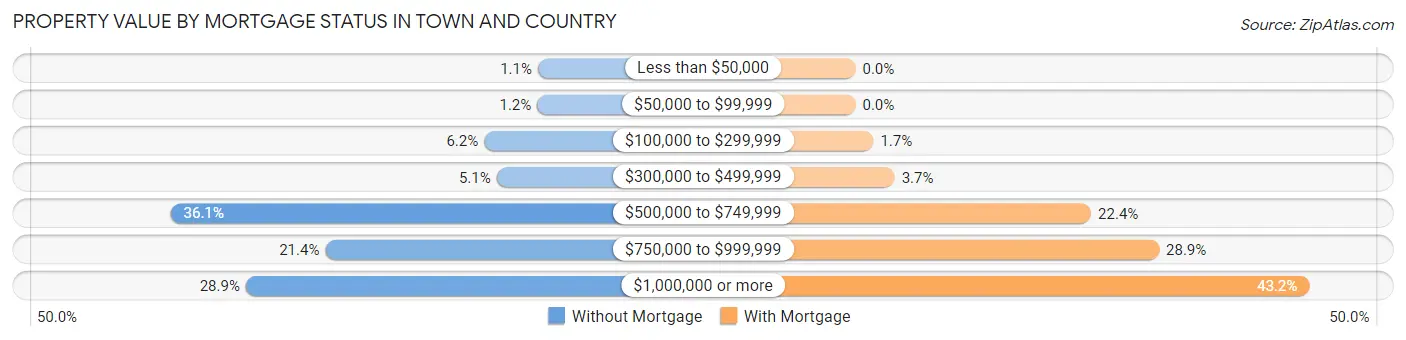
| Property Value | Without Mortgage | With Mortgage |
| Less than $50,000 | 16 (1.1%) | 0 (0.0%) |
| $50,000 to $99,999 | 17 (1.2%) | 0 (0.0%) |
| $100,000 to $299,999 | 89 (6.2%) | 38 (1.7%) |
| $300,000 to $499,999 | 72 (5.1%) | 83 (3.7%) |
| $500,000 to $749,999 | 515 (36.1%) | 499 (22.4%) |
| $750,000 to $999,999 | 305 (21.4%) | 643 (28.9%) |
| $1,000,000 or more | 413 (28.9%) | 961 (43.2%) |
| Total | 1,427 (100.0%) | 2,224 (100.0%) |
Household Income by Mortgage Status in Town and Country
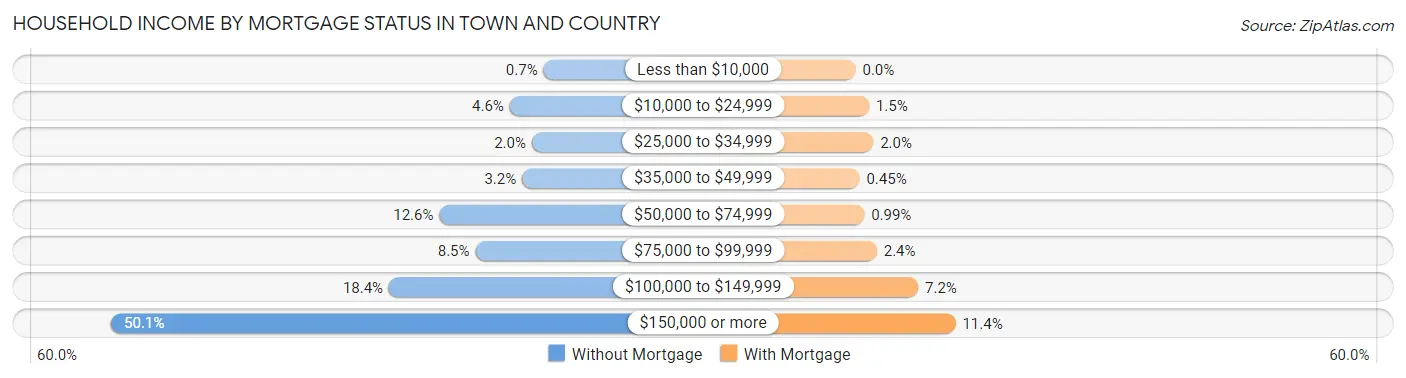
| Household Income | Without Mortgage | With Mortgage |
| Less than $10,000 | 10 (0.7%) | 0 (0.0%) |
| $10,000 to $24,999 | 65 (4.6%) | 34 (1.5%) |
| $25,000 to $34,999 | 29 (2.0%) | 45 (2.0%) |
| $35,000 to $49,999 | 45 (3.2%) | 10 (0.4%) |
| $50,000 to $74,999 | 180 (12.6%) | 22 (1.0%) |
| $75,000 to $99,999 | 121 (8.5%) | 54 (2.4%) |
| $100,000 to $149,999 | 262 (18.4%) | 159 (7.1%) |
| $150,000 or more | 715 (50.1%) | 254 (11.4%) |
| Total | 1,427 (100.0%) | 2,224 (100.0%) |
Property Value to Household Income Ratio in Town and Country
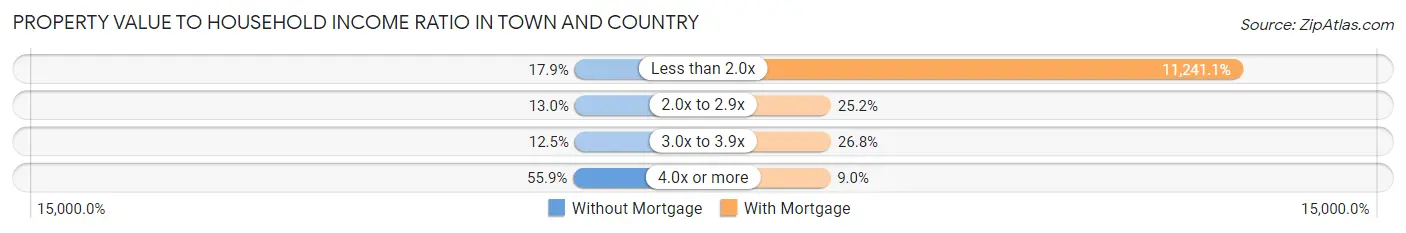
| Value-to-Income Ratio | Without Mortgage | With Mortgage |
| Less than 2.0x | 255 (17.9%) | 250,001 (11,241.0%) |
| 2.0x to 2.9x | 185 (13.0%) | 560 (25.2%) |
| 3.0x to 3.9x | 179 (12.5%) | 595 (26.8%) |
| 4.0x or more | 798 (55.9%) | 200 (9.0%) |
| Total | 1,427 (100.0%) | 2,224 (100.0%) |
Real Estate Taxes by Mortgage Status in Town and Country
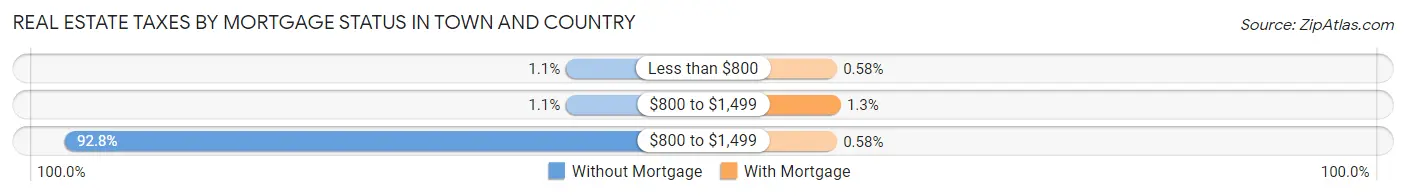
| Property Taxes | Without Mortgage | With Mortgage |
| Less than $800 | 16 (1.1%) | 13 (0.6%) |
| $800 to $1,499 | 16 (1.1%) | 28 (1.3%) |
| $800 to $1,499 | 1,324 (92.8%) | 13 (0.6%) |
| Total | 1,427 (100.0%) | 2,224 (100.0%) |
Health & Disability in Town and Country
Health Insurance Coverage by Age in Town and Country
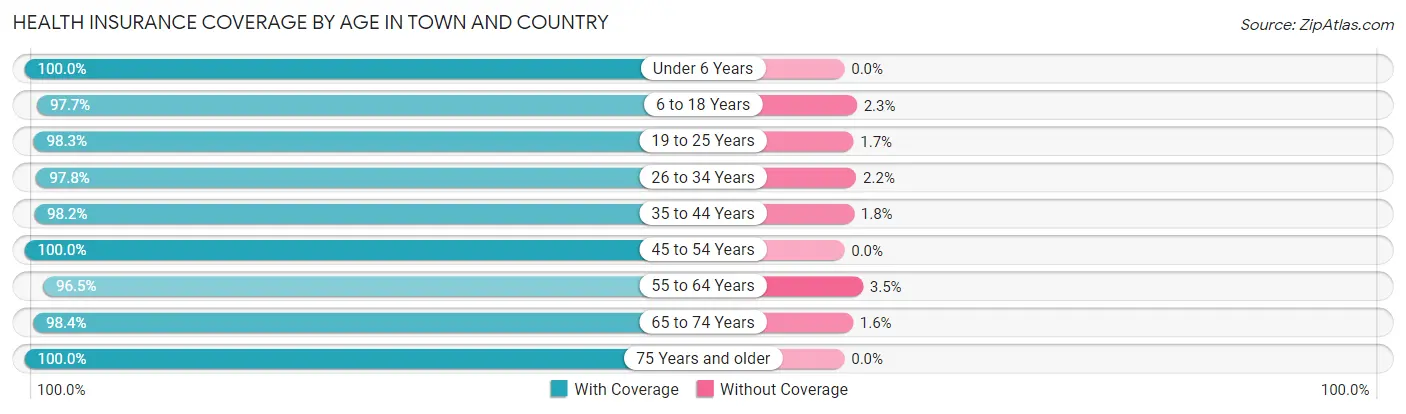
| Age Bracket | With Coverage | Without Coverage |
| Under 6 Years | 372 (100.0%) | 0 (0.0%) |
| 6 to 18 Years | 2,073 (97.7%) | 49 (2.3%) |
| 19 to 25 Years | 641 (98.3%) | 11 (1.7%) |
| 26 to 34 Years | 442 (97.8%) | 10 (2.2%) |
| 35 to 44 Years | 1,215 (98.2%) | 22 (1.8%) |
| 45 to 54 Years | 1,778 (100.0%) | 0 (0.0%) |
| 55 to 64 Years | 1,255 (96.5%) | 45 (3.5%) |
| 65 to 74 Years | 1,552 (98.4%) | 25 (1.6%) |
| 75 Years and older | 1,394 (100.0%) | 0 (0.0%) |
| Total | 10,722 (98.5%) | 162 (1.5%) |
Health Insurance Coverage by Citizenship Status in Town and Country
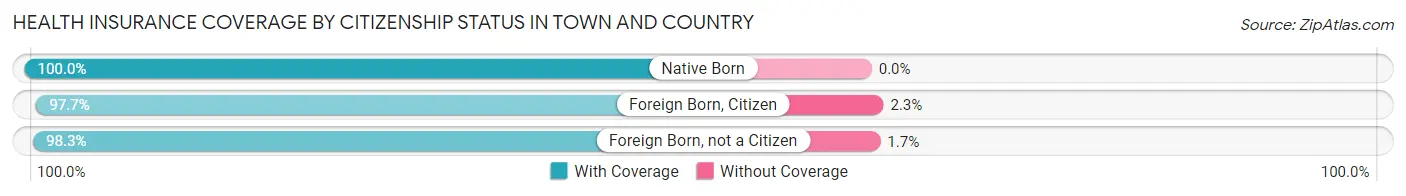
| Citizenship Status | With Coverage | Without Coverage |
| Native Born | 372 (100.0%) | 0 (0.0%) |
| Foreign Born, Citizen | 2,073 (97.7%) | 49 (2.3%) |
| Foreign Born, not a Citizen | 641 (98.3%) | 11 (1.7%) |
Health Insurance Coverage by Household Income in Town and Country
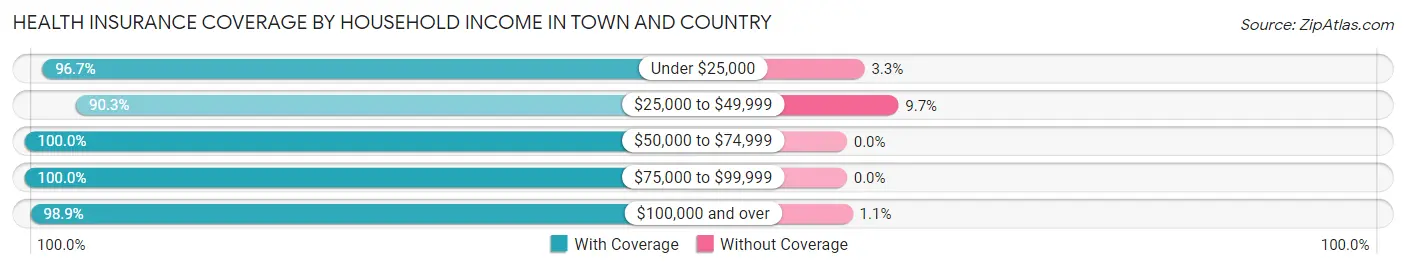
| Household Income | With Coverage | Without Coverage |
| Under $25,000 | 321 (96.7%) | 11 (3.3%) |
| $25,000 to $49,999 | 318 (90.3%) | 34 (9.7%) |
| $50,000 to $74,999 | 650 (100.0%) | 0 (0.0%) |
| $75,000 to $99,999 | 615 (100.0%) | 0 (0.0%) |
| $100,000 and over | 8,488 (98.9%) | 94 (1.1%) |
Public vs Private Health Insurance Coverage by Age in Town and Country
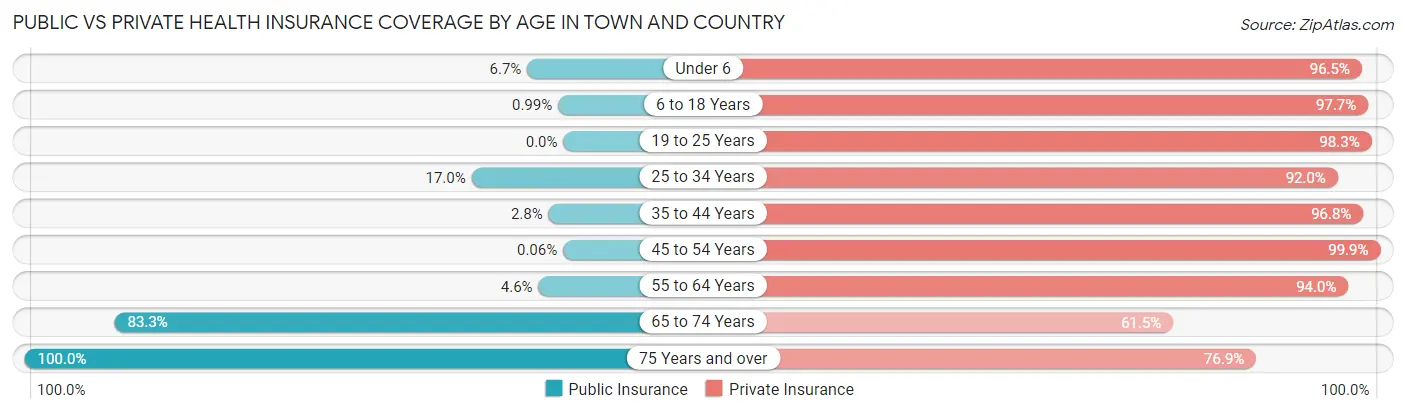
| Age Bracket | Public Insurance | Private Insurance |
| Under 6 | 25 (6.7%) | 359 (96.5%) |
| 6 to 18 Years | 21 (1.0%) | 2,073 (97.7%) |
| 19 to 25 Years | 0 (0.0%) | 641 (98.3%) |
| 25 to 34 Years | 77 (17.0%) | 416 (92.0%) |
| 35 to 44 Years | 34 (2.8%) | 1,197 (96.8%) |
| 45 to 54 Years | 1 (0.1%) | 1,777 (99.9%) |
| 55 to 64 Years | 60 (4.6%) | 1,222 (94.0%) |
| 65 to 74 Years | 1,314 (83.3%) | 970 (61.5%) |
| 75 Years and over | 1,394 (100.0%) | 1,072 (76.9%) |
| Total | 2,926 (26.9%) | 9,727 (89.4%) |
Disability Status by Sex by Age in Town and Country
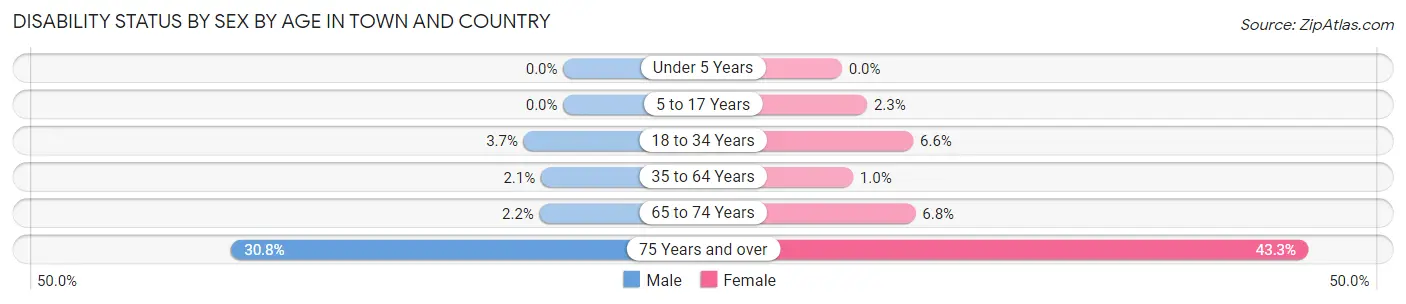
| Age Bracket | Male | Female |
| Under 5 Years | 0 (0.0%) | 0 (0.0%) |
| 5 to 17 Years | 0 (0.0%) | 21 (2.3%) |
| 18 to 34 Years | 25 (3.7%) | 44 (6.6%) |
| 35 to 64 Years | 47 (2.1%) | 21 (1.0%) |
| 65 to 74 Years | 17 (2.2%) | 55 (6.8%) |
| 75 Years and over | 208 (30.8%) | 311 (43.2%) |
Disability Class by Sex by Age in Town and Country
Disability Class: Hearing Difficulty
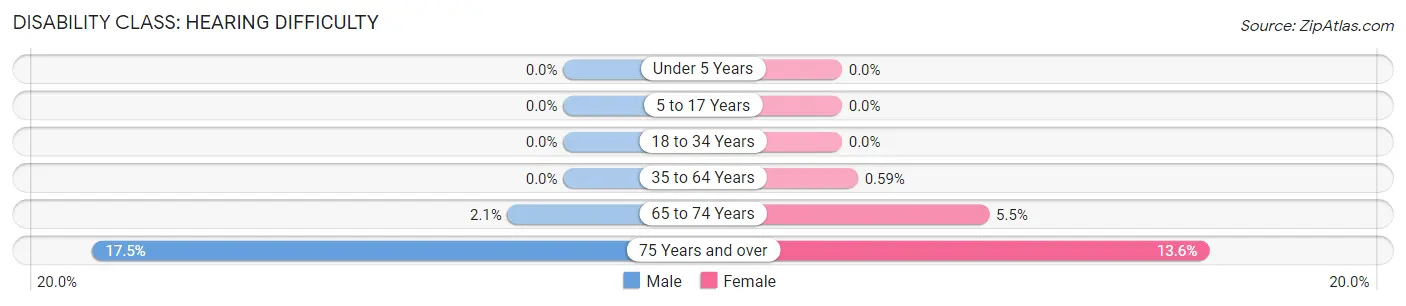
| Age Bracket | Male | Female |
| Under 5 Years | 0 (0.0%) | 0 (0.0%) |
| 5 to 17 Years | 0 (0.0%) | 0 (0.0%) |
| 18 to 34 Years | 0 (0.0%) | 0 (0.0%) |
| 35 to 64 Years | 0 (0.0%) | 12 (0.6%) |
| 65 to 74 Years | 16 (2.1%) | 44 (5.5%) |
| 75 Years and over | 118 (17.5%) | 98 (13.6%) |
Disability Class: Vision Difficulty
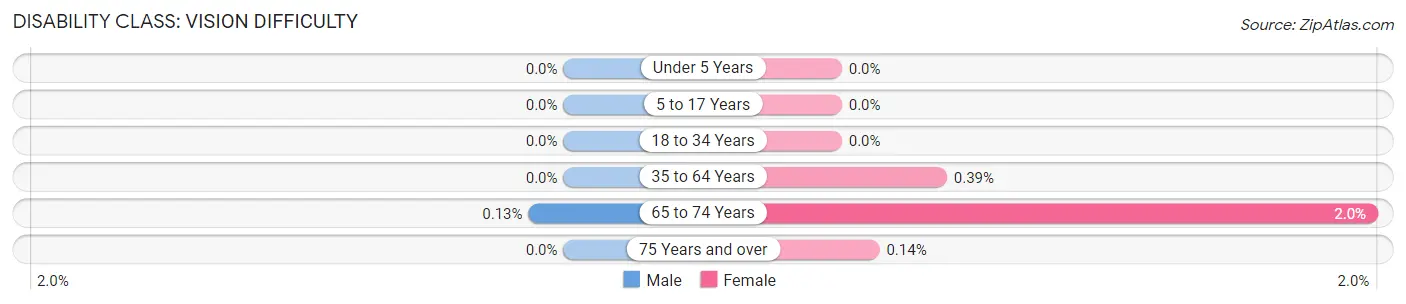
| Age Bracket | Male | Female |
| Under 5 Years | 0 (0.0%) | 0 (0.0%) |
| 5 to 17 Years | 0 (0.0%) | 0 (0.0%) |
| 18 to 34 Years | 0 (0.0%) | 0 (0.0%) |
| 35 to 64 Years | 0 (0.0%) | 8 (0.4%) |
| 65 to 74 Years | 1 (0.1%) | 16 (2.0%) |
| 75 Years and over | 0 (0.0%) | 1 (0.1%) |
Disability Class: Cognitive Difficulty
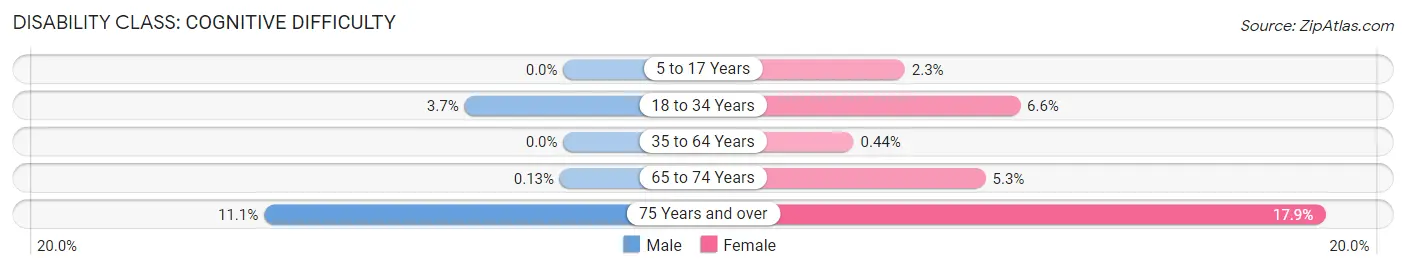
| Age Bracket | Male | Female |
| 5 to 17 Years | 0 (0.0%) | 21 (2.3%) |
| 18 to 34 Years | 25 (3.7%) | 44 (6.6%) |
| 35 to 64 Years | 0 (0.0%) | 9 (0.4%) |
| 65 to 74 Years | 1 (0.1%) | 43 (5.3%) |
| 75 Years and over | 75 (11.1%) | 129 (17.9%) |
Disability Class: Ambulatory Difficulty
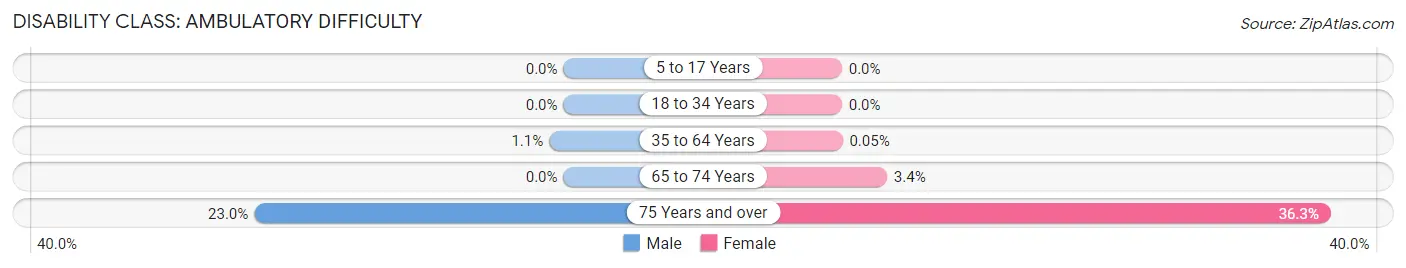
| Age Bracket | Male | Female |
| 5 to 17 Years | 0 (0.0%) | 0 (0.0%) |
| 18 to 34 Years | 0 (0.0%) | 0 (0.0%) |
| 35 to 64 Years | 24 (1.1%) | 1 (0.1%) |
| 65 to 74 Years | 0 (0.0%) | 27 (3.4%) |
| 75 Years and over | 155 (23.0%) | 261 (36.3%) |
Disability Class: Self-Care Difficulty
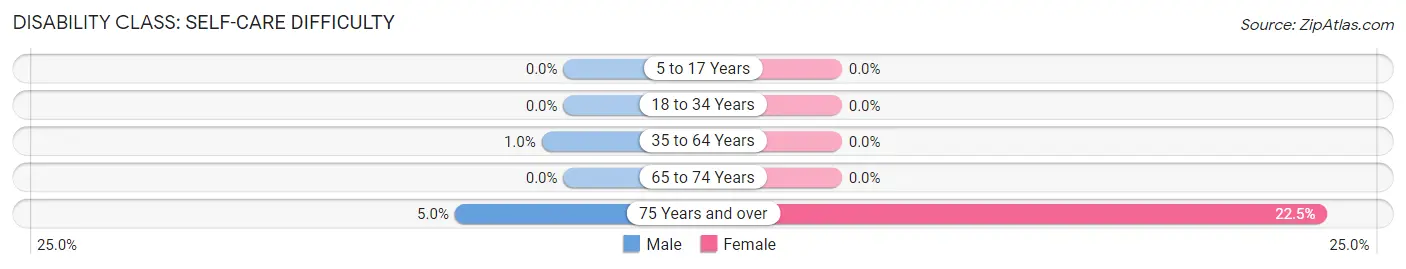
| Age Bracket | Male | Female |
| 5 to 17 Years | 0 (0.0%) | 0 (0.0%) |
| 18 to 34 Years | 0 (0.0%) | 0 (0.0%) |
| 35 to 64 Years | 23 (1.0%) | 0 (0.0%) |
| 65 to 74 Years | 0 (0.0%) | 0 (0.0%) |
| 75 Years and over | 34 (5.0%) | 162 (22.5%) |
Technology Access in Town and Country
Computing Device Access in Town and Country
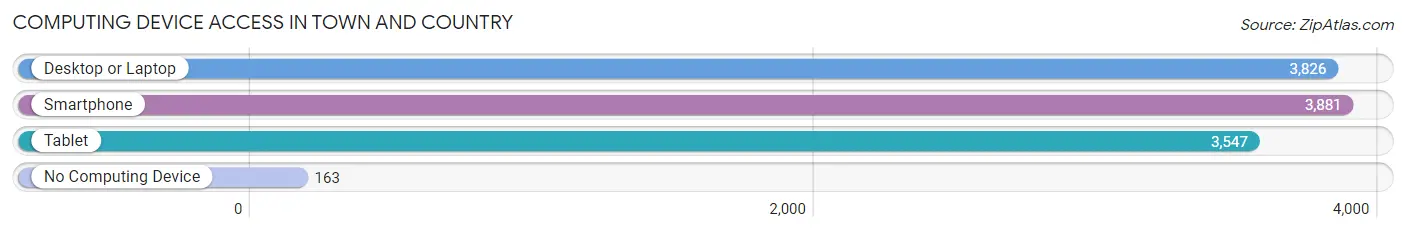
| Device Type | # Households | % Households |
| Desktop or Laptop | 3,826 | 92.3% |
| Smartphone | 3,881 | 93.6% |
| Tablet | 3,547 | 85.5% |
| No Computing Device | 163 | 3.9% |
| Total | 4,147 | 100.0% |
Internet Access in Town and Country
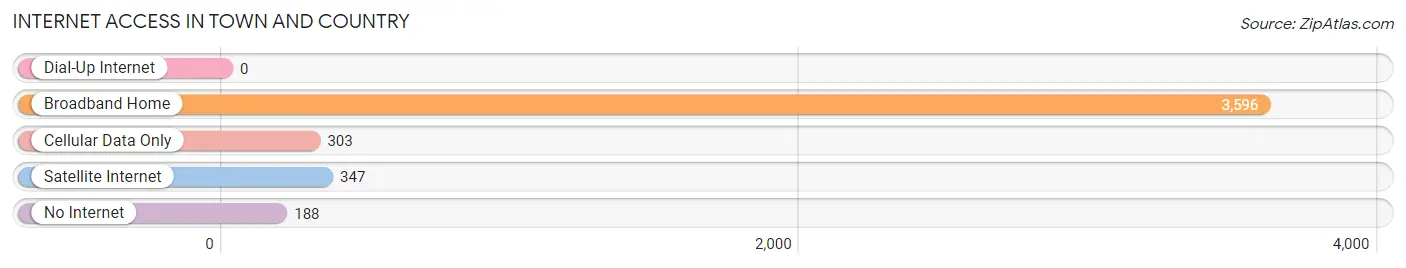
| Internet Type | # Households | % Households |
| Dial-Up Internet | 0 | 0.0% |
| Broadband Home | 3,596 | 86.7% |
| Cellular Data Only | 303 | 7.3% |
| Satellite Internet | 347 | 8.4% |
| No Internet | 188 | 4.5% |
| Total | 4,147 | 100.0% |
Town and Country Summary
Town and Country, Missouri is a small city located in St. Louis County, Missouri. It is a suburb of St. Louis and is located about 15 miles west of the city. The city was incorporated in 1950 and has a population of around 10,000 people.
Geography
Town and Country is located in the western part of St. Louis County, Missouri. It is bordered by the cities of Chesterfield, Ballwin, and Wildwood. The city is situated on the Missouri River and is surrounded by rolling hills and wooded areas. The city has a total area of 8.2 square miles, of which 8.1 square miles is land and 0.1 square miles is water.
Climate
Town and Country has a humid continental climate, with hot, humid summers and cold, snowy winters. The average annual temperature is around 54°F, with an average high of around 79°F in the summer and an average low of around 30°F in the winter. The average annual precipitation is around 40 inches.
Demographics
As of the 2010 census, the population of Town and Country was 10,275. The racial makeup of the city was 91.3% White, 4.2% African American, 0.3% Native American, 2.2% Asian, 0.1% Pacific Islander, 0.7% from other races, and 1.4% from two or more races. Hispanic or Latino of any race were 2.3% of the population.
Economy
Town and Country is home to a variety of businesses, including retail stores, restaurants, and professional services. The city is also home to several corporate headquarters, including Monsanto, Express Scripts, and Edward Jones. The city is also home to several large employers, including St. Louis University Hospital, St. Louis Children's Hospital, and Barnes-Jewish Hospital.
History
Town and Country was first settled in the early 1800s by German immigrants. The city was originally known as "Germantown" and was later renamed "Town and Country" in 1950 when it was incorporated. The city was originally a farming community, but in the 1950s and 1960s, the city began to experience rapid growth as more people moved to the area. The city has since become a popular suburb of St. Louis, with a variety of businesses and amenities.
Common Questions
What is Per Capita Income in Town and Country?
Per Capita income in Town and Country is $116,907.
What is the Median Family Income in Town and Country?
Median Family Income in Town and Country is $250,001.
What is the Median Household income in Town and Country?
Median Household Income in Town and Country is $231,382.
What is Income or Wage Gap in Town and Country?
Income or Wage Gap in Town and Country is 74.1%.
Women in Town and Country earn 25.9 cents for every dollar earned by a man.
What is Inequality or Gini Index in Town and Country?
Inequality or Gini Index in Town and Country is 0.48.
What is the Total Population of Town and Country?
Total Population of Town and Country is 11,575.
What is the Total Male Population of Town and Country?
Total Male Population of Town and Country is 5,891.
What is the Total Female Population of Town and Country?
Total Female Population of Town and Country is 5,684.
What is the Ratio of Males per 100 Females in Town and Country?
There are 103.64 Males per 100 Females in Town and Country.
What is the Ratio of Females per 100 Males in Town and Country?
There are 96.49 Females per 100 Males in Town and Country.
What is the Median Population Age in Town and Country?
Median Population Age in Town and Country is 50.6 Years.
What is the Average Family Size in Town and Country
Average Family Size in Town and Country is 2.9 People.
What is the Average Household Size in Town and Country
Average Household Size in Town and Country is 2.5 People.
How Large is the Labor Force in Town and Country?
There are 5,135 People in the Labor Forcein in Town and Country.
What is the Percentage of People in the Labor Force in Town and Country?
53.2% of People are in the Labor Force in Town and Country.
What is the Unemployment Rate in Town and Country?
Unemployment Rate in Town and Country is 3.3%.