Lake St Louis, MO Map & Demographics
Lake St Louis Map
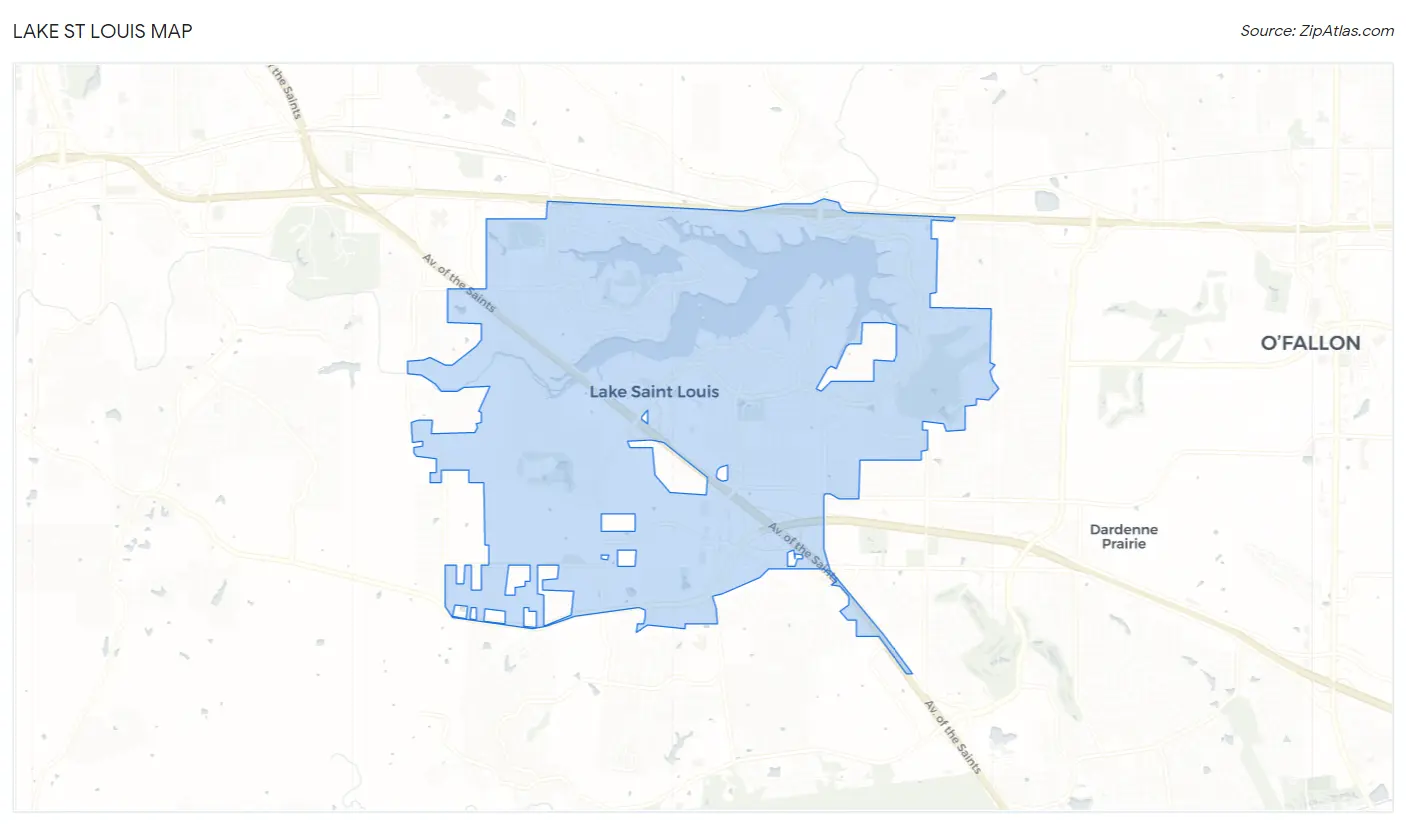
Lake St Louis Overview
$57,945
PER CAPITA INCOME
$139,310
AVG FAMILY INCOME
$114,230
AVG HOUSEHOLD INCOME
31.5%
WAGE / INCOME GAP [ % ]
68.5¢/ $1
WAGE / INCOME GAP [ $ ]
0.41
INEQUALITY / GINI INDEX
17,088
TOTAL POPULATION
8,591
MALE POPULATION
8,497
FEMALE POPULATION
101.11
MALES / 100 FEMALES
98.91
FEMALES / 100 MALES
43.5
MEDIAN AGE
2.8
AVG FAMILY SIZE
2.5
AVG HOUSEHOLD SIZE
9,481
LABOR FORCE [ PEOPLE ]
66.0%
PERCENT IN LABOR FORCE
3.8%
UNEMPLOYMENT RATE
Lake St Louis Area Codes
Income in Lake St Louis
Income Overview in Lake St Louis
Per Capita Income in Lake St Louis is $57,945, while median incomes of families and households are $139,310 and $114,230 respectively.
| Characteristic | Number | Measure |
| Per Capita Income | 17,088 | $57,945 |
| Median Family Income | 5,117 | $139,310 |
| Mean Family Income | 5,117 | $165,177 |
| Median Household Income | 6,897 | $114,230 |
| Mean Household Income | 6,897 | $143,295 |
| Income Deficit | 5,117 | $0 |
| Wage / Income Gap (%) | 17,088 | 31.49% |
| Wage / Income Gap ($) | 17,088 | 68.51¢ per $1 |
| Gini / Inequality Index | 17,088 | 0.41 |
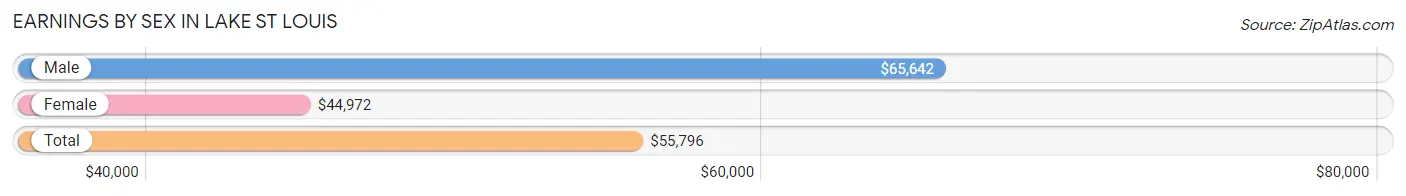
Earnings by Sex in Lake St Louis
Average Earnings in Lake St Louis are $55,796, $65,642 for men and $44,972 for women, a difference of 31.5%.
| Sex | Number | Average Earnings |
| Male | 5,380 (54.4%) | $65,642 |
| Female | 4,509 (45.6%) | $44,972 |
| Total | 9,889 (100.0%) | $55,796 |
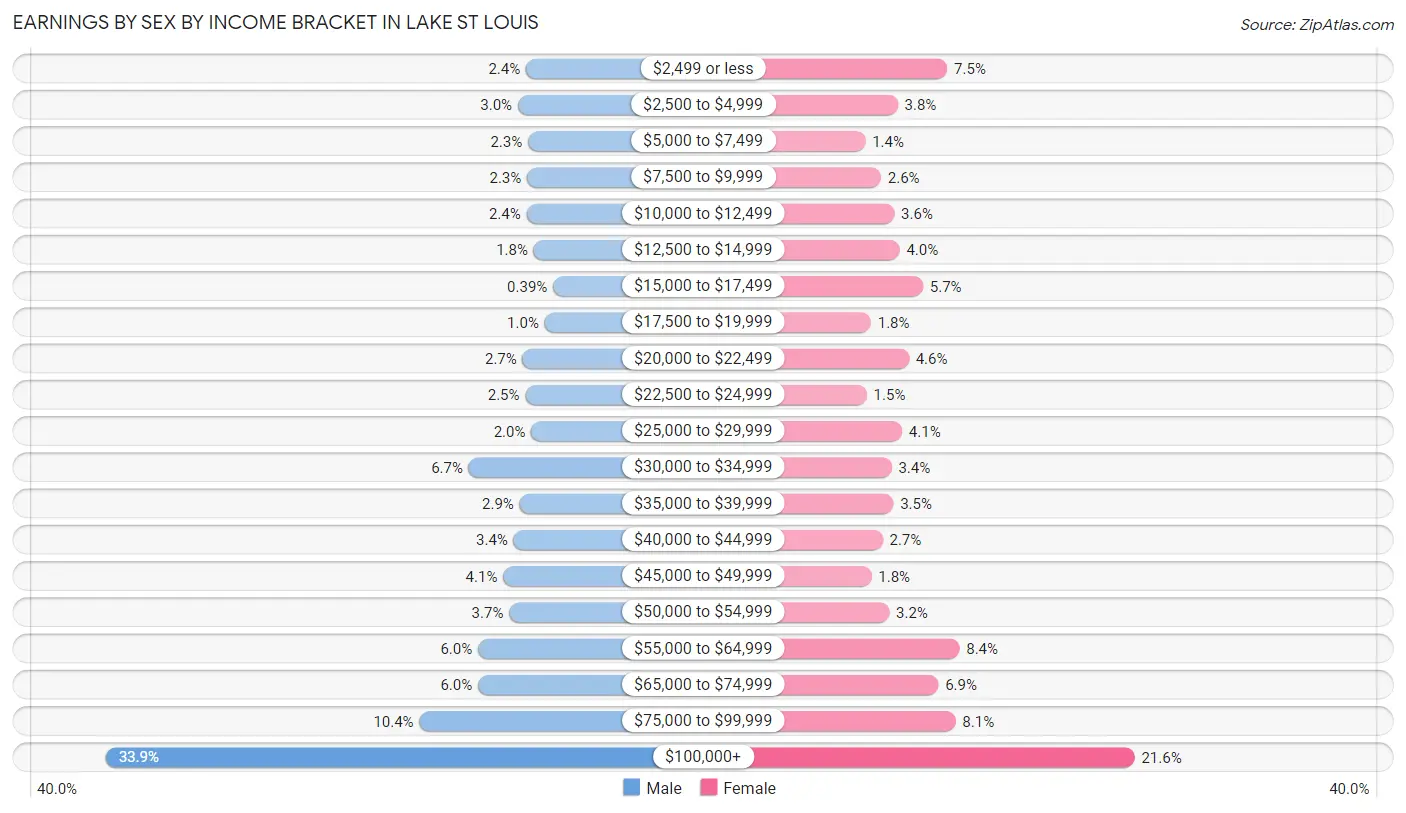
Earnings by Sex by Income Bracket in Lake St Louis
The most common earnings brackets in Lake St Louis are $100,000+ for men (1,825 | 33.9%) and $100,000+ for women (972 | 21.6%).
| Income | Male | Female |
| $2,499 or less | 130 (2.4%) | 339 (7.5%) |
| $2,500 to $4,999 | 163 (3.0%) | 172 (3.8%) |
| $5,000 to $7,499 | 122 (2.3%) | 62 (1.4%) |
| $7,500 to $9,999 | 126 (2.3%) | 115 (2.5%) |
| $10,000 to $12,499 | 128 (2.4%) | 160 (3.5%) |
| $12,500 to $14,999 | 99 (1.8%) | 178 (4.0%) |
| $15,000 to $17,499 | 21 (0.4%) | 257 (5.7%) |
| $17,500 to $19,999 | 55 (1.0%) | 81 (1.8%) |
| $20,000 to $22,499 | 144 (2.7%) | 209 (4.6%) |
| $22,500 to $24,999 | 133 (2.5%) | 67 (1.5%) |
| $25,000 to $29,999 | 109 (2.0%) | 186 (4.1%) |
| $30,000 to $34,999 | 361 (6.7%) | 151 (3.4%) |
| $35,000 to $39,999 | 156 (2.9%) | 157 (3.5%) |
| $40,000 to $44,999 | 180 (3.4%) | 121 (2.7%) |
| $45,000 to $49,999 | 222 (4.1%) | 83 (1.8%) |
| $50,000 to $54,999 | 198 (3.7%) | 143 (3.2%) |
| $55,000 to $64,999 | 324 (6.0%) | 380 (8.4%) |
| $65,000 to $74,999 | 324 (6.0%) | 309 (6.9%) |
| $75,000 to $99,999 | 560 (10.4%) | 367 (8.1%) |
| $100,000+ | 1,825 (33.9%) | 972 (21.6%) |
| Total | 5,380 (100.0%) | 4,509 (100.0%) |
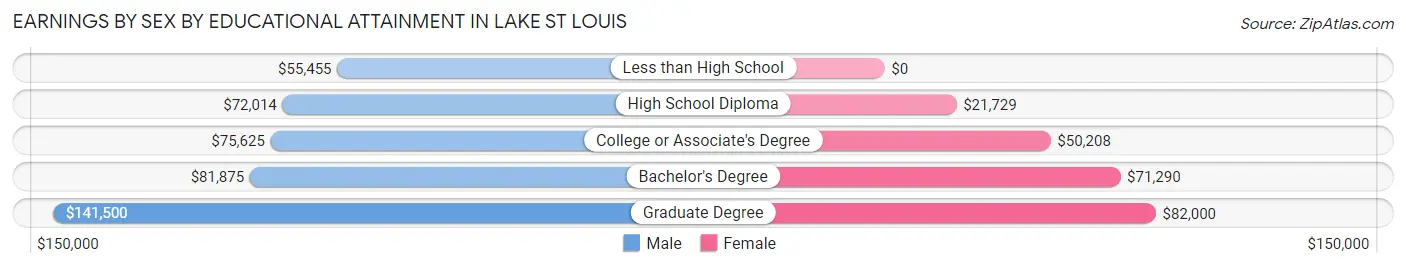
Earnings by Sex by Educational Attainment in Lake St Louis
Average earnings in Lake St Louis are $83,980 for men and $58,333 for women, a difference of 30.5%. Men with an educational attainment of graduate degree enjoy the highest average annual earnings of $141,500, while those with less than high school education earn the least with $55,455. Women with an educational attainment of graduate degree earn the most with the average annual earnings of $82,000, while those with high school diploma education have the smallest earnings of $21,729.
| Educational Attainment | Male Income | Female Income |
| Less than High School | $55,455 | $0 |
| High School Diploma | $72,014 | $21,729 |
| College or Associate's Degree | $75,625 | $50,208 |
| Bachelor's Degree | $81,875 | $71,290 |
| Graduate Degree | $141,500 | $82,000 |
| Total | $83,980 | $58,333 |
Family Income in Lake St Louis
Family Income Brackets in Lake St Louis
According to the Lake St Louis family income data, there are 1,423 families falling into the $200,000+ income range, which is the most common income bracket and makes up 27.8% of all families. Conversely, the $25,000 to $34,999 income bracket is the least frequent group with only 26 families (0.5%) belonging to this category.
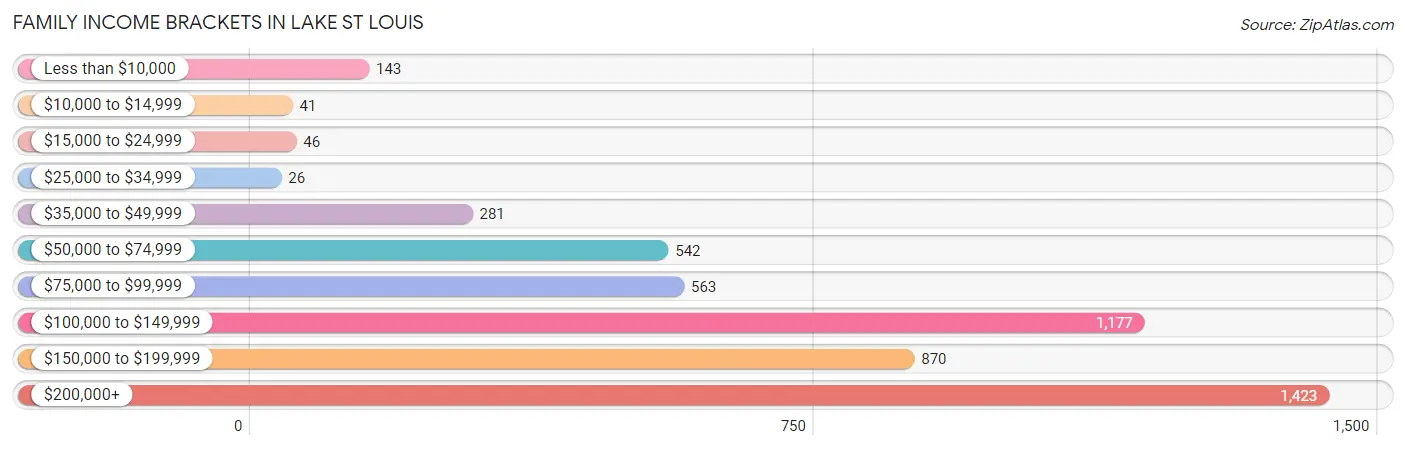
| Income Bracket | # Families | % Families |
| Less than $10,000 | 143 | 2.8% |
| $10,000 to $14,999 | 41 | 0.8% |
| $15,000 to $24,999 | 46 | 0.9% |
| $25,000 to $34,999 | 26 | 0.5% |
| $35,000 to $49,999 | 281 | 5.5% |
| $50,000 to $74,999 | 542 | 10.6% |
| $75,000 to $99,999 | 563 | 11.0% |
| $100,000 to $149,999 | 1,177 | 23.0% |
| $150,000 to $199,999 | 870 | 17.0% |
| $200,000+ | 1,423 | 27.8% |
Family Income by Famaliy Size in Lake St Louis
6-person families (66 | 1.3%) account for the highest median family income in Lake St Louis with $250,001 per family, while 2-person families (2,574 | 50.3%) have the highest median income of $50,489 per family member.
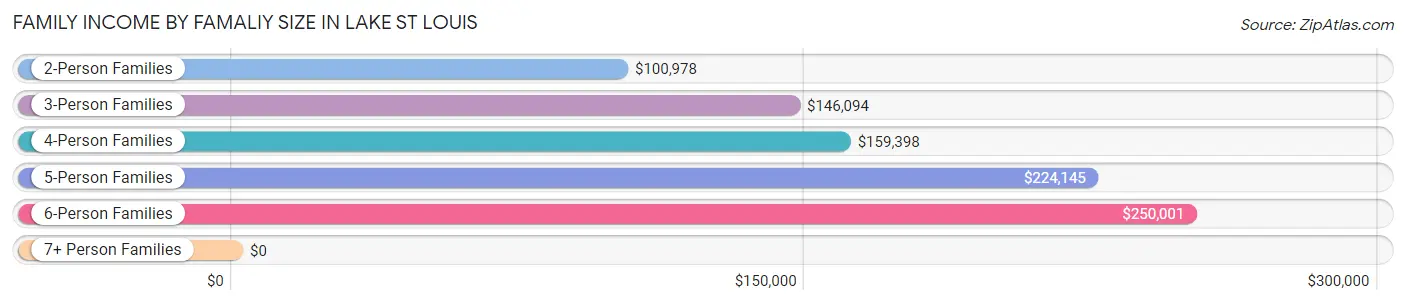
| Income Bracket | # Families | Median Income |
| 2-Person Families | 2,574 (50.3%) | $100,978 |
| 3-Person Families | 1,014 (19.8%) | $146,094 |
| 4-Person Families | 1,124 (22.0%) | $159,398 |
| 5-Person Families | 323 (6.3%) | $224,145 |
| 6-Person Families | 66 (1.3%) | $250,001 |
| 7+ Person Families | 16 (0.3%) | $0 |
| Total | 5,117 (100.0%) | $139,310 |
Family Income by Number of Earners in Lake St Louis
The median family income in Lake St Louis is $139,310, with families comprising 3+ earners (639) having the highest median family income of $203,309, while families with no earners (1,014) have the lowest median family income of $76,506, accounting for 12.5% and 19.8% of families, respectively.
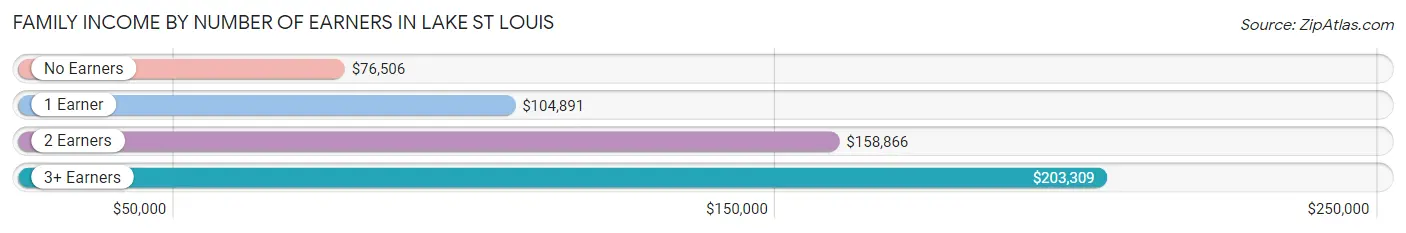
| Number of Earners | # Families | Median Income |
| No Earners | 1,014 (19.8%) | $76,506 |
| 1 Earner | 994 (19.4%) | $104,891 |
| 2 Earners | 2,470 (48.3%) | $158,866 |
| 3+ Earners | 639 (12.5%) | $203,309 |
| Total | 5,117 (100.0%) | $139,310 |
Household Income in Lake St Louis
Household Income Brackets in Lake St Louis
With 1,538 households falling in the category, the $200,000+ income range is the most frequent in Lake St Louis, accounting for 22.3% of all households. In contrast, only 41 households (0.6%) fall into the $10,000 to $14,999 income bracket, making it the least populous group.
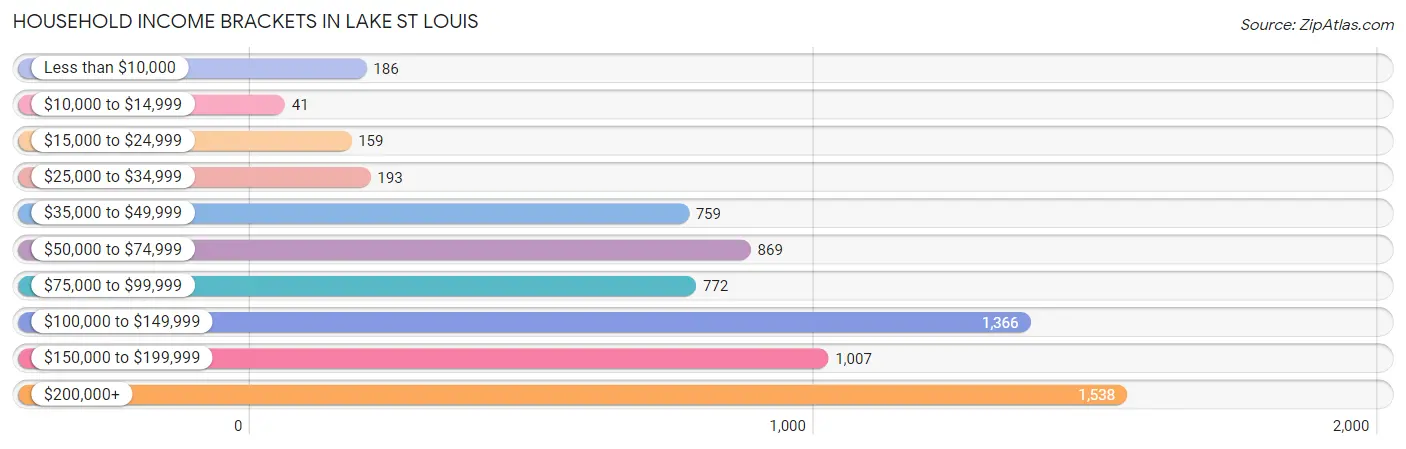
| Income Bracket | # Households | % Households |
| Less than $10,000 | 186 | 2.7% |
| $10,000 to $14,999 | 41 | 0.6% |
| $15,000 to $24,999 | 159 | 2.3% |
| $25,000 to $34,999 | 193 | 2.8% |
| $35,000 to $49,999 | 759 | 11.0% |
| $50,000 to $74,999 | 869 | 12.6% |
| $75,000 to $99,999 | 772 | 11.2% |
| $100,000 to $149,999 | 1,366 | 19.8% |
| $150,000 to $199,999 | 1,007 | 14.6% |
| $200,000+ | 1,538 | 22.3% |
Household Income by Householder Age in Lake St Louis
The median household income in Lake St Louis is $114,230, with the highest median household income of $150,948 found in the 25 to 44 years age bracket for the primary householder. A total of 1,770 households (25.7%) fall into this category. Meanwhile, the 15 to 24 years age bracket for the primary householder has the lowest median household income of $54,104, with 347 households (5.0%) in this group.
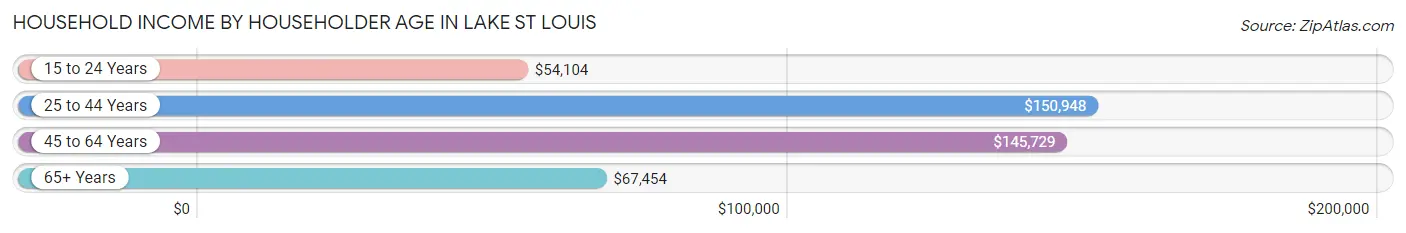
| Income Bracket | # Households | Median Income |
| 15 to 24 Years | 347 (5.0%) | $54,104 |
| 25 to 44 Years | 1,770 (25.7%) | $150,948 |
| 45 to 64 Years | 2,551 (37.0%) | $145,729 |
| 65+ Years | 2,229 (32.3%) | $67,454 |
| Total | 6,897 (100.0%) | $114,230 |
Poverty in Lake St Louis
Income Below Poverty by Sex and Age in Lake St Louis
With 3.5% poverty level for males and 3.5% for females among the residents of Lake St Louis, 75 year old and over males and 15 year old females are the most vulnerable to poverty, with 150 males (16.3%) and 10 females (11.5%) in their respective age groups living below the poverty level.
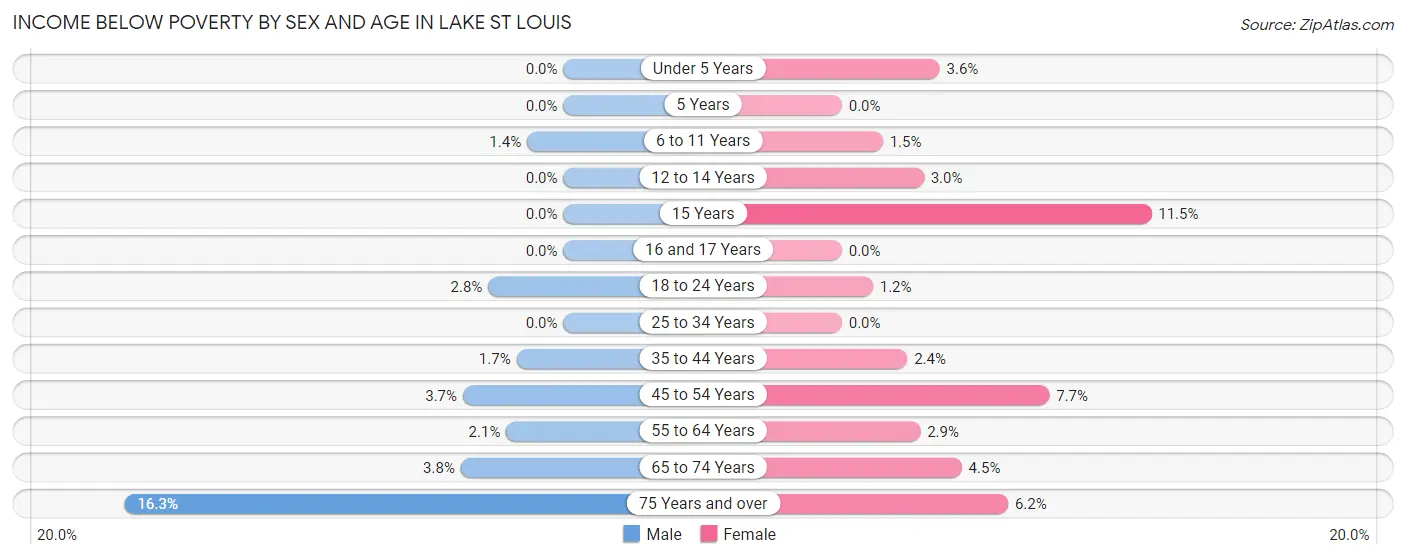
| Age Bracket | Male | Female |
| Under 5 Years | 0 (0.0%) | 9 (3.6%) |
| 5 Years | 0 (0.0%) | 0 (0.0%) |
| 6 to 11 Years | 7 (1.3%) | 9 (1.5%) |
| 12 to 14 Years | 0 (0.0%) | 10 (3.0%) |
| 15 Years | 0 (0.0%) | 10 (11.5%) |
| 16 and 17 Years | 0 (0.0%) | 0 (0.0%) |
| 18 to 24 Years | 29 (2.8%) | 8 (1.1%) |
| 25 to 34 Years | 0 (0.0%) | 0 (0.0%) |
| 35 to 44 Years | 20 (1.7%) | 27 (2.4%) |
| 45 to 54 Years | 40 (3.7%) | 93 (7.7%) |
| 55 to 64 Years | 26 (2.1%) | 36 (2.9%) |
| 65 to 74 Years | 28 (3.8%) | 45 (4.4%) |
| 75 Years and over | 150 (16.3%) | 50 (6.2%) |
| Total | 300 (3.5%) | 297 (3.5%) |
Income Above Poverty by Sex and Age in Lake St Louis
According to the poverty statistics in Lake St Louis, males aged under 5 years and females aged 5 years are the age groups that are most secure financially, with 100.0% of males and 100.0% of females in these age groups living above the poverty line.
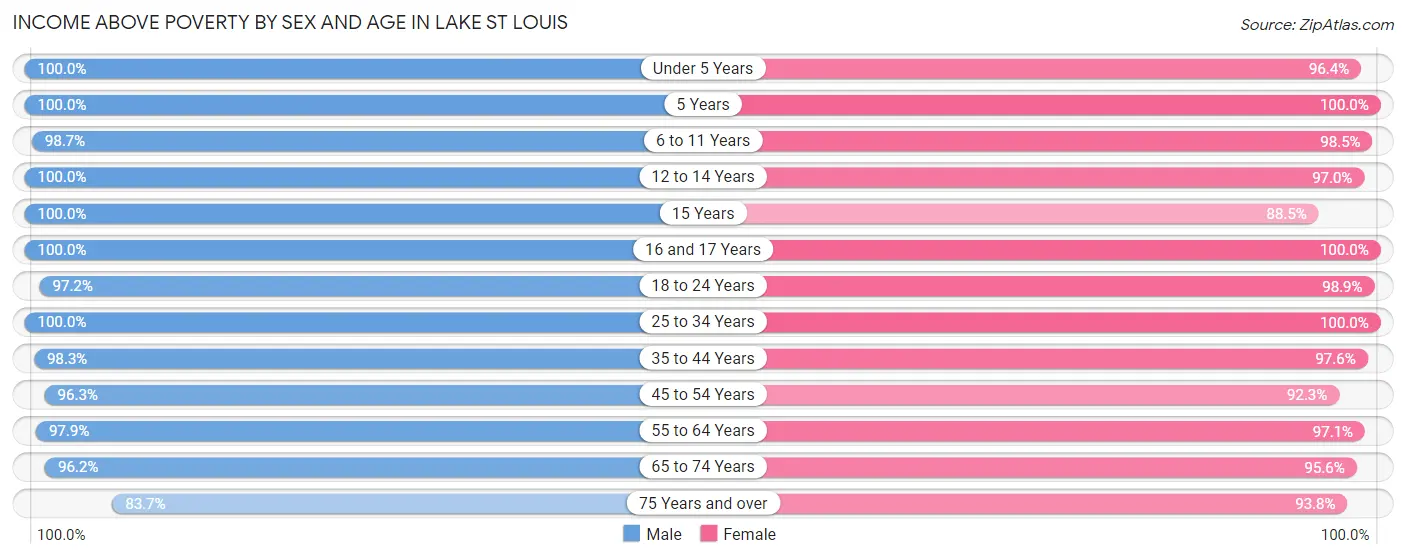
| Age Bracket | Male | Female |
| Under 5 Years | 274 (100.0%) | 239 (96.4%) |
| 5 Years | 139 (100.0%) | 147 (100.0%) |
| 6 to 11 Years | 510 (98.7%) | 585 (98.5%) |
| 12 to 14 Years | 322 (100.0%) | 319 (97.0%) |
| 15 Years | 66 (100.0%) | 77 (88.5%) |
| 16 and 17 Years | 382 (100.0%) | 278 (100.0%) |
| 18 to 24 Years | 1,010 (97.2%) | 690 (98.9%) |
| 25 to 34 Years | 749 (100.0%) | 733 (100.0%) |
| 35 to 44 Years | 1,131 (98.3%) | 1,086 (97.6%) |
| 45 to 54 Years | 1,032 (96.3%) | 1,115 (92.3%) |
| 55 to 64 Years | 1,199 (97.9%) | 1,203 (97.1%) |
| 65 to 74 Years | 706 (96.2%) | 967 (95.6%) |
| 75 Years and over | 771 (83.7%) | 761 (93.8%) |
| Total | 8,291 (96.5%) | 8,200 (96.5%) |
Income Below Poverty Among Married-Couple Families in Lake St Louis
The poverty statistics for married-couple families in Lake St Louis show that 4.0% or 184 of the total 4,560 families live below the poverty line. Families with no children have the highest poverty rate of 6.5%, comprising of 184 families. On the other hand, families with 1 or 2 children have the lowest poverty rate of 0.0%, which includes 0 families.
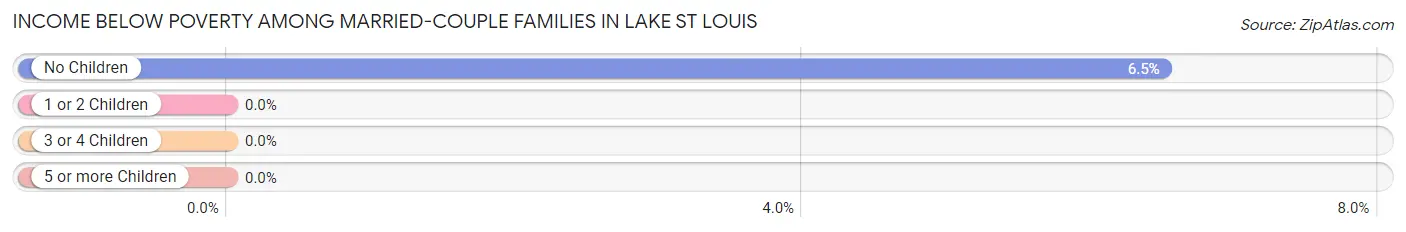
| Children | Above Poverty | Below Poverty |
| No Children | 2,648 (93.5%) | 184 (6.5%) |
| 1 or 2 Children | 1,516 (100.0%) | 0 (0.0%) |
| 3 or 4 Children | 196 (100.0%) | 0 (0.0%) |
| 5 or more Children | 16 (100.0%) | 0 (0.0%) |
| Total | 4,376 (96.0%) | 184 (4.0%) |
Income Below Poverty Among Single-Parent Households in Lake St Louis
According to the poverty data in Lake St Louis, 4.4% or 8 single-father households and 7.7% or 29 single-mother households are living below the poverty line. Among single-father households, those with 1 or 2 children have the highest poverty rate, with 8 households (6.1%) experiencing poverty. Likewise, among single-mother households, those with 3 or 4 children have the highest poverty rate, with 10 households (100.0%) falling below the poverty line.
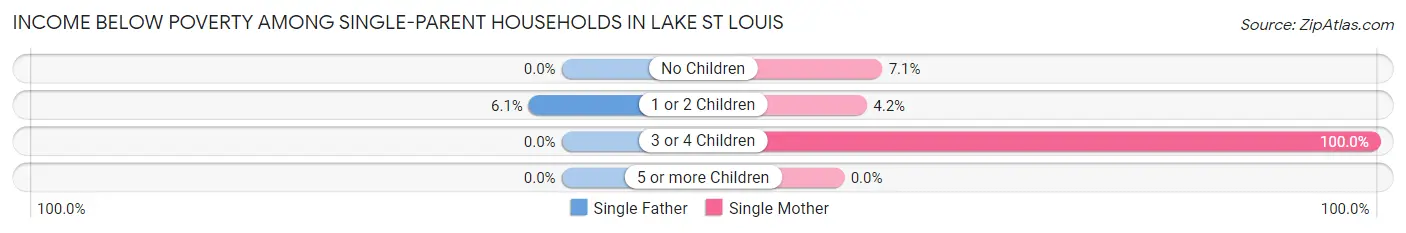
| Children | Single Father | Single Mother |
| No Children | 0 (0.0%) | 10 (7.1%) |
| 1 or 2 Children | 8 (6.1%) | 9 (4.2%) |
| 3 or 4 Children | 0 (0.0%) | 10 (100.0%) |
| 5 or more Children | 0 (0.0%) | 0 (0.0%) |
| Total | 8 (4.4%) | 29 (7.7%) |
Income Below Poverty Among Married-Couple vs Single-Parent Households in Lake St Louis
The poverty data for Lake St Louis shows that 184 of the married-couple family households (4.0%) and 37 of the single-parent households (6.6%) are living below the poverty level. Within the married-couple family households, those with no children have the highest poverty rate, with 184 households (6.5%) falling below the poverty line. Among the single-parent households, those with 3 or 4 children have the highest poverty rate, with 10 household (30.3%) living below poverty.
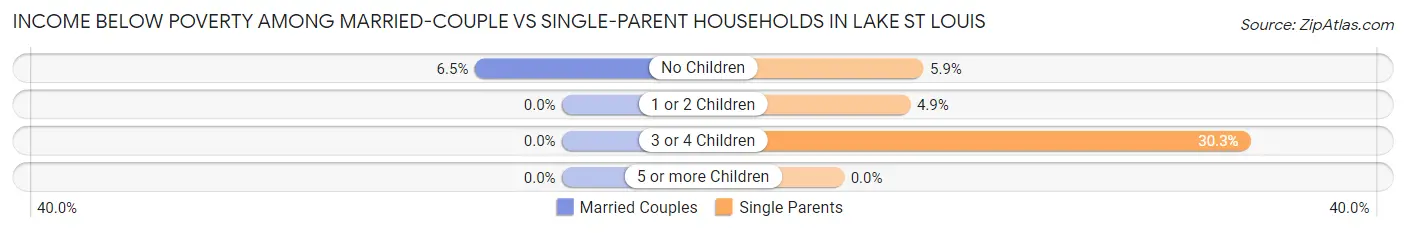
| Children | Married-Couple Families | Single-Parent Households |
| No Children | 184 (6.5%) | 10 (5.9%) |
| 1 or 2 Children | 0 (0.0%) | 17 (4.9%) |
| 3 or 4 Children | 0 (0.0%) | 10 (30.3%) |
| 5 or more Children | 0 (0.0%) | 0 (0.0%) |
| Total | 184 (4.0%) | 37 (6.6%) |
Race in Lake St Louis
The most populous races in Lake St Louis are White / Caucasian (14,970 | 87.6%), Two or more Races (893 | 5.2%), and Hispanic or Latino (789 | 4.6%).
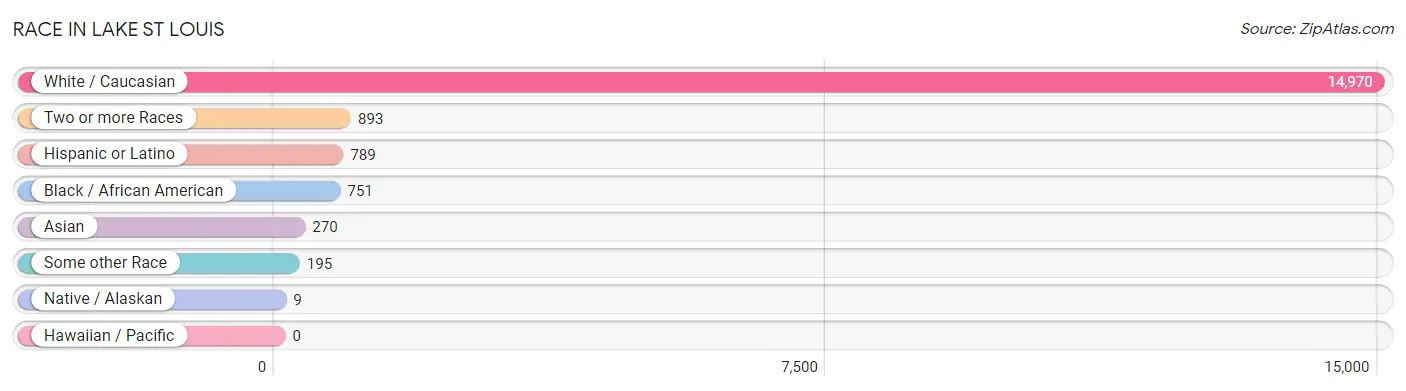
| Race | # Population | % Population |
| Asian | 270 | 1.6% |
| Black / African American | 751 | 4.4% |
| Hawaiian / Pacific | 0 | 0.0% |
| Hispanic or Latino | 789 | 4.6% |
| Native / Alaskan | 9 | 0.1% |
| White / Caucasian | 14,970 | 87.6% |
| Two or more Races | 893 | 5.2% |
| Some other Race | 195 | 1.1% |
| Total | 17,088 | 100.0% |
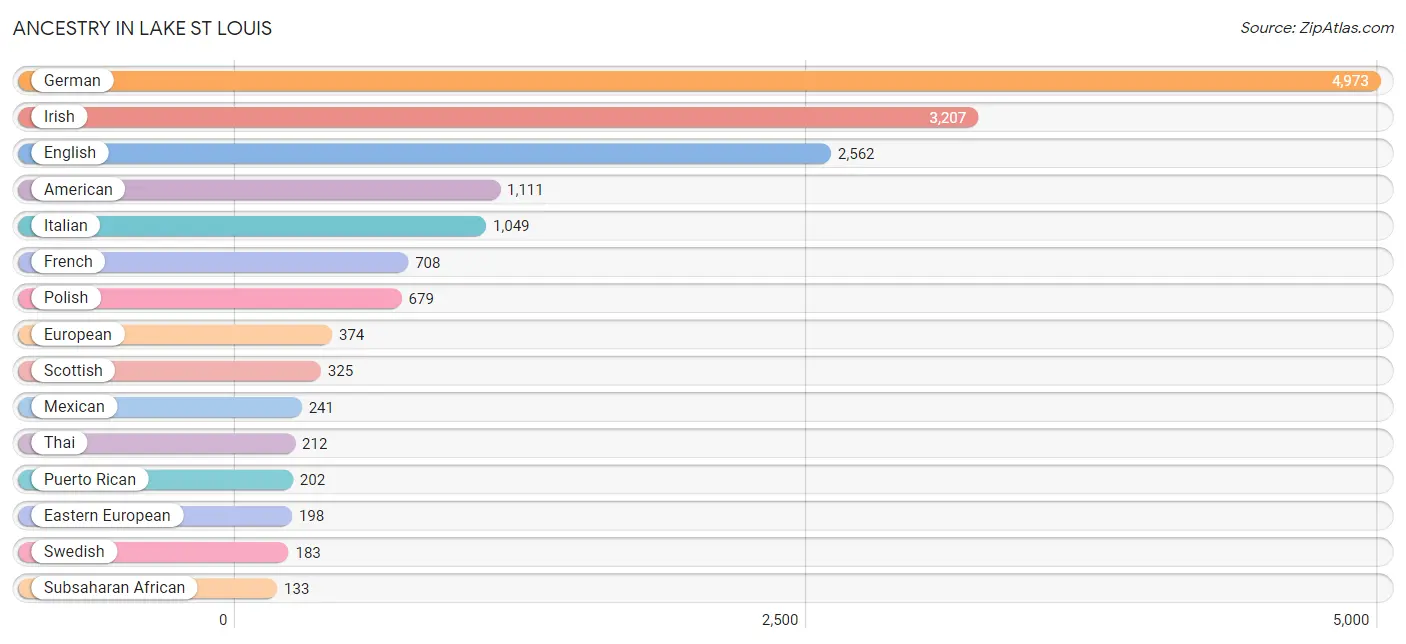
Ancestry in Lake St Louis
The most populous ancestries reported in Lake St Louis are German (4,973 | 29.1%), Irish (3,207 | 18.8%), English (2,562 | 15.0%), American (1,111 | 6.5%), and Italian (1,049 | 6.1%), together accounting for 75.5% of all Lake St Louis residents.
| Ancestry | # Population | % Population |
| African | 6 | 0.0% |
| American | 1,111 | 6.5% |
| Australian | 13 | 0.1% |
| Austrian | 53 | 0.3% |
| Belgian | 28 | 0.2% |
| Bhutanese | 12 | 0.1% |
| Blackfeet | 5 | 0.0% |
| British | 32 | 0.2% |
| Bulgarian | 26 | 0.2% |
| Burmese | 23 | 0.1% |
| Canadian | 61 | 0.4% |
| Central American | 75 | 0.4% |
| Cherokee | 69 | 0.4% |
| Choctaw | 6 | 0.0% |
| Croatian | 12 | 0.1% |
| Cuban | 78 | 0.5% |
| Czech | 41 | 0.2% |
| Czechoslovakian | 44 | 0.3% |
| Danish | 20 | 0.1% |
| Dutch | 108 | 0.6% |
| Eastern European | 198 | 1.2% |
| English | 2,562 | 15.0% |
| European | 374 | 2.2% |
| French | 708 | 4.1% |
| French American Indian | 6 | 0.0% |
| French Canadian | 47 | 0.3% |
| German | 4,973 | 29.1% |
| Greek | 56 | 0.3% |
| Guatemalan | 36 | 0.2% |
| Honduran | 39 | 0.2% |
| Hungarian | 128 | 0.7% |
| Irish | 3,207 | 18.8% |
| Italian | 1,049 | 6.1% |
| Korean | 66 | 0.4% |
| Latvian | 17 | 0.1% |
| Lithuanian | 21 | 0.1% |
| Maltese | 18 | 0.1% |
| Mexican | 241 | 1.4% |
| Nigerian | 127 | 0.7% |
| Northern European | 51 | 0.3% |
| Norwegian | 108 | 0.6% |
| Peruvian | 27 | 0.2% |
| Polish | 679 | 4.0% |
| Portuguese | 61 | 0.4% |
| Puerto Rican | 202 | 1.2% |
| Romanian | 25 | 0.2% |
| Russian | 89 | 0.5% |
| Scandinavian | 37 | 0.2% |
| Scotch-Irish | 83 | 0.5% |
| Scottish | 325 | 1.9% |
| Slovak | 12 | 0.1% |
| South American | 114 | 0.7% |
| Spaniard | 53 | 0.3% |
| Spanish | 26 | 0.2% |
| Subsaharan African | 133 | 0.8% |
| Swedish | 183 | 1.1% |
| Swiss | 57 | 0.3% |
| Thai | 212 | 1.2% |
| Trinidadian and Tobagonian | 17 | 0.1% |
| Ukrainian | 65 | 0.4% |
| Venezuelan | 87 | 0.5% |
| Welsh | 107 | 0.6% | View All 62 Rows |
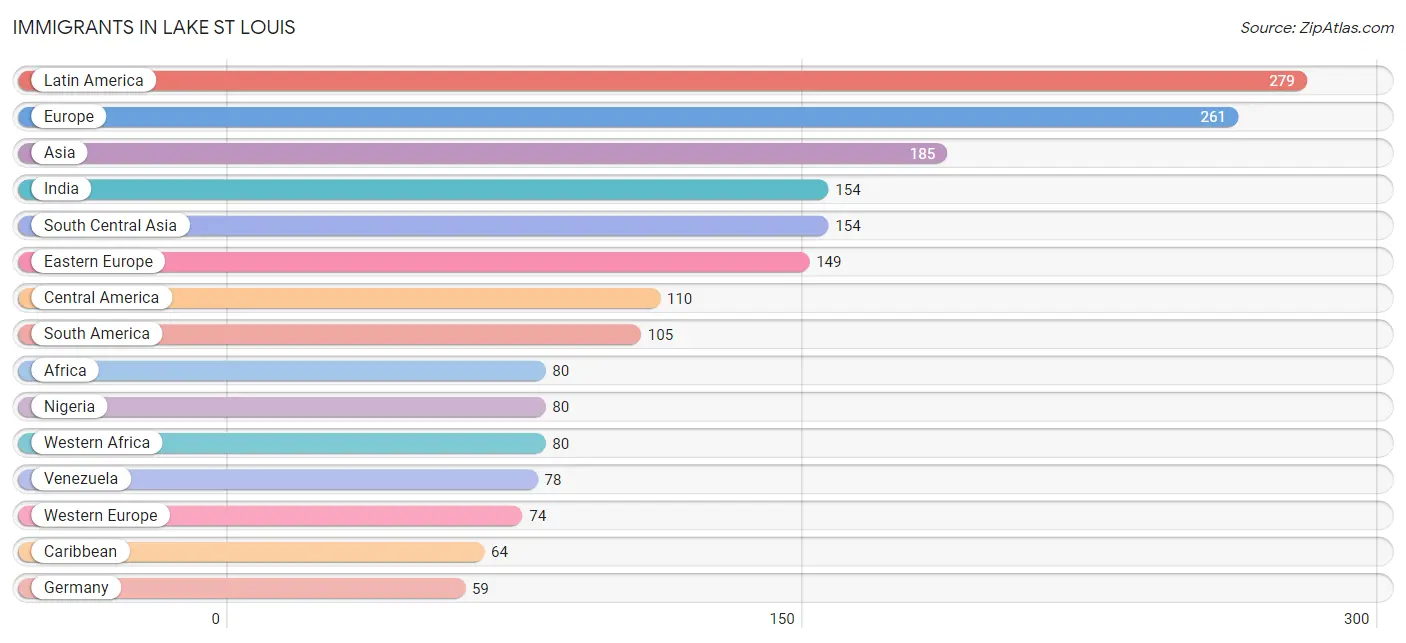
Immigrants in Lake St Louis
The most numerous immigrant groups reported in Lake St Louis came from Latin America (279 | 1.6%), Europe (261 | 1.5%), Asia (185 | 1.1%), India (154 | 0.9%), and South Central Asia (154 | 0.9%), together accounting for 6.0% of all Lake St Louis residents.
| Immigration Origin | # Population | % Population |
| Africa | 80 | 0.5% |
| Asia | 185 | 1.1% |
| Austria | 15 | 0.1% |
| Belarus | 57 | 0.3% |
| Bulgaria | 17 | 0.1% |
| Canada | 11 | 0.1% |
| Caribbean | 64 | 0.4% |
| Central America | 110 | 0.6% |
| Cuba | 47 | 0.3% |
| Eastern Asia | 23 | 0.1% |
| Eastern Europe | 149 | 0.9% |
| Europe | 261 | 1.5% |
| Germany | 59 | 0.4% |
| Guatemala | 29 | 0.2% |
| Honduras | 39 | 0.2% |
| India | 154 | 0.9% |
| Korea | 23 | 0.1% |
| Latin America | 279 | 1.6% |
| Mexico | 42 | 0.3% |
| Nigeria | 80 | 0.5% |
| Northern Europe | 10 | 0.1% |
| Peru | 27 | 0.2% |
| Poland | 37 | 0.2% |
| Russia | 24 | 0.1% |
| South America | 105 | 0.6% |
| South Central Asia | 154 | 0.9% |
| South Eastern Asia | 8 | 0.1% |
| Southern Europe | 28 | 0.2% |
| Spain | 10 | 0.1% |
| Sweden | 10 | 0.1% |
| Trinidad and Tobago | 17 | 0.1% |
| Ukraine | 14 | 0.1% |
| Venezuela | 78 | 0.5% |
| Vietnam | 8 | 0.1% |
| Western Africa | 80 | 0.5% |
| Western Europe | 74 | 0.4% | View All 36 Rows |
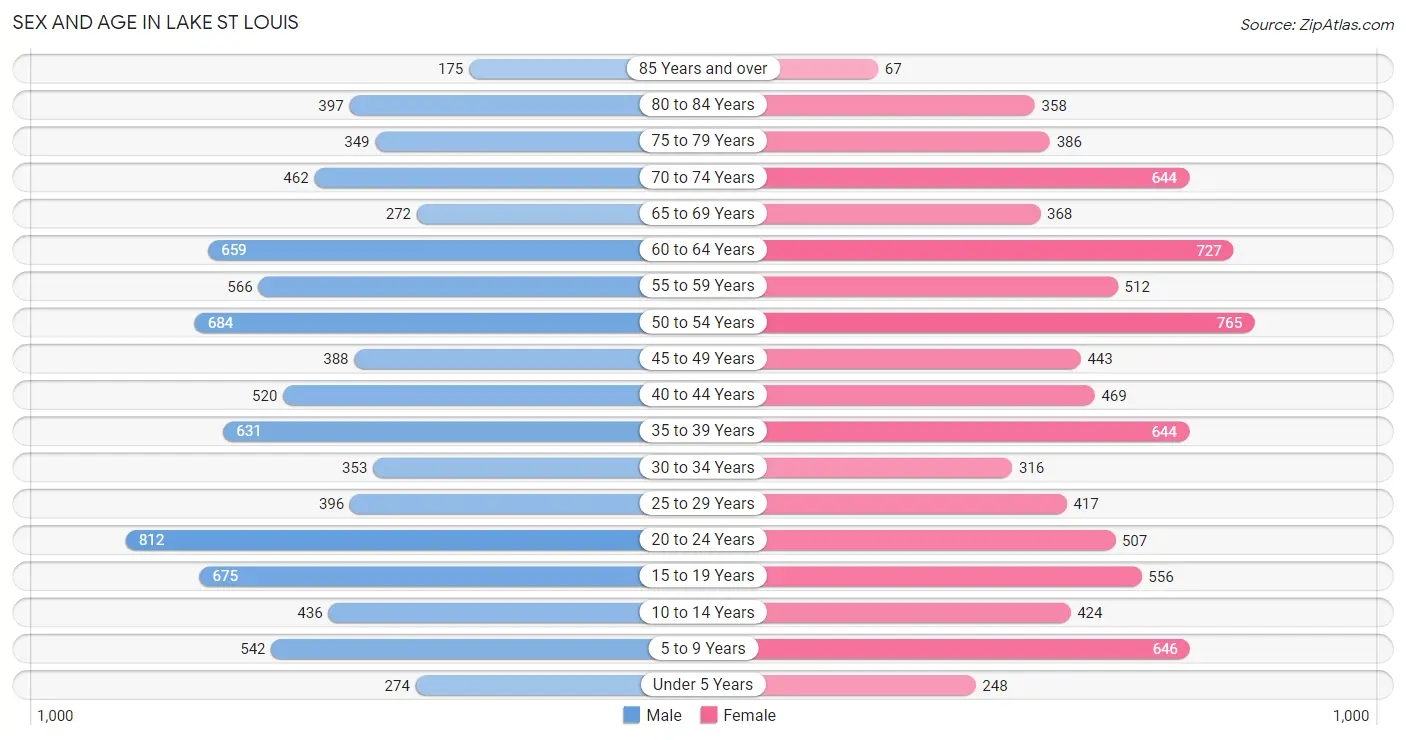
Sex and Age in Lake St Louis
Sex and Age in Lake St Louis
The most populous age groups in Lake St Louis are 20 to 24 Years (812 | 9.5%) for men and 50 to 54 Years (765 | 9.0%) for women.
| Age Bracket | Male | Female |
| Under 5 Years | 274 (3.2%) | 248 (2.9%) |
| 5 to 9 Years | 542 (6.3%) | 646 (7.6%) |
| 10 to 14 Years | 436 (5.1%) | 424 (5.0%) |
| 15 to 19 Years | 675 (7.9%) | 556 (6.5%) |
| 20 to 24 Years | 812 (9.5%) | 507 (6.0%) |
| 25 to 29 Years | 396 (4.6%) | 417 (4.9%) |
| 30 to 34 Years | 353 (4.1%) | 316 (3.7%) |
| 35 to 39 Years | 631 (7.3%) | 644 (7.6%) |
| 40 to 44 Years | 520 (6.0%) | 469 (5.5%) |
| 45 to 49 Years | 388 (4.5%) | 443 (5.2%) |
| 50 to 54 Years | 684 (8.0%) | 765 (9.0%) |
| 55 to 59 Years | 566 (6.6%) | 512 (6.0%) |
| 60 to 64 Years | 659 (7.7%) | 727 (8.6%) |
| 65 to 69 Years | 272 (3.2%) | 368 (4.3%) |
| 70 to 74 Years | 462 (5.4%) | 644 (7.6%) |
| 75 to 79 Years | 349 (4.1%) | 386 (4.5%) |
| 80 to 84 Years | 397 (4.6%) | 358 (4.2%) |
| 85 Years and over | 175 (2.0%) | 67 (0.8%) |
| Total | 8,591 (100.0%) | 8,497 (100.0%) |
Families and Households in Lake St Louis
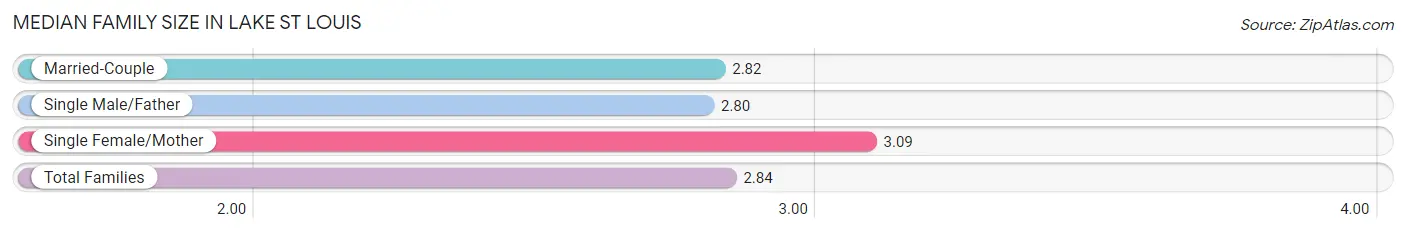
Median Family Size in Lake St Louis
The median family size in Lake St Louis is 2.84 persons per family, with single female/mother families (375 | 7.3%) accounting for the largest median family size of 3.09 persons per family. On the other hand, single male/father families (182 | 3.6%) represent the smallest median family size with 2.80 persons per family.
| Family Type | # Families | Family Size |
| Married-Couple | 4,560 (89.1%) | 2.82 |
| Single Male/Father | 182 (3.6%) | 2.80 |
| Single Female/Mother | 375 (7.3%) | 3.09 |
| Total Families | 5,117 (100.0%) | 2.84 |
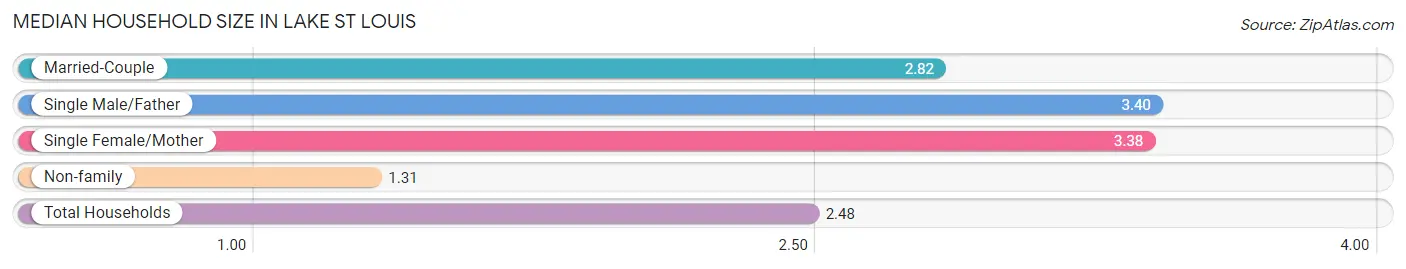
Median Household Size in Lake St Louis
The median household size in Lake St Louis is 2.48 persons per household, with single male/father households (182 | 2.6%) accounting for the largest median household size of 3.4 persons per household. non-family households (1,780 | 25.8%) represent the smallest median household size with 1.31 persons per household.
| Household Type | # Households | Household Size |
| Married-Couple | 4,560 (66.1%) | 2.82 |
| Single Male/Father | 182 (2.6%) | 3.40 |
| Single Female/Mother | 375 (5.4%) | 3.38 |
| Non-family | 1,780 (25.8%) | 1.31 |
| Total Households | 6,897 (100.0%) | 2.48 |
Household Size by Marriage Status in Lake St Louis
Out of a total of 6,897 households in Lake St Louis, 5,117 (74.2%) are family households, while 1,780 (25.8%) are nonfamily households. The most numerous type of family households are 2-person households, comprising 2,506, and the most common type of nonfamily households are 1-person households, comprising 1,264.
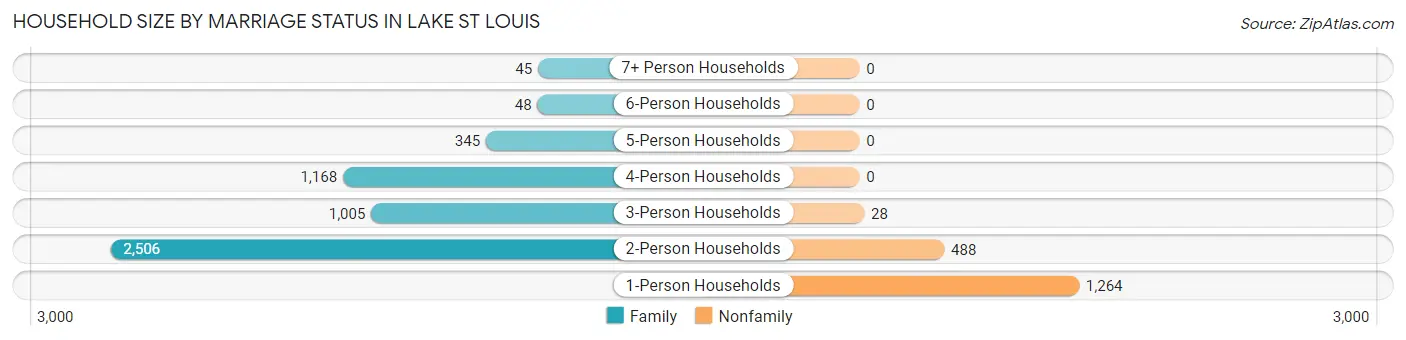
| Household Size | Family Households | Nonfamily Households |
| 1-Person Households | - | 1,264 (18.3%) |
| 2-Person Households | 2,506 (36.3%) | 488 (7.1%) |
| 3-Person Households | 1,005 (14.6%) | 28 (0.4%) |
| 4-Person Households | 1,168 (16.9%) | 0 (0.0%) |
| 5-Person Households | 345 (5.0%) | 0 (0.0%) |
| 6-Person Households | 48 (0.7%) | 0 (0.0%) |
| 7+ Person Households | 45 (0.6%) | 0 (0.0%) |
| Total | 5,117 (74.2%) | 1,780 (25.8%) |
Female Fertility in Lake St Louis
Fertility by Age in Lake St Louis
Average fertility rate in Lake St Louis is 21.0 births per 1,000 women. Women in the age bracket of 20 to 34 years have the highest fertility rate with 60.0 births per 1,000 women. Women in the age bracket of 20 to 34 years acount for 100.0% of all women with births.
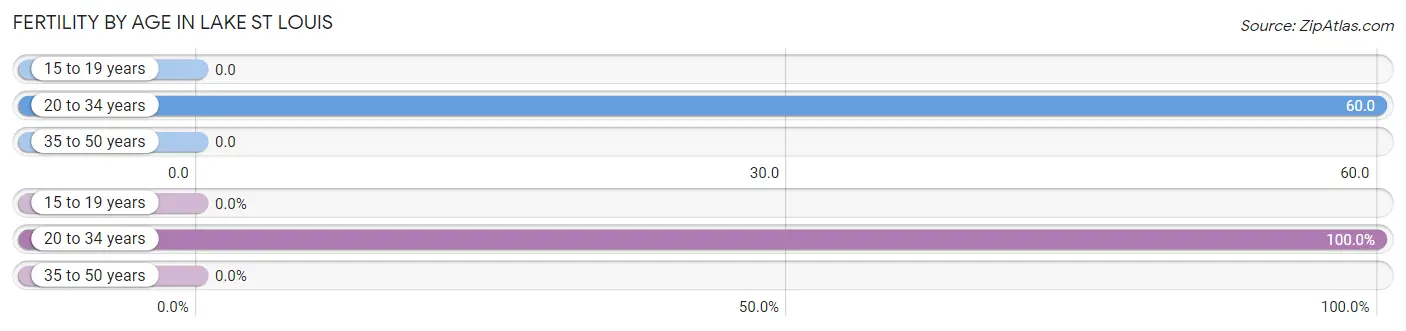
| Age Bracket | Women with Births | Births / 1,000 Women |
| 15 to 19 years | 0 (0.0%) | 0.0 |
| 20 to 34 years | 74 (100.0%) | 60.0 |
| 35 to 50 years | 0 (0.0%) | 0.0 |
| Total | 74 (100.0%) | 21.0 |
Fertility by Age by Marriage Status in Lake St Louis
44.6% of women with births (74) in Lake St Louis are married. The highest percentage of unmarried women with births falls into 20 to 34 years age bracket with 55.4% of them unmarried at the time of birth, while the lowest percentage of unmarried women with births belong to 20 to 34 years age bracket with 55.4% of them unmarried.
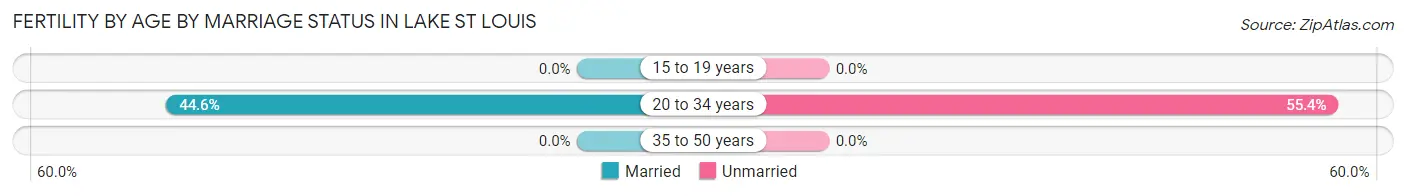
| Age Bracket | Married | Unmarried |
| 15 to 19 years | 0 (0.0%) | 0 (0.0%) |
| 20 to 34 years | 33 (44.6%) | 41 (55.4%) |
| 35 to 50 years | 0 (0.0%) | 0 (0.0%) |
| Total | 33 (44.6%) | 41 (55.4%) |
Fertility by Education in Lake St Louis
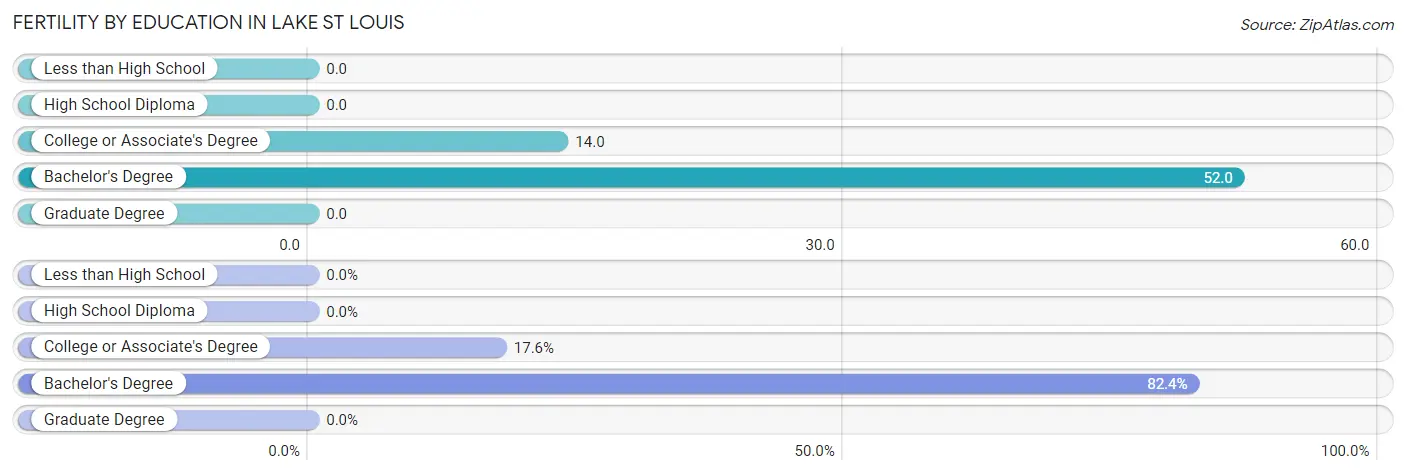
| Educational Attainment | Women with Births | Births / 1,000 Women |
| Less than High School | 0 (0.0%) | 0.0 |
| High School Diploma | 0 (0.0%) | 0.0 |
| College or Associate's Degree | 13 (17.6%) | 14.0 |
| Bachelor's Degree | 61 (82.4%) | 52.0 |
| Graduate Degree | 0 (0.0%) | 0.0 |
| Total | 74 (100.0%) | 21.0 |
Fertility by Education by Marriage Status in Lake St Louis
55.4% of women with births in Lake St Louis are unmarried. Women with the educational attainment of college or associate's degree are most likely to be married with 100.0% of them married at childbirth, while women with the educational attainment of bachelor's degree are least likely to be married with 67.2% of them unmarried at childbirth.
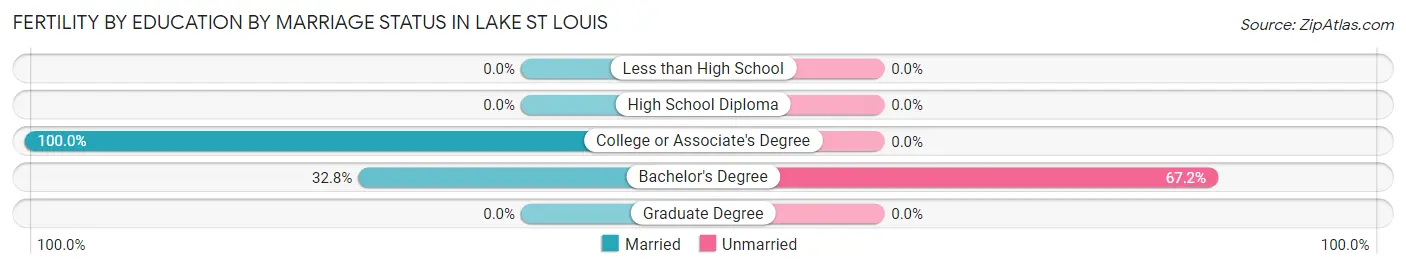
| Educational Attainment | Married | Unmarried |
| Less than High School | 0 (0.0%) | 0 (0.0%) |
| High School Diploma | 0 (0.0%) | 0 (0.0%) |
| College or Associate's Degree | 13 (100.0%) | 0 (0.0%) |
| Bachelor's Degree | 20 (32.8%) | 41 (67.2%) |
| Graduate Degree | 0 (0.0%) | 0 (0.0%) |
| Total | 33 (44.6%) | 41 (55.4%) |
Employment Characteristics in Lake St Louis
Employment by Class of Employer in Lake St Louis
Among the 8,987 employed individuals in Lake St Louis, private company employees (7,086 | 78.8%), not-for-profit organizations (718 | 8.0%), and local government employees (420 | 4.7%) make up the most common classes of employment.
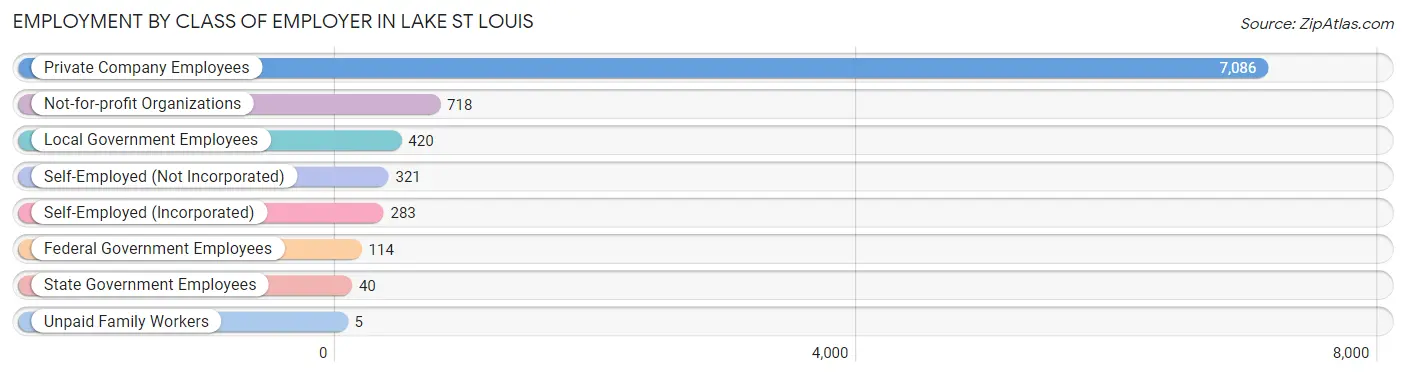
| Employer Class | # Employees | % Employees |
| Private Company Employees | 7,086 | 78.8% |
| Self-Employed (Incorporated) | 283 | 3.2% |
| Self-Employed (Not Incorporated) | 321 | 3.6% |
| Not-for-profit Organizations | 718 | 8.0% |
| Local Government Employees | 420 | 4.7% |
| State Government Employees | 40 | 0.4% |
| Federal Government Employees | 114 | 1.3% |
| Unpaid Family Workers | 5 | 0.1% |
| Total | 8,987 | 100.0% |
Employment Status by Age in Lake St Louis
According to the labor force statistics for Lake St Louis, out of the total population over 16 years of age (14,365), 66.0% or 9,481 individuals are in the labor force, with 3.8% or 360 of them unemployed. The age group with the highest labor force participation rate is 20 to 24 years, with 97.0% or 1,279 individuals in the labor force. Within the labor force, the 25 to 29 years age range has the highest percentage of unemployed individuals, with 7.7% or 58 of them being unemployed.
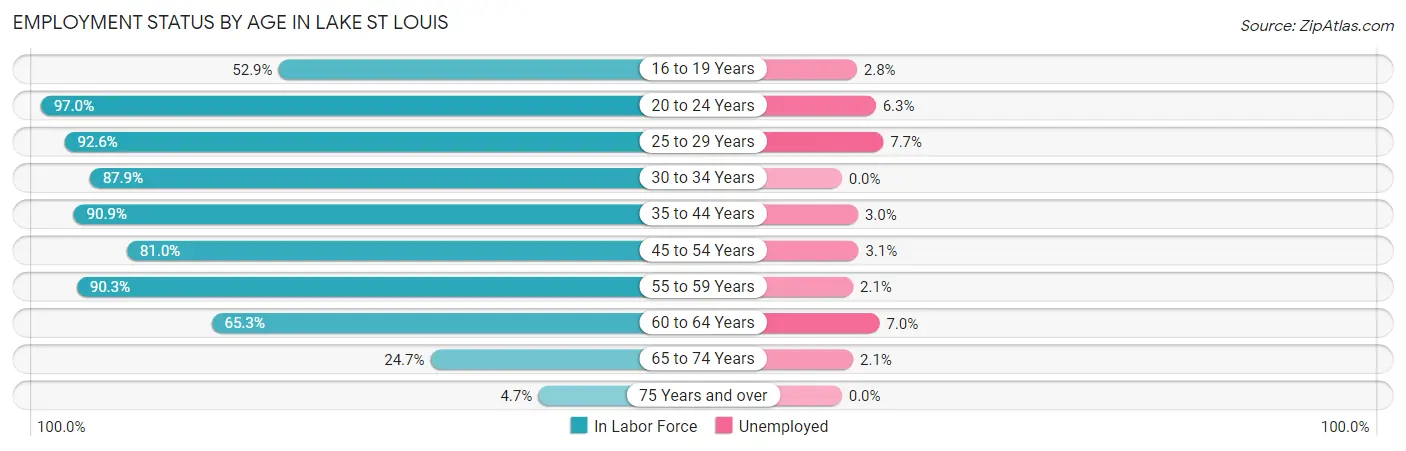
| Age Bracket | In Labor Force | Unemployed |
| 16 to 19 Years | 570 (52.9%) | 16 (2.8%) |
| 20 to 24 Years | 1,279 (97.0%) | 81 (6.3%) |
| 25 to 29 Years | 753 (92.6%) | 58 (7.7%) |
| 30 to 34 Years | 588 (87.9%) | 0 (0.0%) |
| 35 to 44 Years | 2,058 (90.9%) | 62 (3.0%) |
| 45 to 54 Years | 1,847 (81.0%) | 57 (3.1%) |
| 55 to 59 Years | 973 (90.3%) | 20 (2.1%) |
| 60 to 64 Years | 905 (65.3%) | 63 (7.0%) |
| 65 to 74 Years | 431 (24.7%) | 9 (2.1%) |
| 75 Years and over | 81 (4.7%) | 0 (0.0%) |
| Total | 9,481 (66.0%) | 360 (3.8%) |
Employment Status by Educational Attainment in Lake St Louis
According to labor force statistics for Lake St Louis, 83.9% of individuals (7,123) out of the total population between 25 and 64 years of age (8,490) are in the labor force, with 3.6% or 256 of them being unemployed. The group with the highest labor force participation rate are those with the educational attainment of bachelor's degree or higher, with 86.5% or 3,866 individuals in the labor force. Within the labor force, individuals with high school diploma education have the highest percentage of unemployment, with 4.3% or 37 of them being unemployed.
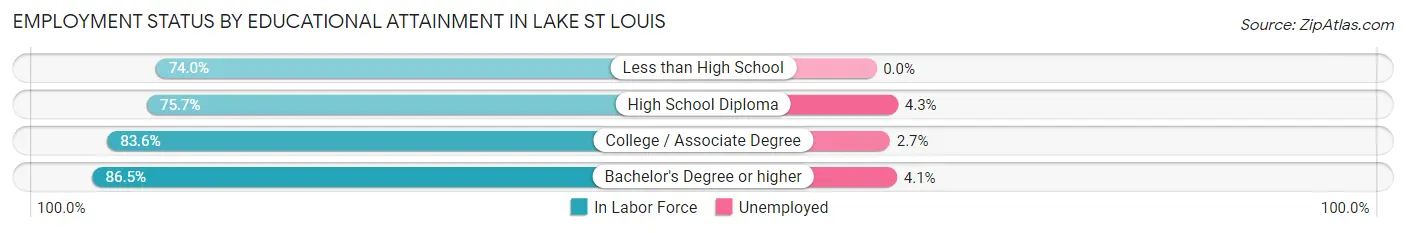
| Educational Attainment | In Labor Force | Unemployed |
| Less than High School | 97 (74.0%) | 0 (0.0%) |
| High School Diploma | 869 (75.7%) | 49 (4.3%) |
| College / Associate Degree | 2,292 (83.6%) | 74 (2.7%) |
| Bachelor's Degree or higher | 3,866 (86.5%) | 183 (4.1%) |
| Total | 7,123 (83.9%) | 306 (3.6%) |
Employment Occupations by Sex in Lake St Louis
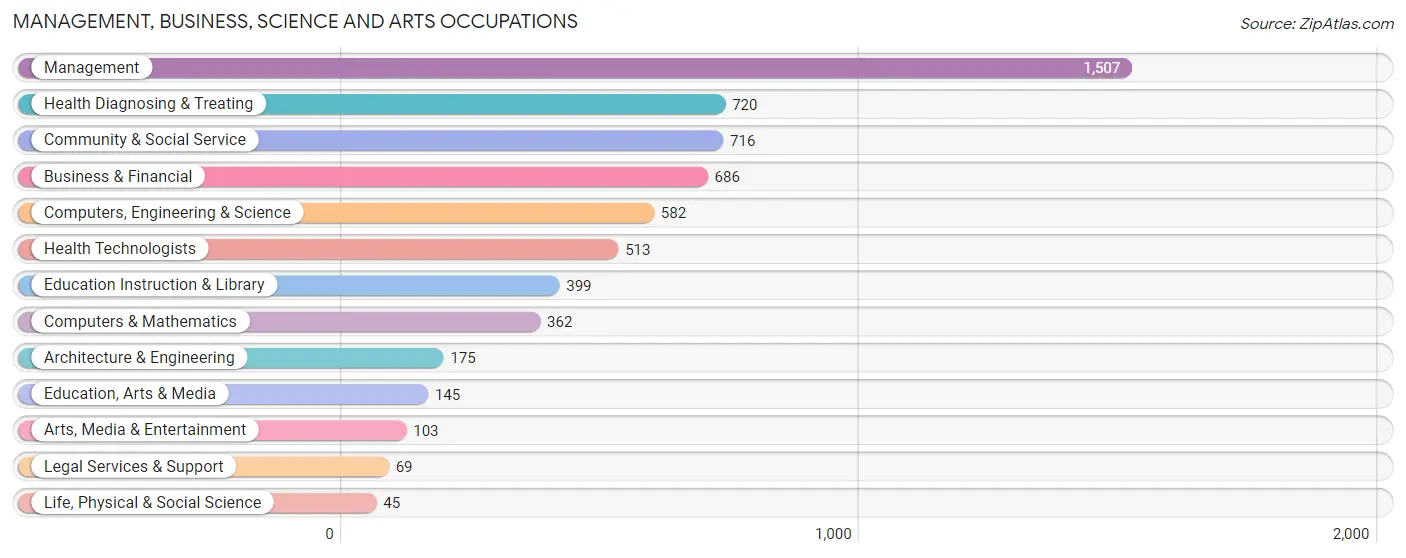
Management, Business, Science and Arts Occupations
The most common Management, Business, Science and Arts occupations in Lake St Louis are Management (1,507 | 16.5%), Health Diagnosing & Treating (720 | 7.9%), Community & Social Service (716 | 7.9%), Business & Financial (686 | 7.5%), and Computers, Engineering & Science (582 | 6.4%).
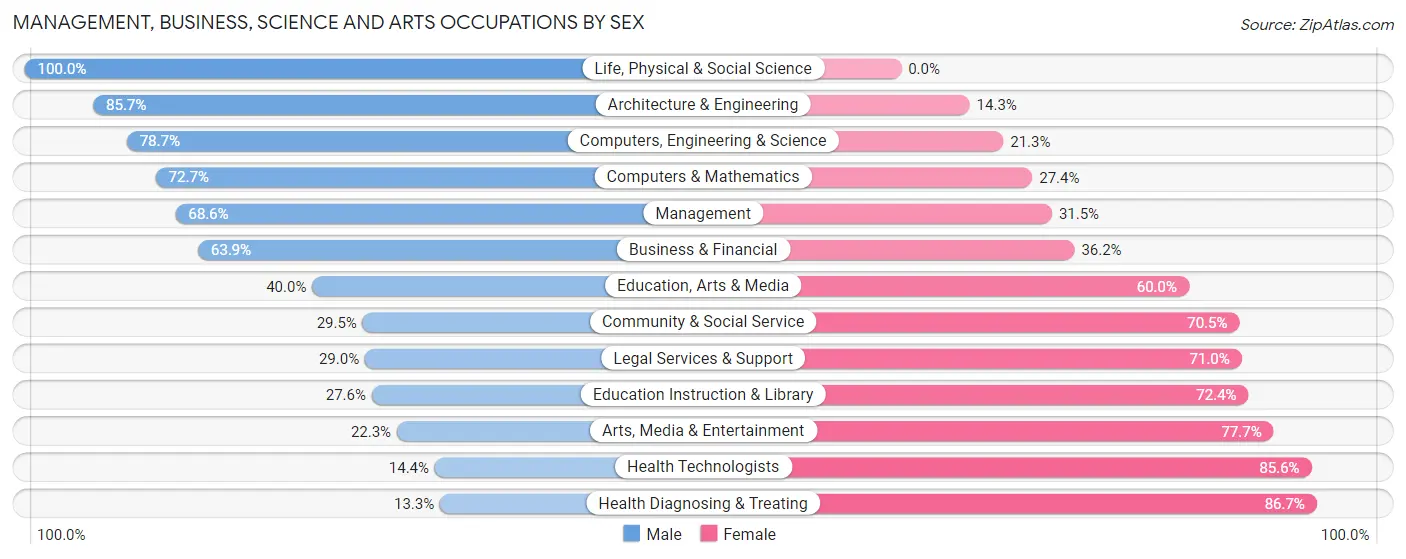
Management, Business, Science and Arts Occupations by Sex
Within the Management, Business, Science and Arts occupations in Lake St Louis, the most male-oriented occupations are Life, Physical & Social Science (100.0%), Architecture & Engineering (85.7%), and Computers, Engineering & Science (78.7%), while the most female-oriented occupations are Health Diagnosing & Treating (86.7%), Health Technologists (85.6%), and Arts, Media & Entertainment (77.7%).
| Occupation | Male | Female |
| Management | 1,033 (68.5%) | 474 (31.5%) |
| Business & Financial | 438 (63.8%) | 248 (36.1%) |
| Computers, Engineering & Science | 458 (78.7%) | 124 (21.3%) |
| Computers & Mathematics | 263 (72.7%) | 99 (27.4%) |
| Architecture & Engineering | 150 (85.7%) | 25 (14.3%) |
| Life, Physical & Social Science | 45 (100.0%) | 0 (0.0%) |
| Community & Social Service | 211 (29.5%) | 505 (70.5%) |
| Education, Arts & Media | 58 (40.0%) | 87 (60.0%) |
| Legal Services & Support | 20 (29.0%) | 49 (71.0%) |
| Education Instruction & Library | 110 (27.6%) | 289 (72.4%) |
| Arts, Media & Entertainment | 23 (22.3%) | 80 (77.7%) |
| Health Diagnosing & Treating | 96 (13.3%) | 624 (86.7%) |
| Health Technologists | 74 (14.4%) | 439 (85.6%) |
| Total (Category) | 2,236 (53.1%) | 1,975 (46.9%) |
| Total (Overall) | 5,008 (54.9%) | 4,114 (45.1%) |
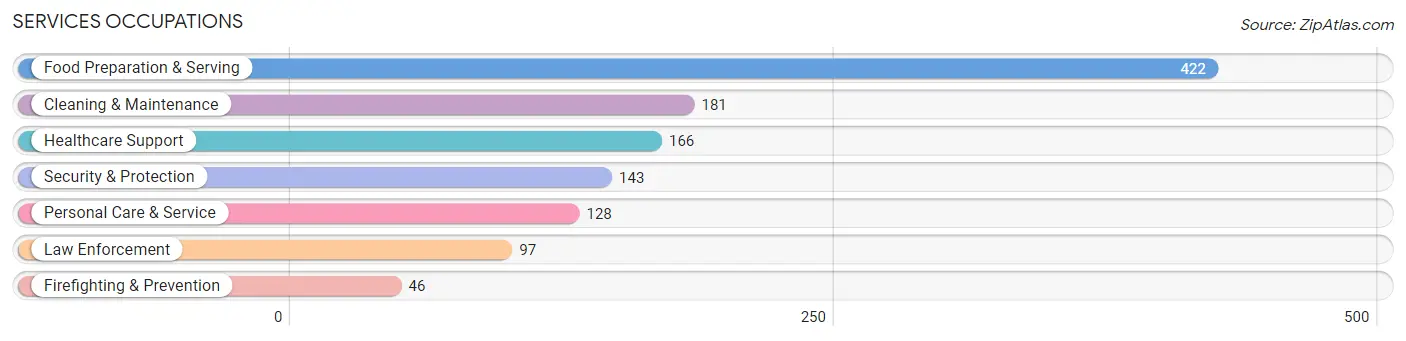
Services Occupations
The most common Services occupations in Lake St Louis are Food Preparation & Serving (422 | 4.6%), Cleaning & Maintenance (181 | 2.0%), Healthcare Support (166 | 1.8%), Security & Protection (143 | 1.6%), and Personal Care & Service (128 | 1.4%).
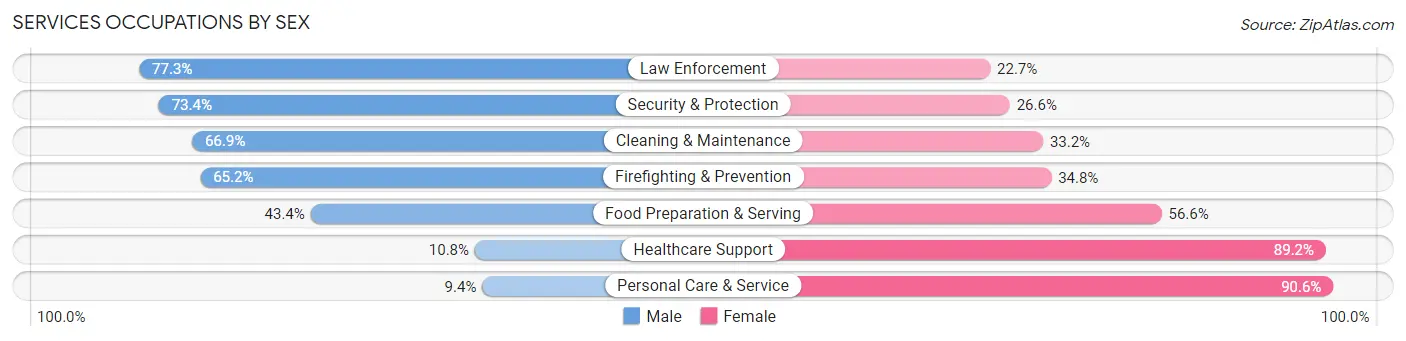
Services Occupations by Sex
Within the Services occupations in Lake St Louis, the most male-oriented occupations are Law Enforcement (77.3%), Security & Protection (73.4%), and Cleaning & Maintenance (66.8%), while the most female-oriented occupations are Personal Care & Service (90.6%), Healthcare Support (89.2%), and Food Preparation & Serving (56.6%).
| Occupation | Male | Female |
| Healthcare Support | 18 (10.8%) | 148 (89.2%) |
| Security & Protection | 105 (73.4%) | 38 (26.6%) |
| Firefighting & Prevention | 30 (65.2%) | 16 (34.8%) |
| Law Enforcement | 75 (77.3%) | 22 (22.7%) |
| Food Preparation & Serving | 183 (43.4%) | 239 (56.6%) |
| Cleaning & Maintenance | 121 (66.8%) | 60 (33.2%) |
| Personal Care & Service | 12 (9.4%) | 116 (90.6%) |
| Total (Category) | 439 (42.2%) | 601 (57.8%) |
| Total (Overall) | 5,008 (54.9%) | 4,114 (45.1%) |
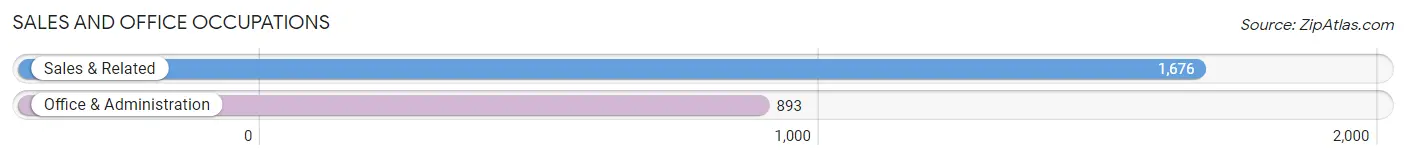
Sales and Office Occupations
The most common Sales and Office occupations in Lake St Louis are Sales & Related (1,676 | 18.4%), and Office & Administration (893 | 9.8%).
Sales and Office Occupations by Sex
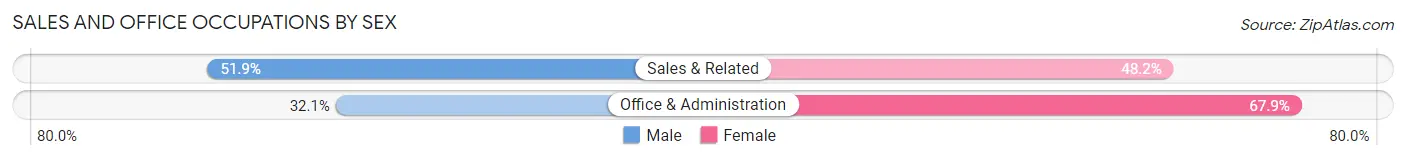
| Occupation | Male | Female |
| Sales & Related | 869 (51.8%) | 807 (48.1%) |
| Office & Administration | 287 (32.1%) | 606 (67.9%) |
| Total (Category) | 1,156 (45.0%) | 1,413 (55.0%) |
| Total (Overall) | 5,008 (54.9%) | 4,114 (45.1%) |
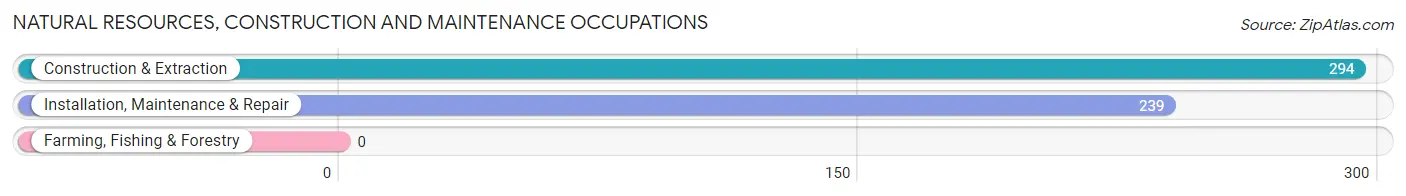
Natural Resources, Construction and Maintenance Occupations
The most common Natural Resources, Construction and Maintenance occupations in Lake St Louis are Construction & Extraction (294 | 3.2%), and Installation, Maintenance & Repair (239 | 2.6%).
Natural Resources, Construction and Maintenance Occupations by Sex
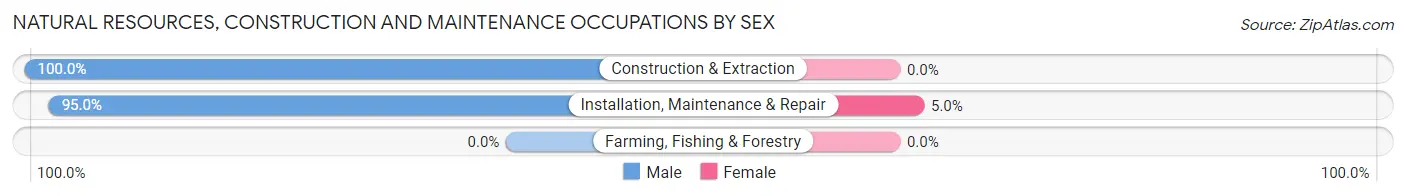
| Occupation | Male | Female |
| Farming, Fishing & Forestry | 0 (0.0%) | 0 (0.0%) |
| Construction & Extraction | 294 (100.0%) | 0 (0.0%) |
| Installation, Maintenance & Repair | 227 (95.0%) | 12 (5.0%) |
| Total (Category) | 521 (97.8%) | 12 (2.2%) |
| Total (Overall) | 5,008 (54.9%) | 4,114 (45.1%) |
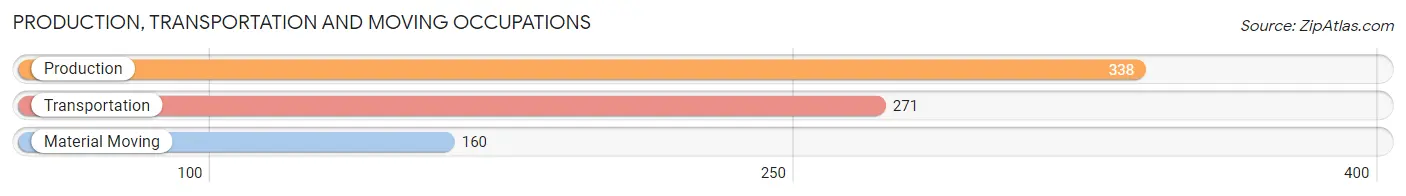
Production, Transportation and Moving Occupations
The most common Production, Transportation and Moving occupations in Lake St Louis are Production (338 | 3.7%), Transportation (271 | 3.0%), and Material Moving (160 | 1.8%).
Production, Transportation and Moving Occupations by Sex
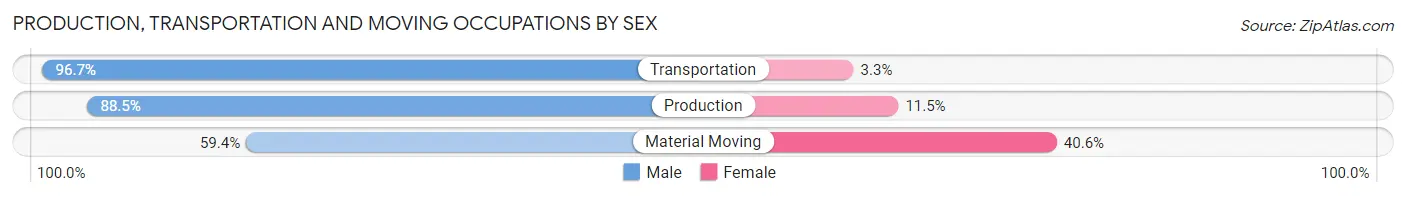
| Occupation | Male | Female |
| Production | 299 (88.5%) | 39 (11.5%) |
| Transportation | 262 (96.7%) | 9 (3.3%) |
| Material Moving | 95 (59.4%) | 65 (40.6%) |
| Total (Category) | 656 (85.3%) | 113 (14.7%) |
| Total (Overall) | 5,008 (54.9%) | 4,114 (45.1%) |
Employment Industries by Sex in Lake St Louis
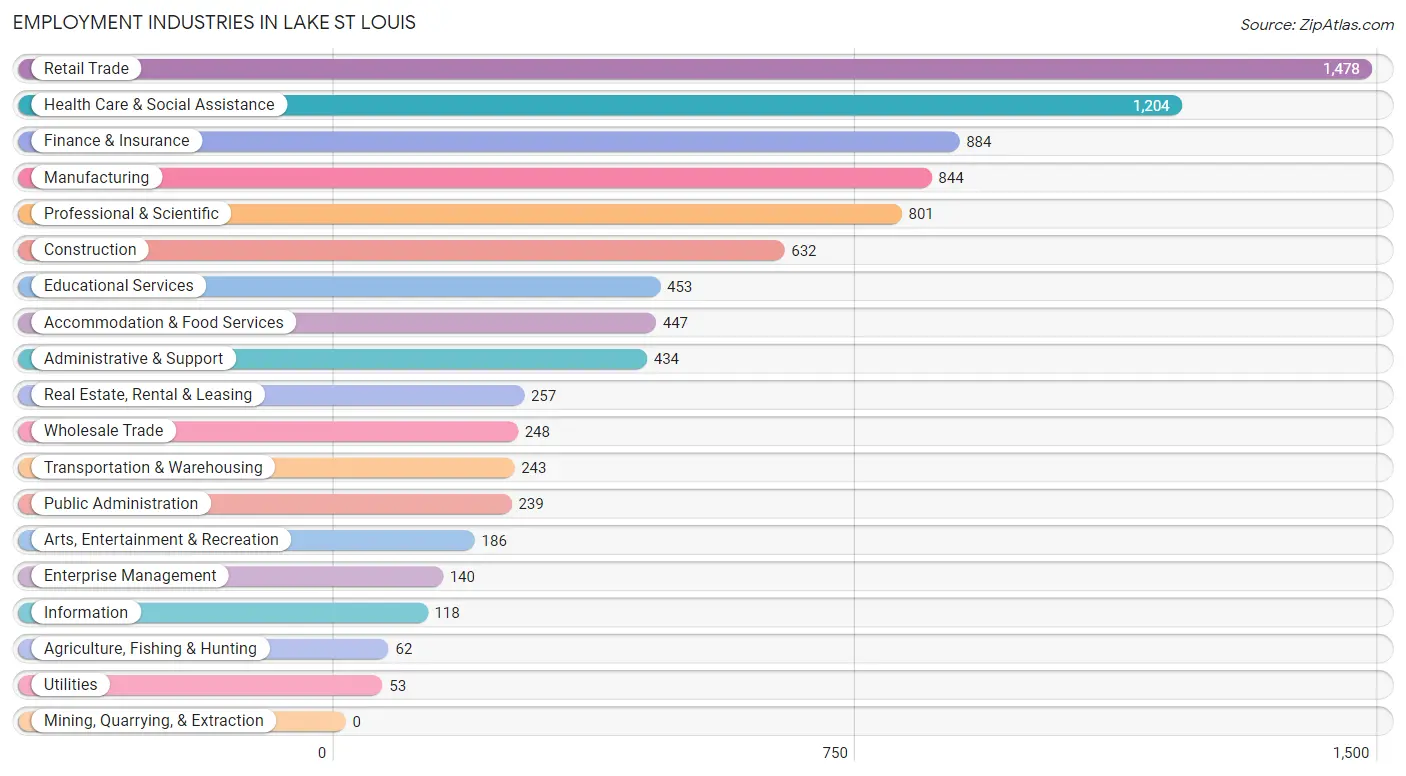
Employment Industries in Lake St Louis
The major employment industries in Lake St Louis include Retail Trade (1,478 | 16.2%), Health Care & Social Assistance (1,204 | 13.2%), Finance & Insurance (884 | 9.7%), Manufacturing (844 | 9.2%), and Professional & Scientific (801 | 8.8%).
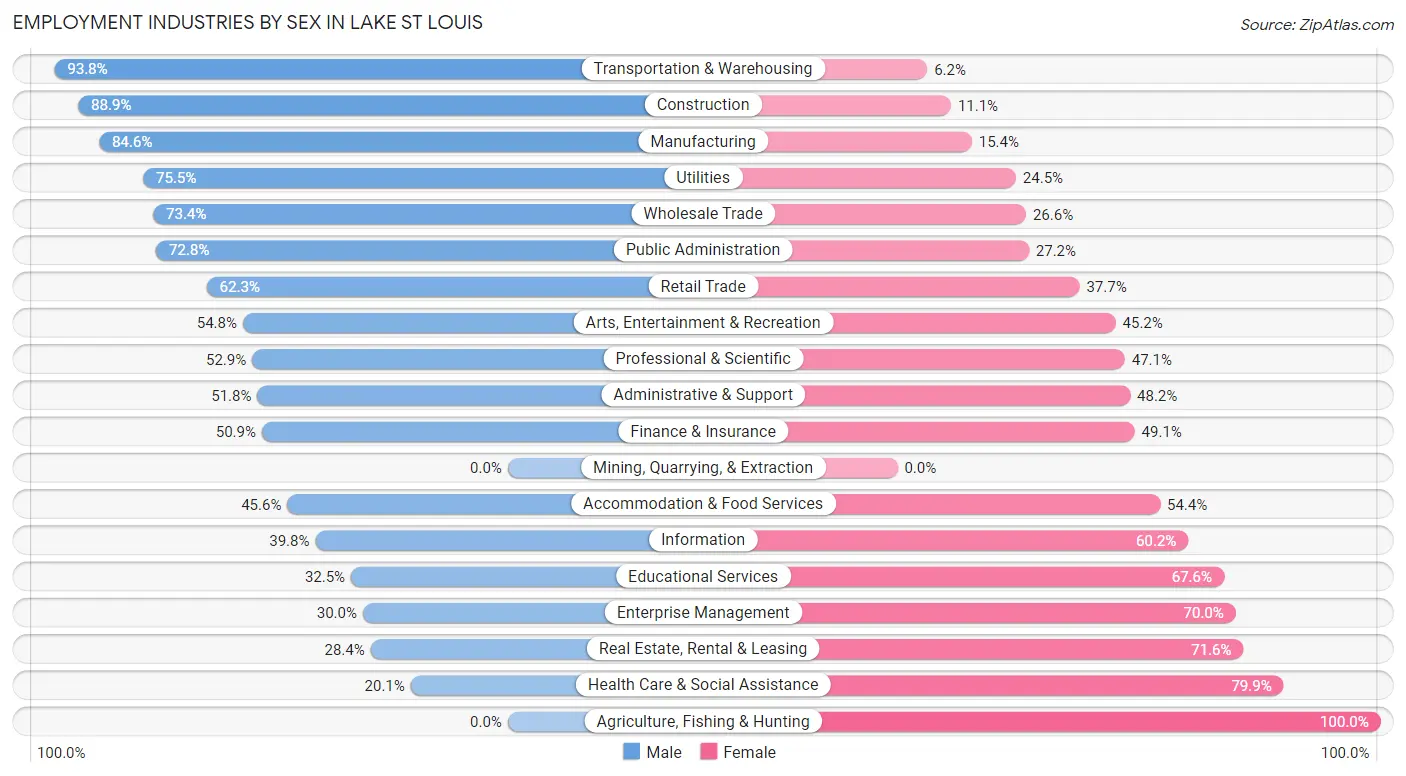
Employment Industries by Sex in Lake St Louis
The Lake St Louis industries that see more men than women are Transportation & Warehousing (93.8%), Construction (88.9%), and Manufacturing (84.6%), whereas the industries that tend to have a higher number of women are Agriculture, Fishing & Hunting (100.0%), Health Care & Social Assistance (79.9%), and Real Estate, Rental & Leasing (71.6%).
| Industry | Male | Female |
| Agriculture, Fishing & Hunting | 0 (0.0%) | 62 (100.0%) |
| Mining, Quarrying, & Extraction | 0 (0.0%) | 0 (0.0%) |
| Construction | 562 (88.9%) | 70 (11.1%) |
| Manufacturing | 714 (84.6%) | 130 (15.4%) |
| Wholesale Trade | 182 (73.4%) | 66 (26.6%) |
| Retail Trade | 921 (62.3%) | 557 (37.7%) |
| Transportation & Warehousing | 228 (93.8%) | 15 (6.2%) |
| Utilities | 40 (75.5%) | 13 (24.5%) |
| Information | 47 (39.8%) | 71 (60.2%) |
| Finance & Insurance | 450 (50.9%) | 434 (49.1%) |
| Real Estate, Rental & Leasing | 73 (28.4%) | 184 (71.6%) |
| Professional & Scientific | 424 (52.9%) | 377 (47.1%) |
| Enterprise Management | 42 (30.0%) | 98 (70.0%) |
| Administrative & Support | 225 (51.8%) | 209 (48.2%) |
| Educational Services | 147 (32.5%) | 306 (67.5%) |
| Health Care & Social Assistance | 242 (20.1%) | 962 (79.9%) |
| Arts, Entertainment & Recreation | 102 (54.8%) | 84 (45.2%) |
| Accommodation & Food Services | 204 (45.6%) | 243 (54.4%) |
| Public Administration | 174 (72.8%) | 65 (27.2%) |
| Total | 5,008 (54.9%) | 4,114 (45.1%) |
Education in Lake St Louis
School Enrollment in Lake St Louis
The most common levels of schooling among the 4,230 students in Lake St Louis are high school (1,165 | 27.5%), college / undergraduate (930 | 22.0%), and elementary school (822 | 19.4%).
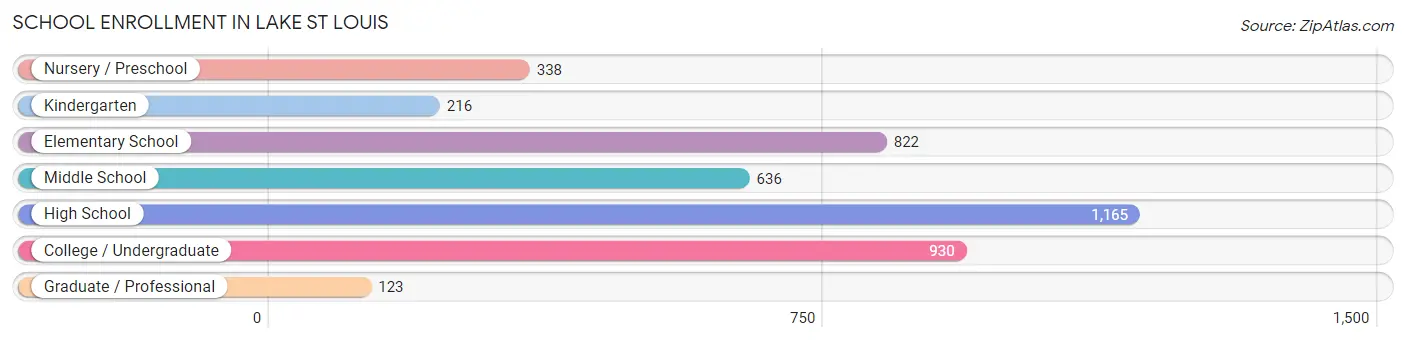
| School Level | # Students | % Students |
| Nursery / Preschool | 338 | 8.0% |
| Kindergarten | 216 | 5.1% |
| Elementary School | 822 | 19.4% |
| Middle School | 636 | 15.0% |
| High School | 1,165 | 27.5% |
| College / Undergraduate | 930 | 22.0% |
| Graduate / Professional | 123 | 2.9% |
| Total | 4,230 | 100.0% |
School Enrollment by Age by Funding Source in Lake St Louis
Out of a total of 4,230 students who are enrolled in schools in Lake St Louis, 1,299 (30.7%) attend a private institution, while the remaining 2,931 (69.3%) are enrolled in public schools. The age group of 20 to 24 year olds has the highest likelihood of being enrolled in private schools, with 260 (40.9% in the age bracket) enrolled. Conversely, the age group of 18 to 19 year olds has the lowest likelihood of being enrolled in a private school, with 327 (90.1% in the age bracket) attending a public institution.
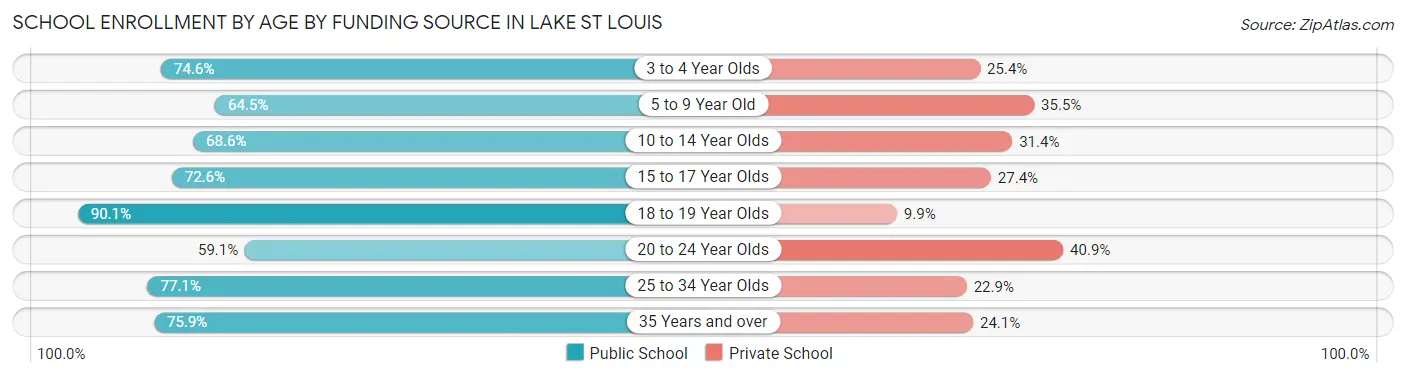
| Age Bracket | Public School | Private School |
| 3 to 4 Year Olds | 132 (74.6%) | 45 (25.4%) |
| 5 to 9 Year Old | 753 (64.5%) | 414 (35.5%) |
| 10 to 14 Year Olds | 590 (68.6%) | 270 (31.4%) |
| 15 to 17 Year Olds | 590 (72.6%) | 223 (27.4%) |
| 18 to 19 Year Olds | 327 (90.1%) | 36 (9.9%) |
| 20 to 24 Year Olds | 376 (59.1%) | 260 (40.9%) |
| 25 to 34 Year Olds | 37 (77.1%) | 11 (22.9%) |
| 35 Years and over | 126 (75.9%) | 40 (24.1%) |
| Total | 2,931 (69.3%) | 1,299 (30.7%) |
Educational Attainment by Field of Study in Lake St Louis
Business (2,226 | 35.2%), education (780 | 12.3%), science & technology (718 | 11.4%), engineering (573 | 9.1%), and arts & humanities (417 | 6.6%) are the most common fields of study among 6,314 individuals in Lake St Louis who have obtained a bachelor's degree or higher.
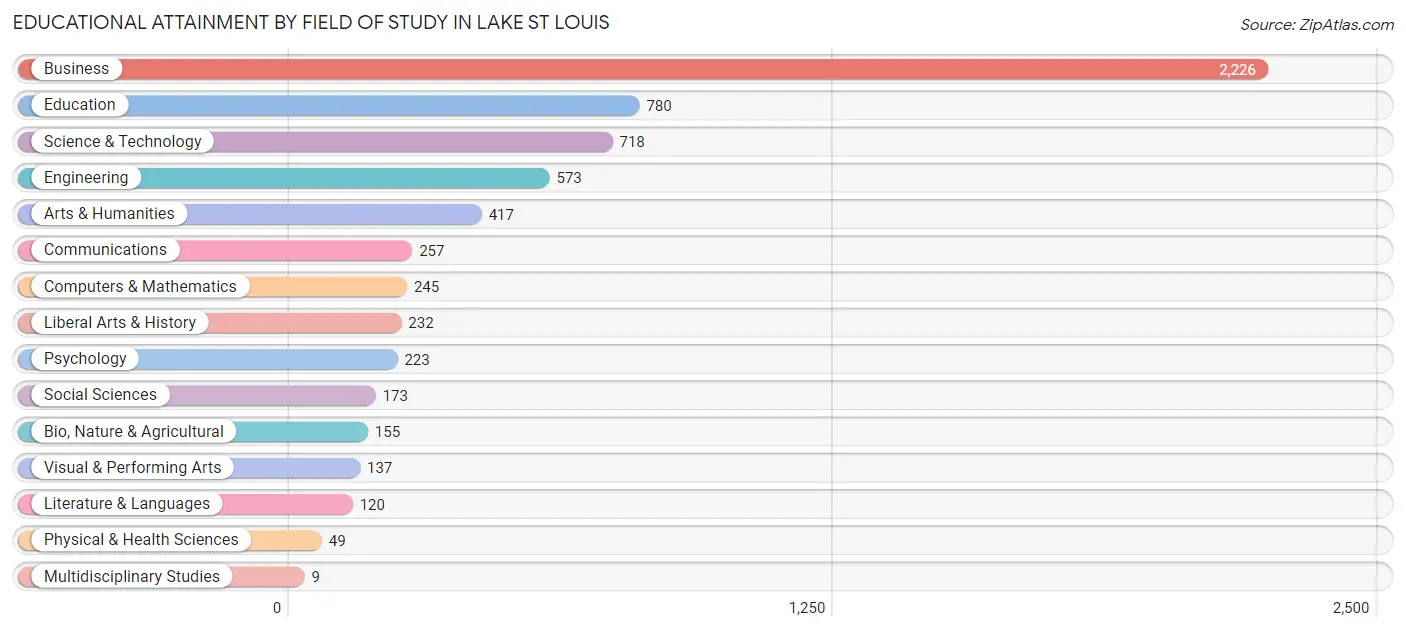
| Field of Study | # Graduates | % Graduates |
| Computers & Mathematics | 245 | 3.9% |
| Bio, Nature & Agricultural | 155 | 2.5% |
| Physical & Health Sciences | 49 | 0.8% |
| Psychology | 223 | 3.5% |
| Social Sciences | 173 | 2.7% |
| Engineering | 573 | 9.1% |
| Multidisciplinary Studies | 9 | 0.1% |
| Science & Technology | 718 | 11.4% |
| Business | 2,226 | 35.2% |
| Education | 780 | 12.3% |
| Literature & Languages | 120 | 1.9% |
| Liberal Arts & History | 232 | 3.7% |
| Visual & Performing Arts | 137 | 2.2% |
| Communications | 257 | 4.1% |
| Arts & Humanities | 417 | 6.6% |
| Total | 6,314 | 100.0% |
Transportation & Commute in Lake St Louis
Vehicle Availability by Sex in Lake St Louis
The most prevalent vehicle ownership categories in Lake St Louis are males with 2 vehicles (2,285, accounting for 46.9%) and females with 2 vehicles (1,874, making up 55.5%).
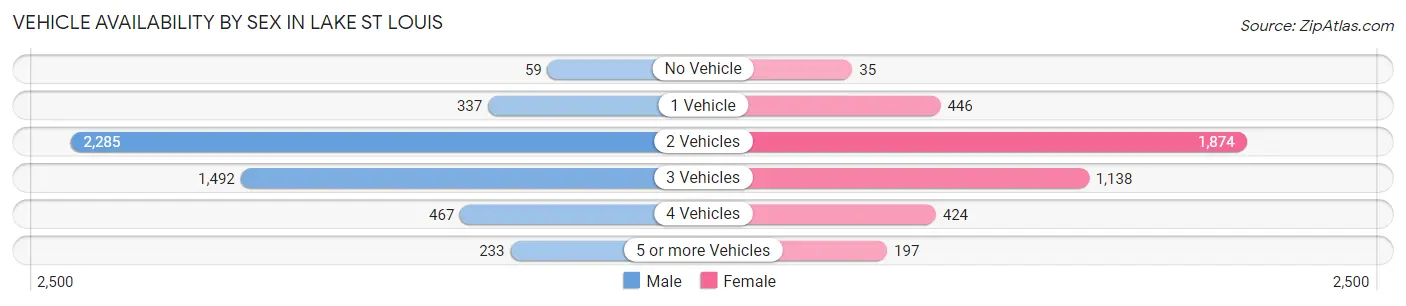
| Vehicles Available | Male | Female |
| No Vehicle | 59 (1.2%) | 35 (0.9%) |
| 1 Vehicle | 337 (6.9%) | 446 (10.8%) |
| 2 Vehicles | 2,285 (46.9%) | 1,874 (45.6%) |
| 3 Vehicles | 1,492 (30.6%) | 1,138 (27.7%) |
| 4 Vehicles | 467 (9.6%) | 424 (10.3%) |
| 5 or more Vehicles | 233 (4.8%) | 197 (4.8%) |
| Total | 4,873 (100.0%) | 4,114 (100.0%) |
Commute Time in Lake St Louis
The most frequently occuring commute durations in Lake St Louis are 15 to 19 minutes (1,311 commuters, 17.4%), 20 to 24 minutes (1,262 commuters, 16.7%), and 10 to 14 minutes (1,139 commuters, 15.1%).
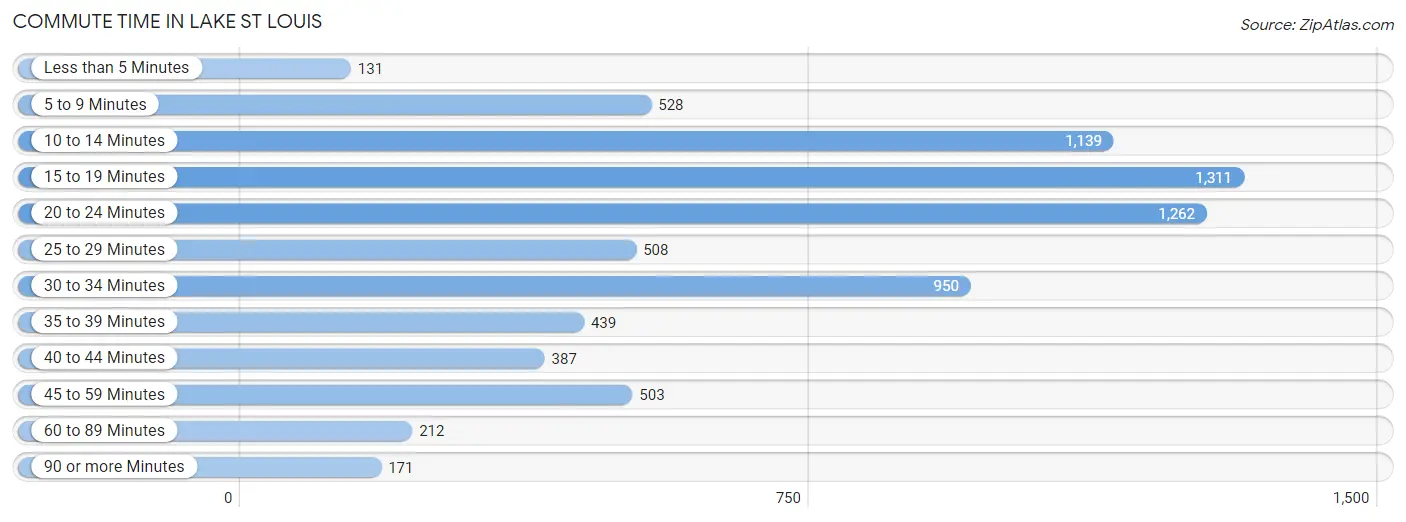
| Commute Time | # Commuters | % Commuters |
| Less than 5 Minutes | 131 | 1.7% |
| 5 to 9 Minutes | 528 | 7.0% |
| 10 to 14 Minutes | 1,139 | 15.1% |
| 15 to 19 Minutes | 1,311 | 17.4% |
| 20 to 24 Minutes | 1,262 | 16.7% |
| 25 to 29 Minutes | 508 | 6.7% |
| 30 to 34 Minutes | 950 | 12.6% |
| 35 to 39 Minutes | 439 | 5.8% |
| 40 to 44 Minutes | 387 | 5.1% |
| 45 to 59 Minutes | 503 | 6.7% |
| 60 to 89 Minutes | 212 | 2.8% |
| 90 or more Minutes | 171 | 2.3% |
Commute Time by Sex in Lake St Louis
The most common commute times in Lake St Louis are 20 to 24 minutes (719 commuters, 17.1%) for males and 15 to 19 minutes (688 commuters, 20.7%) for females.
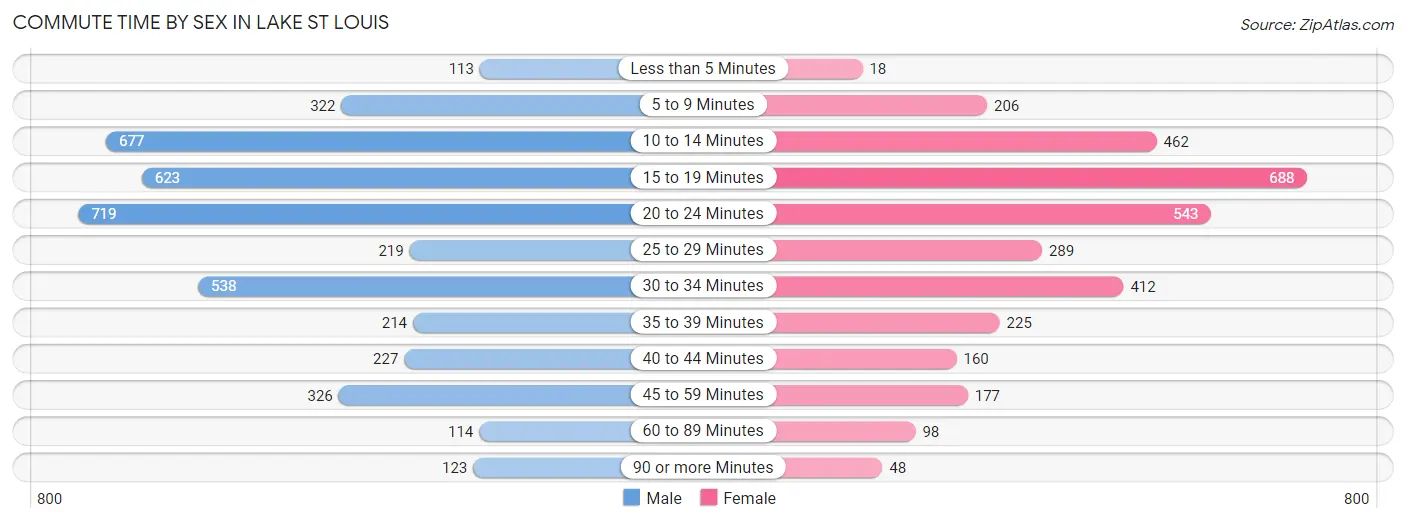
| Commute Time | Male | Female |
| Less than 5 Minutes | 113 (2.7%) | 18 (0.5%) |
| 5 to 9 Minutes | 322 (7.6%) | 206 (6.2%) |
| 10 to 14 Minutes | 677 (16.1%) | 462 (13.9%) |
| 15 to 19 Minutes | 623 (14.8%) | 688 (20.7%) |
| 20 to 24 Minutes | 719 (17.1%) | 543 (16.3%) |
| 25 to 29 Minutes | 219 (5.2%) | 289 (8.7%) |
| 30 to 34 Minutes | 538 (12.8%) | 412 (12.4%) |
| 35 to 39 Minutes | 214 (5.1%) | 225 (6.8%) |
| 40 to 44 Minutes | 227 (5.4%) | 160 (4.8%) |
| 45 to 59 Minutes | 326 (7.7%) | 177 (5.3%) |
| 60 to 89 Minutes | 114 (2.7%) | 98 (2.9%) |
| 90 or more Minutes | 123 (2.9%) | 48 (1.4%) |
Time of Departure to Work by Sex in Lake St Louis
The most frequent times of departure to work in Lake St Louis are 8:00 AM to 8:29 AM (542, 12.9%) for males and 6:30 AM to 6:59 AM (647, 19.5%) for females.
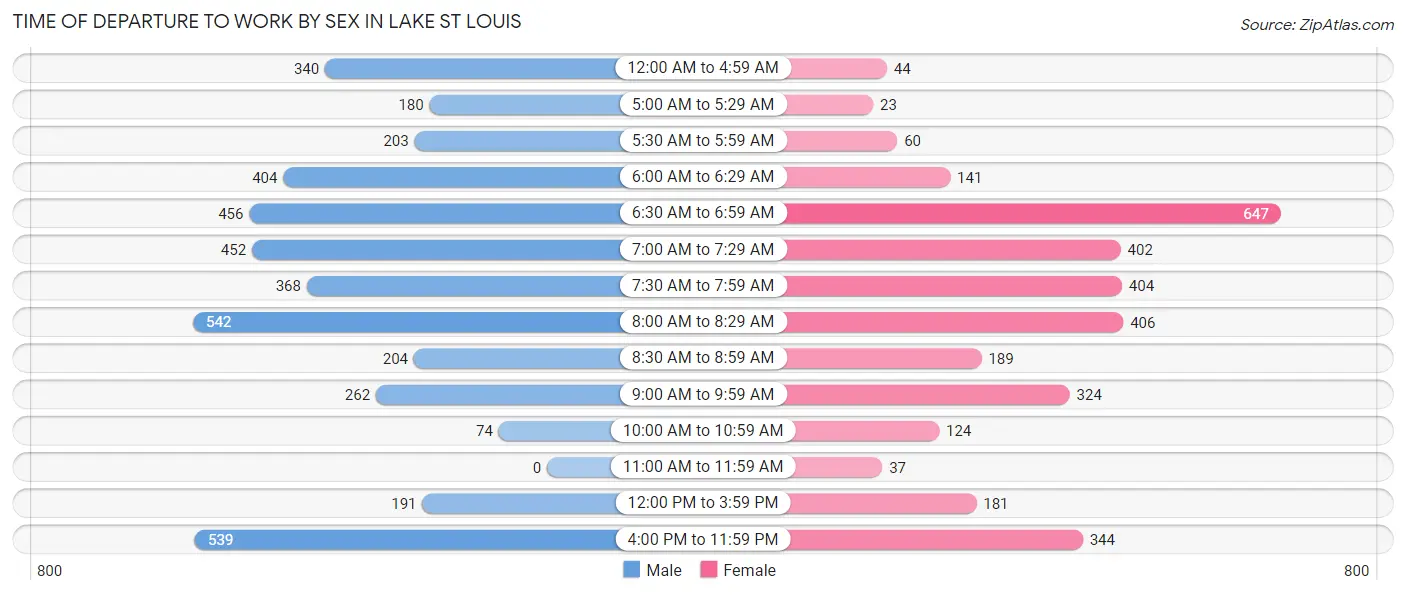
| Time of Departure | Male | Female |
| 12:00 AM to 4:59 AM | 340 (8.1%) | 44 (1.3%) |
| 5:00 AM to 5:29 AM | 180 (4.3%) | 23 (0.7%) |
| 5:30 AM to 5:59 AM | 203 (4.8%) | 60 (1.8%) |
| 6:00 AM to 6:29 AM | 404 (9.6%) | 141 (4.2%) |
| 6:30 AM to 6:59 AM | 456 (10.8%) | 647 (19.5%) |
| 7:00 AM to 7:29 AM | 452 (10.7%) | 402 (12.1%) |
| 7:30 AM to 7:59 AM | 368 (8.7%) | 404 (12.1%) |
| 8:00 AM to 8:29 AM | 542 (12.9%) | 406 (12.2%) |
| 8:30 AM to 8:59 AM | 204 (4.8%) | 189 (5.7%) |
| 9:00 AM to 9:59 AM | 262 (6.2%) | 324 (9.7%) |
| 10:00 AM to 10:59 AM | 74 (1.8%) | 124 (3.7%) |
| 11:00 AM to 11:59 AM | 0 (0.0%) | 37 (1.1%) |
| 12:00 PM to 3:59 PM | 191 (4.5%) | 181 (5.4%) |
| 4:00 PM to 11:59 PM | 539 (12.8%) | 344 (10.3%) |
| Total | 4,215 (100.0%) | 3,326 (100.0%) |
Housing Occupancy in Lake St Louis
Occupancy by Ownership in Lake St Louis
Of the total 6,897 dwellings in Lake St Louis, owner-occupied units account for 5,415 (78.5%), while renter-occupied units make up 1,482 (21.5%).
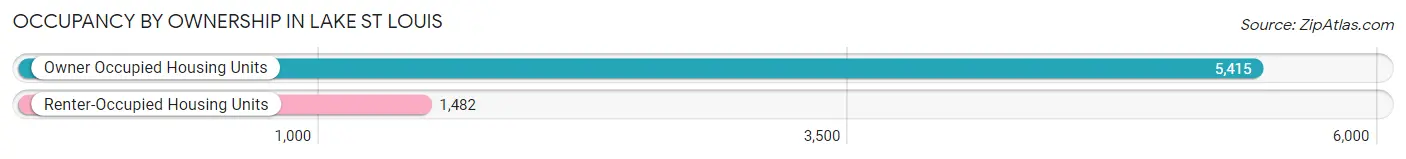
| Occupancy | # Housing Units | % Housing Units |
| Owner Occupied Housing Units | 5,415 | 78.5% |
| Renter-Occupied Housing Units | 1,482 | 21.5% |
| Total Occupied Housing Units | 6,897 | 100.0% |
Occupancy by Household Size in Lake St Louis
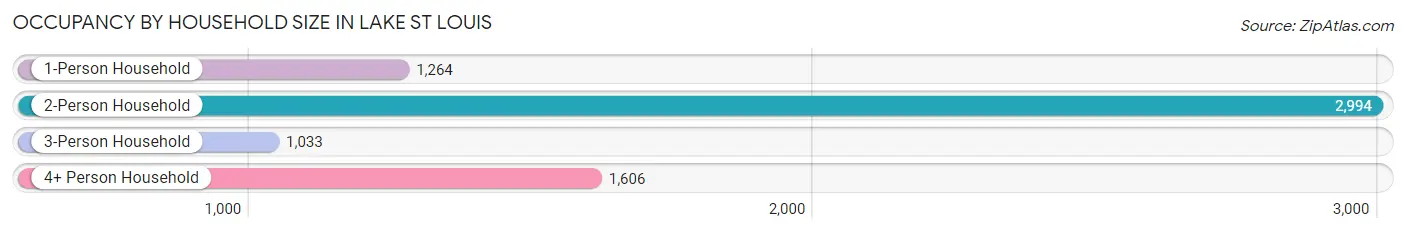
| Household Size | # Housing Units | % Housing Units |
| 1-Person Household | 1,264 | 18.3% |
| 2-Person Household | 2,994 | 43.4% |
| 3-Person Household | 1,033 | 15.0% |
| 4+ Person Household | 1,606 | 23.3% |
| Total Housing Units | 6,897 | 100.0% |
Occupancy by Ownership by Household Size in Lake St Louis
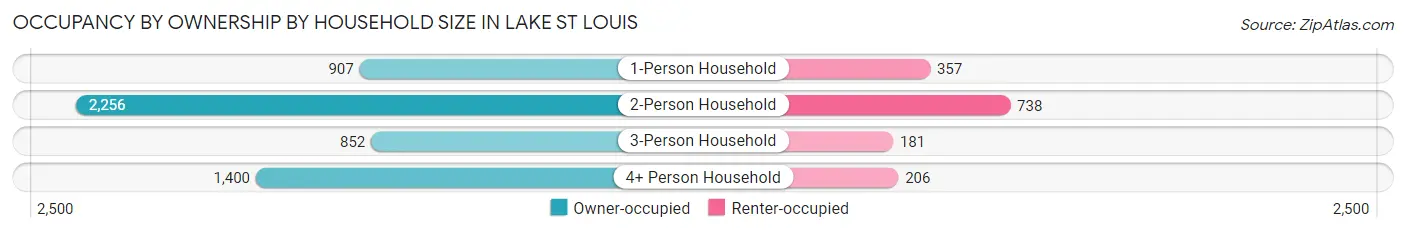
| Household Size | Owner-occupied | Renter-occupied |
| 1-Person Household | 907 (71.8%) | 357 (28.2%) |
| 2-Person Household | 2,256 (75.3%) | 738 (24.6%) |
| 3-Person Household | 852 (82.5%) | 181 (17.5%) |
| 4+ Person Household | 1,400 (87.2%) | 206 (12.8%) |
| Total Housing Units | 5,415 (78.5%) | 1,482 (21.5%) |
Occupancy by Educational Attainment in Lake St Louis
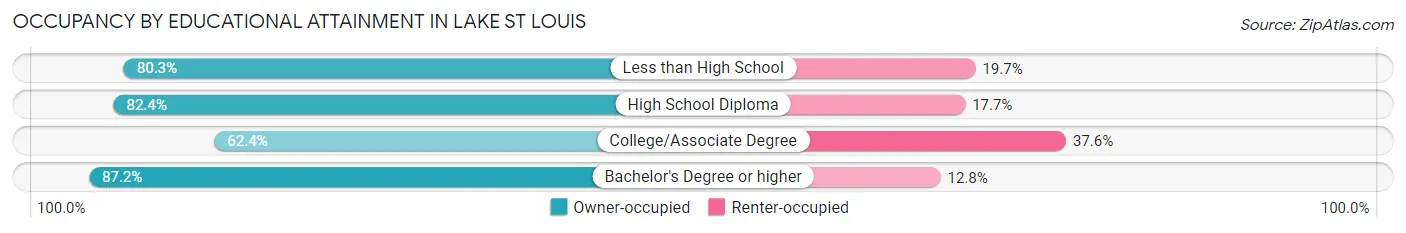
| Household Size | Owner-occupied | Renter-occupied |
| Less than High School | 208 (80.3%) | 51 (19.7%) |
| High School Diploma | 681 (82.4%) | 146 (17.6%) |
| College/Associate Degree | 1,362 (62.4%) | 822 (37.6%) |
| Bachelor's Degree or higher | 3,164 (87.2%) | 463 (12.8%) |
Occupancy by Age of Householder in Lake St Louis
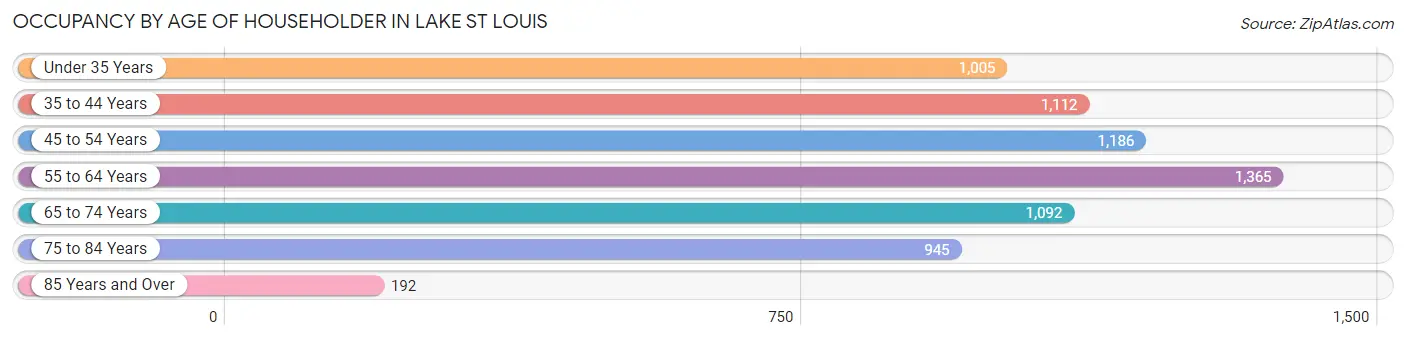
| Age Bracket | # Households | % Households |
| Under 35 Years | 1,005 | 14.6% |
| 35 to 44 Years | 1,112 | 16.1% |
| 45 to 54 Years | 1,186 | 17.2% |
| 55 to 64 Years | 1,365 | 19.8% |
| 65 to 74 Years | 1,092 | 15.8% |
| 75 to 84 Years | 945 | 13.7% |
| 85 Years and Over | 192 | 2.8% |
| Total | 6,897 | 100.0% |
Housing Finances in Lake St Louis
Median Income by Occupancy in Lake St Louis
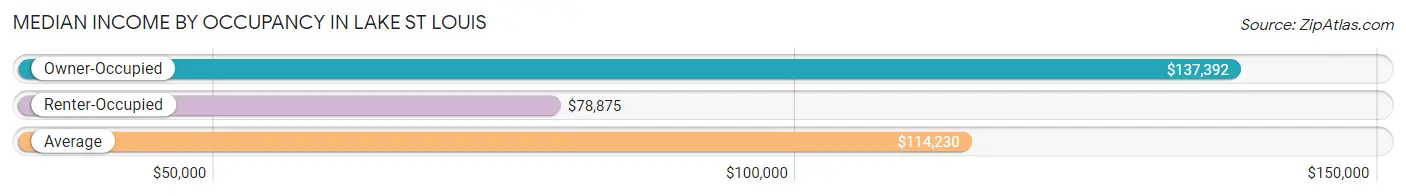
| Occupancy Type | # Households | Median Income |
| Owner-Occupied | 5,415 (78.5%) | $137,392 |
| Renter-Occupied | 1,482 (21.5%) | $78,875 |
| Average | 6,897 (100.0%) | $114,230 |
Occupancy by Householder Income Bracket in Lake St Louis
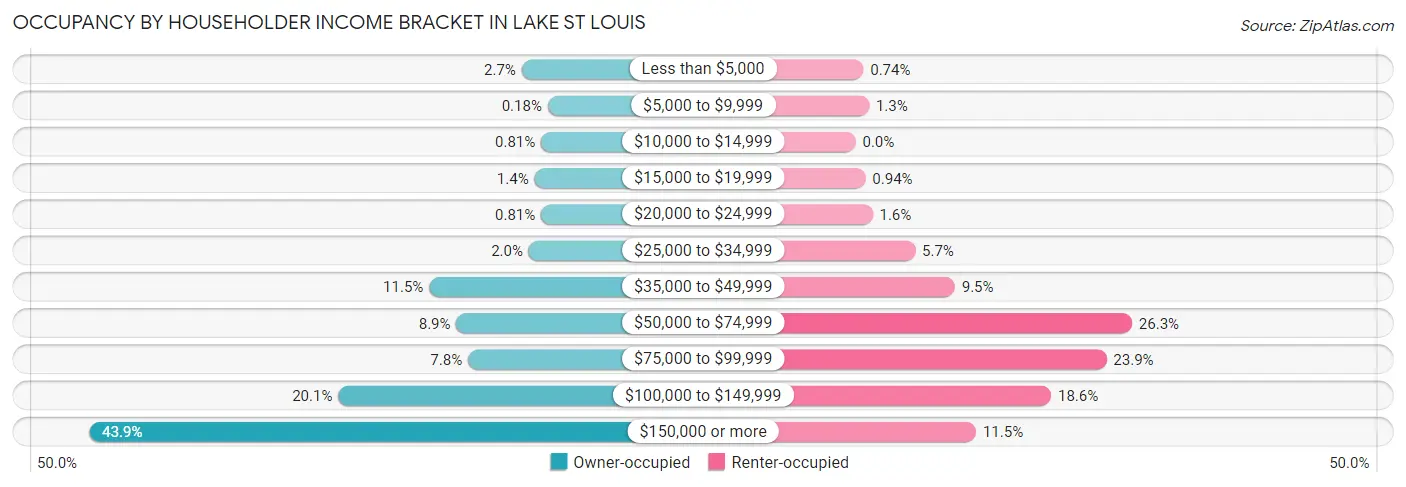
| Income Bracket | Owner-occupied | Renter-occupied |
| Less than $5,000 | 144 (2.7%) | 11 (0.7%) |
| $5,000 to $9,999 | 10 (0.2%) | 19 (1.3%) |
| $10,000 to $14,999 | 44 (0.8%) | 0 (0.0%) |
| $15,000 to $19,999 | 78 (1.4%) | 14 (0.9%) |
| $20,000 to $24,999 | 44 (0.8%) | 24 (1.6%) |
| $25,000 to $34,999 | 107 (2.0%) | 84 (5.7%) |
| $35,000 to $49,999 | 621 (11.5%) | 140 (9.5%) |
| $50,000 to $74,999 | 481 (8.9%) | 390 (26.3%) |
| $75,000 to $99,999 | 421 (7.8%) | 354 (23.9%) |
| $100,000 to $149,999 | 1,090 (20.1%) | 276 (18.6%) |
| $150,000 or more | 2,375 (43.9%) | 170 (11.5%) |
| Total | 5,415 (100.0%) | 1,482 (100.0%) |
Monthly Housing Cost Tiers in Lake St Louis
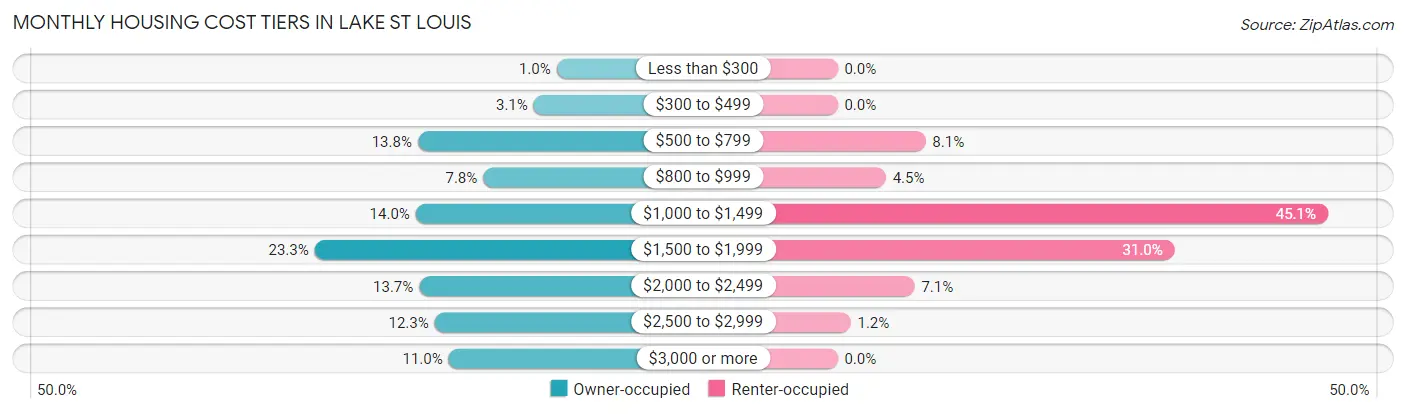
| Monthly Cost | Owner-occupied | Renter-occupied |
| Less than $300 | 56 (1.0%) | 0 (0.0%) |
| $300 to $499 | 170 (3.1%) | 0 (0.0%) |
| $500 to $799 | 748 (13.8%) | 120 (8.1%) |
| $800 to $999 | 422 (7.8%) | 66 (4.4%) |
| $1,000 to $1,499 | 758 (14.0%) | 669 (45.1%) |
| $1,500 to $1,999 | 1,262 (23.3%) | 460 (31.0%) |
| $2,000 to $2,499 | 741 (13.7%) | 105 (7.1%) |
| $2,500 to $2,999 | 664 (12.3%) | 18 (1.2%) |
| $3,000 or more | 594 (11.0%) | 0 (0.0%) |
| Total | 5,415 (100.0%) | 1,482 (100.0%) |
Physical Housing Characteristics in Lake St Louis
Housing Structures in Lake St Louis
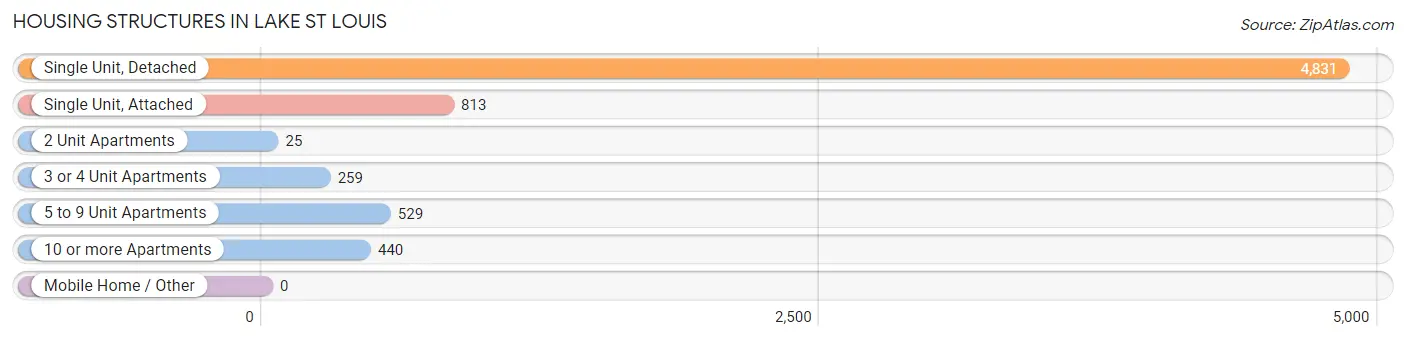
| Structure Type | # Housing Units | % Housing Units |
| Single Unit, Detached | 4,831 | 70.0% |
| Single Unit, Attached | 813 | 11.8% |
| 2 Unit Apartments | 25 | 0.4% |
| 3 or 4 Unit Apartments | 259 | 3.8% |
| 5 to 9 Unit Apartments | 529 | 7.7% |
| 10 or more Apartments | 440 | 6.4% |
| Mobile Home / Other | 0 | 0.0% |
| Total | 6,897 | 100.0% |
Housing Structures by Occupancy in Lake St Louis
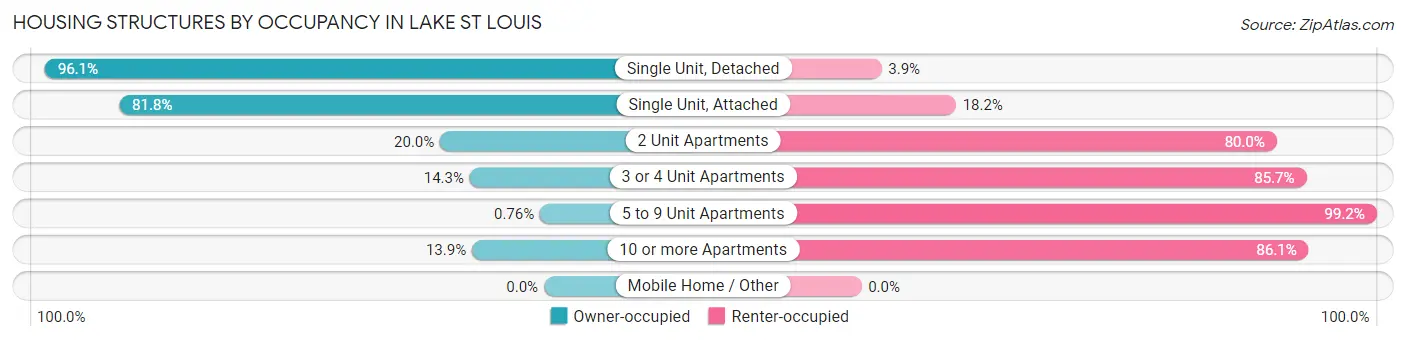
| Structure Type | Owner-occupied | Renter-occupied |
| Single Unit, Detached | 4,643 (96.1%) | 188 (3.9%) |
| Single Unit, Attached | 665 (81.8%) | 148 (18.2%) |
| 2 Unit Apartments | 5 (20.0%) | 20 (80.0%) |
| 3 or 4 Unit Apartments | 37 (14.3%) | 222 (85.7%) |
| 5 to 9 Unit Apartments | 4 (0.8%) | 525 (99.2%) |
| 10 or more Apartments | 61 (13.9%) | 379 (86.1%) |
| Mobile Home / Other | 0 (0.0%) | 0 (0.0%) |
| Total | 5,415 (78.5%) | 1,482 (21.5%) |
Housing Structures by Number of Rooms in Lake St Louis
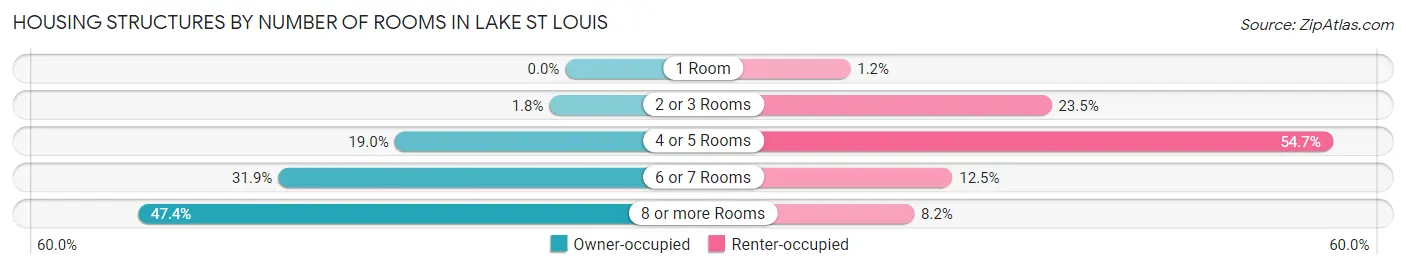
| Number of Rooms | Owner-occupied | Renter-occupied |
| 1 Room | 0 (0.0%) | 17 (1.1%) |
| 2 or 3 Rooms | 96 (1.8%) | 348 (23.5%) |
| 4 or 5 Rooms | 1,026 (19.0%) | 810 (54.7%) |
| 6 or 7 Rooms | 1,725 (31.9%) | 185 (12.5%) |
| 8 or more Rooms | 2,568 (47.4%) | 122 (8.2%) |
| Total | 5,415 (100.0%) | 1,482 (100.0%) |
Housing Structure by Heating Type in Lake St Louis
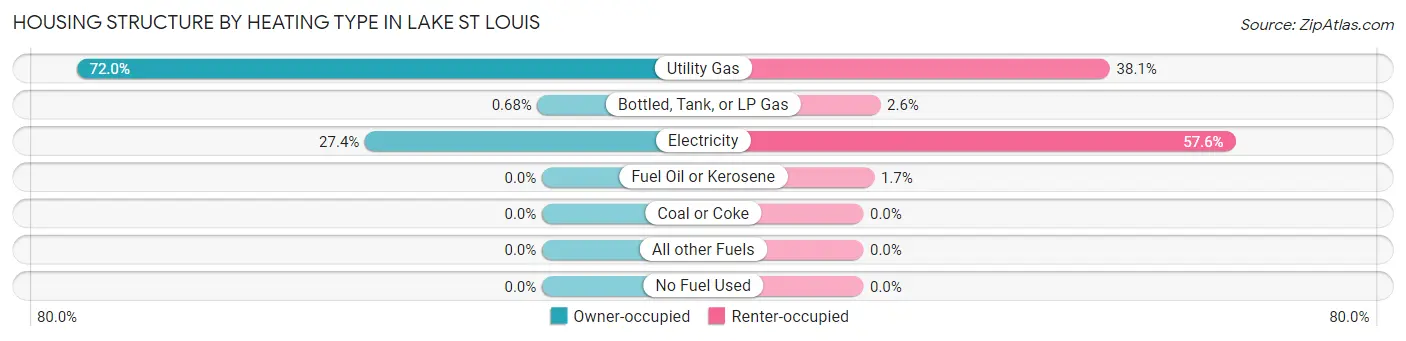
| Heating Type | Owner-occupied | Renter-occupied |
| Utility Gas | 3,897 (72.0%) | 565 (38.1%) |
| Bottled, Tank, or LP Gas | 37 (0.7%) | 39 (2.6%) |
| Electricity | 1,481 (27.4%) | 853 (57.6%) |
| Fuel Oil or Kerosene | 0 (0.0%) | 25 (1.7%) |
| Coal or Coke | 0 (0.0%) | 0 (0.0%) |
| All other Fuels | 0 (0.0%) | 0 (0.0%) |
| No Fuel Used | 0 (0.0%) | 0 (0.0%) |
| Total | 5,415 (100.0%) | 1,482 (100.0%) |
Household Vehicle Usage in Lake St Louis
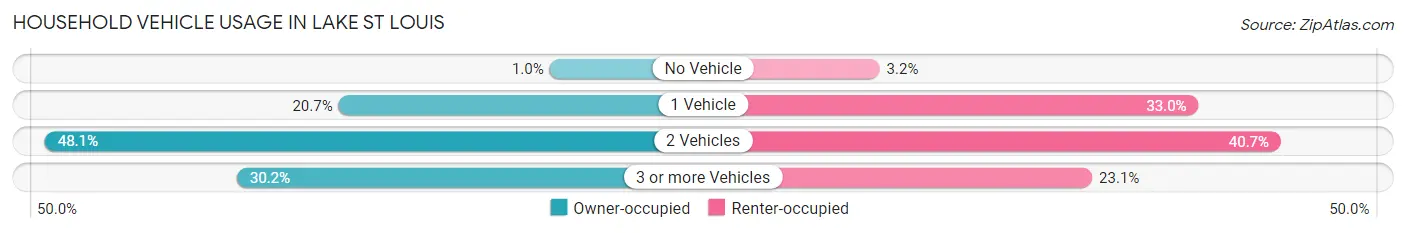
| Vehicles per Household | Owner-occupied | Renter-occupied |
| No Vehicle | 54 (1.0%) | 48 (3.2%) |
| 1 Vehicle | 1,121 (20.7%) | 489 (33.0%) |
| 2 Vehicles | 2,605 (48.1%) | 603 (40.7%) |
| 3 or more Vehicles | 1,635 (30.2%) | 342 (23.1%) |
| Total | 5,415 (100.0%) | 1,482 (100.0%) |
Real Estate & Mortgages in Lake St Louis
Real Estate and Mortgage Overview in Lake St Louis
| Characteristic | Without Mortgage | With Mortgage |
| Housing Units | 1,456 | 3,959 |
| Median Property Value | $349,300 | $361,400 |
| Median Household Income | $88,684 | $1,958 |
| Monthly Housing Costs | $728 | $594 |
| Real Estate Taxes | $3,745 | $16 |
Property Value by Mortgage Status in Lake St Louis
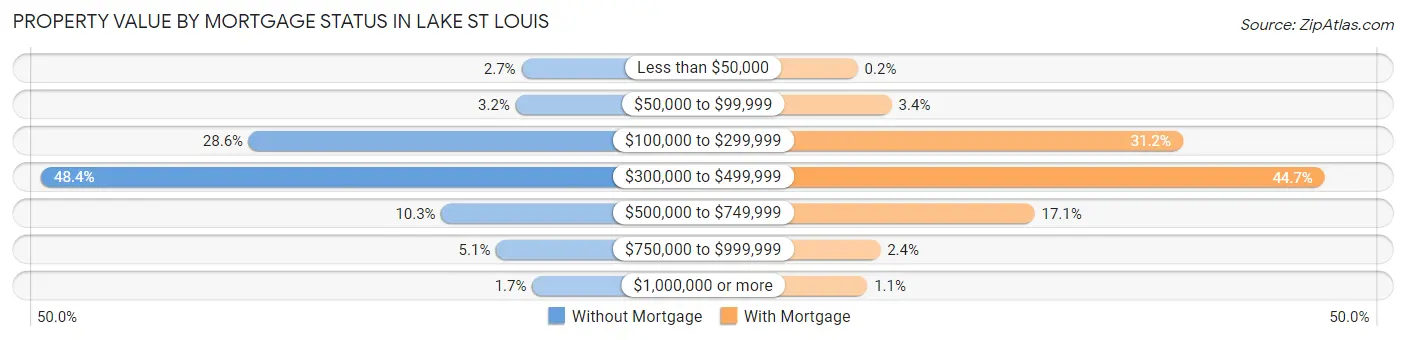
| Property Value | Without Mortgage | With Mortgage |
| Less than $50,000 | 39 (2.7%) | 8 (0.2%) |
| $50,000 to $99,999 | 47 (3.2%) | 136 (3.4%) |
| $100,000 to $299,999 | 417 (28.6%) | 1,234 (31.2%) |
| $300,000 to $499,999 | 705 (48.4%) | 1,769 (44.7%) |
| $500,000 to $749,999 | 150 (10.3%) | 675 (17.1%) |
| $750,000 to $999,999 | 74 (5.1%) | 93 (2.4%) |
| $1,000,000 or more | 24 (1.7%) | 44 (1.1%) |
| Total | 1,456 (100.0%) | 3,959 (100.0%) |
Household Income by Mortgage Status in Lake St Louis
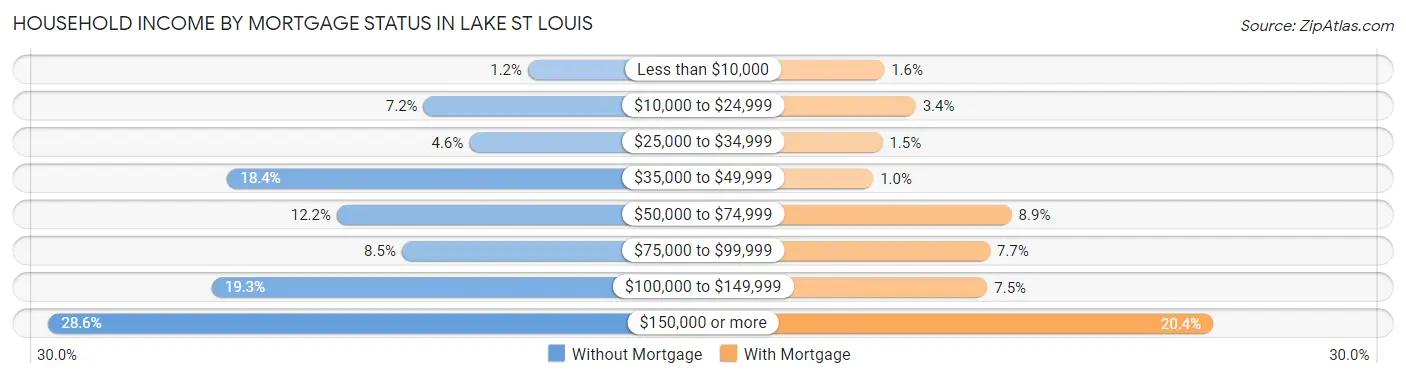
| Household Income | Without Mortgage | With Mortgage |
| Less than $10,000 | 18 (1.2%) | 65 (1.6%) |
| $10,000 to $24,999 | 105 (7.2%) | 136 (3.4%) |
| $25,000 to $34,999 | 67 (4.6%) | 61 (1.5%) |
| $35,000 to $49,999 | 268 (18.4%) | 40 (1.0%) |
| $50,000 to $74,999 | 177 (12.2%) | 353 (8.9%) |
| $75,000 to $99,999 | 123 (8.5%) | 304 (7.7%) |
| $100,000 to $149,999 | 281 (19.3%) | 298 (7.5%) |
| $150,000 or more | 417 (28.6%) | 809 (20.4%) |
| Total | 1,456 (100.0%) | 3,959 (100.0%) |
Property Value to Household Income Ratio in Lake St Louis
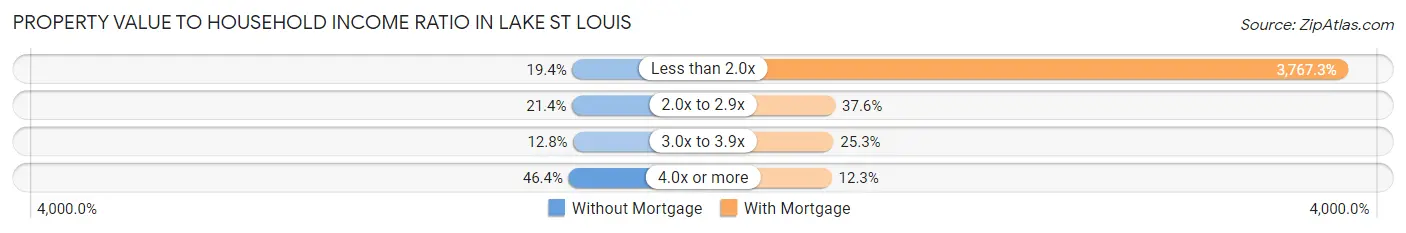
| Value-to-Income Ratio | Without Mortgage | With Mortgage |
| Less than 2.0x | 282 (19.4%) | 149,147 (3,767.3%) |
| 2.0x to 2.9x | 312 (21.4%) | 1,487 (37.6%) |
| 3.0x to 3.9x | 186 (12.8%) | 1,003 (25.3%) |
| 4.0x or more | 676 (46.4%) | 488 (12.3%) |
| Total | 1,456 (100.0%) | 3,959 (100.0%) |
Real Estate Taxes by Mortgage Status in Lake St Louis
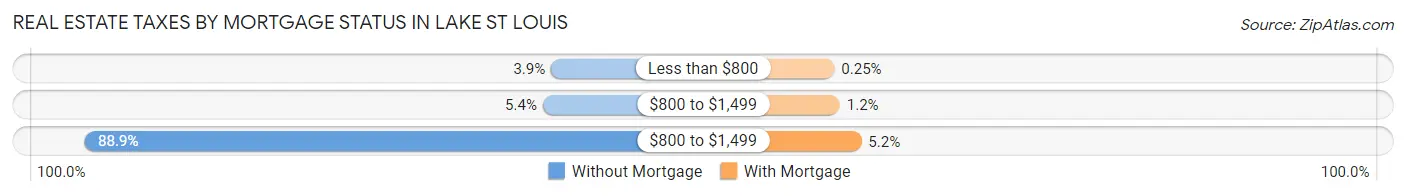
| Property Taxes | Without Mortgage | With Mortgage |
| Less than $800 | 56 (3.8%) | 10 (0.3%) |
| $800 to $1,499 | 78 (5.4%) | 49 (1.2%) |
| $800 to $1,499 | 1,295 (88.9%) | 205 (5.2%) |
| Total | 1,456 (100.0%) | 3,959 (100.0%) |
Health & Disability in Lake St Louis
Health Insurance Coverage by Age in Lake St Louis
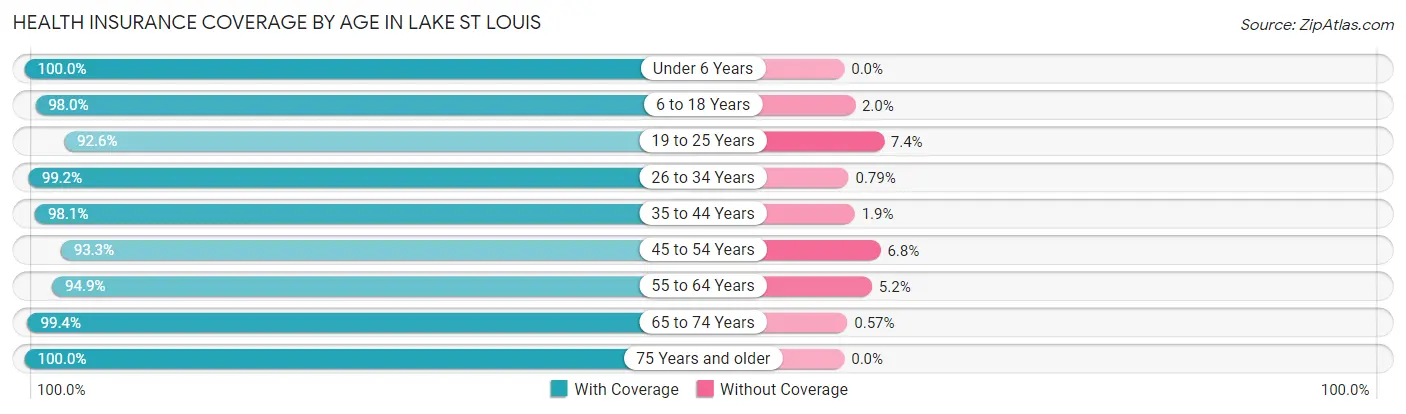
| Age Bracket | With Coverage | Without Coverage |
| Under 6 Years | 808 (100.0%) | 0 (0.0%) |
| 6 to 18 Years | 2,762 (98.0%) | 56 (2.0%) |
| 19 to 25 Years | 1,459 (92.6%) | 116 (7.4%) |
| 26 to 34 Years | 1,390 (99.2%) | 11 (0.8%) |
| 35 to 44 Years | 2,220 (98.1%) | 44 (1.9%) |
| 45 to 54 Years | 2,126 (93.2%) | 154 (6.8%) |
| 55 to 64 Years | 2,337 (94.9%) | 127 (5.1%) |
| 65 to 74 Years | 1,736 (99.4%) | 10 (0.6%) |
| 75 Years and older | 1,732 (100.0%) | 0 (0.0%) |
| Total | 16,570 (97.0%) | 518 (3.0%) |
Health Insurance Coverage by Citizenship Status in Lake St Louis
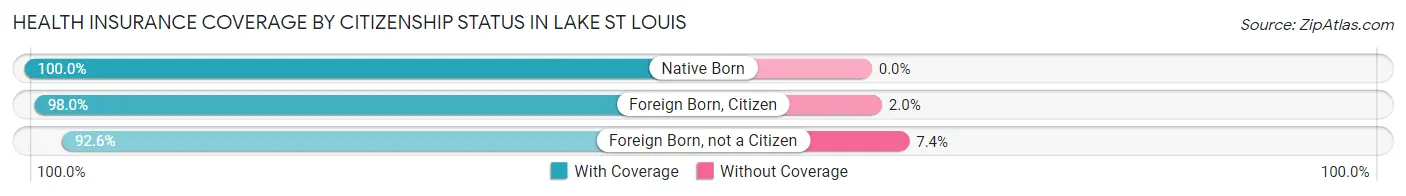
| Citizenship Status | With Coverage | Without Coverage |
| Native Born | 808 (100.0%) | 0 (0.0%) |
| Foreign Born, Citizen | 2,762 (98.0%) | 56 (2.0%) |
| Foreign Born, not a Citizen | 1,459 (92.6%) | 116 (7.4%) |
Health Insurance Coverage by Household Income in Lake St Louis
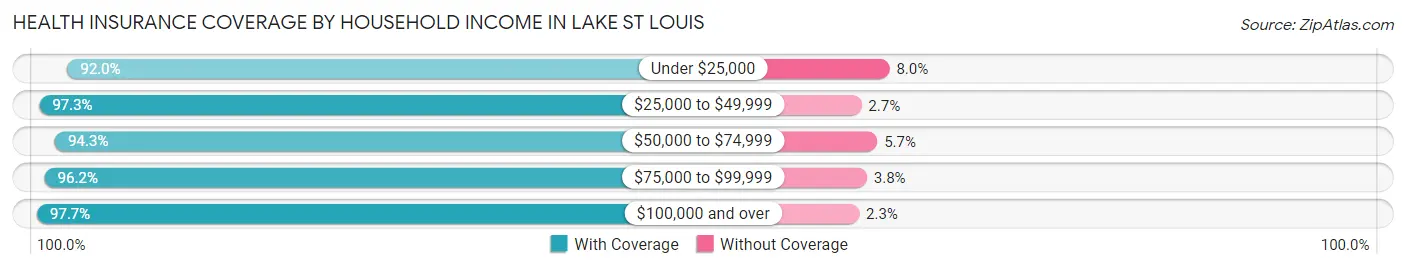
| Household Income | With Coverage | Without Coverage |
| Under $25,000 | 506 (92.0%) | 44 (8.0%) |
| $25,000 to $49,999 | 1,351 (97.3%) | 38 (2.7%) |
| $50,000 to $74,999 | 1,769 (94.3%) | 107 (5.7%) |
| $75,000 to $99,999 | 1,586 (96.2%) | 62 (3.8%) |
| $100,000 and over | 11,353 (97.7%) | 267 (2.3%) |
Public vs Private Health Insurance Coverage by Age in Lake St Louis
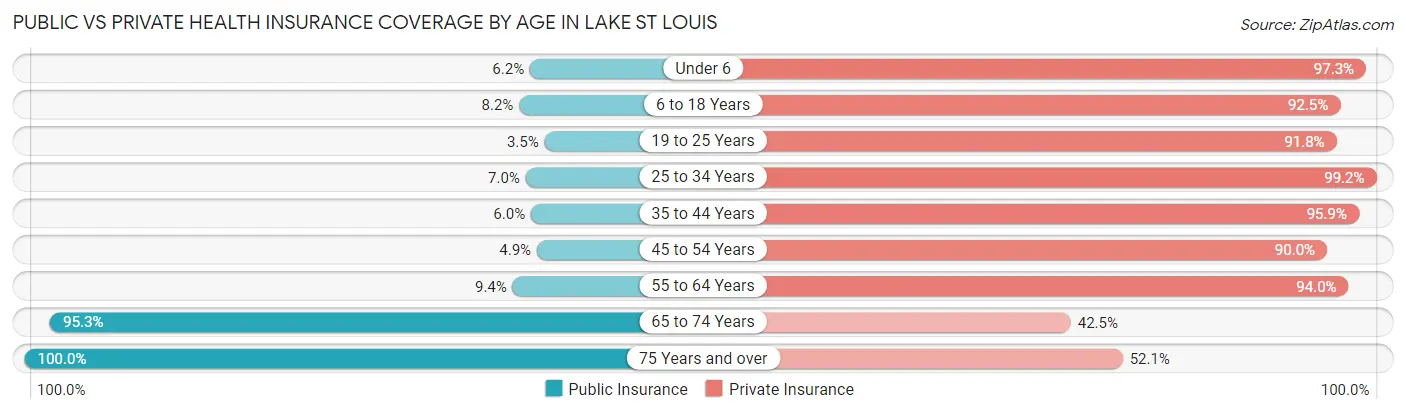
| Age Bracket | Public Insurance | Private Insurance |
| Under 6 | 50 (6.2%) | 786 (97.3%) |
| 6 to 18 Years | 231 (8.2%) | 2,606 (92.5%) |
| 19 to 25 Years | 55 (3.5%) | 1,446 (91.8%) |
| 25 to 34 Years | 98 (7.0%) | 1,390 (99.2%) |
| 35 to 44 Years | 136 (6.0%) | 2,172 (95.9%) |
| 45 to 54 Years | 112 (4.9%) | 2,053 (90.0%) |
| 55 to 64 Years | 232 (9.4%) | 2,317 (94.0%) |
| 65 to 74 Years | 1,663 (95.3%) | 742 (42.5%) |
| 75 Years and over | 1,732 (100.0%) | 903 (52.1%) |
| Total | 4,309 (25.2%) | 14,415 (84.4%) |
Disability Status by Sex by Age in Lake St Louis
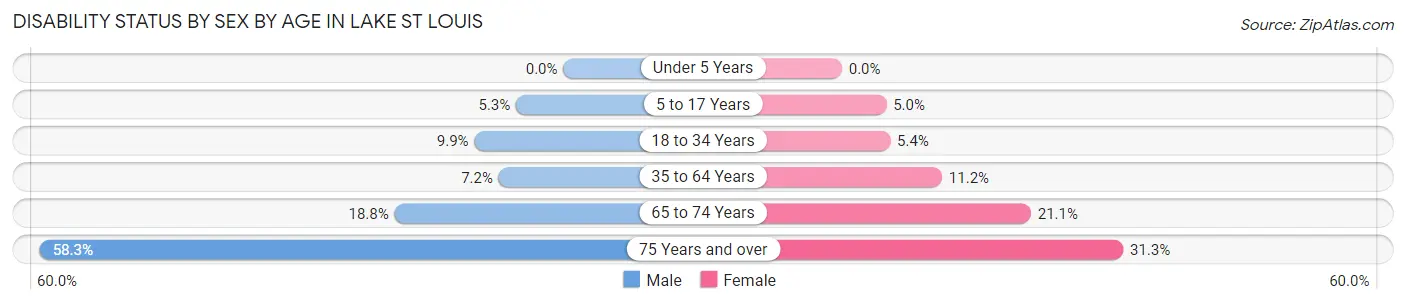
| Age Bracket | Male | Female |
| Under 5 Years | 0 (0.0%) | 0 (0.0%) |
| 5 to 17 Years | 75 (5.3%) | 71 (5.0%) |
| 18 to 34 Years | 177 (9.9%) | 77 (5.4%) |
| 35 to 64 Years | 248 (7.2%) | 397 (11.2%) |
| 65 to 74 Years | 138 (18.8%) | 213 (21.0%) |
| 75 Years and over | 537 (58.3%) | 254 (31.3%) |
Disability Class by Sex by Age in Lake St Louis
Disability Class: Hearing Difficulty
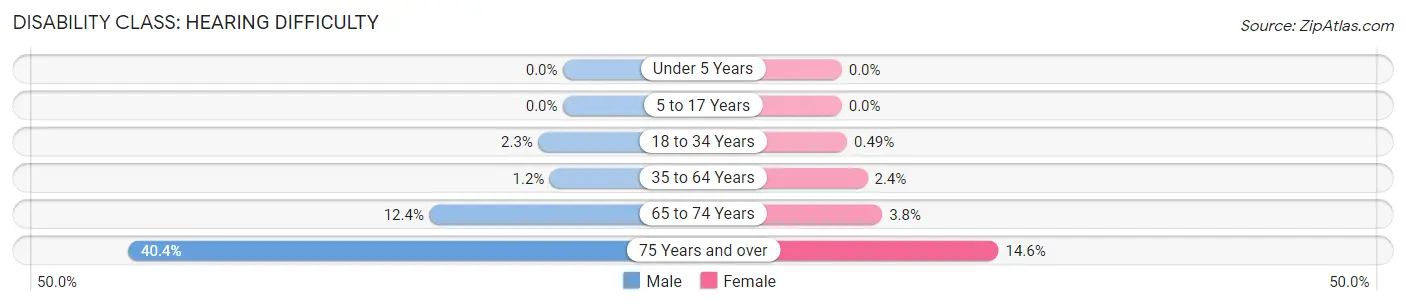
| Age Bracket | Male | Female |
| Under 5 Years | 0 (0.0%) | 0 (0.0%) |
| 5 to 17 Years | 0 (0.0%) | 0 (0.0%) |
| 18 to 34 Years | 41 (2.3%) | 7 (0.5%) |
| 35 to 64 Years | 42 (1.2%) | 85 (2.4%) |
| 65 to 74 Years | 91 (12.4%) | 38 (3.7%) |
| 75 Years and over | 372 (40.4%) | 118 (14.5%) |
Disability Class: Vision Difficulty
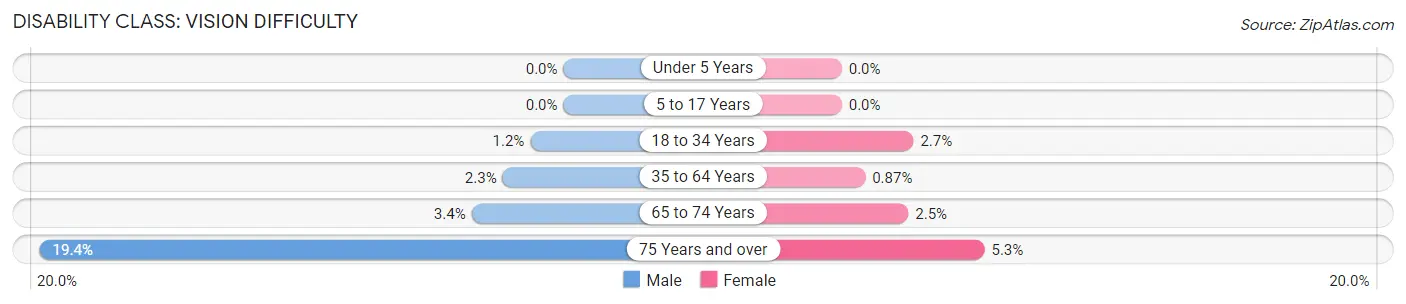
| Age Bracket | Male | Female |
| Under 5 Years | 0 (0.0%) | 0 (0.0%) |
| 5 to 17 Years | 0 (0.0%) | 0 (0.0%) |
| 18 to 34 Years | 22 (1.2%) | 38 (2.7%) |
| 35 to 64 Years | 78 (2.3%) | 31 (0.9%) |
| 65 to 74 Years | 25 (3.4%) | 25 (2.5%) |
| 75 Years and over | 179 (19.4%) | 43 (5.3%) |
Disability Class: Cognitive Difficulty
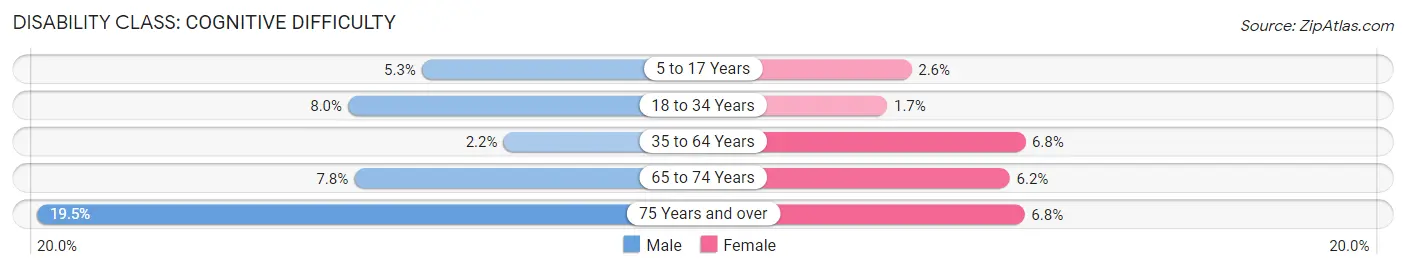
| Age Bracket | Male | Female |
| 5 to 17 Years | 75 (5.3%) | 37 (2.6%) |
| 18 to 34 Years | 143 (8.0%) | 24 (1.7%) |
| 35 to 64 Years | 77 (2.2%) | 242 (6.8%) |
| 65 to 74 Years | 57 (7.8%) | 63 (6.2%) |
| 75 Years and over | 180 (19.5%) | 55 (6.8%) |
Disability Class: Ambulatory Difficulty
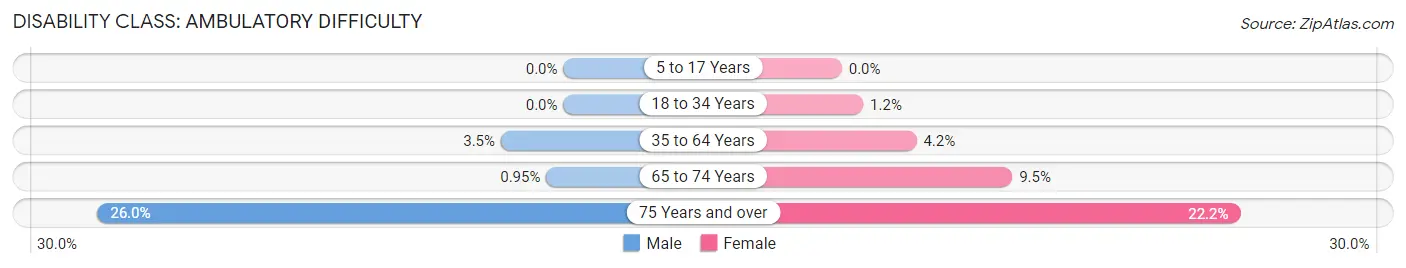
| Age Bracket | Male | Female |
| 5 to 17 Years | 0 (0.0%) | 0 (0.0%) |
| 18 to 34 Years | 0 (0.0%) | 17 (1.2%) |
| 35 to 64 Years | 120 (3.5%) | 148 (4.2%) |
| 65 to 74 Years | 7 (0.9%) | 96 (9.5%) |
| 75 Years and over | 239 (26.0%) | 180 (22.2%) |
Disability Class: Self-Care Difficulty
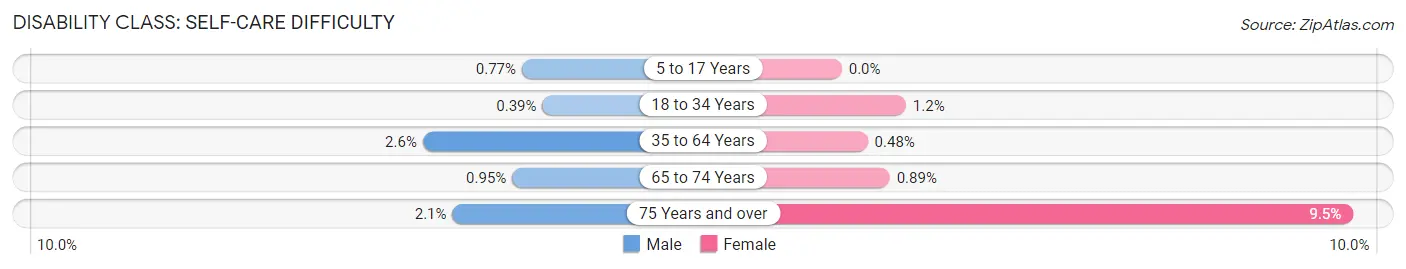
| Age Bracket | Male | Female |
| 5 to 17 Years | 11 (0.8%) | 0 (0.0%) |
| 18 to 34 Years | 7 (0.4%) | 17 (1.2%) |
| 35 to 64 Years | 90 (2.6%) | 17 (0.5%) |
| 65 to 74 Years | 7 (0.9%) | 9 (0.9%) |
| 75 Years and over | 19 (2.1%) | 77 (9.5%) |
Technology Access in Lake St Louis
Computing Device Access in Lake St Louis
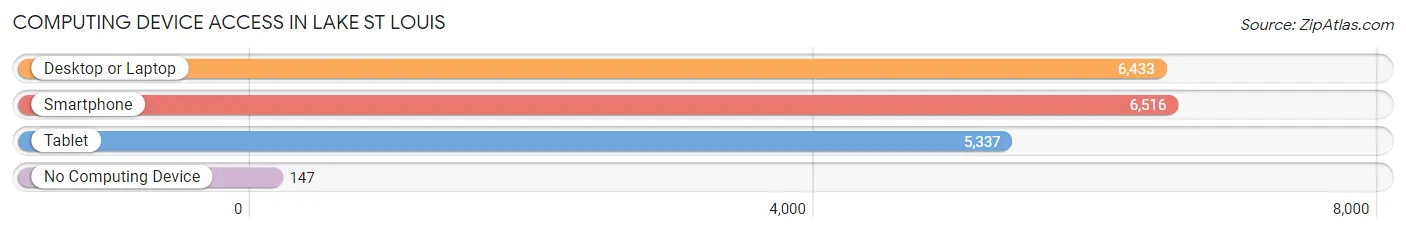
| Device Type | # Households | % Households |
| Desktop or Laptop | 6,433 | 93.3% |
| Smartphone | 6,516 | 94.5% |
| Tablet | 5,337 | 77.4% |
| No Computing Device | 147 | 2.1% |
| Total | 6,897 | 100.0% |
Internet Access in Lake St Louis
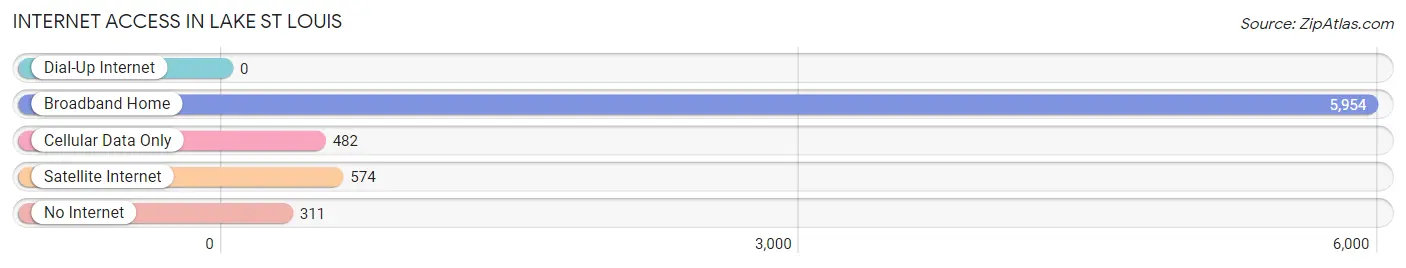
| Internet Type | # Households | % Households |
| Dial-Up Internet | 0 | 0.0% |
| Broadband Home | 5,954 | 86.3% |
| Cellular Data Only | 482 | 7.0% |
| Satellite Internet | 574 | 8.3% |
| No Internet | 311 | 4.5% |
| Total | 6,897 | 100.0% |
Lake St Louis Summary
Lake St. Louis is a city located in St. Charles County, Missouri, United States. It is a suburb of St. Louis and is part of the St. Louis Metropolitan Statistical Area. The population was 14,545 at the 2010 census.
History
The area that is now Lake St. Louis was first settled in the early 1800s by French-Canadian fur traders. The area was known as "Laclede's Landing" after Pierre Laclede, the founder of St. Louis. In the late 1800s, the area was developed as a resort community, with the first hotel opening in 1891. The area was incorporated as a village in 1967 and as a city in 1979.
Geography
Lake St. Louis is located in western St. Charles County at 38°45'25" North, 90°41'17" West (38.756845, -90.688045). It is bordered to the north by the city of O'Fallon, to the east by the city of Wentzville, to the south by the city of Dardenne Prairie, and to the west by the city of St. Peters.
The city is located on the shores of Lake St. Louis, a man-made lake created in the 1960s. The lake is fed by the Dardenne Creek and is a popular recreational spot for fishing, boating, and swimming.
Economy
The economy of Lake St. Louis is largely based on retail and services. The city is home to several large shopping centers, including the Lake St. Louis Towne Center, which features a variety of stores and restaurants. The city is also home to several corporate offices, including those of Express Scripts, Edward Jones, and Boeing.
Demographics
As of the 2010 census, there were 14,545 people, 5,845 households, and 4,541 families residing in the city. The population density was 1,845.3 people per square mile (715.2/km2). There were 6,093 housing units at an average density of 776.3 per square mile (300.2/km2). The racial makeup of the city was 92.2% White, 2.7% African American, 0.2% Native American, 2.3% Asian, 0.1% Pacific Islander, 0.9% from other races, and 1.6% from two or more races. Hispanic or Latino of any race were 3.2% of the population.
There were 5,845 households, out of which 33.2% had children under the age of 18 living with them, 65.2% were married couples living together, 6.7% had a female householder with no husband present, and 25.3% were non-families. 21.2% of all households were made up of individuals, and 8.2% had someone living alone who was 65 years of age or older. The average household size was 2.50 and the average family size was 2.93.
In the city, the population was spread out, with 24.2% under the age of 18, 6.2% from 18 to 24, 28.2% from 25 to 44, 28.2% from 45 to 64, and 13.2% who were 65 years of age or older. The median age was 40 years. For every 100 females, there were 95.2 males. For every 100 females age 18 and over, there were 92.2 males.
The median income for a household in the city was $76,945, and the median income for a family was $86,945. Males had a median income of $60,945 versus $41,945 for females. The per capita income for the city was $35,945. About 2.2% of families and 3.2% of the population were below the poverty line, including 4.2% of those under age 18 and 2.2% of those age 65 or over.
Common Questions
What is Per Capita Income in Lake St Louis?
Per Capita income in Lake St Louis is $57,945.
What is the Median Family Income in Lake St Louis?
Median Family Income in Lake St Louis is $139,310.
What is the Median Household income in Lake St Louis?
Median Household Income in Lake St Louis is $114,230.
What is Income or Wage Gap in Lake St Louis?
Income or Wage Gap in Lake St Louis is 31.5%.
Women in Lake St Louis earn 68.5 cents for every dollar earned by a man.
What is Inequality or Gini Index in Lake St Louis?
Inequality or Gini Index in Lake St Louis is 0.41.
What is the Total Population of Lake St Louis?
Total Population of Lake St Louis is 17,088.
What is the Total Male Population of Lake St Louis?
Total Male Population of Lake St Louis is 8,591.
What is the Total Female Population of Lake St Louis?
Total Female Population of Lake St Louis is 8,497.
What is the Ratio of Males per 100 Females in Lake St Louis?
There are 101.11 Males per 100 Females in Lake St Louis.
What is the Ratio of Females per 100 Males in Lake St Louis?
There are 98.91 Females per 100 Males in Lake St Louis.
What is the Median Population Age in Lake St Louis?
Median Population Age in Lake St Louis is 43.5 Years.
What is the Average Family Size in Lake St Louis
Average Family Size in Lake St Louis is 2.8 People.
What is the Average Household Size in Lake St Louis
Average Household Size in Lake St Louis is 2.5 People.
How Large is the Labor Force in Lake St Louis?
There are 9,481 People in the Labor Forcein in Lake St Louis.
What is the Percentage of People in the Labor Force in Lake St Louis?
66.0% of People are in the Labor Force in Lake St Louis.
What is the Unemployment Rate in Lake St Louis?
Unemployment Rate in Lake St Louis is 3.8%.