Federal Dam, MN Map & Demographics
Federal Dam Map
Federal Dam Overview
$24,278
PER CAPITA INCOME
$56,607
AVG FAMILY INCOME
$52,083
AVG HOUSEHOLD INCOME
20.3%
WAGE / INCOME GAP [ % ]
79.7¢/ $1
WAGE / INCOME GAP [ $ ]
0.42
INEQUALITY / GINI INDEX
158
TOTAL POPULATION
75
MALE POPULATION
83
FEMALE POPULATION
90.36
MALES / 100 FEMALES
110.67
FEMALES / 100 MALES
36.3
MEDIAN AGE
4.2
AVG FAMILY SIZE
2.9
AVG HOUSEHOLD SIZE
59
LABOR FORCE [ PEOPLE ]
54.1%
PERCENT IN LABOR FORCE
6.8%
UNEMPLOYMENT RATE
Federal Dam Zip Codes
Federal Dam Area Codes
Income in Federal Dam
Income Overview in Federal Dam
Per Capita Income in Federal Dam is $24,278, while median incomes of families and households are $56,607 and $52,083 respectively.
| Characteristic | Number | Measure |
| Per Capita Income | 158 | $24,278 |
| Median Family Income | 31 | $56,607 |
| Mean Family Income | 31 | $70,258 |
| Median Household Income | 54 | $52,083 |
| Mean Household Income | 54 | $65,220 |
| Income Deficit | 31 | $0 |
| Wage / Income Gap (%) | 158 | 20.28% |
| Wage / Income Gap ($) | 158 | 79.72¢ per $1 |
| Gini / Inequality Index | 158 | 0.42 |
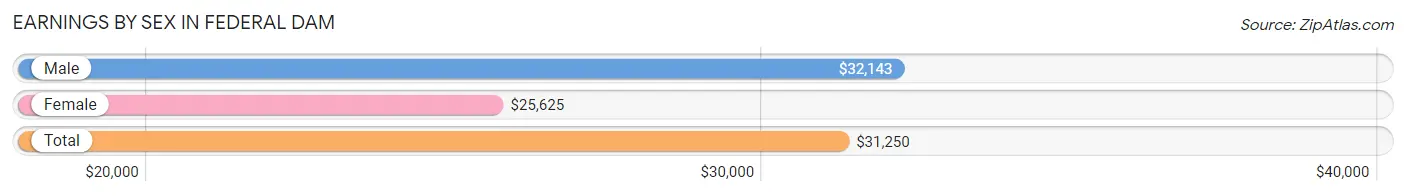
Earnings by Sex in Federal Dam
Average Earnings in Federal Dam are $31,250, $32,143 for men and $25,625 for women, a difference of 20.3%.
| Sex | Number | Average Earnings |
| Male | 30 (49.2%) | $32,143 |
| Female | 31 (50.8%) | $25,625 |
| Total | 61 (100.0%) | $31,250 |
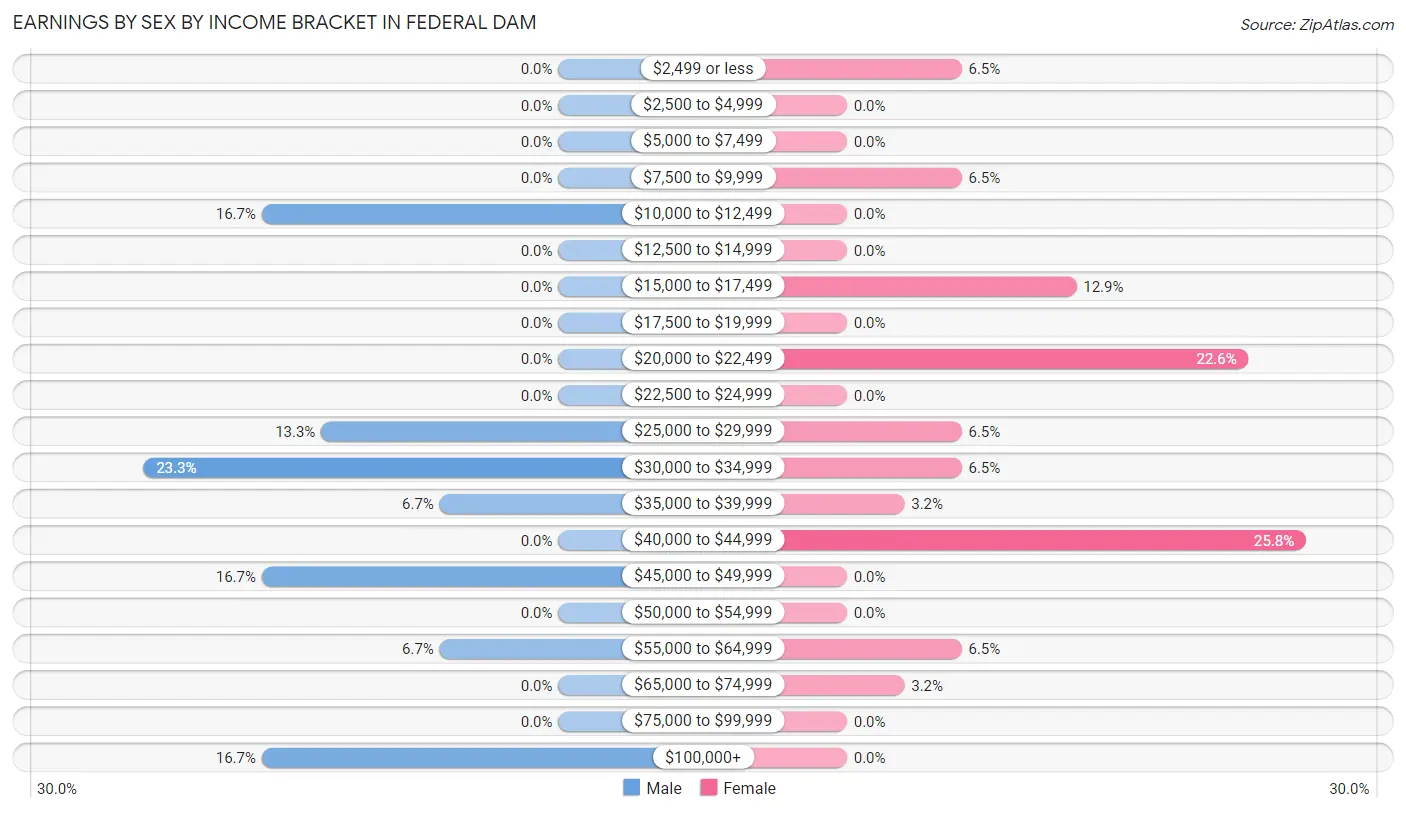
Earnings by Sex by Income Bracket in Federal Dam
The most common earnings brackets in Federal Dam are $30,000 to $34,999 for men (7 | 23.3%) and $40,000 to $44,999 for women (8 | 25.8%).
| Income | Male | Female |
| $2,499 or less | 0 (0.0%) | 2 (6.5%) |
| $2,500 to $4,999 | 0 (0.0%) | 0 (0.0%) |
| $5,000 to $7,499 | 0 (0.0%) | 0 (0.0%) |
| $7,500 to $9,999 | 0 (0.0%) | 2 (6.5%) |
| $10,000 to $12,499 | 5 (16.7%) | 0 (0.0%) |
| $12,500 to $14,999 | 0 (0.0%) | 0 (0.0%) |
| $15,000 to $17,499 | 0 (0.0%) | 4 (12.9%) |
| $17,500 to $19,999 | 0 (0.0%) | 0 (0.0%) |
| $20,000 to $22,499 | 0 (0.0%) | 7 (22.6%) |
| $22,500 to $24,999 | 0 (0.0%) | 0 (0.0%) |
| $25,000 to $29,999 | 4 (13.3%) | 2 (6.5%) |
| $30,000 to $34,999 | 7 (23.3%) | 2 (6.5%) |
| $35,000 to $39,999 | 2 (6.7%) | 1 (3.2%) |
| $40,000 to $44,999 | 0 (0.0%) | 8 (25.8%) |
| $45,000 to $49,999 | 5 (16.7%) | 0 (0.0%) |
| $50,000 to $54,999 | 0 (0.0%) | 0 (0.0%) |
| $55,000 to $64,999 | 2 (6.7%) | 2 (6.5%) |
| $65,000 to $74,999 | 0 (0.0%) | 1 (3.2%) |
| $75,000 to $99,999 | 0 (0.0%) | 0 (0.0%) |
| $100,000+ | 5 (16.7%) | 0 (0.0%) |
| Total | 30 (100.0%) | 31 (100.0%) |
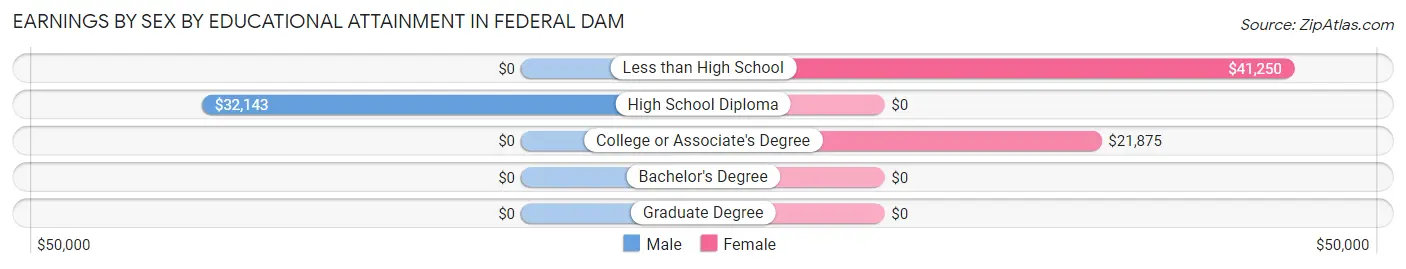
Earnings by Sex by Educational Attainment in Federal Dam
Average earnings in Federal Dam are $35,000 for men and $30,625 for women, a difference of 12.5%. Men with an educational attainment of high school diploma enjoy the highest average annual earnings of $32,143, while those with high school diploma education earn the least with $32,143. Women with an educational attainment of less than high school earn the most with the average annual earnings of $41,250, while those with college or associate's degree education have the smallest earnings of $21,875.
| Educational Attainment | Male Income | Female Income |
| Less than High School | - | - |
| High School Diploma | $32,143 | $0 |
| College or Associate's Degree | - | - |
| Bachelor's Degree | - | - |
| Graduate Degree | - | - |
| Total | $35,000 | $30,625 |
Family Income in Federal Dam
Family Income Brackets in Federal Dam
According to the Federal Dam family income data, there are 13 families falling into the $50,000 to $74,999 income range, which is the most common income bracket and makes up 41.9% of all families.
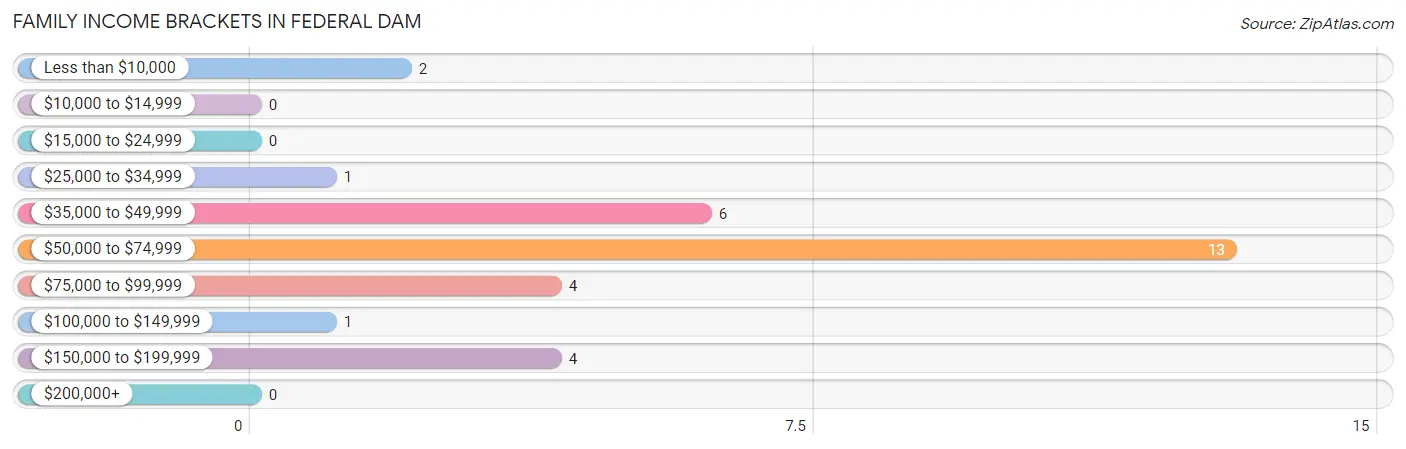
| Income Bracket | # Families | % Families |
| Less than $10,000 | 2 | 6.5% |
| $10,000 to $14,999 | 0 | 0.0% |
| $15,000 to $24,999 | 0 | 0.0% |
| $25,000 to $34,999 | 1 | 3.2% |
| $35,000 to $49,999 | 6 | 19.4% |
| $50,000 to $74,999 | 13 | 41.9% |
| $75,000 to $99,999 | 4 | 12.9% |
| $100,000 to $149,999 | 1 | 3.2% |
| $150,000 to $199,999 | 4 | 12.9% |
| $200,000+ | 0 | 0.0% |
Family Income by Famaliy Size in Federal Dam
5-person families (4 | 12.9%) account for the highest median family income in Federal Dam with $76,250 per family, while 2-person families (10 | 32.3%) have the highest median income of $23,750 per family member.
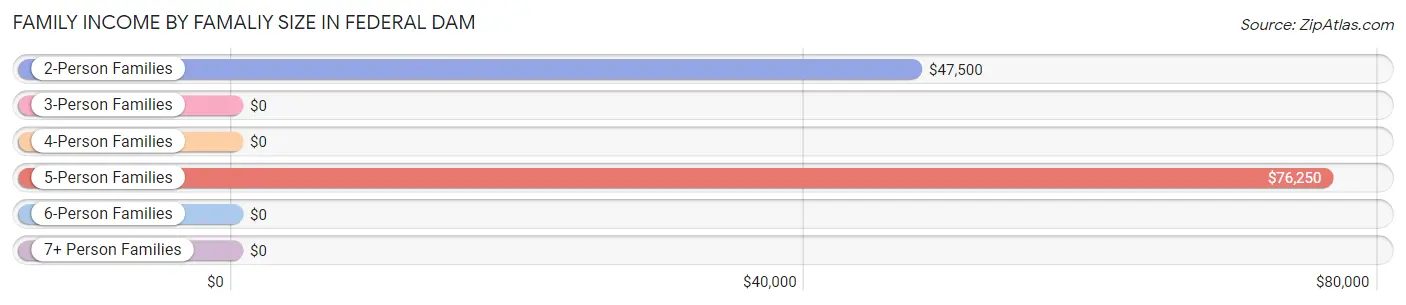
| Income Bracket | # Families | Median Income |
| 2-Person Families | 10 (32.3%) | $47,500 |
| 3-Person Families | 7 (22.6%) | $0 |
| 4-Person Families | 8 (25.8%) | $0 |
| 5-Person Families | 4 (12.9%) | $76,250 |
| 6-Person Families | 2 (6.5%) | $0 |
| 7+ Person Families | 0 (0.0%) | $0 |
| Total | 31 (100.0%) | $56,607 |
Family Income by Number of Earners in Federal Dam
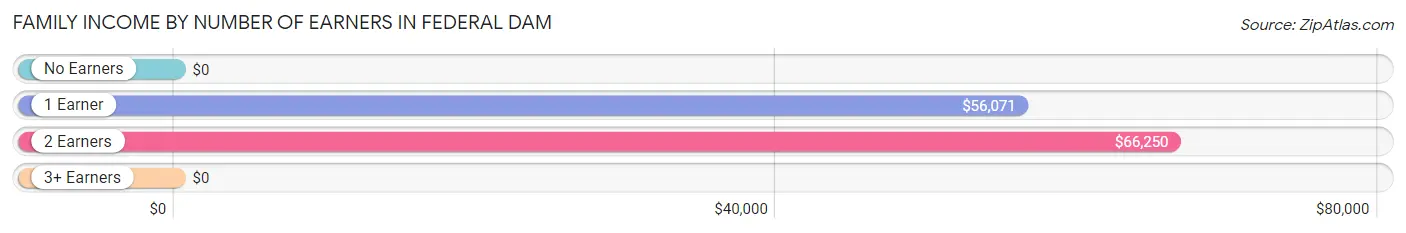
| Number of Earners | # Families | Median Income |
| No Earners | 5 (16.1%) | $0 |
| 1 Earner | 18 (58.1%) | $56,071 |
| 2 Earners | 5 (16.1%) | $66,250 |
| 3+ Earners | 3 (9.7%) | $0 |
| Total | 31 (100.0%) | $56,607 |
Household Income in Federal Dam
Household Income Brackets in Federal Dam
With 20 households falling in the category, the $50,000 to $74,999 income range is the most frequent in Federal Dam, accounting for 37.0% of all households. In contrast, only 1 households (1.8%) fall into the $100,000 to $149,999 income bracket, making it the least populous group.
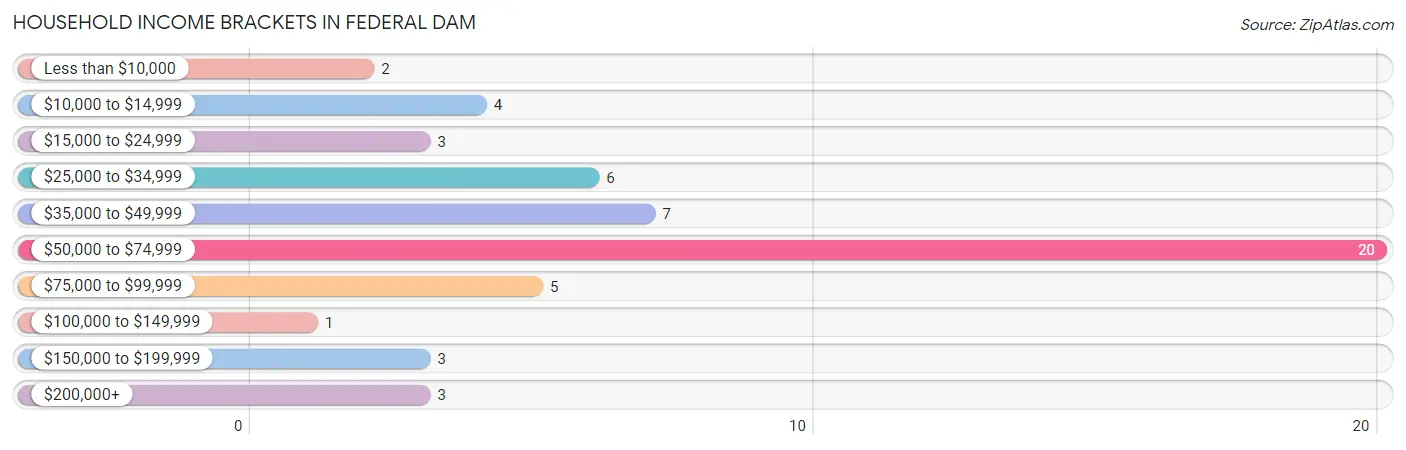
| Income Bracket | # Households | % Households |
| Less than $10,000 | 2 | 3.7% |
| $10,000 to $14,999 | 4 | 7.4% |
| $15,000 to $24,999 | 3 | 5.6% |
| $25,000 to $34,999 | 6 | 11.1% |
| $35,000 to $49,999 | 7 | 13.0% |
| $50,000 to $74,999 | 20 | 37.0% |
| $75,000 to $99,999 | 5 | 9.3% |
| $100,000 to $149,999 | 1 | 1.9% |
| $150,000 to $199,999 | 3 | 5.6% |
| $200,000+ | 3 | 5.6% |
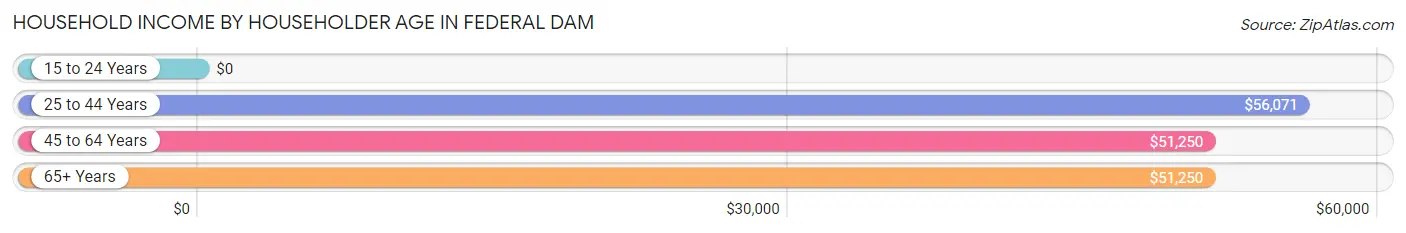
Household Income by Householder Age in Federal Dam
The median household income in Federal Dam is $52,083, with the highest median household income of $56,071 found in the 25 to 44 years age bracket for the primary householder. A total of 14 households (25.9%) fall into this category. Meanwhile, the 15 to 24 years age bracket for the primary householder has the lowest median household income of $0, with 2 households (3.7%) in this group.
| Income Bracket | # Households | Median Income |
| 15 to 24 Years | 2 (3.7%) | $0 |
| 25 to 44 Years | 14 (25.9%) | $56,071 |
| 45 to 64 Years | 16 (29.6%) | $51,250 |
| 65+ Years | 22 (40.7%) | $51,250 |
| Total | 54 (100.0%) | $52,083 |
Poverty in Federal Dam
Income Below Poverty by Sex and Age in Federal Dam
With 6.7% poverty level for males and 6.0% for females among the residents of Federal Dam, 18 to 24 year old males and 18 to 24 year old females are the most vulnerable to poverty, with 2 males (100.0%) and 1 females (25.0%) in their respective age groups living below the poverty level.
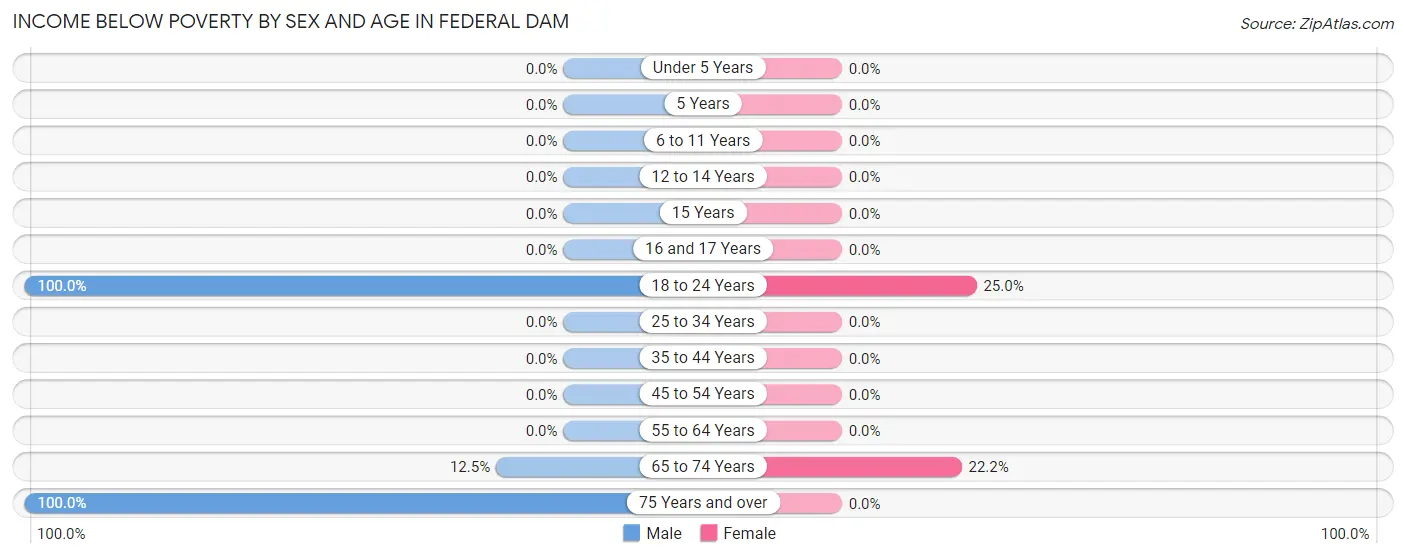
| Age Bracket | Male | Female |
| Under 5 Years | 0 (0.0%) | 0 (0.0%) |
| 5 Years | 0 (0.0%) | 0 (0.0%) |
| 6 to 11 Years | 0 (0.0%) | 0 (0.0%) |
| 12 to 14 Years | 0 (0.0%) | 0 (0.0%) |
| 15 Years | 0 (0.0%) | 0 (0.0%) |
| 16 and 17 Years | 0 (0.0%) | 0 (0.0%) |
| 18 to 24 Years | 2 (100.0%) | 1 (25.0%) |
| 25 to 34 Years | 0 (0.0%) | 0 (0.0%) |
| 35 to 44 Years | 0 (0.0%) | 0 (0.0%) |
| 45 to 54 Years | 0 (0.0%) | 0 (0.0%) |
| 55 to 64 Years | 0 (0.0%) | 0 (0.0%) |
| 65 to 74 Years | 1 (12.5%) | 4 (22.2%) |
| 75 Years and over | 2 (100.0%) | 0 (0.0%) |
| Total | 5 (6.7%) | 5 (6.0%) |
Income Above Poverty by Sex and Age in Federal Dam
According to the poverty statistics in Federal Dam, males aged under 5 years and females aged under 5 years are the age groups that are most secure financially, with 100.0% of males and 100.0% of females in these age groups living above the poverty line.
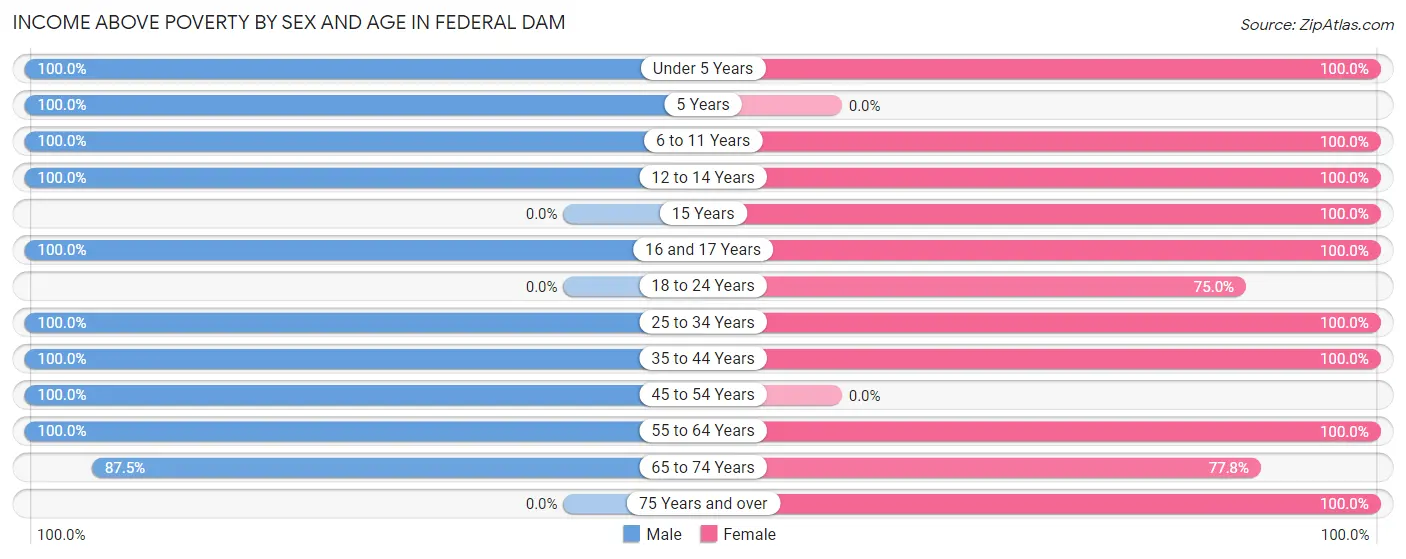
| Age Bracket | Male | Female |
| Under 5 Years | 8 (100.0%) | 8 (100.0%) |
| 5 Years | 9 (100.0%) | 0 (0.0%) |
| 6 to 11 Years | 8 (100.0%) | 4 (100.0%) |
| 12 to 14 Years | 2 (100.0%) | 3 (100.0%) |
| 15 Years | 0 (0.0%) | 7 (100.0%) |
| 16 and 17 Years | 6 (100.0%) | 1 (100.0%) |
| 18 to 24 Years | 0 (0.0%) | 3 (75.0%) |
| 25 to 34 Years | 5 (100.0%) | 9 (100.0%) |
| 35 to 44 Years | 9 (100.0%) | 10 (100.0%) |
| 45 to 54 Years | 2 (100.0%) | 0 (0.0%) |
| 55 to 64 Years | 14 (100.0%) | 13 (100.0%) |
| 65 to 74 Years | 7 (87.5%) | 14 (77.8%) |
| 75 Years and over | 0 (0.0%) | 6 (100.0%) |
| Total | 70 (93.3%) | 78 (94.0%) |
Income Below Poverty Among Married-Couple Families in Federal Dam
The poverty statistics for married-couple families in Federal Dam show that 10.5% or 2 of the total 19 families live below the poverty line. Families with no children have the highest poverty rate of 20.0%, comprising of 2 families. On the other hand, families with 1 or 2 children have the lowest poverty rate of 0.0%, which includes 0 families.
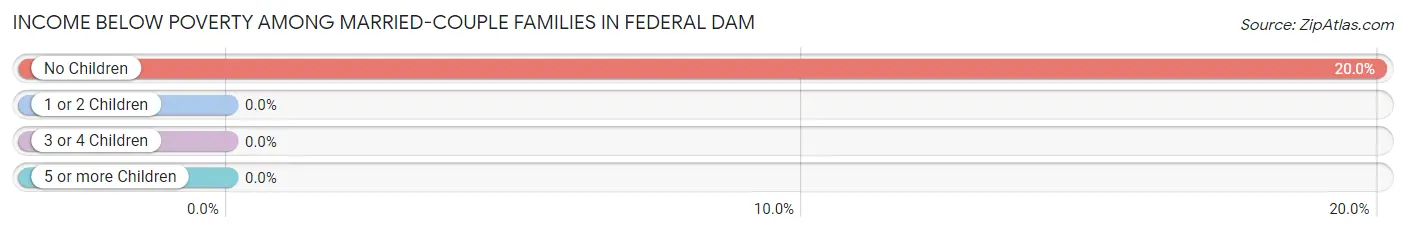
| Children | Above Poverty | Below Poverty |
| No Children | 8 (80.0%) | 2 (20.0%) |
| 1 or 2 Children | 6 (100.0%) | 0 (0.0%) |
| 3 or 4 Children | 3 (100.0%) | 0 (0.0%) |
| 5 or more Children | 0 (0.0%) | 0 (0.0%) |
| Total | 17 (89.5%) | 2 (10.5%) |
Income Below Poverty Among Single-Parent Households in Federal Dam

| Children | Single Father | Single Mother |
| No Children | 0 (0.0%) | 0 (0.0%) |
| 1 or 2 Children | 0 (0.0%) | 0 (0.0%) |
| 3 or 4 Children | 0 (0.0%) | 0 (0.0%) |
| 5 or more Children | 0 (0.0%) | 0 (0.0%) |
| Total | 0 (0.0%) | 0 (0.0%) |
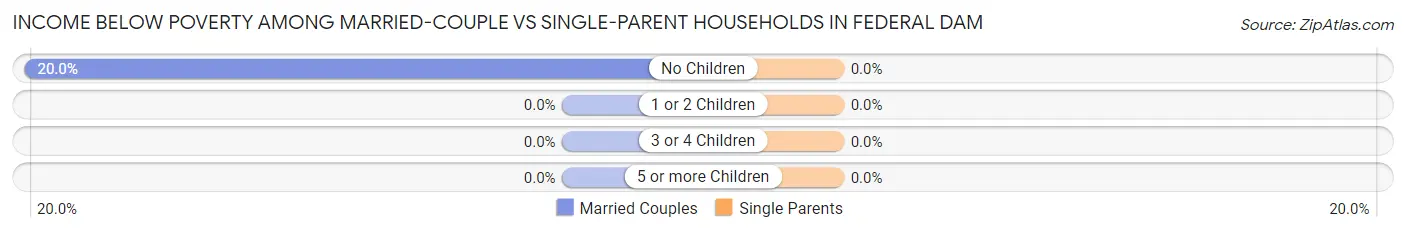
Income Below Poverty Among Married-Couple vs Single-Parent Households in Federal Dam
| Children | Married-Couple Families | Single-Parent Households |
| No Children | 2 (20.0%) | 0 (0.0%) |
| 1 or 2 Children | 0 (0.0%) | 0 (0.0%) |
| 3 or 4 Children | 0 (0.0%) | 0 (0.0%) |
| 5 or more Children | 0 (0.0%) | 0 (0.0%) |
| Total | 2 (10.5%) | 0 (0.0%) |
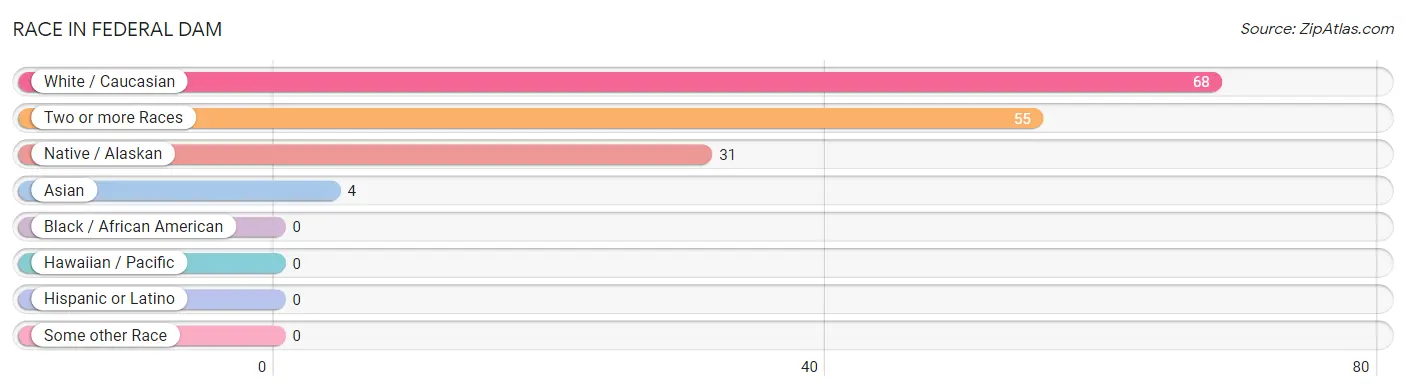
Race in Federal Dam
The most populous races in Federal Dam are White / Caucasian (68 | 43.0%), Two or more Races (55 | 34.8%), and Native / Alaskan (31 | 19.6%).
| Race | # Population | % Population |
| Asian | 4 | 2.5% |
| Black / African American | 0 | 0.0% |
| Hawaiian / Pacific | 0 | 0.0% |
| Hispanic or Latino | 0 | 0.0% |
| Native / Alaskan | 31 | 19.6% |
| White / Caucasian | 68 | 43.0% |
| Two or more Races | 55 | 34.8% |
| Some other Race | 0 | 0.0% |
| Total | 158 | 100.0% |
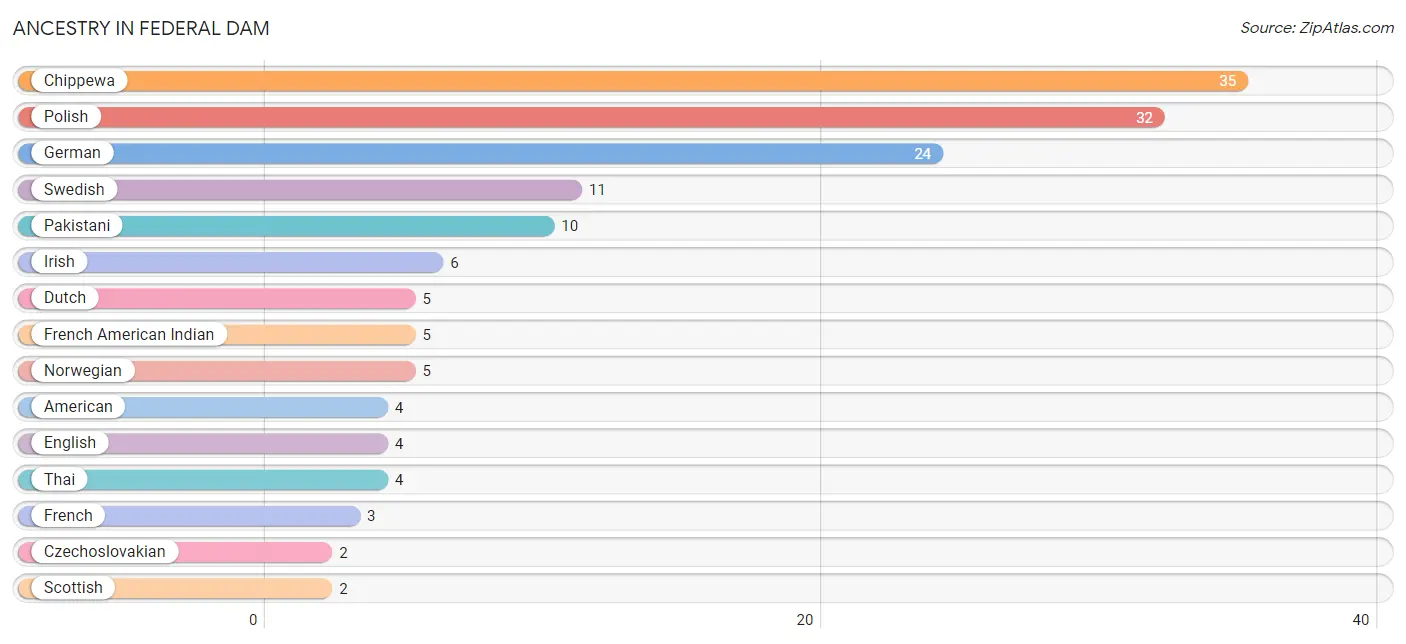
Ancestry in Federal Dam
The most populous ancestries reported in Federal Dam are Chippewa (35 | 22.2%), Polish (32 | 20.3%), German (24 | 15.2%), Swedish (11 | 7.0%), and Pakistani (10 | 6.3%), together accounting for 70.9% of all Federal Dam residents.
| Ancestry | # Population | % Population |
| American | 4 | 2.5% |
| Chippewa | 35 | 22.2% |
| Czechoslovakian | 2 | 1.3% |
| Dutch | 5 | 3.2% |
| English | 4 | 2.5% |
| French | 3 | 1.9% |
| French American Indian | 5 | 3.2% |
| German | 24 | 15.2% |
| Irish | 6 | 3.8% |
| Norwegian | 5 | 3.2% |
| Pakistani | 10 | 6.3% |
| Polish | 32 | 20.3% |
| Scandinavian | 1 | 0.6% |
| Scottish | 2 | 1.3% |
| Swedish | 11 | 7.0% |
| Thai | 4 | 2.5% | View All 16 Rows |
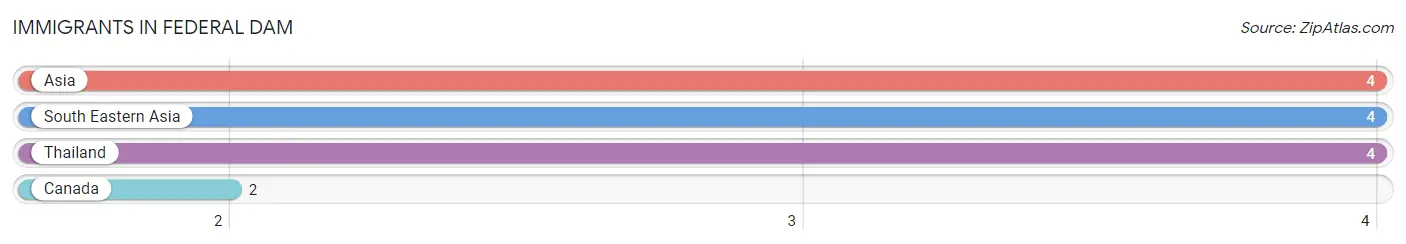
Immigrants in Federal Dam
The most numerous immigrant groups reported in Federal Dam came from Asia (4 | 2.5%), South Eastern Asia (4 | 2.5%), Thailand (4 | 2.5%), and Canada (2 | 1.3%), together accounting for 8.9% of all Federal Dam residents.
| Immigration Origin | # Population | % Population |
| Asia | 4 | 2.5% |
| Canada | 2 | 1.3% |
| South Eastern Asia | 4 | 2.5% |
| Thailand | 4 | 2.5% | View All 4 Rows |
Sex and Age in Federal Dam
Sex and Age in Federal Dam
The most populous age groups in Federal Dam are 5 to 9 Years (14 | 18.7%) for men and 70 to 74 Years (11 | 13.3%) for women.
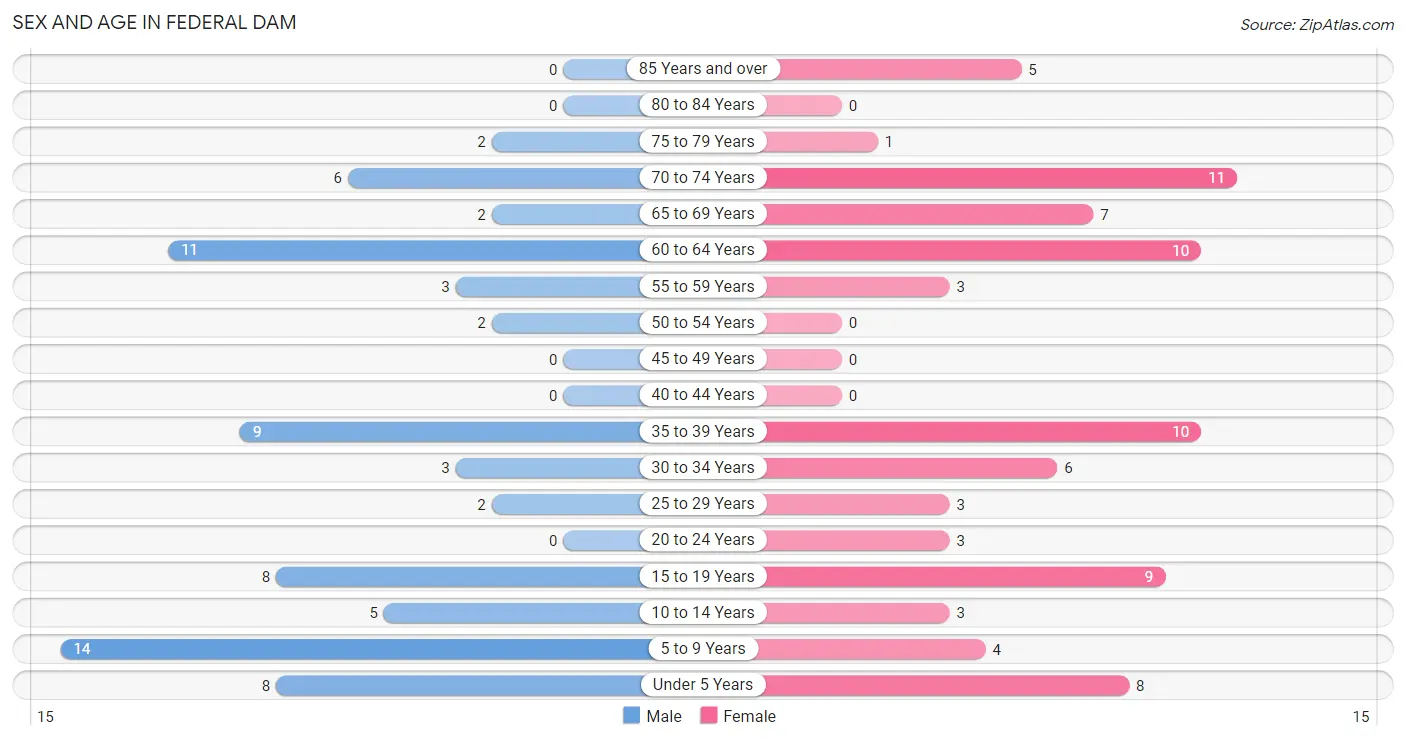
| Age Bracket | Male | Female |
| Under 5 Years | 8 (10.7%) | 8 (9.6%) |
| 5 to 9 Years | 14 (18.7%) | 4 (4.8%) |
| 10 to 14 Years | 5 (6.7%) | 3 (3.6%) |
| 15 to 19 Years | 8 (10.7%) | 9 (10.8%) |
| 20 to 24 Years | 0 (0.0%) | 3 (3.6%) |
| 25 to 29 Years | 2 (2.7%) | 3 (3.6%) |
| 30 to 34 Years | 3 (4.0%) | 6 (7.2%) |
| 35 to 39 Years | 9 (12.0%) | 10 (12.0%) |
| 40 to 44 Years | 0 (0.0%) | 0 (0.0%) |
| 45 to 49 Years | 0 (0.0%) | 0 (0.0%) |
| 50 to 54 Years | 2 (2.7%) | 0 (0.0%) |
| 55 to 59 Years | 3 (4.0%) | 3 (3.6%) |
| 60 to 64 Years | 11 (14.7%) | 10 (12.0%) |
| 65 to 69 Years | 2 (2.7%) | 7 (8.4%) |
| 70 to 74 Years | 6 (8.0%) | 11 (13.3%) |
| 75 to 79 Years | 2 (2.7%) | 1 (1.2%) |
| 80 to 84 Years | 0 (0.0%) | 0 (0.0%) |
| 85 Years and over | 0 (0.0%) | 5 (6.0%) |
| Total | 75 (100.0%) | 83 (100.0%) |
Families and Households in Federal Dam
Median Family Size in Federal Dam
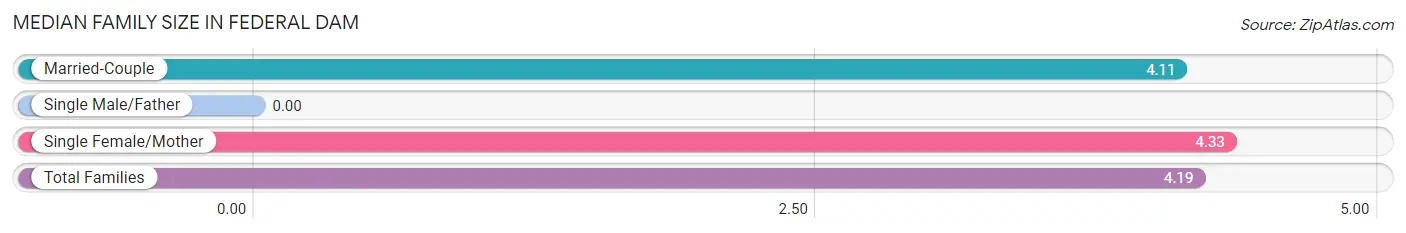
| Family Type | # Families | Family Size |
| Married-Couple | 19 (61.3%) | 4.11 |
| Single Male/Father | 0 (0.0%) | - |
| Single Female/Mother | 12 (38.7%) | 4.33 |
| Total Families | 31 (100.0%) | 4.19 |
Median Household Size in Federal Dam
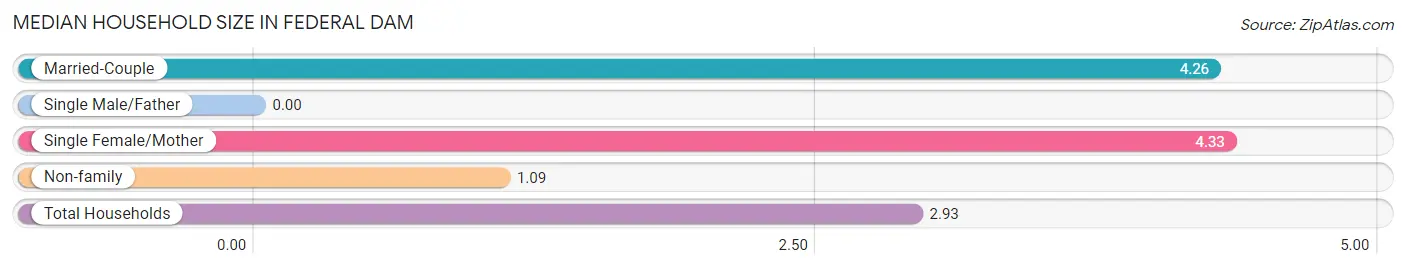
| Household Type | # Households | Household Size |
| Married-Couple | 19 (35.2%) | 4.26 |
| Single Male/Father | 0 (0.0%) | - |
| Single Female/Mother | 12 (22.2%) | 4.33 |
| Non-family | 23 (42.6%) | 1.09 |
| Total Households | 54 (100.0%) | 2.93 |
Household Size by Marriage Status in Federal Dam
Out of a total of 54 households in Federal Dam, 31 (57.4%) are family households, while 23 (42.6%) are nonfamily households. The most numerous type of family households are 2-person households, comprising 10, and the most common type of nonfamily households are 1-person households, comprising 20.
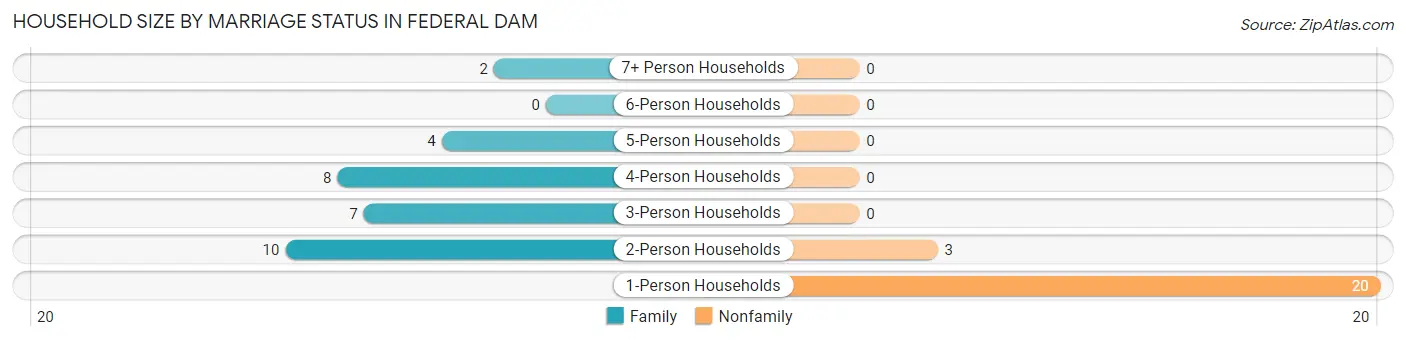
| Household Size | Family Households | Nonfamily Households |
| 1-Person Households | - | 20 (37.0%) |
| 2-Person Households | 10 (18.5%) | 3 (5.6%) |
| 3-Person Households | 7 (13.0%) | 0 (0.0%) |
| 4-Person Households | 8 (14.8%) | 0 (0.0%) |
| 5-Person Households | 4 (7.4%) | 0 (0.0%) |
| 6-Person Households | 0 (0.0%) | 0 (0.0%) |
| 7+ Person Households | 2 (3.7%) | 0 (0.0%) |
| Total | 31 (57.4%) | 23 (42.6%) |
Female Fertility in Federal Dam
Fertility by Age in Federal Dam
| Age Bracket | Women with Births | Births / 1,000 Women |
| 15 to 19 years | 0 (0.0%) | 0.0 |
| 20 to 34 years | 0 (0.0%) | 0.0 |
| 35 to 50 years | 0 (0.0%) | 0.0 |
| Total | 0 (0.0%) | 0.0 |
Fertility by Age by Marriage Status in Federal Dam
| Age Bracket | Married | Unmarried |
| 15 to 19 years | 0 (0.0%) | 0 (0.0%) |
| 20 to 34 years | 0 (0.0%) | 0 (0.0%) |
| 35 to 50 years | 0 (0.0%) | 0 (0.0%) |
| Total | 0 (0.0%) | 0 (0.0%) |
Fertility by Education in Federal Dam
| Educational Attainment | Women with Births | Births / 1,000 Women |
| Less than High School | 0 (0.0%) | 0.0 |
| High School Diploma | 0 (0.0%) | 0.0 |
| College or Associate's Degree | 0 (0.0%) | 0.0 |
| Bachelor's Degree | 0 (0.0%) | 0.0 |
| Graduate Degree | 0 (0.0%) | 0.0 |
| Total | 0 (0.0%) | 0.0 |
Fertility by Education by Marriage Status in Federal Dam
| Educational Attainment | Married | Unmarried |
| Less than High School | 0 (0.0%) | 0 (0.0%) |
| High School Diploma | 0 (0.0%) | 0 (0.0%) |
| College or Associate's Degree | 0 (0.0%) | 0 (0.0%) |
| Bachelor's Degree | 0 (0.0%) | 0 (0.0%) |
| Graduate Degree | 0 (0.0%) | 0 (0.0%) |
| Total | 0 (0.0%) | 0 (0.0%) |
Employment Characteristics in Federal Dam
Employment by Class of Employer in Federal Dam
Among the 54 employed individuals in Federal Dam, private company employees (38 | 70.4%), local government employees (4 | 7.4%), and self-employed (incorporated) (3 | 5.6%) make up the most common classes of employment.
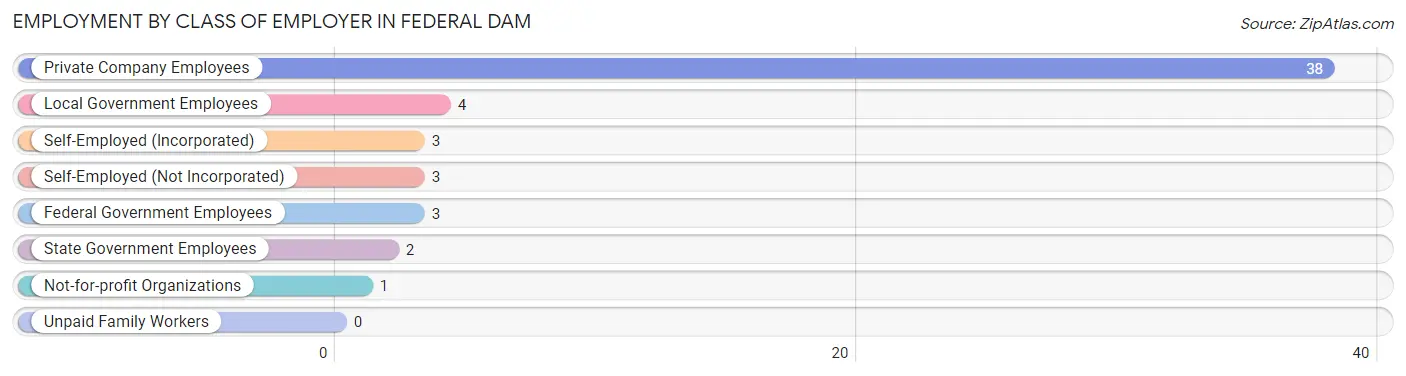
| Employer Class | # Employees | % Employees |
| Private Company Employees | 38 | 70.4% |
| Self-Employed (Incorporated) | 3 | 5.6% |
| Self-Employed (Not Incorporated) | 3 | 5.6% |
| Not-for-profit Organizations | 1 | 1.8% |
| Local Government Employees | 4 | 7.4% |
| State Government Employees | 2 | 3.7% |
| Federal Government Employees | 3 | 5.6% |
| Unpaid Family Workers | 0 | 0.0% |
| Total | 54 | 100.0% |
Employment Status by Age in Federal Dam
According to the labor force statistics for Federal Dam, out of the total population over 16 years of age (109), 54.1% or 59 individuals are in the labor force, with 6.8% or 4 of them unemployed. The age group with the highest labor force participation rate is 20 to 24 years, with 100.0% or 3 individuals in the labor force. Within the labor force, the 60 to 64 years age range has the highest percentage of unemployed individuals, with 26.7% or 4 of them being unemployed.
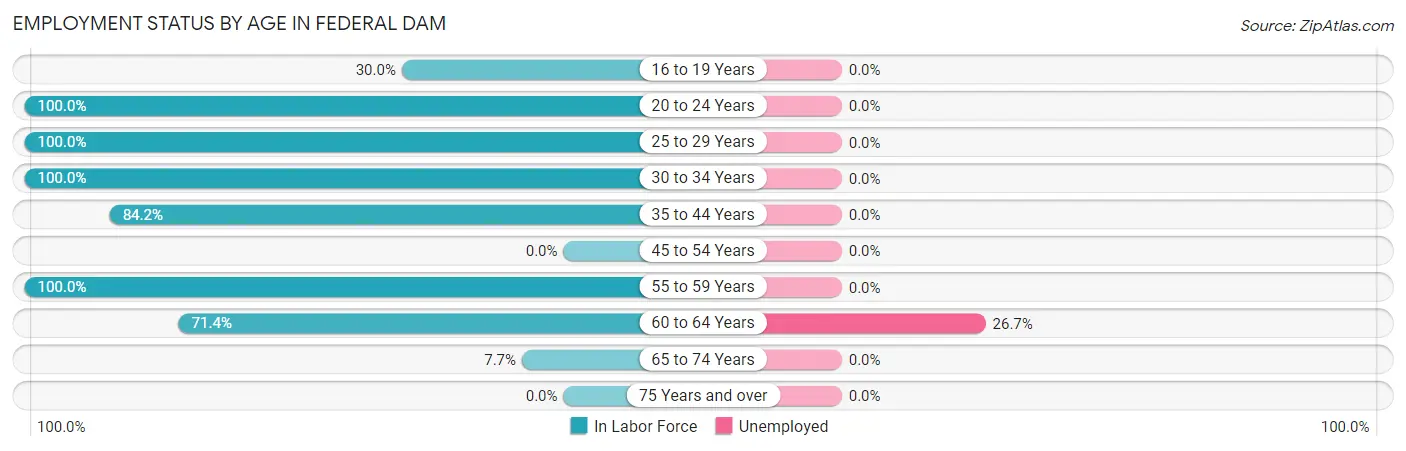
| Age Bracket | In Labor Force | Unemployed |
| 16 to 19 Years | 3 (30.0%) | 0 (0.0%) |
| 20 to 24 Years | 3 (100.0%) | 0 (0.0%) |
| 25 to 29 Years | 5 (100.0%) | 0 (0.0%) |
| 30 to 34 Years | 9 (100.0%) | 0 (0.0%) |
| 35 to 44 Years | 16 (84.2%) | 0 (0.0%) |
| 45 to 54 Years | 0 (0.0%) | 0 (0.0%) |
| 55 to 59 Years | 6 (100.0%) | 0 (0.0%) |
| 60 to 64 Years | 15 (71.4%) | 4 (26.7%) |
| 65 to 74 Years | 2 (7.7%) | 0 (0.0%) |
| 75 Years and over | 0 (0.0%) | 0 (0.0%) |
| Total | 59 (54.1%) | 4 (6.8%) |
Employment Status by Educational Attainment in Federal Dam
According to labor force statistics for Federal Dam, 82.3% of individuals (51) out of the total population between 25 and 64 years of age (62) are in the labor force, with 7.8% or 4 of them being unemployed. The group with the highest labor force participation rate are those with the educational attainment of high school diploma, with 94.1% or 32 individuals in the labor force. Within the labor force, individuals with high school diploma education have the highest percentage of unemployment, with 12.5% or 4 of them being unemployed.
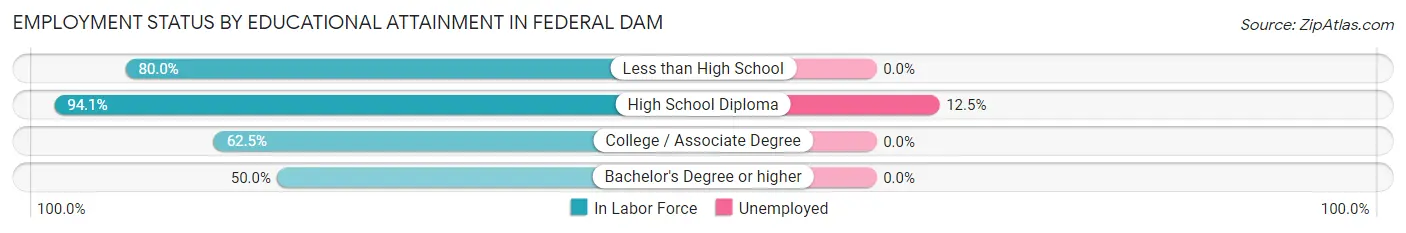
| Educational Attainment | In Labor Force | Unemployed |
| Less than High School | 8 (80.0%) | 0 (0.0%) |
| High School Diploma | 32 (94.1%) | 4 (12.5%) |
| College / Associate Degree | 10 (62.5%) | 0 (0.0%) |
| Bachelor's Degree or higher | 1 (50.0%) | 0 (0.0%) |
| Total | 51 (82.3%) | 5 (7.8%) |
Employment Occupations by Sex in Federal Dam
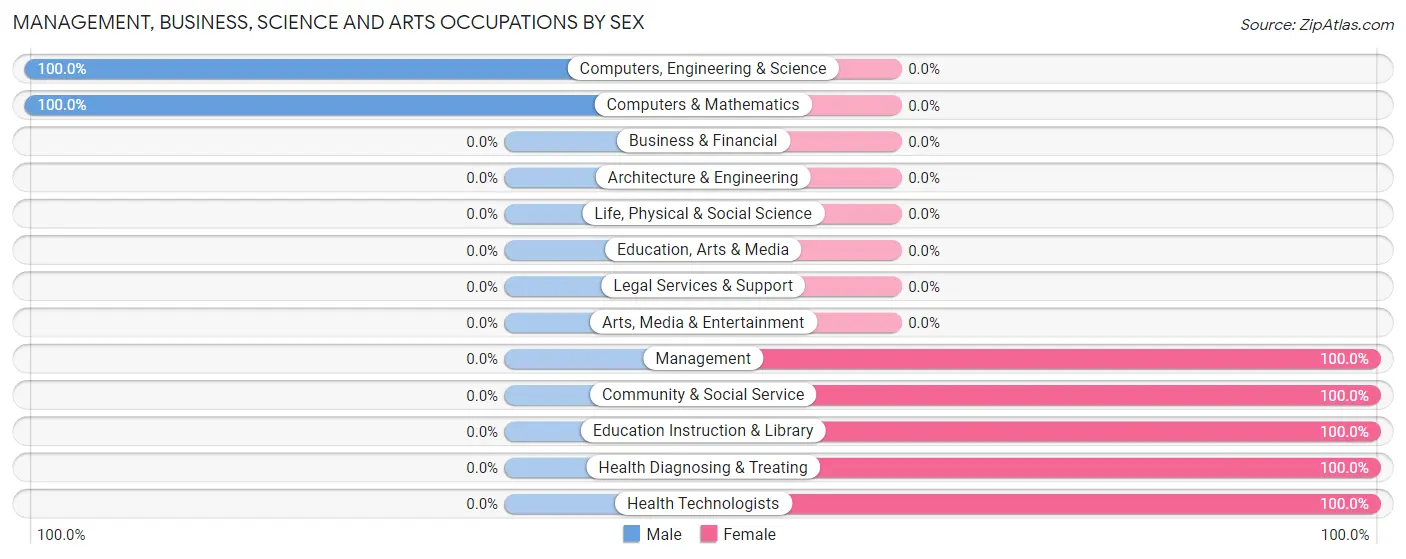
Management, Business, Science and Arts Occupations
The most common Management, Business, Science and Arts occupations in Federal Dam are Community & Social Service (2 | 3.6%), Education Instruction & Library (2 | 3.6%), Management (1 | 1.8%), Computers, Engineering & Science (1 | 1.8%), and Computers & Mathematics (1 | 1.8%).
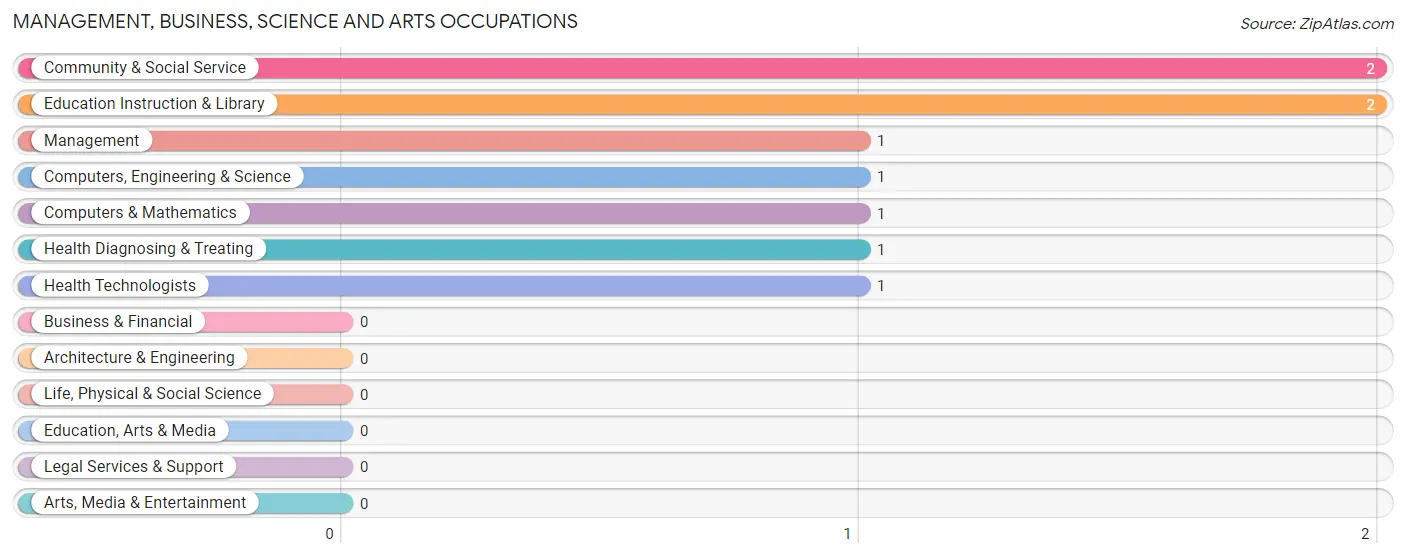
Management, Business, Science and Arts Occupations by Sex
Within the Management, Business, Science and Arts occupations in Federal Dam, the most male-oriented occupations are Computers, Engineering & Science (100.0%), and Computers & Mathematics (100.0%), while the most female-oriented occupations are Management (100.0%), Community & Social Service (100.0%), and Education Instruction & Library (100.0%).
| Occupation | Male | Female |
| Management | 0 (0.0%) | 1 (100.0%) |
| Business & Financial | 0 (0.0%) | 0 (0.0%) |
| Computers, Engineering & Science | 1 (100.0%) | 0 (0.0%) |
| Computers & Mathematics | 1 (100.0%) | 0 (0.0%) |
| Architecture & Engineering | 0 (0.0%) | 0 (0.0%) |
| Life, Physical & Social Science | 0 (0.0%) | 0 (0.0%) |
| Community & Social Service | 0 (0.0%) | 2 (100.0%) |
| Education, Arts & Media | 0 (0.0%) | 0 (0.0%) |
| Legal Services & Support | 0 (0.0%) | 0 (0.0%) |
| Education Instruction & Library | 0 (0.0%) | 2 (100.0%) |
| Arts, Media & Entertainment | 0 (0.0%) | 0 (0.0%) |
| Health Diagnosing & Treating | 0 (0.0%) | 1 (100.0%) |
| Health Technologists | 0 (0.0%) | 1 (100.0%) |
| Total (Category) | 1 (20.0%) | 4 (80.0%) |
| Total (Overall) | 26 (47.3%) | 29 (52.7%) |
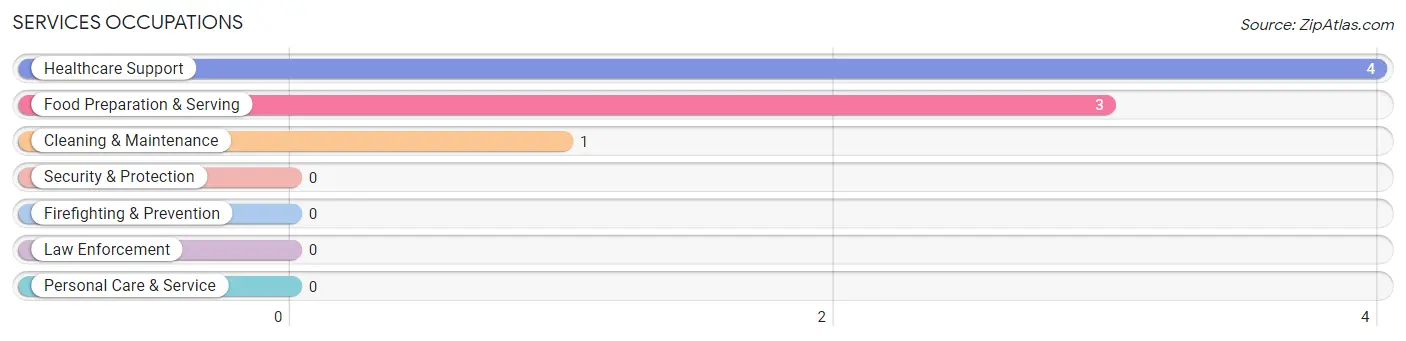
Services Occupations
The most common Services occupations in Federal Dam are Healthcare Support (4 | 7.3%), Food Preparation & Serving (3 | 5.4%), and Cleaning & Maintenance (1 | 1.8%).
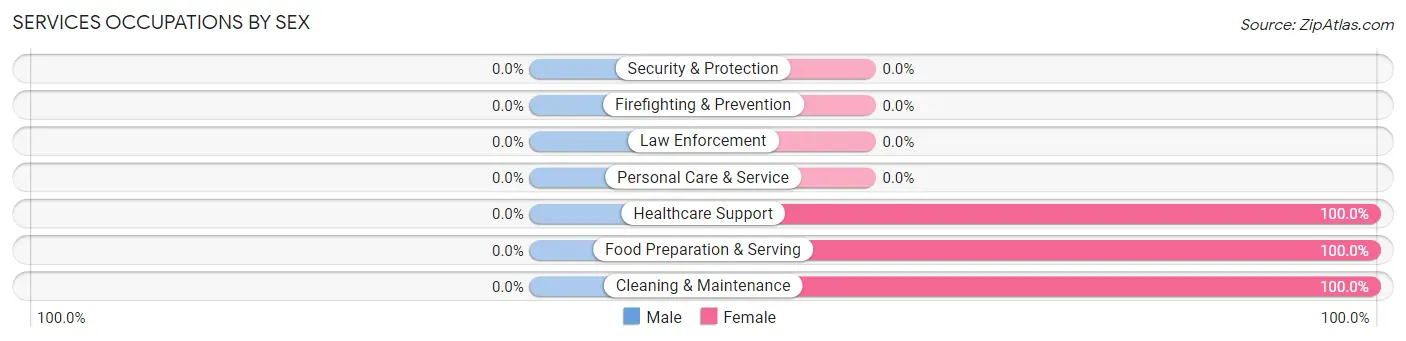
Services Occupations by Sex
| Occupation | Male | Female |
| Healthcare Support | 0 (0.0%) | 4 (100.0%) |
| Security & Protection | 0 (0.0%) | 0 (0.0%) |
| Firefighting & Prevention | 0 (0.0%) | 0 (0.0%) |
| Law Enforcement | 0 (0.0%) | 0 (0.0%) |
| Food Preparation & Serving | 0 (0.0%) | 3 (100.0%) |
| Cleaning & Maintenance | 0 (0.0%) | 1 (100.0%) |
| Personal Care & Service | 0 (0.0%) | 0 (0.0%) |
| Total (Category) | 0 (0.0%) | 8 (100.0%) |
| Total (Overall) | 26 (47.3%) | 29 (52.7%) |
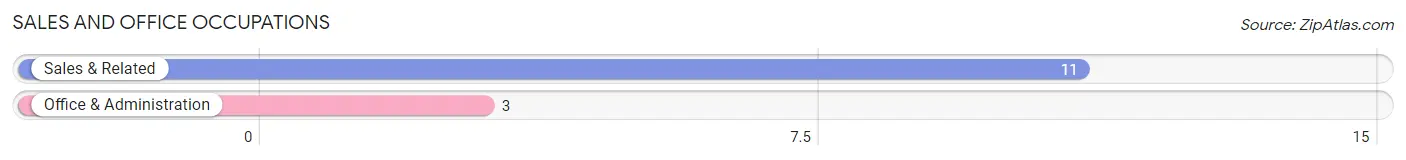
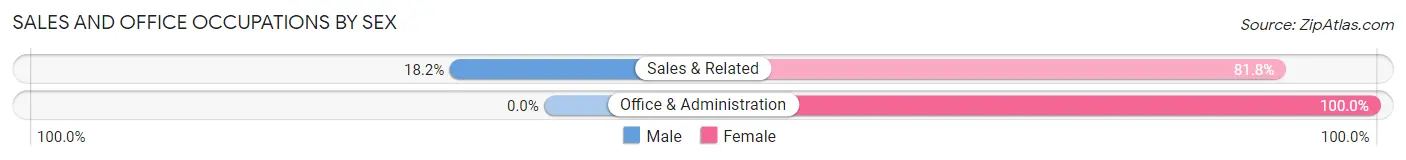
Sales and Office Occupations
The most common Sales and Office occupations in Federal Dam are Sales & Related (11 | 20.0%), and Office & Administration (3 | 5.4%).
Sales and Office Occupations by Sex
| Occupation | Male | Female |
| Sales & Related | 2 (18.2%) | 9 (81.8%) |
| Office & Administration | 0 (0.0%) | 3 (100.0%) |
| Total (Category) | 2 (14.3%) | 12 (85.7%) |
| Total (Overall) | 26 (47.3%) | 29 (52.7%) |
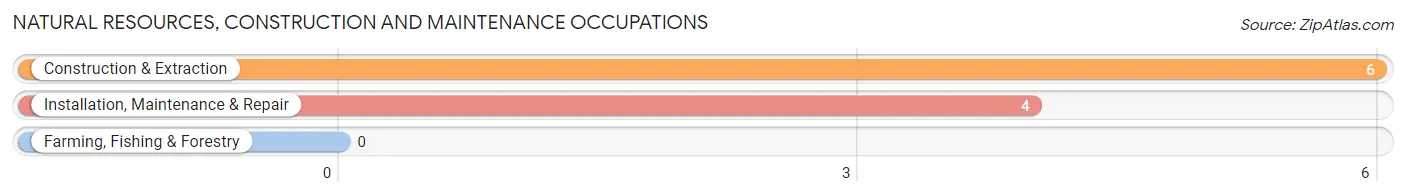
Natural Resources, Construction and Maintenance Occupations
The most common Natural Resources, Construction and Maintenance occupations in Federal Dam are Construction & Extraction (6 | 10.9%), and Installation, Maintenance & Repair (4 | 7.3%).
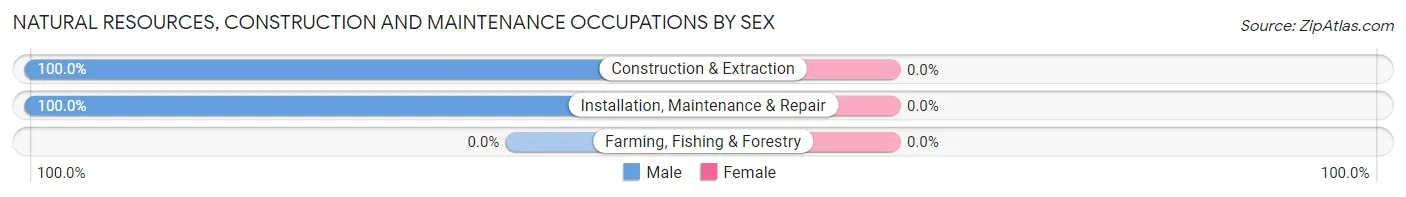
Natural Resources, Construction and Maintenance Occupations by Sex
| Occupation | Male | Female |
| Farming, Fishing & Forestry | 0 (0.0%) | 0 (0.0%) |
| Construction & Extraction | 6 (100.0%) | 0 (0.0%) |
| Installation, Maintenance & Repair | 4 (100.0%) | 0 (0.0%) |
| Total (Category) | 10 (100.0%) | 0 (0.0%) |
| Total (Overall) | 26 (47.3%) | 29 (52.7%) |
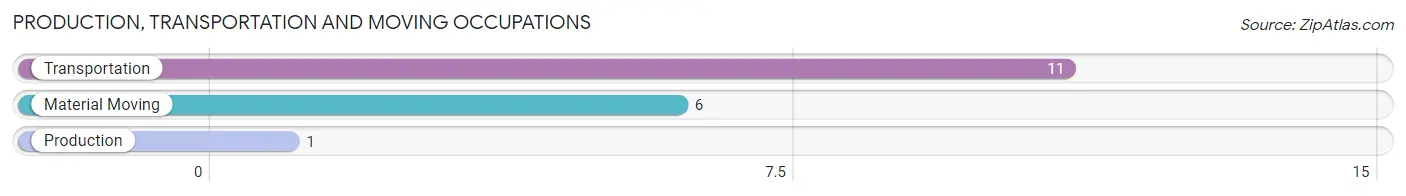
Production, Transportation and Moving Occupations
The most common Production, Transportation and Moving occupations in Federal Dam are Transportation (11 | 20.0%), Material Moving (6 | 10.9%), and Production (1 | 1.8%).
Production, Transportation and Moving Occupations by Sex
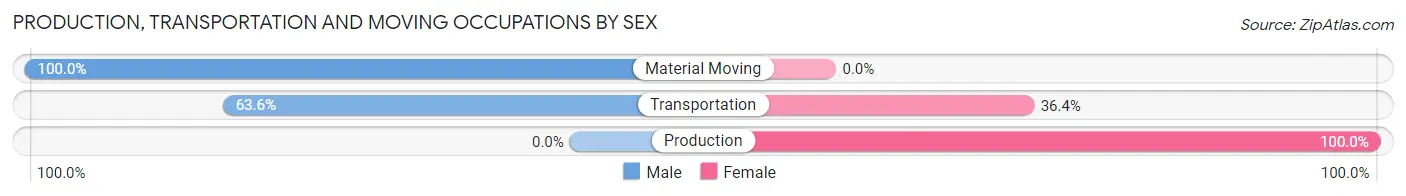
| Occupation | Male | Female |
| Production | 0 (0.0%) | 1 (100.0%) |
| Transportation | 7 (63.6%) | 4 (36.4%) |
| Material Moving | 6 (100.0%) | 0 (0.0%) |
| Total (Category) | 13 (72.2%) | 5 (27.8%) |
| Total (Overall) | 26 (47.3%) | 29 (52.7%) |
Employment Industries by Sex in Federal Dam
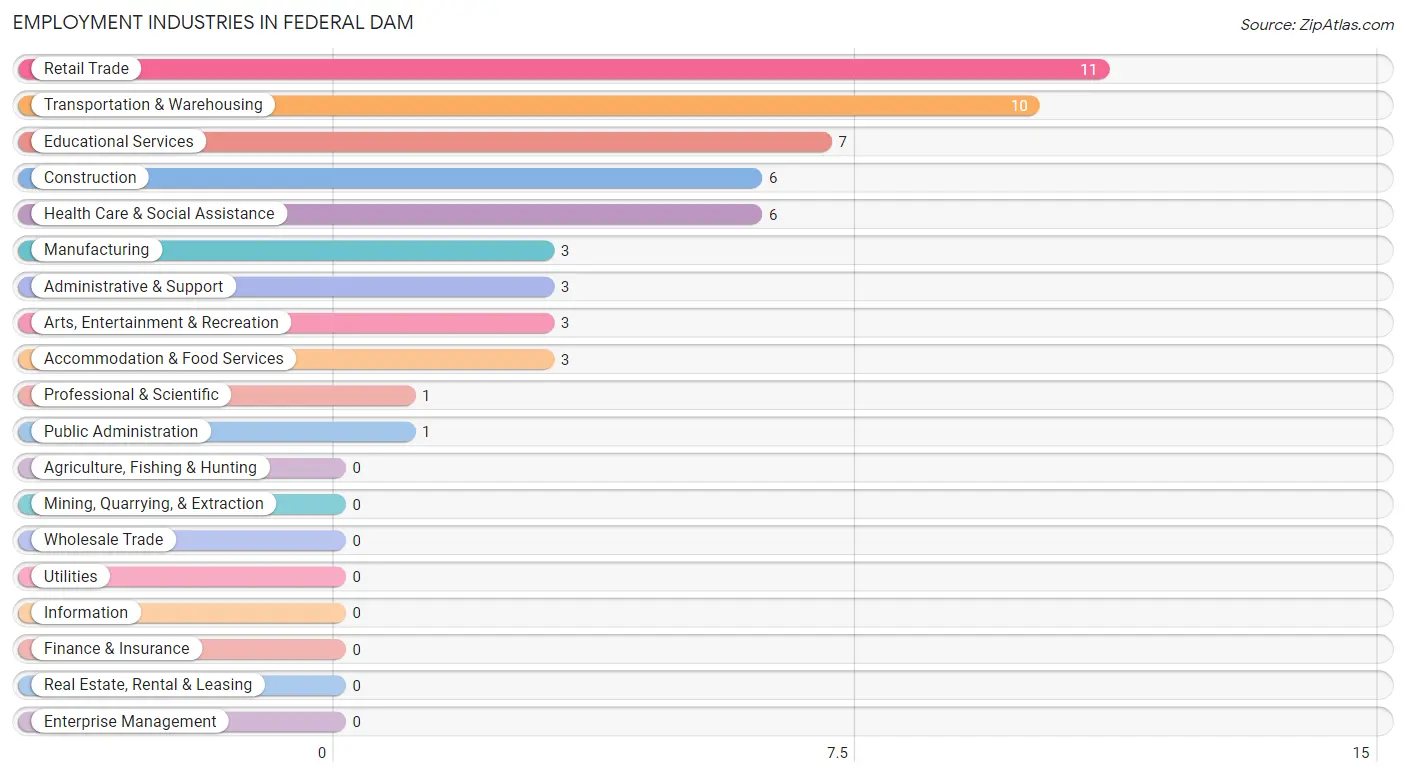
Employment Industries in Federal Dam
The major employment industries in Federal Dam include Retail Trade (11 | 20.0%), Transportation & Warehousing (10 | 18.2%), Educational Services (7 | 12.7%), Construction (6 | 10.9%), and Health Care & Social Assistance (6 | 10.9%).
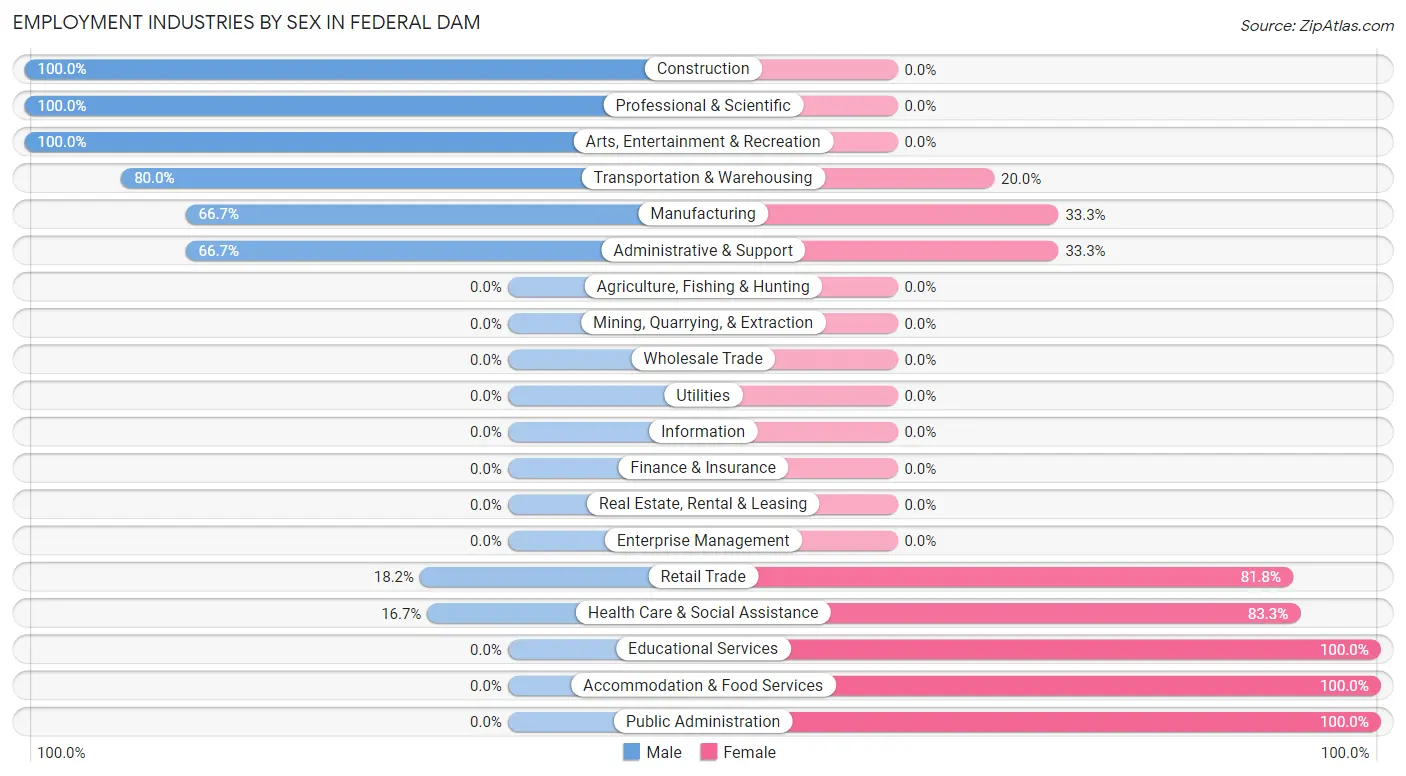
Employment Industries by Sex in Federal Dam
The Federal Dam industries that see more men than women are Construction (100.0%), Professional & Scientific (100.0%), and Arts, Entertainment & Recreation (100.0%), whereas the industries that tend to have a higher number of women are Educational Services (100.0%), Accommodation & Food Services (100.0%), and Public Administration (100.0%).
| Industry | Male | Female |
| Agriculture, Fishing & Hunting | 0 (0.0%) | 0 (0.0%) |
| Mining, Quarrying, & Extraction | 0 (0.0%) | 0 (0.0%) |
| Construction | 6 (100.0%) | 0 (0.0%) |
| Manufacturing | 2 (66.7%) | 1 (33.3%) |
| Wholesale Trade | 0 (0.0%) | 0 (0.0%) |
| Retail Trade | 2 (18.2%) | 9 (81.8%) |
| Transportation & Warehousing | 8 (80.0%) | 2 (20.0%) |
| Utilities | 0 (0.0%) | 0 (0.0%) |
| Information | 0 (0.0%) | 0 (0.0%) |
| Finance & Insurance | 0 (0.0%) | 0 (0.0%) |
| Real Estate, Rental & Leasing | 0 (0.0%) | 0 (0.0%) |
| Professional & Scientific | 1 (100.0%) | 0 (0.0%) |
| Enterprise Management | 0 (0.0%) | 0 (0.0%) |
| Administrative & Support | 2 (66.7%) | 1 (33.3%) |
| Educational Services | 0 (0.0%) | 7 (100.0%) |
| Health Care & Social Assistance | 1 (16.7%) | 5 (83.3%) |
| Arts, Entertainment & Recreation | 3 (100.0%) | 0 (0.0%) |
| Accommodation & Food Services | 0 (0.0%) | 3 (100.0%) |
| Public Administration | 0 (0.0%) | 1 (100.0%) |
| Total | 26 (47.3%) | 29 (52.7%) |
Education in Federal Dam
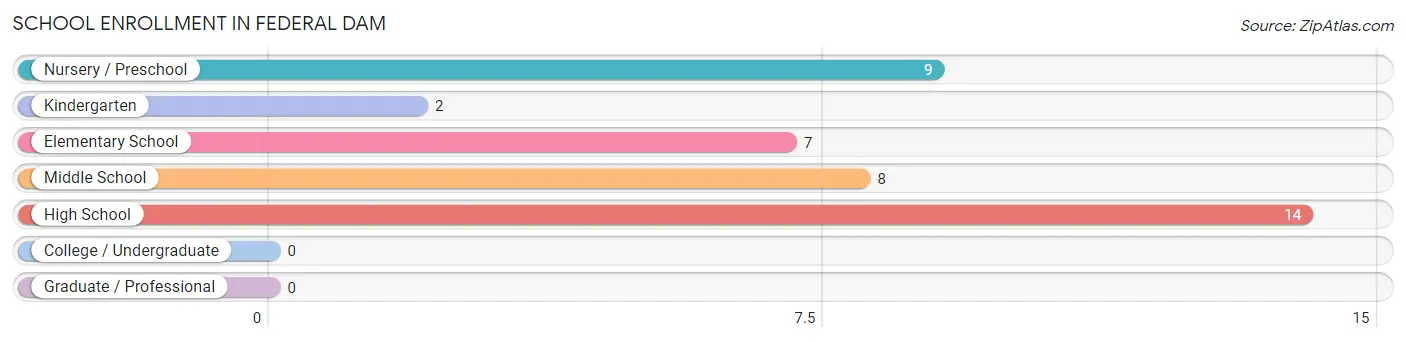
School Enrollment in Federal Dam
The most common levels of schooling among the 40 students in Federal Dam are high school (14 | 35.0%), nursery / preschool (9 | 22.5%), and middle school (8 | 20.0%).
| School Level | # Students | % Students |
| Nursery / Preschool | 9 | 22.5% |
| Kindergarten | 2 | 5.0% |
| Elementary School | 7 | 17.5% |
| Middle School | 8 | 20.0% |
| High School | 14 | 35.0% |
| College / Undergraduate | 0 | 0.0% |
| Graduate / Professional | 0 | 0.0% |
| Total | 40 | 100.0% |
School Enrollment by Age by Funding Source in Federal Dam
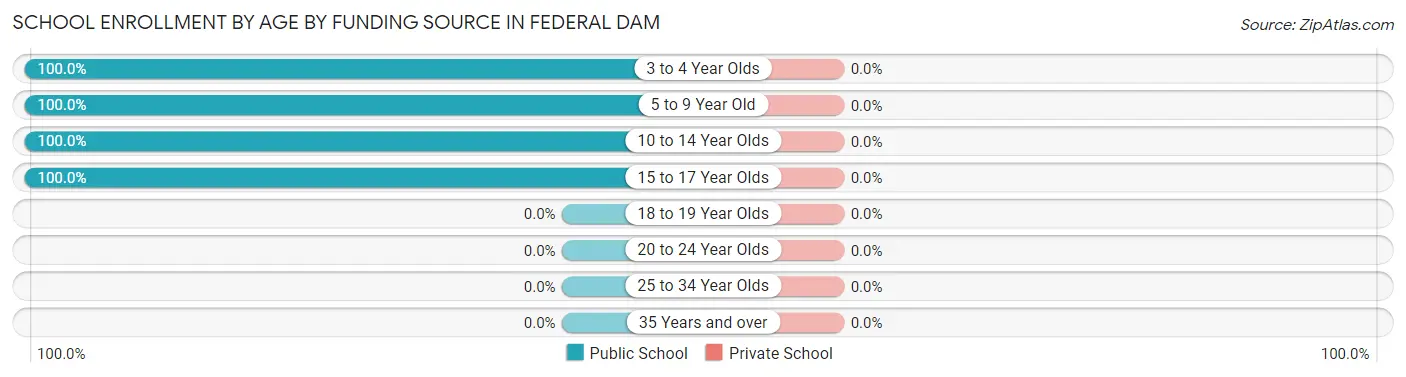
| Age Bracket | Public School | Private School |
| 3 to 4 Year Olds | 7 (100.0%) | 0 (0.0%) |
| 5 to 9 Year Old | 11 (100.0%) | 0 (0.0%) |
| 10 to 14 Year Olds | 8 (100.0%) | 0 (0.0%) |
| 15 to 17 Year Olds | 14 (100.0%) | 0 (0.0%) |
| 18 to 19 Year Olds | 0 (0.0%) | 0 (0.0%) |
| 20 to 24 Year Olds | 0 (0.0%) | 0 (0.0%) |
| 25 to 34 Year Olds | 0 (0.0%) | 0 (0.0%) |
| 35 Years and over | 0 (0.0%) | 0 (0.0%) |
| Total | 40 (100.0%) | 0 (0.0%) |
Educational Attainment by Field of Study in Federal Dam
Computers & mathematics (1 | 16.7%), bio, nature & agricultural (1 | 16.7%), physical & health sciences (1 | 16.7%), education (1 | 16.7%), and liberal arts & history (1 | 16.7%) are the most common fields of study among 6 individuals in Federal Dam who have obtained a bachelor's degree or higher.
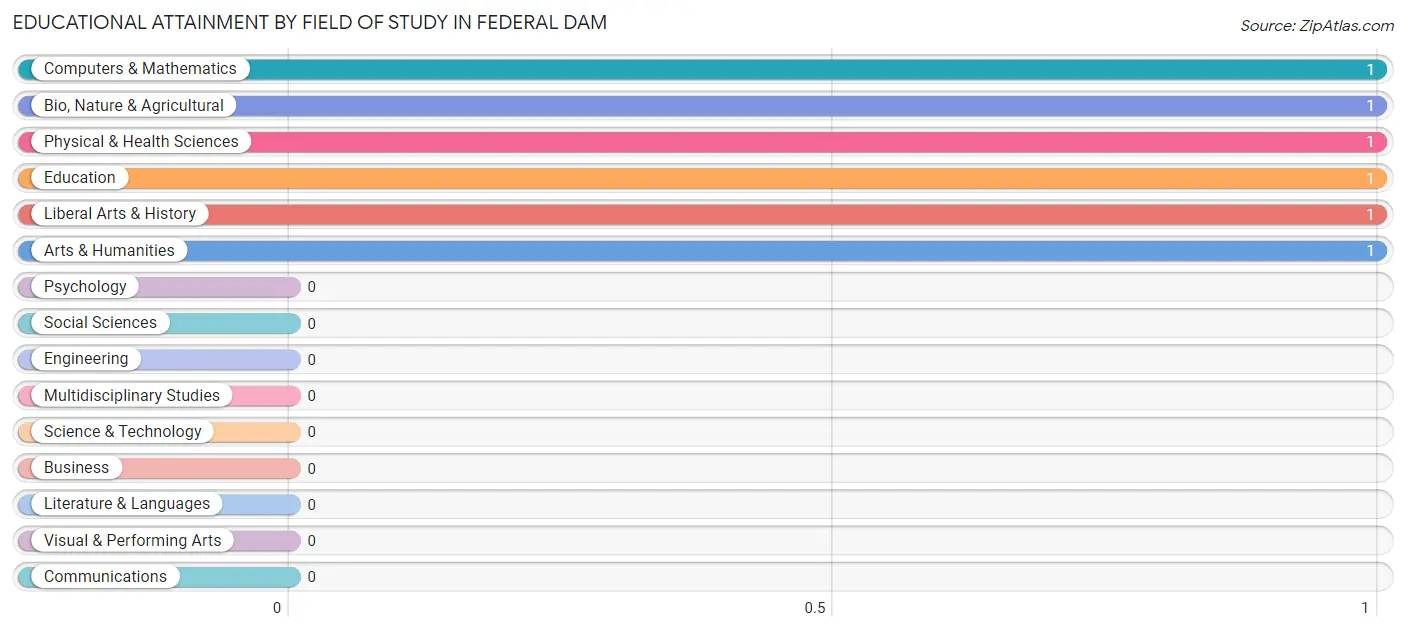
| Field of Study | # Graduates | % Graduates |
| Computers & Mathematics | 1 | 16.7% |
| Bio, Nature & Agricultural | 1 | 16.7% |
| Physical & Health Sciences | 1 | 16.7% |
| Psychology | 0 | 0.0% |
| Social Sciences | 0 | 0.0% |
| Engineering | 0 | 0.0% |
| Multidisciplinary Studies | 0 | 0.0% |
| Science & Technology | 0 | 0.0% |
| Business | 0 | 0.0% |
| Education | 1 | 16.7% |
| Literature & Languages | 0 | 0.0% |
| Liberal Arts & History | 1 | 16.7% |
| Visual & Performing Arts | 0 | 0.0% |
| Communications | 0 | 0.0% |
| Arts & Humanities | 1 | 16.7% |
| Total | 6 | 100.0% |
Transportation & Commute in Federal Dam
Vehicle Availability by Sex in Federal Dam
The most prevalent vehicle ownership categories in Federal Dam are males with 2 vehicles (11, accounting for 44.0%) and females with 2 vehicles (7, making up 37.9%).
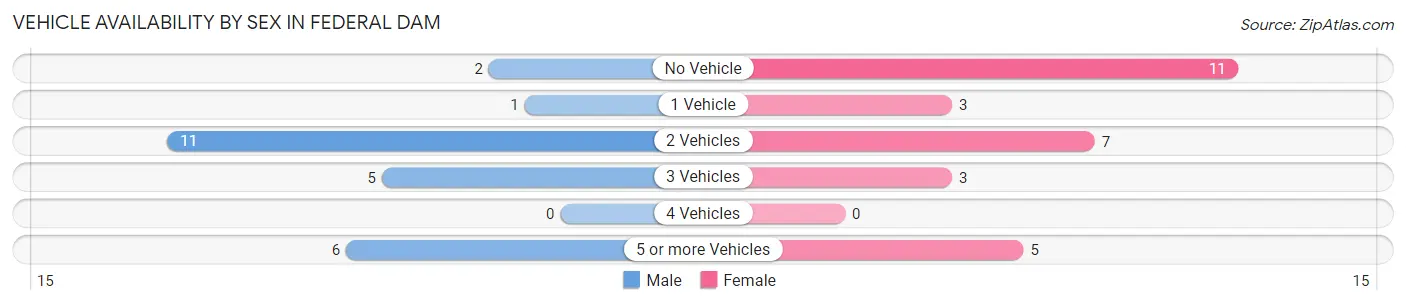
| Vehicles Available | Male | Female |
| No Vehicle | 2 (8.0%) | 11 (37.9%) |
| 1 Vehicle | 1 (4.0%) | 3 (10.3%) |
| 2 Vehicles | 11 (44.0%) | 7 (24.1%) |
| 3 Vehicles | 5 (20.0%) | 3 (10.3%) |
| 4 Vehicles | 0 (0.0%) | 0 (0.0%) |
| 5 or more Vehicles | 6 (24.0%) | 5 (17.2%) |
| Total | 25 (100.0%) | 29 (100.0%) |
Commute Time in Federal Dam
The most frequently occuring commute durations in Federal Dam are less than 5 minutes (17 commuters, 33.3%), 30 to 34 minutes (5 commuters, 9.8%), and 35 to 39 minutes (5 commuters, 9.8%).
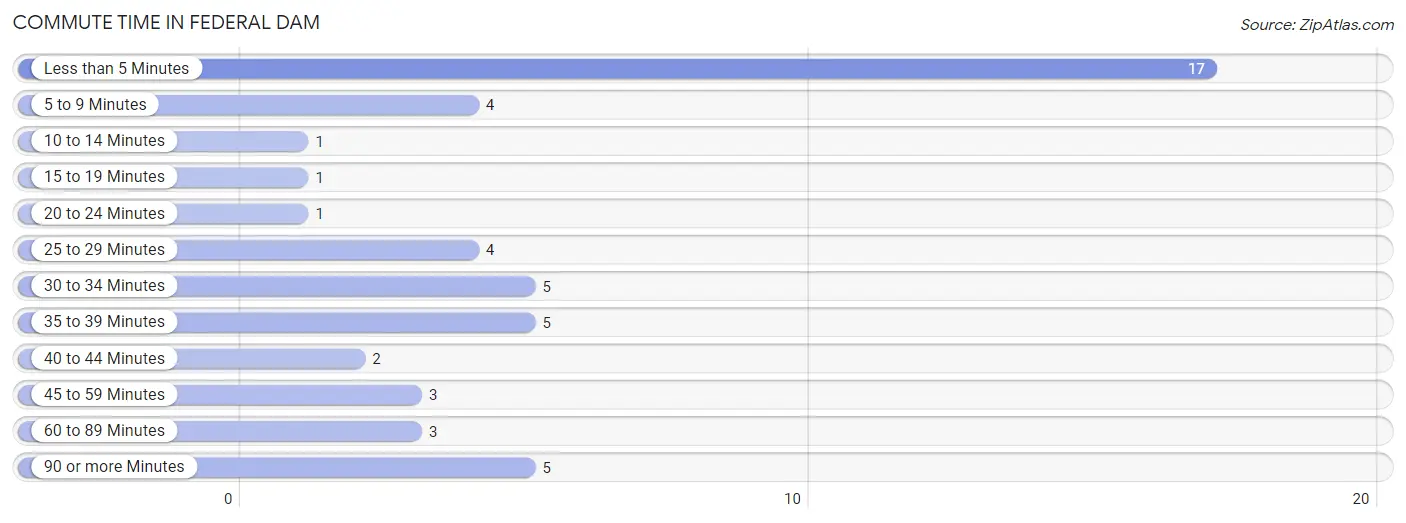
| Commute Time | # Commuters | % Commuters |
| Less than 5 Minutes | 17 | 33.3% |
| 5 to 9 Minutes | 4 | 7.8% |
| 10 to 14 Minutes | 1 | 2.0% |
| 15 to 19 Minutes | 1 | 2.0% |
| 20 to 24 Minutes | 1 | 2.0% |
| 25 to 29 Minutes | 4 | 7.8% |
| 30 to 34 Minutes | 5 | 9.8% |
| 35 to 39 Minutes | 5 | 9.8% |
| 40 to 44 Minutes | 2 | 3.9% |
| 45 to 59 Minutes | 3 | 5.9% |
| 60 to 89 Minutes | 3 | 5.9% |
| 90 or more Minutes | 5 | 9.8% |
Commute Time by Sex in Federal Dam
The most common commute times in Federal Dam are less than 5 minutes (7 commuters, 29.2%) for males and less than 5 minutes (10 commuters, 37.0%) for females.
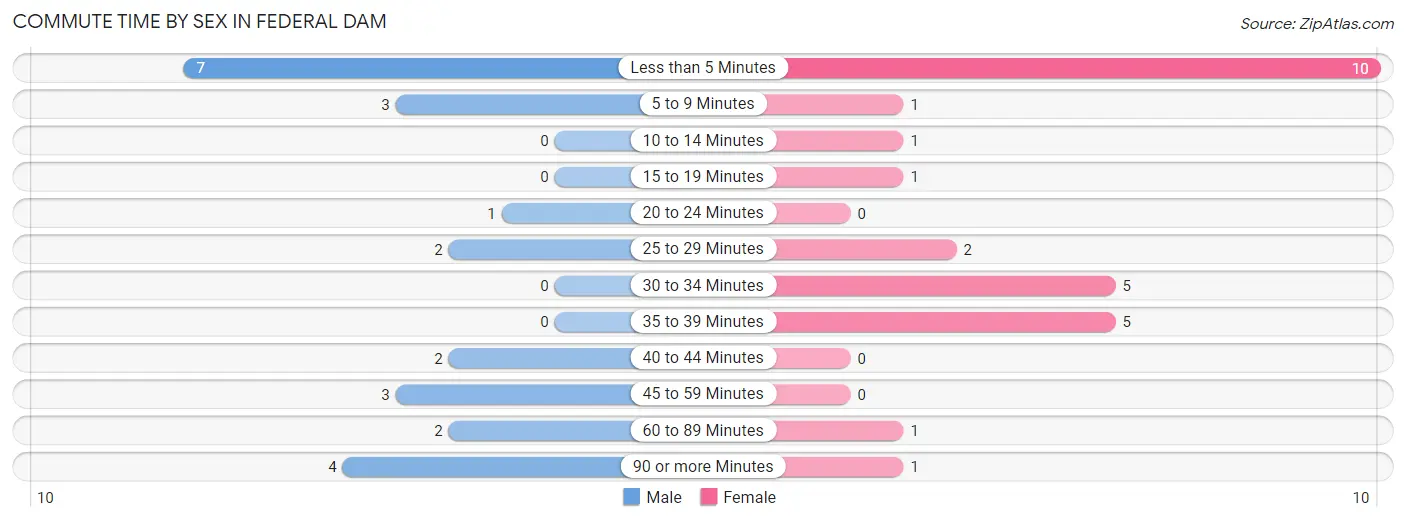
| Commute Time | Male | Female |
| Less than 5 Minutes | 7 (29.2%) | 10 (37.0%) |
| 5 to 9 Minutes | 3 (12.5%) | 1 (3.7%) |
| 10 to 14 Minutes | 0 (0.0%) | 1 (3.7%) |
| 15 to 19 Minutes | 0 (0.0%) | 1 (3.7%) |
| 20 to 24 Minutes | 1 (4.2%) | 0 (0.0%) |
| 25 to 29 Minutes | 2 (8.3%) | 2 (7.4%) |
| 30 to 34 Minutes | 0 (0.0%) | 5 (18.5%) |
| 35 to 39 Minutes | 0 (0.0%) | 5 (18.5%) |
| 40 to 44 Minutes | 2 (8.3%) | 0 (0.0%) |
| 45 to 59 Minutes | 3 (12.5%) | 0 (0.0%) |
| 60 to 89 Minutes | 2 (8.3%) | 1 (3.7%) |
| 90 or more Minutes | 4 (16.7%) | 1 (3.7%) |
Time of Departure to Work by Sex in Federal Dam
The most frequent times of departure to work in Federal Dam are 7:30 AM to 7:59 AM (5, 20.8%) for males and 6:00 AM to 6:29 AM (7, 25.9%) for females.
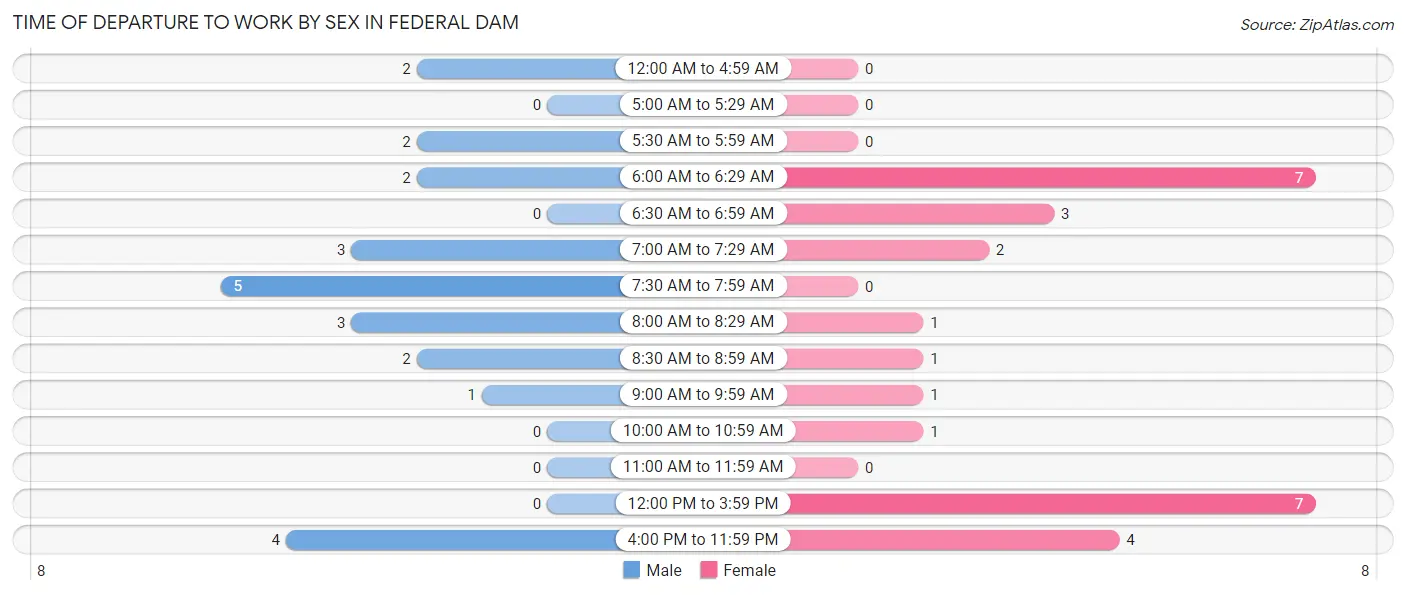
| Time of Departure | Male | Female |
| 12:00 AM to 4:59 AM | 2 (8.3%) | 0 (0.0%) |
| 5:00 AM to 5:29 AM | 0 (0.0%) | 0 (0.0%) |
| 5:30 AM to 5:59 AM | 2 (8.3%) | 0 (0.0%) |
| 6:00 AM to 6:29 AM | 2 (8.3%) | 7 (25.9%) |
| 6:30 AM to 6:59 AM | 0 (0.0%) | 3 (11.1%) |
| 7:00 AM to 7:29 AM | 3 (12.5%) | 2 (7.4%) |
| 7:30 AM to 7:59 AM | 5 (20.8%) | 0 (0.0%) |
| 8:00 AM to 8:29 AM | 3 (12.5%) | 1 (3.7%) |
| 8:30 AM to 8:59 AM | 2 (8.3%) | 1 (3.7%) |
| 9:00 AM to 9:59 AM | 1 (4.2%) | 1 (3.7%) |
| 10:00 AM to 10:59 AM | 0 (0.0%) | 1 (3.7%) |
| 11:00 AM to 11:59 AM | 0 (0.0%) | 0 (0.0%) |
| 12:00 PM to 3:59 PM | 0 (0.0%) | 7 (25.9%) |
| 4:00 PM to 11:59 PM | 4 (16.7%) | 4 (14.8%) |
| Total | 24 (100.0%) | 27 (100.0%) |
Housing Occupancy in Federal Dam
Occupancy by Ownership in Federal Dam
Of the total 54 dwellings in Federal Dam, owner-occupied units account for 37 (68.5%), while renter-occupied units make up 17 (31.5%).
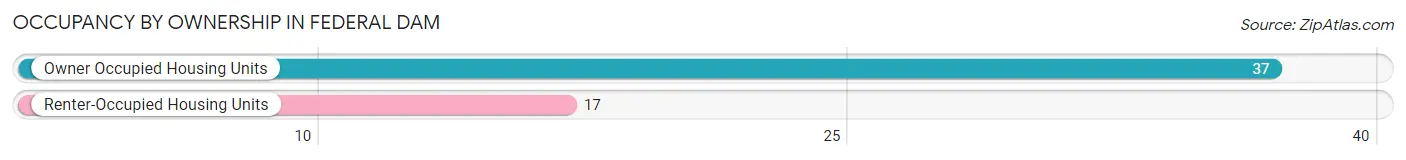
| Occupancy | # Housing Units | % Housing Units |
| Owner Occupied Housing Units | 37 | 68.5% |
| Renter-Occupied Housing Units | 17 | 31.5% |
| Total Occupied Housing Units | 54 | 100.0% |
Occupancy by Household Size in Federal Dam
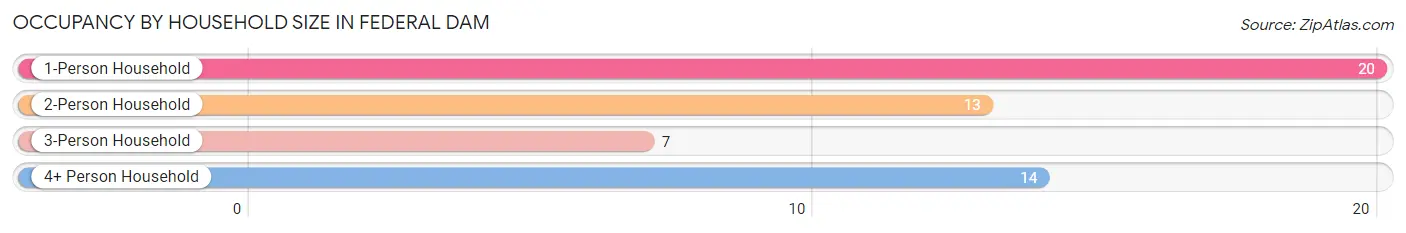
| Household Size | # Housing Units | % Housing Units |
| 1-Person Household | 20 | 37.0% |
| 2-Person Household | 13 | 24.1% |
| 3-Person Household | 7 | 13.0% |
| 4+ Person Household | 14 | 25.9% |
| Total Housing Units | 54 | 100.0% |
Occupancy by Ownership by Household Size in Federal Dam
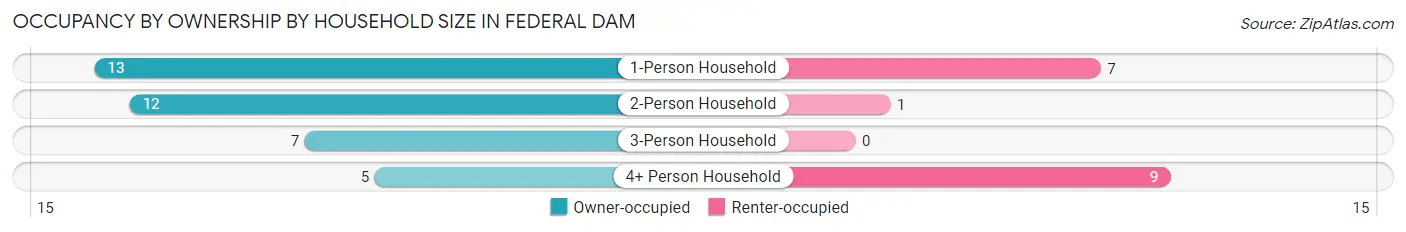
| Household Size | Owner-occupied | Renter-occupied |
| 1-Person Household | 13 (65.0%) | 7 (35.0%) |
| 2-Person Household | 12 (92.3%) | 1 (7.7%) |
| 3-Person Household | 7 (100.0%) | 0 (0.0%) |
| 4+ Person Household | 5 (35.7%) | 9 (64.3%) |
| Total Housing Units | 37 (68.5%) | 17 (31.5%) |
Occupancy by Educational Attainment in Federal Dam
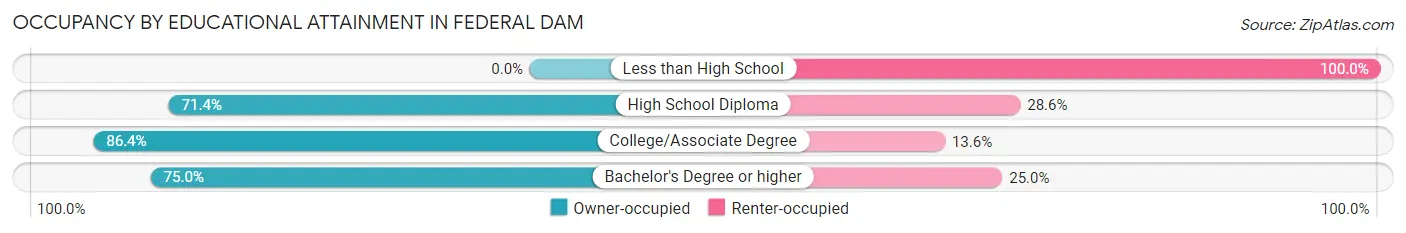
| Household Size | Owner-occupied | Renter-occupied |
| Less than High School | 0 (0.0%) | 7 (100.0%) |
| High School Diploma | 15 (71.4%) | 6 (28.6%) |
| College/Associate Degree | 19 (86.4%) | 3 (13.6%) |
| Bachelor's Degree or higher | 3 (75.0%) | 1 (25.0%) |
Occupancy by Age of Householder in Federal Dam
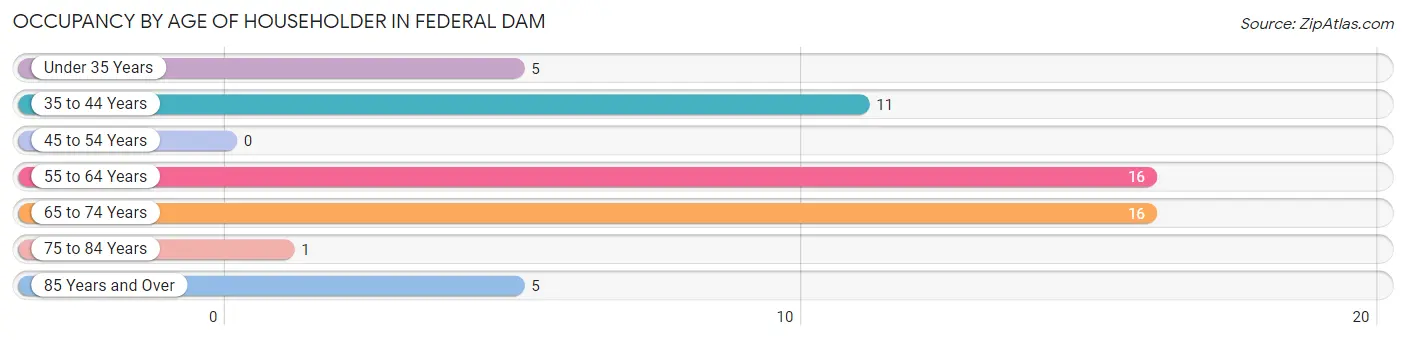
| Age Bracket | # Households | % Households |
| Under 35 Years | 5 | 9.3% |
| 35 to 44 Years | 11 | 20.4% |
| 45 to 54 Years | 0 | 0.0% |
| 55 to 64 Years | 16 | 29.6% |
| 65 to 74 Years | 16 | 29.6% |
| 75 to 84 Years | 1 | 1.8% |
| 85 Years and Over | 5 | 9.3% |
| Total | 54 | 100.0% |
Housing Finances in Federal Dam
Median Income by Occupancy in Federal Dam
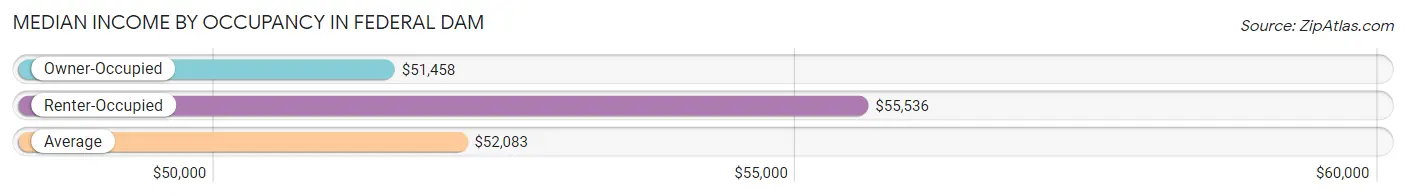
| Occupancy Type | # Households | Median Income |
| Owner-Occupied | 37 (68.5%) | $51,458 |
| Renter-Occupied | 17 (31.5%) | $55,536 |
| Average | 54 (100.0%) | $52,083 |
Occupancy by Householder Income Bracket in Federal Dam
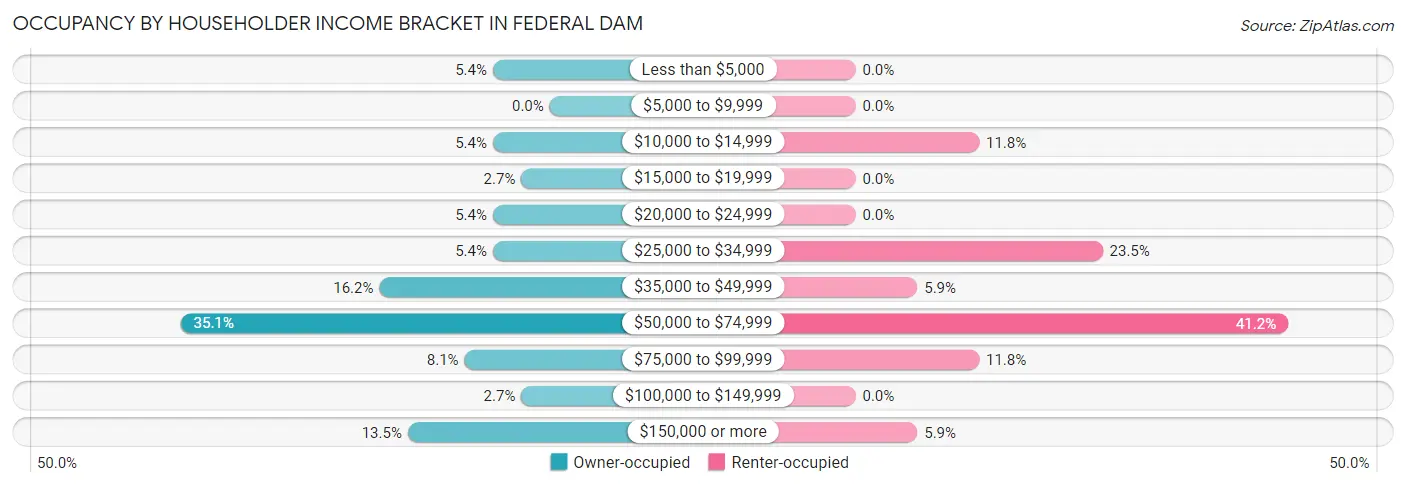
| Income Bracket | Owner-occupied | Renter-occupied |
| Less than $5,000 | 2 (5.4%) | 0 (0.0%) |
| $5,000 to $9,999 | 0 (0.0%) | 0 (0.0%) |
| $10,000 to $14,999 | 2 (5.4%) | 2 (11.8%) |
| $15,000 to $19,999 | 1 (2.7%) | 0 (0.0%) |
| $20,000 to $24,999 | 2 (5.4%) | 0 (0.0%) |
| $25,000 to $34,999 | 2 (5.4%) | 4 (23.5%) |
| $35,000 to $49,999 | 6 (16.2%) | 1 (5.9%) |
| $50,000 to $74,999 | 13 (35.1%) | 7 (41.2%) |
| $75,000 to $99,999 | 3 (8.1%) | 2 (11.8%) |
| $100,000 to $149,999 | 1 (2.7%) | 0 (0.0%) |
| $150,000 or more | 5 (13.5%) | 1 (5.9%) |
| Total | 37 (100.0%) | 17 (100.0%) |
Monthly Housing Cost Tiers in Federal Dam
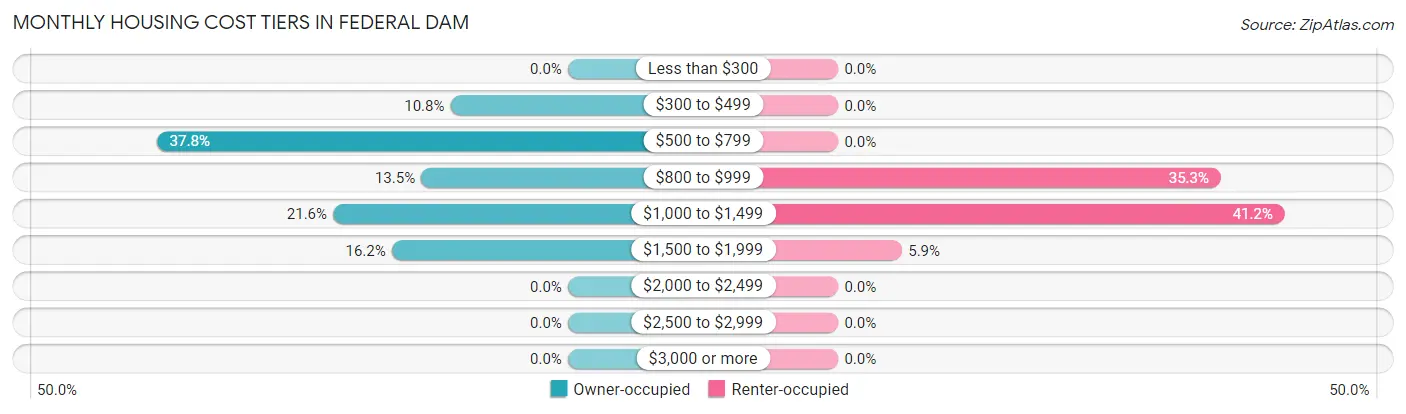
| Monthly Cost | Owner-occupied | Renter-occupied |
| Less than $300 | 0 (0.0%) | 0 (0.0%) |
| $300 to $499 | 4 (10.8%) | 0 (0.0%) |
| $500 to $799 | 14 (37.8%) | 0 (0.0%) |
| $800 to $999 | 5 (13.5%) | 6 (35.3%) |
| $1,000 to $1,499 | 8 (21.6%) | 7 (41.2%) |
| $1,500 to $1,999 | 6 (16.2%) | 1 (5.9%) |
| $2,000 to $2,499 | 0 (0.0%) | 0 (0.0%) |
| $2,500 to $2,999 | 0 (0.0%) | 0 (0.0%) |
| $3,000 or more | 0 (0.0%) | 0 (0.0%) |
| Total | 37 (100.0%) | 17 (100.0%) |
Physical Housing Characteristics in Federal Dam
Housing Structures in Federal Dam
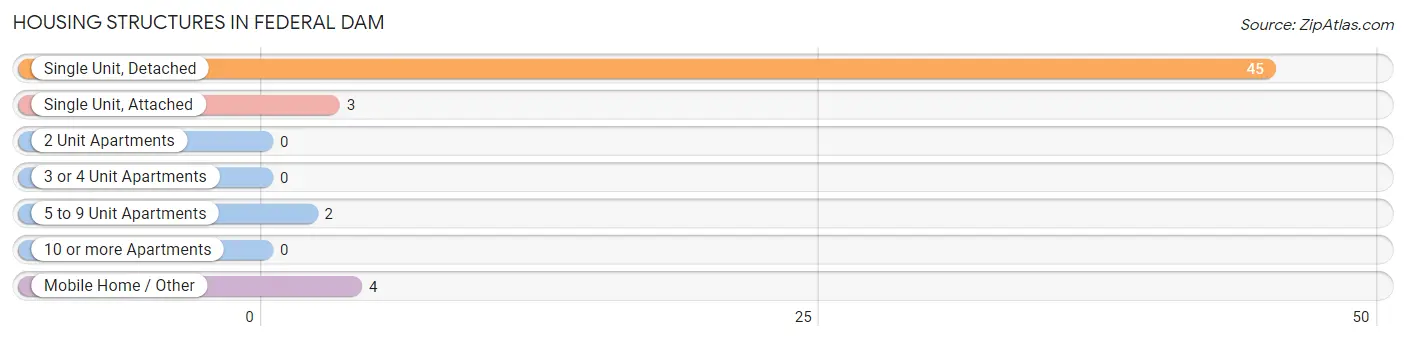
| Structure Type | # Housing Units | % Housing Units |
| Single Unit, Detached | 45 | 83.3% |
| Single Unit, Attached | 3 | 5.6% |
| 2 Unit Apartments | 0 | 0.0% |
| 3 or 4 Unit Apartments | 0 | 0.0% |
| 5 to 9 Unit Apartments | 2 | 3.7% |
| 10 or more Apartments | 0 | 0.0% |
| Mobile Home / Other | 4 | 7.4% |
| Total | 54 | 100.0% |
Housing Structures by Occupancy in Federal Dam
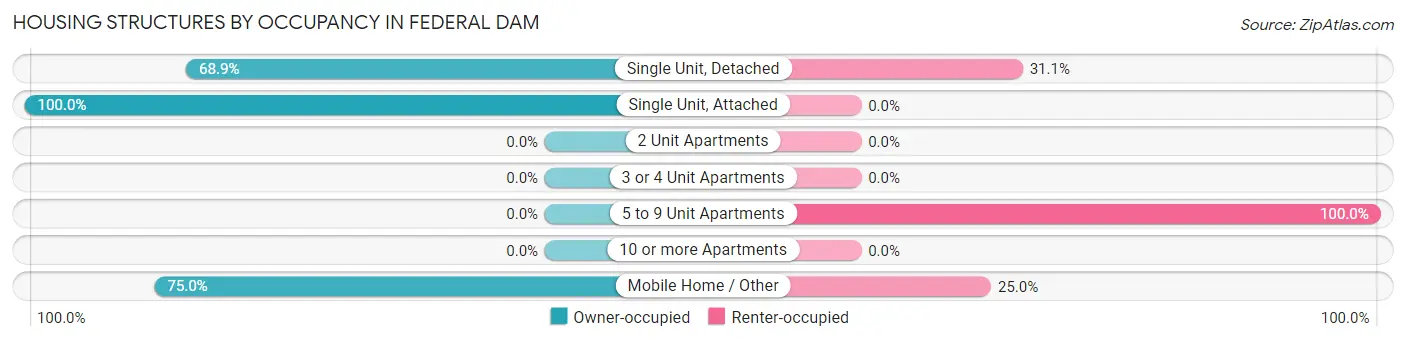
| Structure Type | Owner-occupied | Renter-occupied |
| Single Unit, Detached | 31 (68.9%) | 14 (31.1%) |
| Single Unit, Attached | 3 (100.0%) | 0 (0.0%) |
| 2 Unit Apartments | 0 (0.0%) | 0 (0.0%) |
| 3 or 4 Unit Apartments | 0 (0.0%) | 0 (0.0%) |
| 5 to 9 Unit Apartments | 0 (0.0%) | 2 (100.0%) |
| 10 or more Apartments | 0 (0.0%) | 0 (0.0%) |
| Mobile Home / Other | 3 (75.0%) | 1 (25.0%) |
| Total | 37 (68.5%) | 17 (31.5%) |
Housing Structures by Number of Rooms in Federal Dam
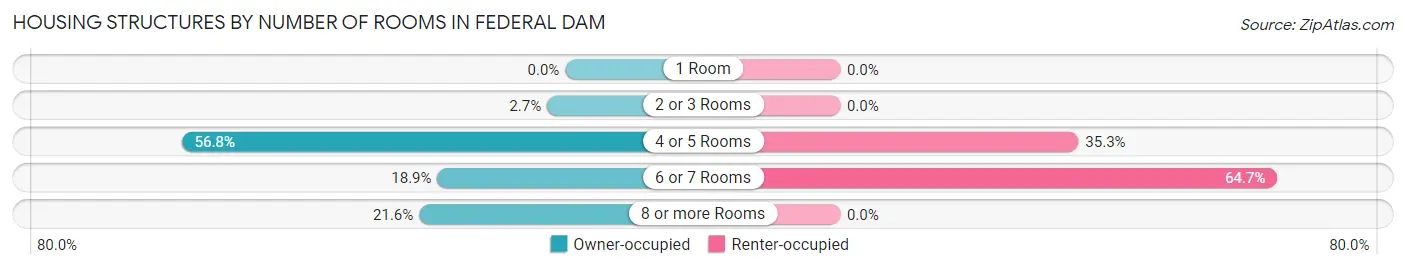
| Number of Rooms | Owner-occupied | Renter-occupied |
| 1 Room | 0 (0.0%) | 0 (0.0%) |
| 2 or 3 Rooms | 1 (2.7%) | 0 (0.0%) |
| 4 or 5 Rooms | 21 (56.8%) | 6 (35.3%) |
| 6 or 7 Rooms | 7 (18.9%) | 11 (64.7%) |
| 8 or more Rooms | 8 (21.6%) | 0 (0.0%) |
| Total | 37 (100.0%) | 17 (100.0%) |
Housing Structure by Heating Type in Federal Dam
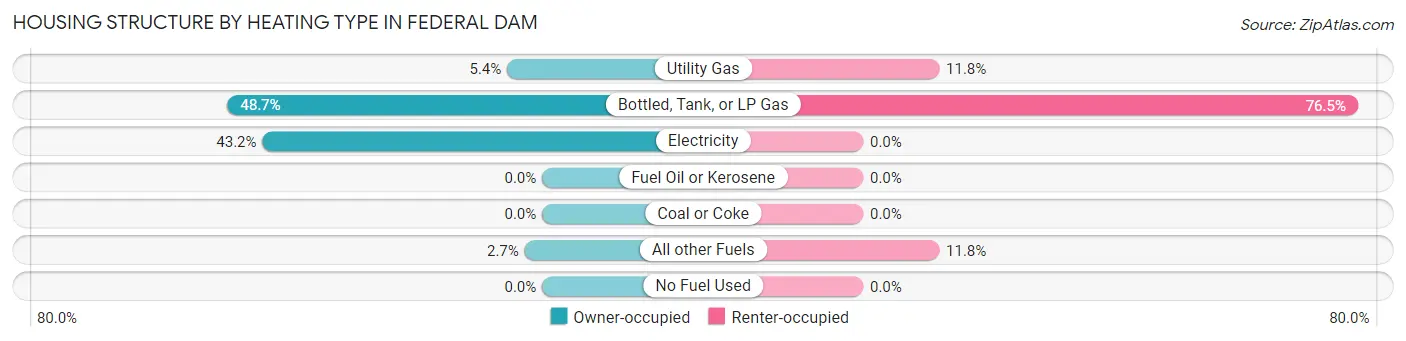
| Heating Type | Owner-occupied | Renter-occupied |
| Utility Gas | 2 (5.4%) | 2 (11.8%) |
| Bottled, Tank, or LP Gas | 18 (48.6%) | 13 (76.5%) |
| Electricity | 16 (43.2%) | 0 (0.0%) |
| Fuel Oil or Kerosene | 0 (0.0%) | 0 (0.0%) |
| Coal or Coke | 0 (0.0%) | 0 (0.0%) |
| All other Fuels | 1 (2.7%) | 2 (11.8%) |
| No Fuel Used | 0 (0.0%) | 0 (0.0%) |
| Total | 37 (100.0%) | 17 (100.0%) |
Household Vehicle Usage in Federal Dam
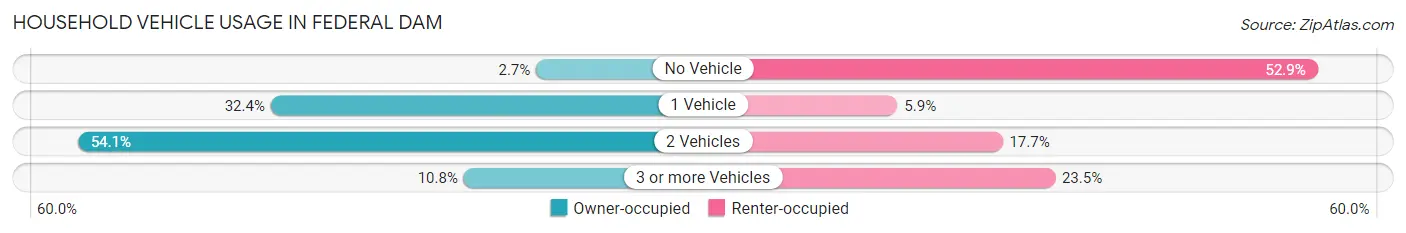
| Vehicles per Household | Owner-occupied | Renter-occupied |
| No Vehicle | 1 (2.7%) | 9 (52.9%) |
| 1 Vehicle | 12 (32.4%) | 1 (5.9%) |
| 2 Vehicles | 20 (54.0%) | 3 (17.6%) |
| 3 or more Vehicles | 4 (10.8%) | 4 (23.5%) |
| Total | 37 (100.0%) | 17 (100.0%) |
Real Estate & Mortgages in Federal Dam
Real Estate and Mortgage Overview in Federal Dam
| Characteristic | Without Mortgage | With Mortgage |
| Housing Units | 21 | 16 |
| Median Property Value | $156,300 | $137,500 |
| Median Household Income | $44,375 | $3 |
| Monthly Housing Costs | $745 | $0 |
| Real Estate Taxes | $517 | $1 |
Property Value by Mortgage Status in Federal Dam
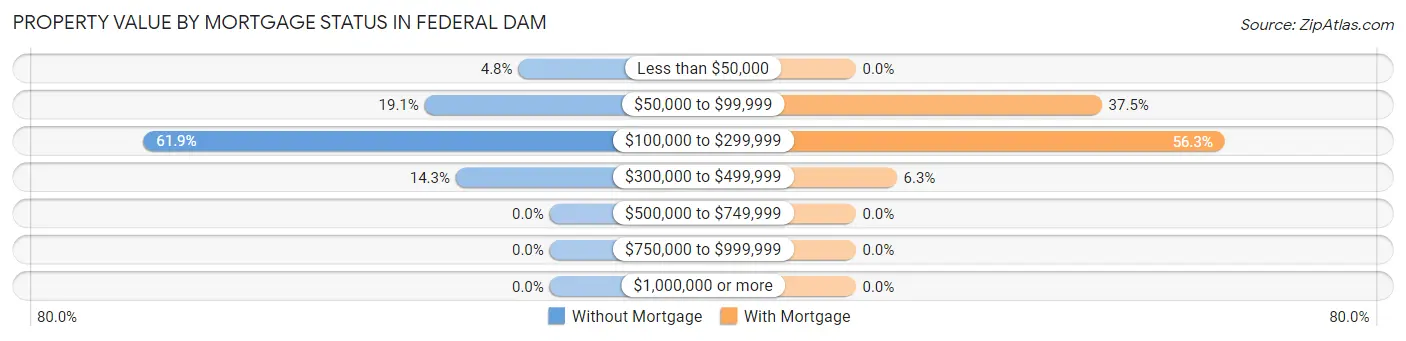
| Property Value | Without Mortgage | With Mortgage |
| Less than $50,000 | 1 (4.8%) | 0 (0.0%) |
| $50,000 to $99,999 | 4 (19.1%) | 6 (37.5%) |
| $100,000 to $299,999 | 13 (61.9%) | 9 (56.2%) |
| $300,000 to $499,999 | 3 (14.3%) | 1 (6.2%) |
| $500,000 to $749,999 | 0 (0.0%) | 0 (0.0%) |
| $750,000 to $999,999 | 0 (0.0%) | 0 (0.0%) |
| $1,000,000 or more | 0 (0.0%) | 0 (0.0%) |
| Total | 21 (100.0%) | 16 (100.0%) |
Household Income by Mortgage Status in Federal Dam
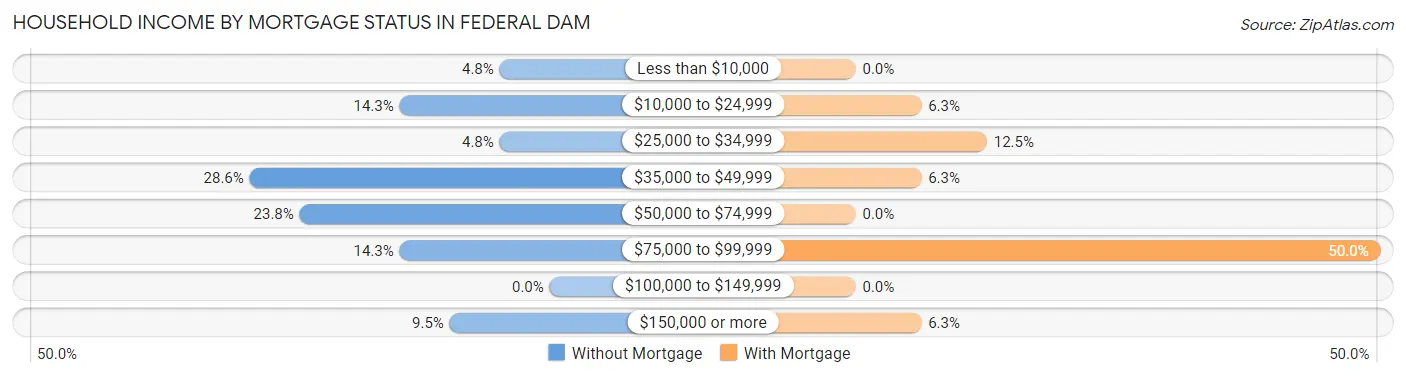
| Household Income | Without Mortgage | With Mortgage |
| Less than $10,000 | 1 (4.8%) | 0 (0.0%) |
| $10,000 to $24,999 | 3 (14.3%) | 1 (6.2%) |
| $25,000 to $34,999 | 1 (4.8%) | 2 (12.5%) |
| $35,000 to $49,999 | 6 (28.6%) | 1 (6.2%) |
| $50,000 to $74,999 | 5 (23.8%) | 0 (0.0%) |
| $75,000 to $99,999 | 3 (14.3%) | 8 (50.0%) |
| $100,000 to $149,999 | 0 (0.0%) | 0 (0.0%) |
| $150,000 or more | 2 (9.5%) | 1 (6.2%) |
| Total | 21 (100.0%) | 16 (100.0%) |
Property Value to Household Income Ratio in Federal Dam
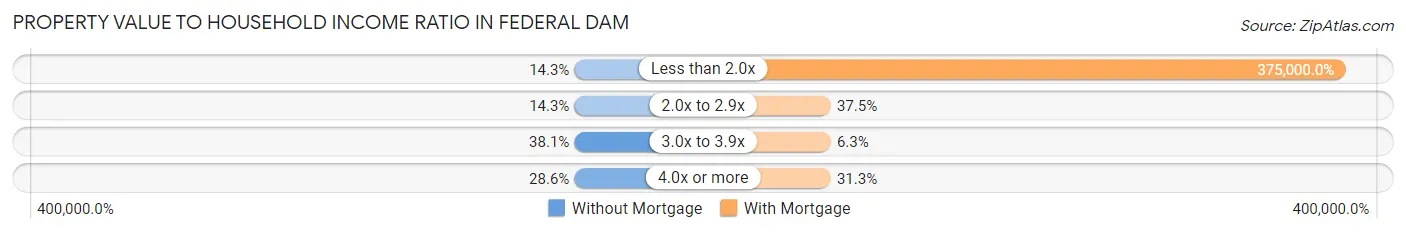
| Value-to-Income Ratio | Without Mortgage | With Mortgage |
| Less than 2.0x | 3 (14.3%) | 60,000 (375,000.0%) |
| 2.0x to 2.9x | 3 (14.3%) | 6 (37.5%) |
| 3.0x to 3.9x | 8 (38.1%) | 1 (6.2%) |
| 4.0x or more | 6 (28.6%) | 5 (31.2%) |
| Total | 21 (100.0%) | 16 (100.0%) |
Real Estate Taxes by Mortgage Status in Federal Dam
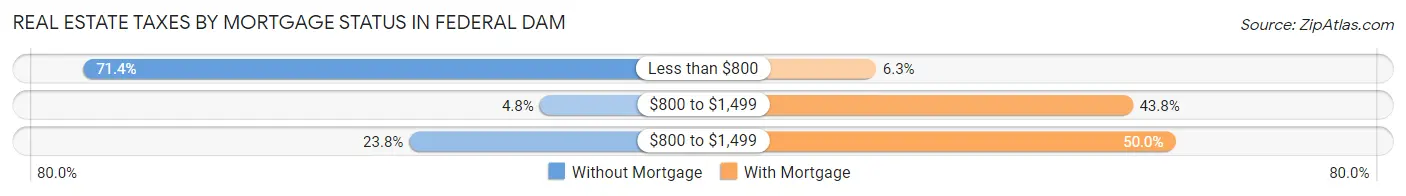
| Property Taxes | Without Mortgage | With Mortgage |
| Less than $800 | 15 (71.4%) | 1 (6.2%) |
| $800 to $1,499 | 1 (4.8%) | 7 (43.8%) |
| $800 to $1,499 | 5 (23.8%) | 8 (50.0%) |
| Total | 21 (100.0%) | 16 (100.0%) |
Health & Disability in Federal Dam
Health Insurance Coverage by Age in Federal Dam
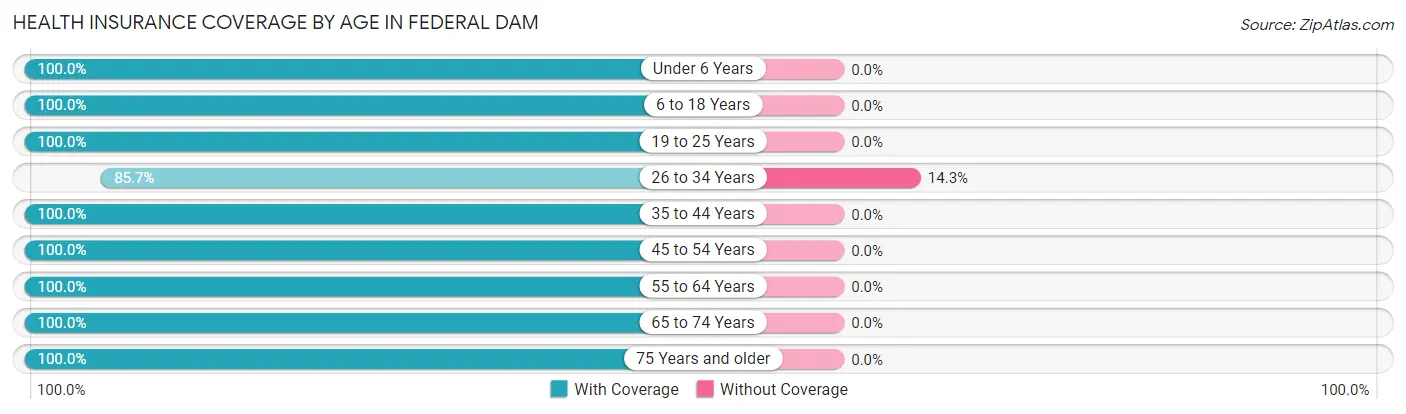
| Age Bracket | With Coverage | Without Coverage |
| Under 6 Years | 25 (100.0%) | 0 (0.0%) |
| 6 to 18 Years | 32 (100.0%) | 0 (0.0%) |
| 19 to 25 Years | 5 (100.0%) | 0 (0.0%) |
| 26 to 34 Years | 12 (85.7%) | 2 (14.3%) |
| 35 to 44 Years | 19 (100.0%) | 0 (0.0%) |
| 45 to 54 Years | 2 (100.0%) | 0 (0.0%) |
| 55 to 64 Years | 27 (100.0%) | 0 (0.0%) |
| 65 to 74 Years | 26 (100.0%) | 0 (0.0%) |
| 75 Years and older | 8 (100.0%) | 0 (0.0%) |
| Total | 156 (98.7%) | 2 (1.3%) |
Health Insurance Coverage by Citizenship Status in Federal Dam
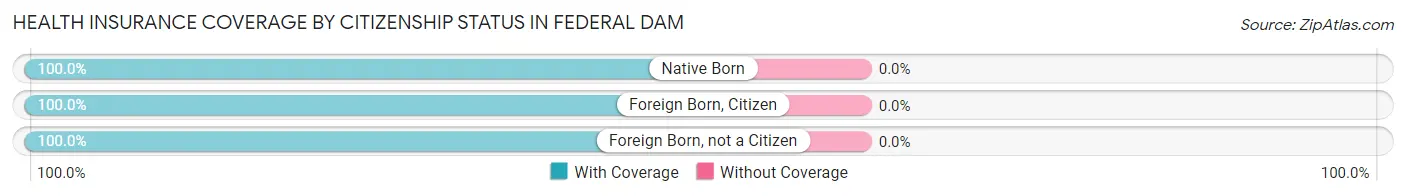
| Citizenship Status | With Coverage | Without Coverage |
| Native Born | 25 (100.0%) | 0 (0.0%) |
| Foreign Born, Citizen | 32 (100.0%) | 0 (0.0%) |
| Foreign Born, not a Citizen | 5 (100.0%) | 0 (0.0%) |
Health Insurance Coverage by Household Income in Federal Dam
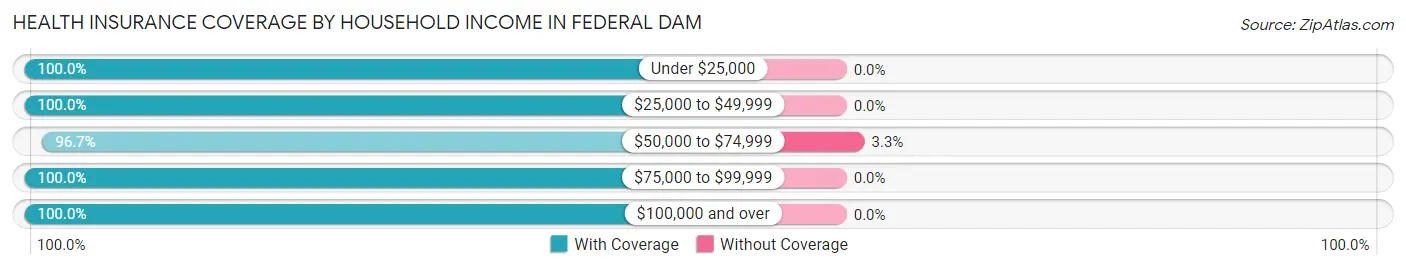
| Household Income | With Coverage | Without Coverage |
| Under $25,000 | 13 (100.0%) | 0 (0.0%) |
| $25,000 to $49,999 | 27 (100.0%) | 0 (0.0%) |
| $50,000 to $74,999 | 58 (96.7%) | 2 (3.3%) |
| $75,000 to $99,999 | 27 (100.0%) | 0 (0.0%) |
| $100,000 and over | 31 (100.0%) | 0 (0.0%) |
Public vs Private Health Insurance Coverage by Age in Federal Dam
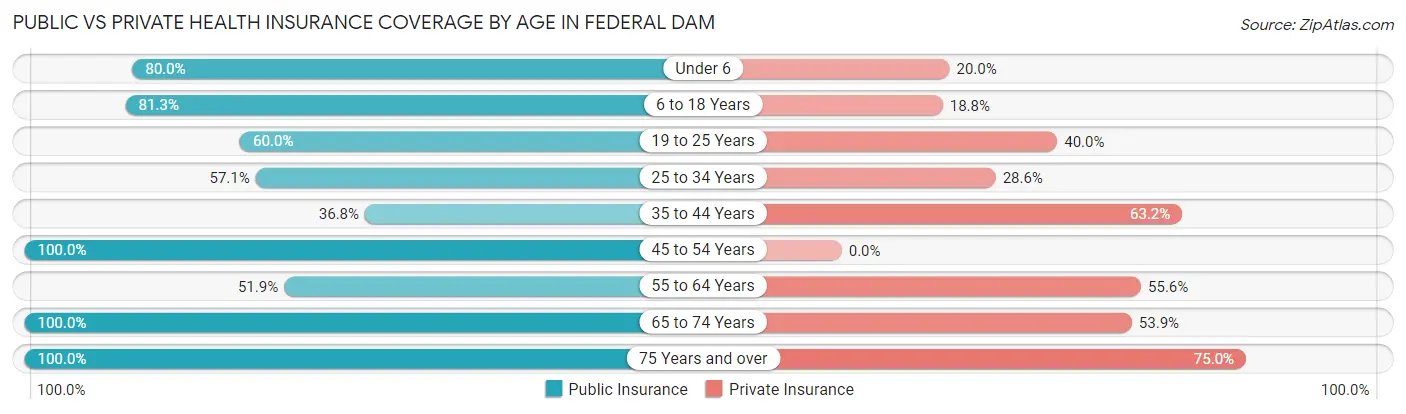
| Age Bracket | Public Insurance | Private Insurance |
| Under 6 | 20 (80.0%) | 5 (20.0%) |
| 6 to 18 Years | 26 (81.2%) | 6 (18.8%) |
| 19 to 25 Years | 3 (60.0%) | 2 (40.0%) |
| 25 to 34 Years | 8 (57.1%) | 4 (28.6%) |
| 35 to 44 Years | 7 (36.8%) | 12 (63.2%) |
| 45 to 54 Years | 2 (100.0%) | 0 (0.0%) |
| 55 to 64 Years | 14 (51.8%) | 15 (55.6%) |
| 65 to 74 Years | 26 (100.0%) | 14 (53.8%) |
| 75 Years and over | 8 (100.0%) | 6 (75.0%) |
| Total | 114 (72.2%) | 64 (40.5%) |
Disability Status by Sex by Age in Federal Dam
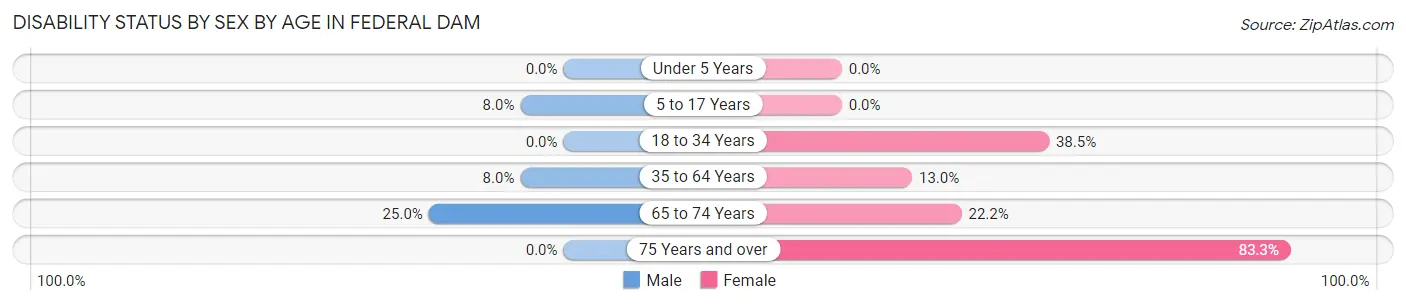
| Age Bracket | Male | Female |
| Under 5 Years | 0 (0.0%) | 0 (0.0%) |
| 5 to 17 Years | 2 (8.0%) | 0 (0.0%) |
| 18 to 34 Years | 0 (0.0%) | 5 (38.5%) |
| 35 to 64 Years | 2 (8.0%) | 3 (13.0%) |
| 65 to 74 Years | 2 (25.0%) | 4 (22.2%) |
| 75 Years and over | 0 (0.0%) | 5 (83.3%) |
Disability Class by Sex by Age in Federal Dam
Disability Class: Hearing Difficulty
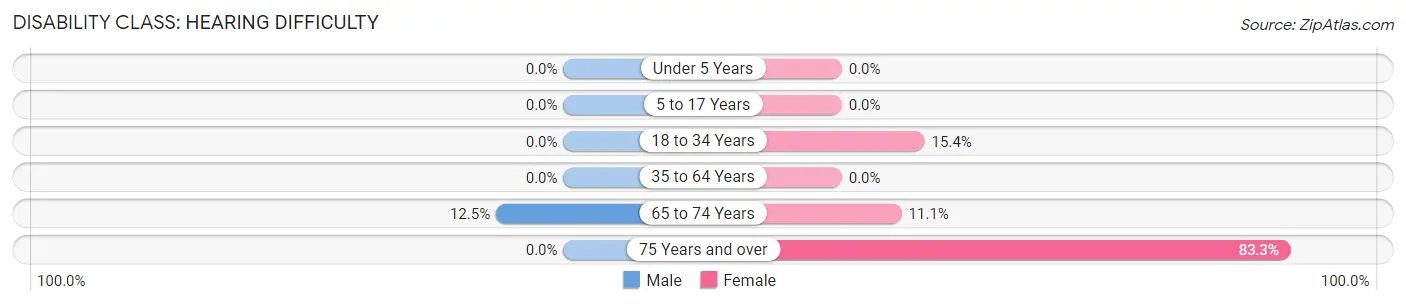
| Age Bracket | Male | Female |
| Under 5 Years | 0 (0.0%) | 0 (0.0%) |
| 5 to 17 Years | 0 (0.0%) | 0 (0.0%) |
| 18 to 34 Years | 0 (0.0%) | 2 (15.4%) |
| 35 to 64 Years | 0 (0.0%) | 0 (0.0%) |
| 65 to 74 Years | 1 (12.5%) | 2 (11.1%) |
| 75 Years and over | 0 (0.0%) | 5 (83.3%) |
Disability Class: Vision Difficulty
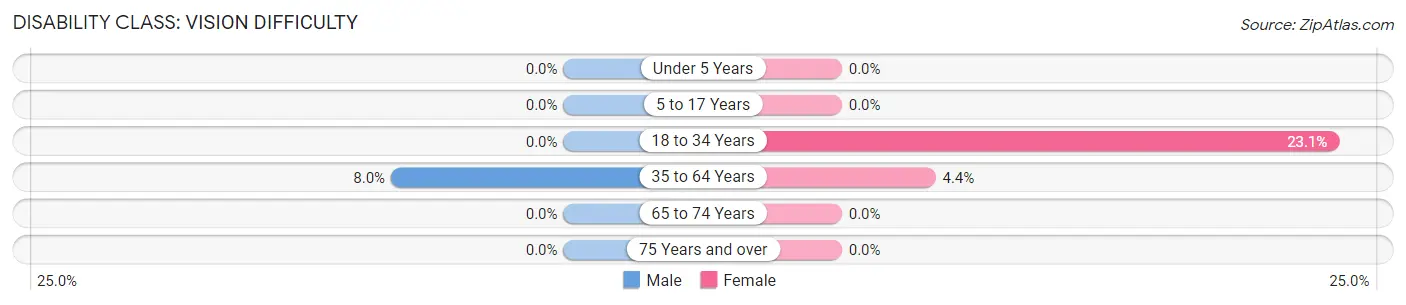
| Age Bracket | Male | Female |
| Under 5 Years | 0 (0.0%) | 0 (0.0%) |
| 5 to 17 Years | 0 (0.0%) | 0 (0.0%) |
| 18 to 34 Years | 0 (0.0%) | 3 (23.1%) |
| 35 to 64 Years | 2 (8.0%) | 1 (4.3%) |
| 65 to 74 Years | 0 (0.0%) | 0 (0.0%) |
| 75 Years and over | 0 (0.0%) | 0 (0.0%) |
Disability Class: Cognitive Difficulty
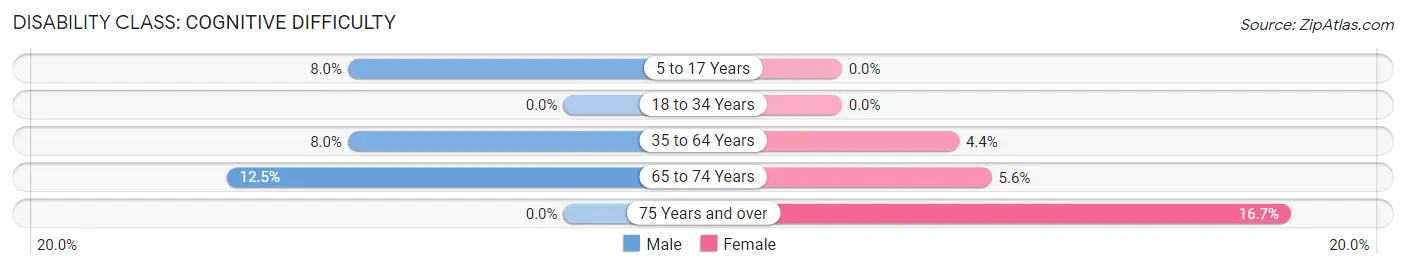
| Age Bracket | Male | Female |
| 5 to 17 Years | 2 (8.0%) | 0 (0.0%) |
| 18 to 34 Years | 0 (0.0%) | 0 (0.0%) |
| 35 to 64 Years | 2 (8.0%) | 1 (4.3%) |
| 65 to 74 Years | 1 (12.5%) | 1 (5.6%) |
| 75 Years and over | 0 (0.0%) | 1 (16.7%) |
Disability Class: Ambulatory Difficulty
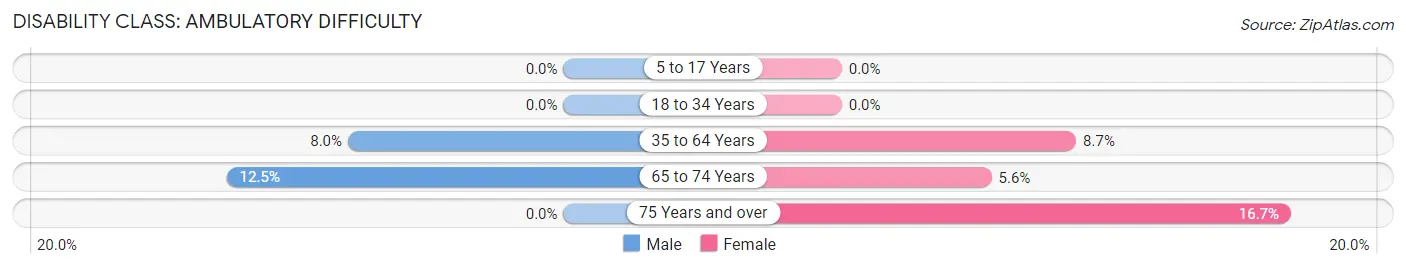
| Age Bracket | Male | Female |
| 5 to 17 Years | 0 (0.0%) | 0 (0.0%) |
| 18 to 34 Years | 0 (0.0%) | 0 (0.0%) |
| 35 to 64 Years | 2 (8.0%) | 2 (8.7%) |
| 65 to 74 Years | 1 (12.5%) | 1 (5.6%) |
| 75 Years and over | 0 (0.0%) | 1 (16.7%) |
Disability Class: Self-Care Difficulty
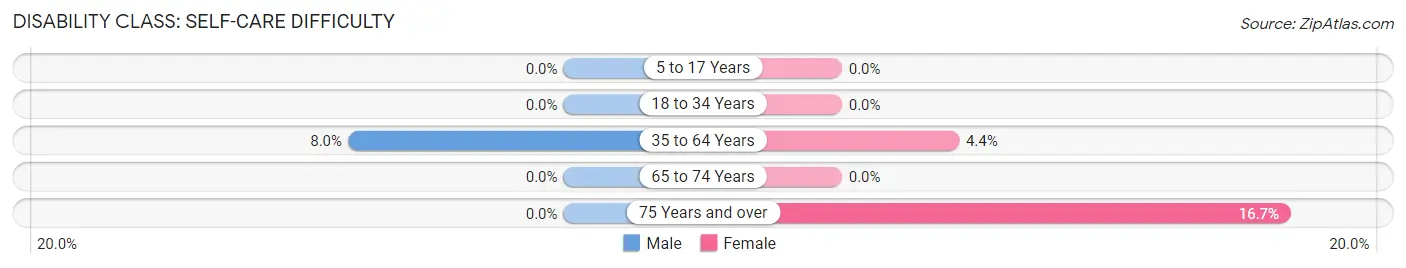
| Age Bracket | Male | Female |
| 5 to 17 Years | 0 (0.0%) | 0 (0.0%) |
| 18 to 34 Years | 0 (0.0%) | 0 (0.0%) |
| 35 to 64 Years | 2 (8.0%) | 1 (4.3%) |
| 65 to 74 Years | 0 (0.0%) | 0 (0.0%) |
| 75 Years and over | 0 (0.0%) | 1 (16.7%) |
Technology Access in Federal Dam
Computing Device Access in Federal Dam
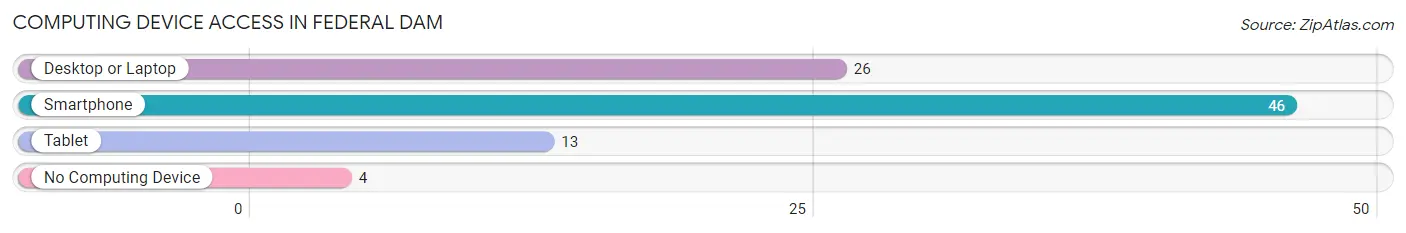
| Device Type | # Households | % Households |
| Desktop or Laptop | 26 | 48.1% |
| Smartphone | 46 | 85.2% |
| Tablet | 13 | 24.1% |
| No Computing Device | 4 | 7.4% |
| Total | 54 | 100.0% |
Internet Access in Federal Dam
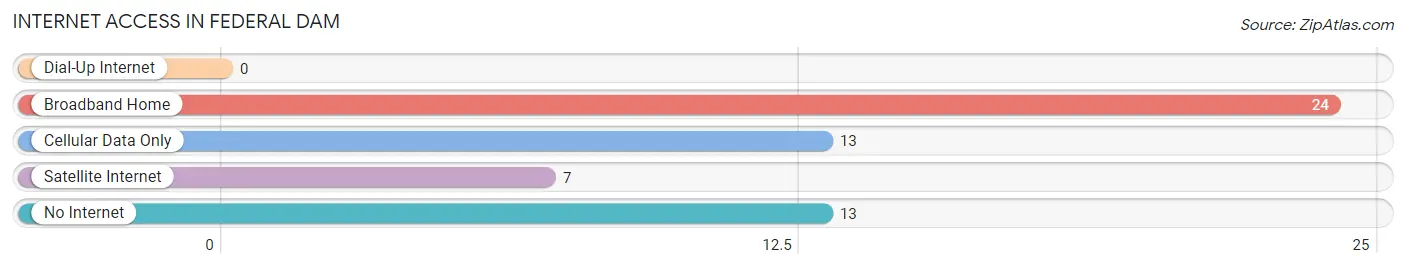
| Internet Type | # Households | % Households |
| Dial-Up Internet | 0 | 0.0% |
| Broadband Home | 24 | 44.4% |
| Cellular Data Only | 13 | 24.1% |
| Satellite Internet | 7 | 13.0% |
| No Internet | 13 | 24.1% |
| Total | 54 | 100.0% |
Federal Dam Summary
History
Federal Dam is a small unincorporated community located in Cass County, Minnesota. It is situated on the shores of Leech Lake, the third largest lake in the state. The area was first settled in the late 1800s by a group of loggers and farmers. The town was originally known as "Federal Point" and was later changed to "Federal Dam" when the U.S. Army Corps of Engineers built a dam on the lake in the early 1900s.
The town was officially incorporated in 1910 and was home to a variety of businesses, including a sawmill, a general store, a hotel, and a post office. The town also had a school, a church, and a few other small businesses.
The town was a popular tourist destination in the early 1900s, with visitors coming to fish, hunt, and enjoy the scenery. The town was also home to a number of resorts, including the Federal Dam Resort, which was built in the 1920s and is still in operation today.
The town was also home to a number of Native American tribes, including the Ojibwe, Dakota, and Cree. The tribes had a long history in the area and were known for their fishing and hunting skills.
Geography
Federal Dam is located in Cass County, Minnesota, on the shores of Leech Lake. The town is situated on the western side of the lake, near the outlet of the Mississippi River. The town is surrounded by forests and wetlands, and is home to a variety of wildlife, including deer, bear, and bald eagles.
The town is located approximately 30 miles north of Brainerd, Minnesota, and is accessible by car via U.S. Highway 2. The nearest major airport is Minneapolis-St. Paul International Airport, which is about two hours away.
Economy
The economy of Federal Dam is largely based on tourism and recreation. The town is home to a number of resorts, including the Federal Dam Resort, which offers a variety of activities, including fishing, boating, and swimming. The town is also home to a number of restaurants, bars, and other businesses that cater to tourists.
The town is also home to a number of small businesses, including a general store, a hardware store, and a few other small shops. The town is also home to a number of Native American businesses, including a casino and a smoke shop.
Demographics
As of the 2010 census, the population of Federal Dam was 545. The town is predominantly white, with a small percentage of Native American residents. The median household income in the town is $37,500, and the median home value is $125,000. The town has a poverty rate of 16.7%, which is higher than the national average.
Conclusion
Federal Dam is a small unincorporated community located in Cass County, Minnesota. It is situated on the shores of Leech Lake and is home to a variety of businesses, including resorts, restaurants, and other small businesses. The town is also home to a number of Native American businesses, including a casino and a smoke shop. The town has a population of 545, with a median household income of $37,500 and a median home value of $125,000. The town has a poverty rate of 16.7%, which is higher than the national average.
Common Questions
What is Per Capita Income in Federal Dam?
Per Capita income in Federal Dam is $24,278.
What is the Median Family Income in Federal Dam?
Median Family Income in Federal Dam is $56,607.
What is the Median Household income in Federal Dam?
Median Household Income in Federal Dam is $52,083.
What is Income or Wage Gap in Federal Dam?
Income or Wage Gap in Federal Dam is 20.3%.
Women in Federal Dam earn 79.7 cents for every dollar earned by a man.
What is Inequality or Gini Index in Federal Dam?
Inequality or Gini Index in Federal Dam is 0.42.
What is the Total Population of Federal Dam?
Total Population of Federal Dam is 158.
What is the Total Male Population of Federal Dam?
Total Male Population of Federal Dam is 75.
What is the Total Female Population of Federal Dam?
Total Female Population of Federal Dam is 83.
What is the Ratio of Males per 100 Females in Federal Dam?
There are 90.36 Males per 100 Females in Federal Dam.
What is the Ratio of Females per 100 Males in Federal Dam?
There are 110.67 Females per 100 Males in Federal Dam.
What is the Median Population Age in Federal Dam?
Median Population Age in Federal Dam is 36.3 Years.
What is the Average Family Size in Federal Dam
Average Family Size in Federal Dam is 4.2 People.
What is the Average Household Size in Federal Dam
Average Household Size in Federal Dam is 2.9 People.
How Large is the Labor Force in Federal Dam?
There are 59 People in the Labor Forcein in Federal Dam.
What is the Percentage of People in the Labor Force in Federal Dam?
54.1% of People are in the Labor Force in Federal Dam.
What is the Unemployment Rate in Federal Dam?
Unemployment Rate in Federal Dam is 6.8%.