Zip Codes with the Highest Percentage of Population Employed in Administrative & Support Services in Saint Paul, MN
RELATED REPORTS & OPTIONS
Administrative & Support Services
Saint Paul
Compare Zip Codes
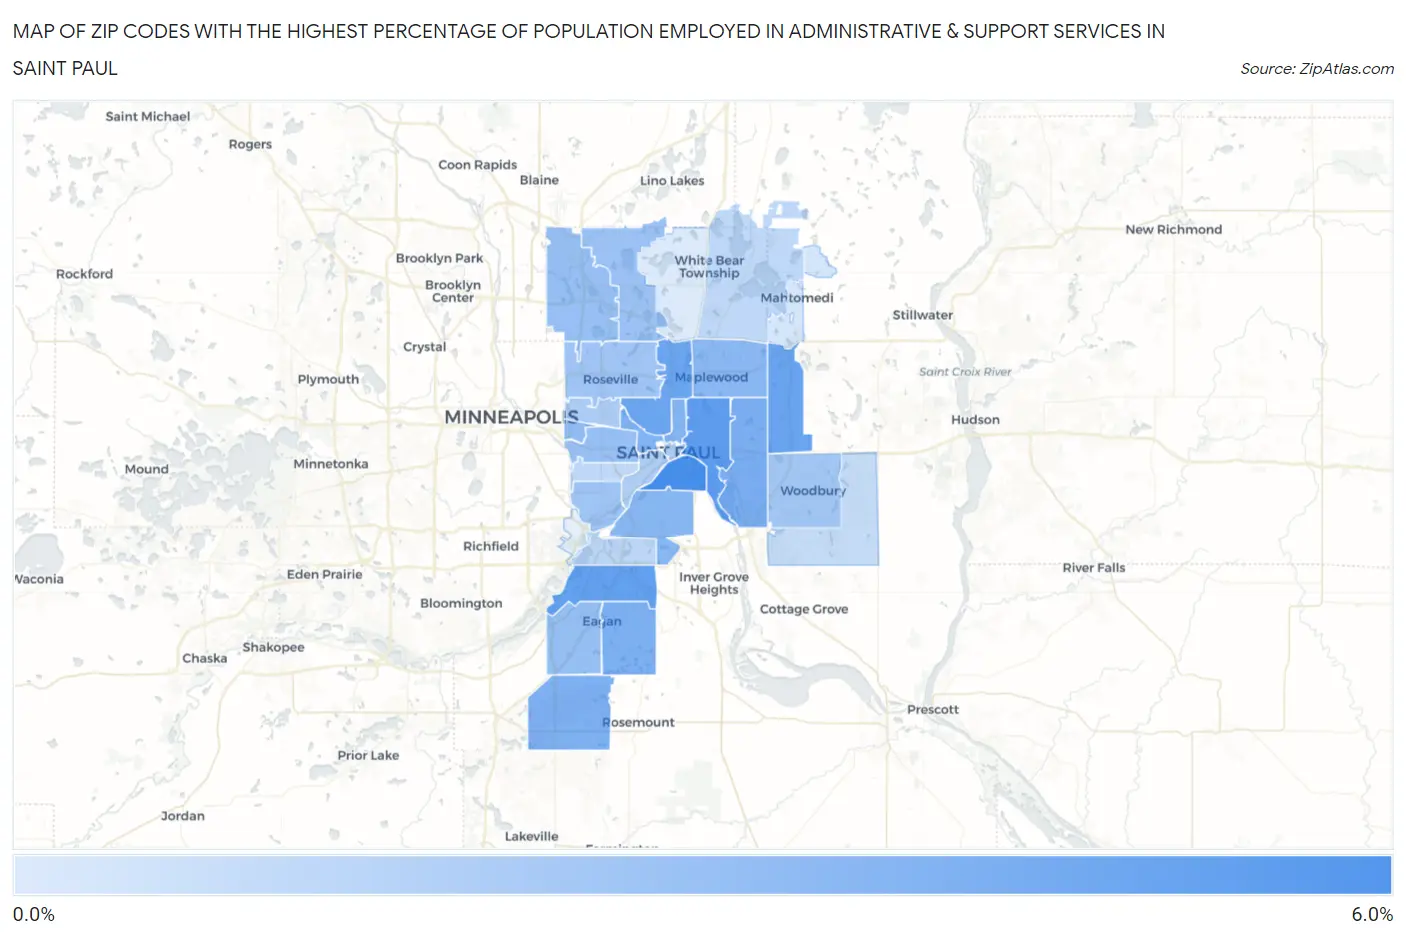
Map of Zip Codes with the Highest Percentage of Population Employed in Administrative & Support Services in Saint Paul
0.95%
5.8%
Zip Codes with the Highest Percentage of Population Employed in Administrative & Support Services in Saint Paul, MN
| Zip Code | % Employed | vs State | vs National | |
| 1. | 55107 | 5.8% | 3.0%(+2.75)#44 | 4.1%(+1.64)#5,165 |
| 2. | 55106 | 5.0% | 3.0%(+1.98)#73 | 4.1%(+0.871)#7,051 |
| 3. | 55121 | 4.9% | 3.0%(+1.83)#80 | 4.1%(+0.720)#7,505 |
| 4. | 55128 | 4.6% | 3.0%(+1.61)#91 | 4.1%(+0.499)#8,193 |
| 5. | 55117 | 4.6% | 3.0%(+1.56)#95 | 4.1%(+0.454)#8,363 |
| 6. | 55119 | 4.1% | 3.0%(+1.09)#130 | 4.1%(-0.014)#10,099 |
| 7. | 55123 | 4.0% | 3.0%(+0.994)#139 | 4.1%(-0.114)#10,532 |
| 8. | 55124 | 4.0% | 3.0%(+0.962)#142 | 4.1%(-0.145)#10,669 |
| 9. | 55103 | 3.9% | 3.0%(+0.885)#148 | 4.1%(-0.223)#10,978 |
| 10. | 55130 | 3.8% | 3.0%(+0.802)#161 | 4.1%(-0.306)#11,348 |
| 11. | 55118 | 3.6% | 3.0%(+0.605)#182 | 4.1%(-0.502)#12,248 |
| 12. | 55109 | 3.6% | 3.0%(+0.579)#187 | 4.1%(-0.529)#12,377 |
| 13. | 55114 | 3.4% | 3.0%(+0.361)#220 | 4.1%(-0.747)#13,422 |
| 14. | 55122 | 3.2% | 3.0%(+0.202)#249 | 4.1%(-0.906)#14,234 |
| 15. | 55104 | 3.2% | 3.0%(+0.127)#260 | 4.1%(-0.981)#14,633 |
| 16. | 55112 | 3.1% | 3.0%(+0.087)#269 | 4.1%(-1.02)#14,837 |
| 17. | 55126 | 3.0% | 3.0%(-0.002)#282 | 4.1%(-1.11)#15,277 |
| 18. | 55116 | 2.9% | 3.0%(-0.098)#298 | 4.1%(-1.21)#15,769 |
| 19. | 55113 | 2.9% | 3.0%(-0.180)#308 | 4.1%(-1.29)#16,191 |
| 20. | 55125 | 2.8% | 3.0%(-0.276)#332 | 4.1%(-1.38)#16,741 |
| 21. | 55101 | 2.6% | 3.0%(-0.446)#359 | 4.1%(-1.55)#17,632 |
| 22. | 55108 | 2.5% | 3.0%(-0.541)#383 | 4.1%(-1.65)#18,128 |
| 23. | 55102 | 2.4% | 3.0%(-0.655)#416 | 4.1%(-1.76)#18,723 |
| 24. | 55120 | 2.0% | 3.0%(-1.08)#515 | 4.1%(-2.19)#20,820 |
| 25. | 55110 | 1.9% | 3.0%(-1.11)#523 | 4.1%(-2.22)#20,934 |
| 26. | 55105 | 1.9% | 3.0%(-1.12)#526 | 4.1%(-2.23)#20,968 |
| 27. | 55129 | 1.7% | 3.0%(-1.35)#571 | 4.1%(-2.45)#21,978 |
| 28. | 55115 | 1.2% | 3.0%(-1.89)#671 | 4.1%(-2.99)#23,993 |
| 29. | 55127 | 0.95% | 3.0%(-2.10)#702 | 4.1%(-3.20)#24,680 |
1
Common Questions
What are the Top 10 Zip Codes with the Highest Percentage of Population Employed in Administrative & Support Services in Saint Paul, MN?
Top 10 Zip Codes with the Highest Percentage of Population Employed in Administrative & Support Services in Saint Paul, MN are:
What zip code has the Highest Percentage of Population Employed in Administrative & Support Services in Saint Paul, MN?
55107 has the Highest Percentage of Population Employed in Administrative & Support Services in Saint Paul, MN with 5.8%.
What is the Percentage of Population Employed in Administrative & Support Services in Minnesota?
Percentage of Population Employed in Administrative & Support Services in Minnesota is 3.0%.
What is the Percentage of Population Employed in Administrative & Support Services in the United States?
Percentage of Population Employed in Administrative & Support Services in the United States is 4.1%.