Mahnomen, MN Map & Demographics
Mahnomen Map
Mahnomen Overview
$8,325
PER CAPITA INCOME
$11,667
AVG FAMILY INCOME
$12,000
AVG HOUSEHOLD INCOME
2.5%
WAGE / INCOME GAP [ % ]
97.5¢/ $1
WAGE / INCOME GAP [ $ ]
0.64
INEQUALITY / GINI INDEX
190
TOTAL POPULATION
98
MALE POPULATION
92
FEMALE POPULATION
106.52
MALES / 100 FEMALES
93.88
FEMALES / 100 MALES
16.6
MEDIAN AGE
5.0
AVG FAMILY SIZE
5.0
AVG HOUSEHOLD SIZE
59
LABOR FORCE [ PEOPLE ]
59.0%
PERCENT IN LABOR FORCE
33.9%
UNEMPLOYMENT RATE
Mahnomen Zip Codes
Mahnomen Area Codes
Income in Mahnomen
Income Overview in Mahnomen
Per Capita Income in Mahnomen is $8,325, while median incomes of families and households are $11,667 and $12,000 respectively.
| Characteristic | Number | Measure |
| Per Capita Income | 190 | $8,325 |
| Median Family Income | 34 | $11,667 |
| Mean Family Income | 34 | $32,326 |
| Median Household Income | 38 | $12,000 |
| Mean Household Income | 38 | $35,450 |
| Income Deficit | 34 | $0 |
| Wage / Income Gap (%) | 190 | 2.49% |
| Wage / Income Gap ($) | 190 | 97.51¢ per $1 |
| Gini / Inequality Index | 190 | 0.64 |
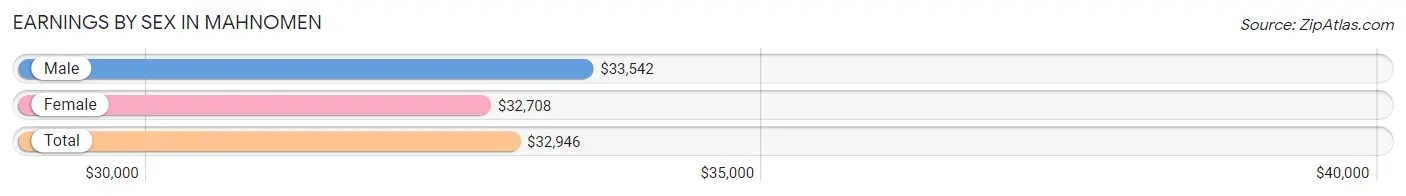
Earnings by Sex in Mahnomen
Average Earnings in Mahnomen are $32,946, $33,542 for men and $32,708 for women, a difference of 2.5%.
| Sex | Number | Average Earnings |
| Male | 26 (50.0%) | $33,542 |
| Female | 26 (50.0%) | $32,708 |
| Total | 52 (100.0%) | $32,946 |
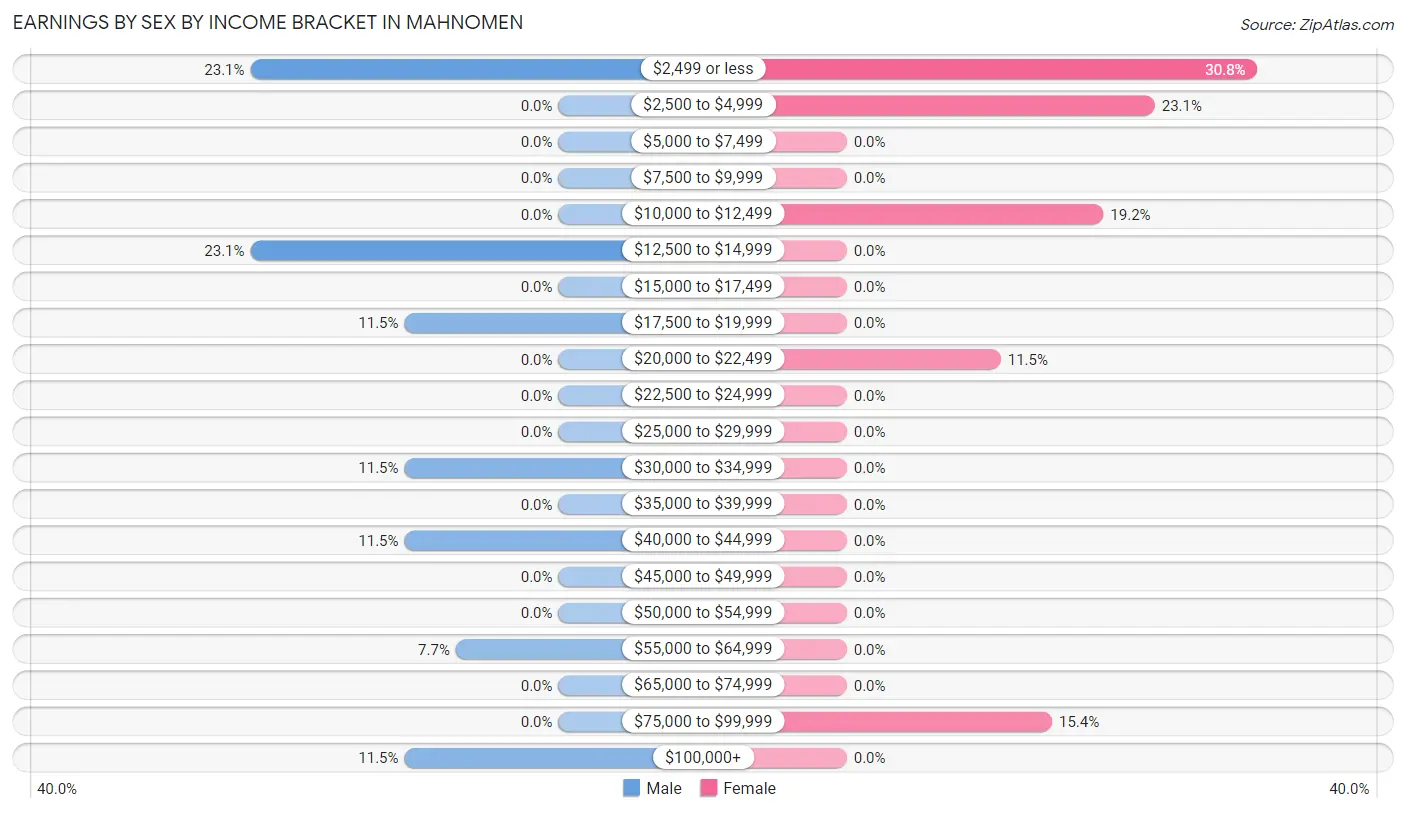
Earnings by Sex by Income Bracket in Mahnomen
The most common earnings brackets in Mahnomen are $2,499 or less for men (6 | 23.1%) and $2,499 or less for women (8 | 30.8%).
| Income | Male | Female |
| $2,499 or less | 6 (23.1%) | 8 (30.8%) |
| $2,500 to $4,999 | 0 (0.0%) | 6 (23.1%) |
| $5,000 to $7,499 | 0 (0.0%) | 0 (0.0%) |
| $7,500 to $9,999 | 0 (0.0%) | 0 (0.0%) |
| $10,000 to $12,499 | 0 (0.0%) | 5 (19.2%) |
| $12,500 to $14,999 | 6 (23.1%) | 0 (0.0%) |
| $15,000 to $17,499 | 0 (0.0%) | 0 (0.0%) |
| $17,500 to $19,999 | 3 (11.5%) | 0 (0.0%) |
| $20,000 to $22,499 | 0 (0.0%) | 3 (11.5%) |
| $22,500 to $24,999 | 0 (0.0%) | 0 (0.0%) |
| $25,000 to $29,999 | 0 (0.0%) | 0 (0.0%) |
| $30,000 to $34,999 | 3 (11.5%) | 0 (0.0%) |
| $35,000 to $39,999 | 0 (0.0%) | 0 (0.0%) |
| $40,000 to $44,999 | 3 (11.5%) | 0 (0.0%) |
| $45,000 to $49,999 | 0 (0.0%) | 0 (0.0%) |
| $50,000 to $54,999 | 0 (0.0%) | 0 (0.0%) |
| $55,000 to $64,999 | 2 (7.7%) | 0 (0.0%) |
| $65,000 to $74,999 | 0 (0.0%) | 0 (0.0%) |
| $75,000 to $99,999 | 0 (0.0%) | 4 (15.4%) |
| $100,000+ | 3 (11.5%) | 0 (0.0%) |
| Total | 26 (100.0%) | 26 (100.0%) |
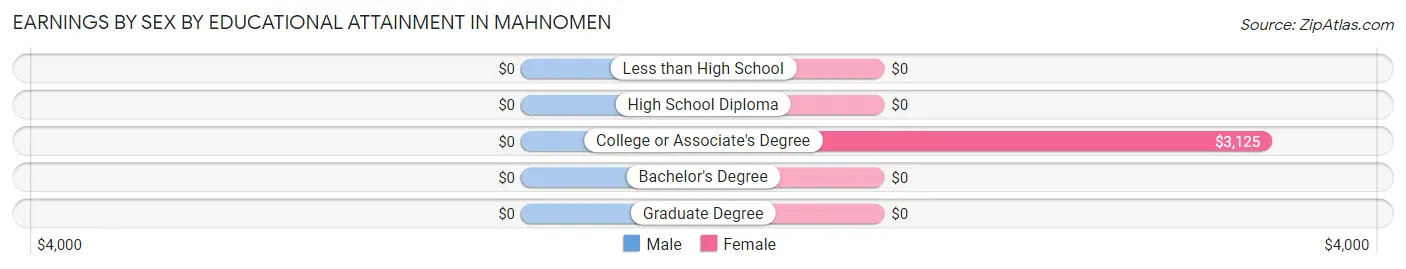
Earnings by Sex by Educational Attainment in Mahnomen
| Educational Attainment | Male Income | Female Income |
| Less than High School | - | - |
| High School Diploma | - | - |
| College or Associate's Degree | - | - |
| Bachelor's Degree | - | - |
| Graduate Degree | - | - |
| Total | - | - |
Family Income in Mahnomen
Family Income Brackets in Mahnomen
According to the Mahnomen family income data, there are 15 families falling into the less than $10,000 income range, which is the most common income bracket and makes up 44.1% of all families.
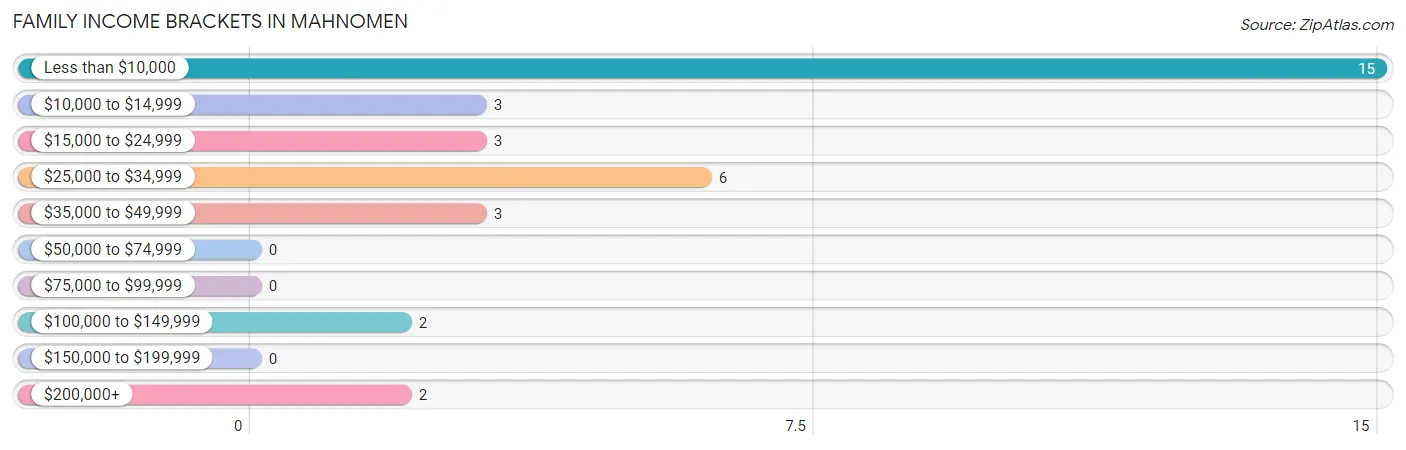
| Income Bracket | # Families | % Families |
| Less than $10,000 | 15 | 44.1% |
| $10,000 to $14,999 | 3 | 8.8% |
| $15,000 to $24,999 | 3 | 8.8% |
| $25,000 to $34,999 | 6 | 17.6% |
| $35,000 to $49,999 | 3 | 8.8% |
| $50,000 to $74,999 | 0 | 0.0% |
| $75,000 to $99,999 | 0 | 0.0% |
| $100,000 to $149,999 | 2 | 5.9% |
| $150,000 to $199,999 | 0 | 0.0% |
| $200,000+ | 2 | 5.9% |
Family Income by Famaliy Size in Mahnomen
3-person families (11 | 32.4%) account for the highest median family income in Mahnomen with $10,417 per family, while 3-person families (11 | 32.4%) have the highest median income of $3,472 per family member.
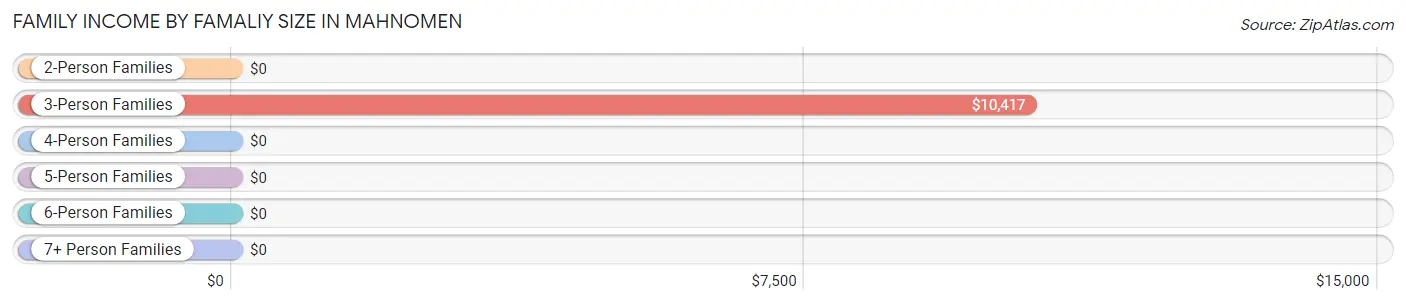
| Income Bracket | # Families | Median Income |
| 2-Person Families | 0 (0.0%) | $0 |
| 3-Person Families | 11 (32.4%) | $10,417 |
| 4-Person Families | 10 (29.4%) | $0 |
| 5-Person Families | 10 (29.4%) | $0 |
| 6-Person Families | 3 (8.8%) | $0 |
| 7+ Person Families | 0 (0.0%) | $0 |
| Total | 34 (100.0%) | $11,667 |
Family Income by Number of Earners in Mahnomen
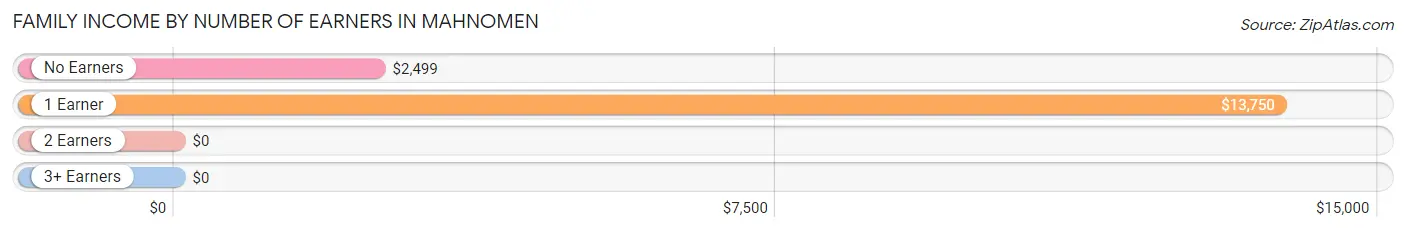
| Number of Earners | # Families | Median Income |
| No Earners | 12 (35.3%) | $2,499 |
| 1 Earner | 12 (35.3%) | $13,750 |
| 2 Earners | 8 (23.5%) | $0 |
| 3+ Earners | 2 (5.9%) | $0 |
| Total | 34 (100.0%) | $11,667 |
Household Income in Mahnomen
Household Income Brackets in Mahnomen
With 15 households falling in the category, the less than $10,000 income range is the most frequent in Mahnomen, accounting for 39.5% of all households.
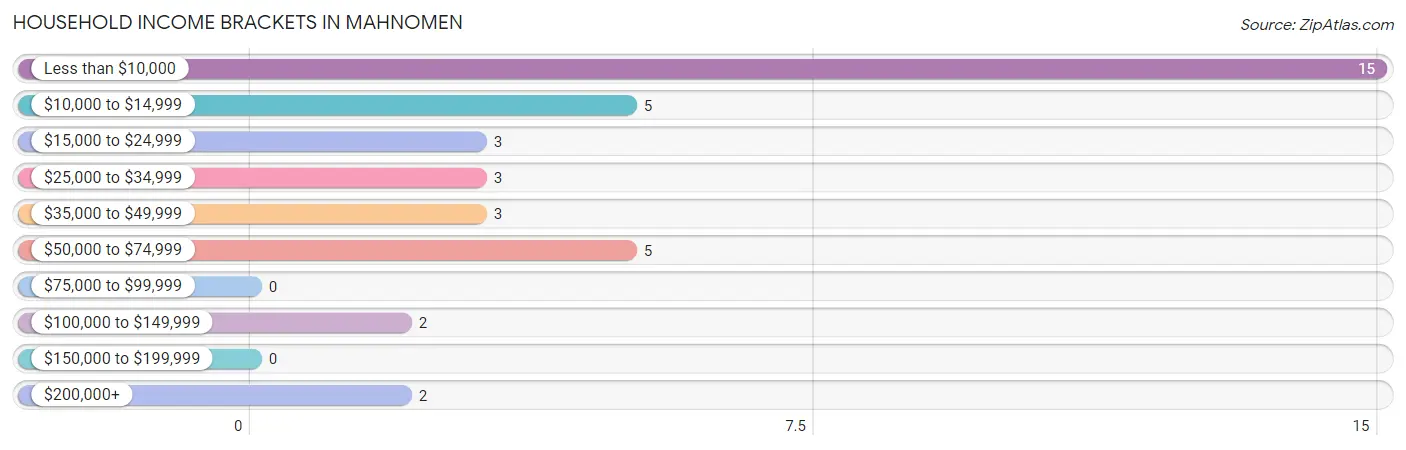
| Income Bracket | # Households | % Households |
| Less than $10,000 | 15 | 39.5% |
| $10,000 to $14,999 | 5 | 13.2% |
| $15,000 to $24,999 | 3 | 7.9% |
| $25,000 to $34,999 | 3 | 7.9% |
| $35,000 to $49,999 | 3 | 7.9% |
| $50,000 to $74,999 | 5 | 13.2% |
| $75,000 to $99,999 | 0 | 0.0% |
| $100,000 to $149,999 | 2 | 5.3% |
| $150,000 to $199,999 | 0 | 0.0% |
| $200,000+ | 2 | 5.3% |
Household Income by Householder Age in Mahnomen
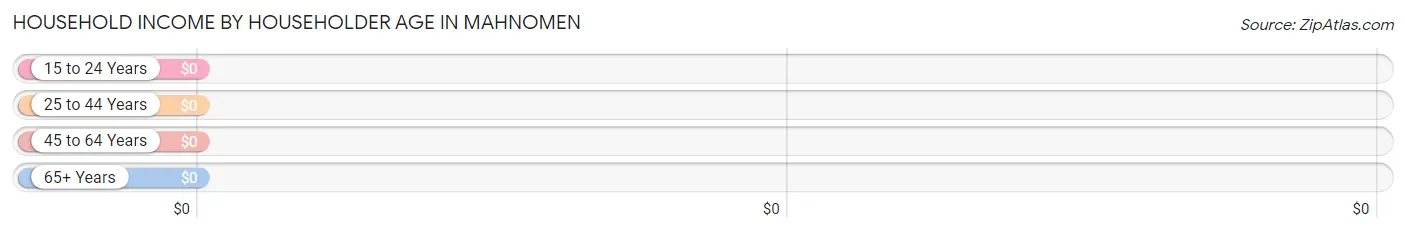
| Income Bracket | # Households | Median Income |
| 15 to 24 Years | 0 (0.0%) | $0 |
| 25 to 44 Years | 23 (60.5%) | $0 |
| 45 to 64 Years | 12 (31.6%) | $0 |
| 65+ Years | 3 (7.9%) | $0 |
| Total | 38 (100.0%) | $12,000 |
Poverty in Mahnomen
Income Below Poverty by Sex and Age in Mahnomen
With 56.1% poverty level for males and 87.0% for females among the residents of Mahnomen, under 5 year old males and 6 to 11 year old females are the most vulnerable to poverty, with 3 males (100.0%) and 16 females (100.0%) in their respective age groups living below the poverty level.
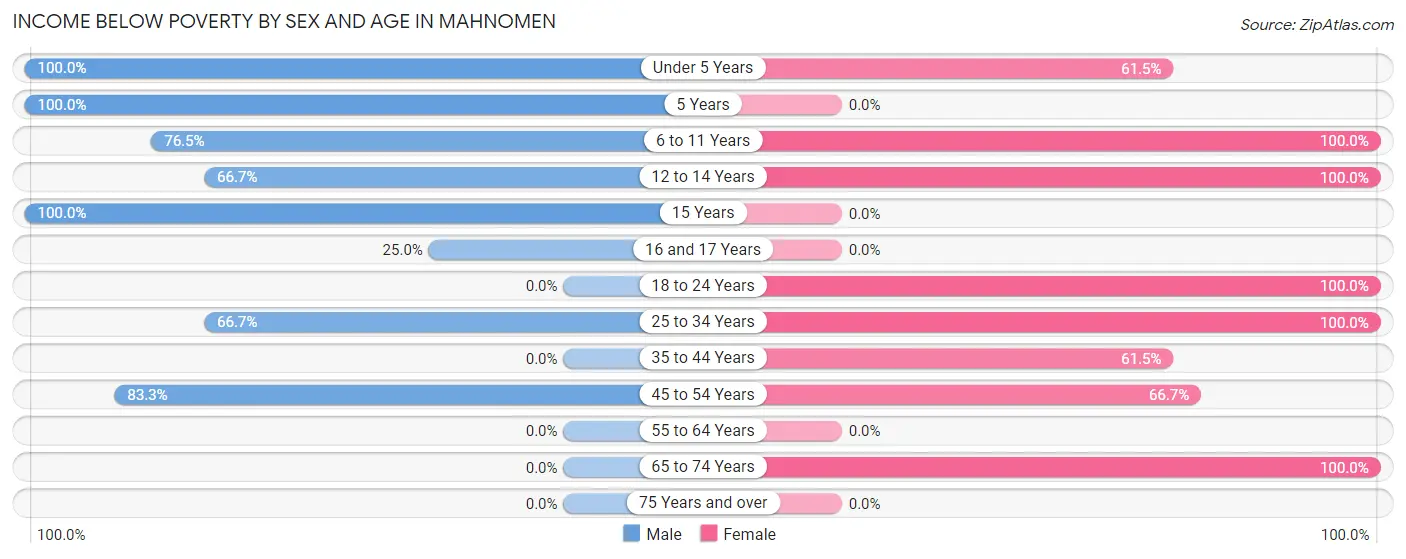
| Age Bracket | Male | Female |
| Under 5 Years | 3 (100.0%) | 8 (61.5%) |
| 5 Years | 8 (100.0%) | 0 (0.0%) |
| 6 to 11 Years | 13 (76.5%) | 16 (100.0%) |
| 12 to 14 Years | 10 (66.7%) | 16 (100.0%) |
| 15 Years | 2 (100.0%) | 0 (0.0%) |
| 16 and 17 Years | 3 (25.0%) | 0 (0.0%) |
| 18 to 24 Years | 0 (0.0%) | 15 (100.0%) |
| 25 to 34 Years | 6 (66.7%) | 10 (100.0%) |
| 35 to 44 Years | 0 (0.0%) | 8 (61.5%) |
| 45 to 54 Years | 10 (83.3%) | 4 (66.7%) |
| 55 to 64 Years | 0 (0.0%) | 0 (0.0%) |
| 65 to 74 Years | 0 (0.0%) | 3 (100.0%) |
| 75 Years and over | 0 (0.0%) | 0 (0.0%) |
| Total | 55 (56.1%) | 80 (87.0%) |
Income Above Poverty by Sex and Age in Mahnomen
According to the poverty statistics in Mahnomen, males aged 18 to 24 years and females aged under 5 years are the age groups that are most secure financially, with 100.0% of males and 38.5% of females in these age groups living above the poverty line.
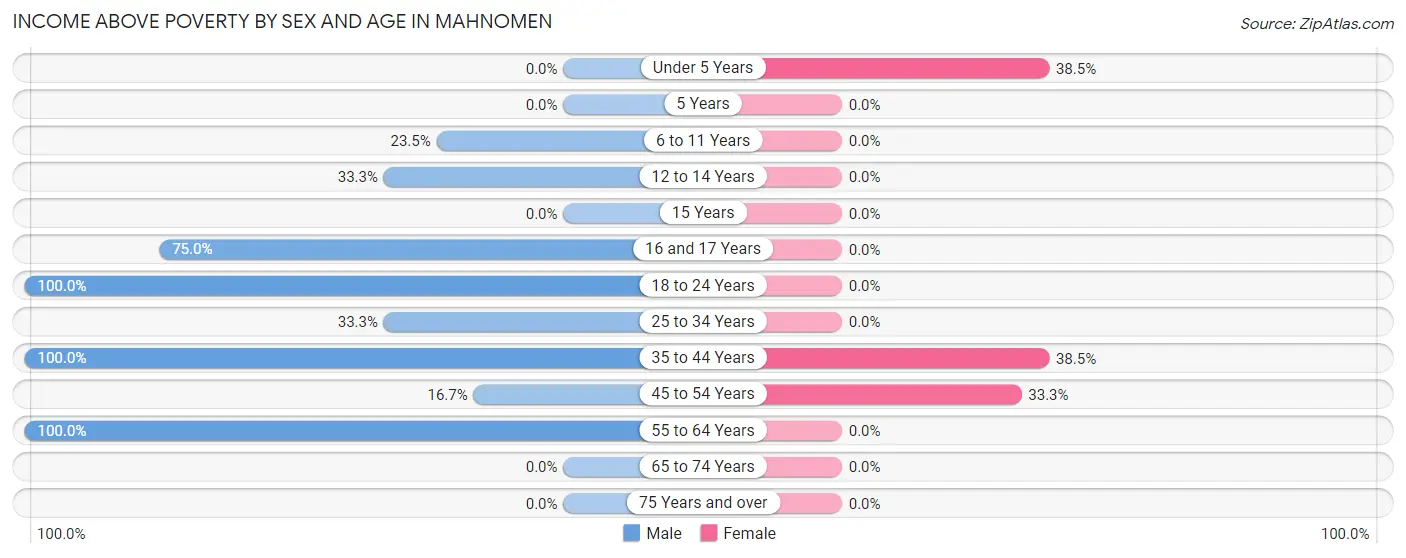
| Age Bracket | Male | Female |
| Under 5 Years | 0 (0.0%) | 5 (38.5%) |
| 5 Years | 0 (0.0%) | 0 (0.0%) |
| 6 to 11 Years | 4 (23.5%) | 0 (0.0%) |
| 12 to 14 Years | 5 (33.3%) | 0 (0.0%) |
| 15 Years | 0 (0.0%) | 0 (0.0%) |
| 16 and 17 Years | 9 (75.0%) | 0 (0.0%) |
| 18 to 24 Years | 14 (100.0%) | 0 (0.0%) |
| 25 to 34 Years | 3 (33.3%) | 0 (0.0%) |
| 35 to 44 Years | 3 (100.0%) | 5 (38.5%) |
| 45 to 54 Years | 2 (16.7%) | 2 (33.3%) |
| 55 to 64 Years | 3 (100.0%) | 0 (0.0%) |
| 65 to 74 Years | 0 (0.0%) | 0 (0.0%) |
| 75 Years and over | 0 (0.0%) | 0 (0.0%) |
| Total | 43 (43.9%) | 12 (13.0%) |
Income Below Poverty Among Married-Couple Families in Mahnomen
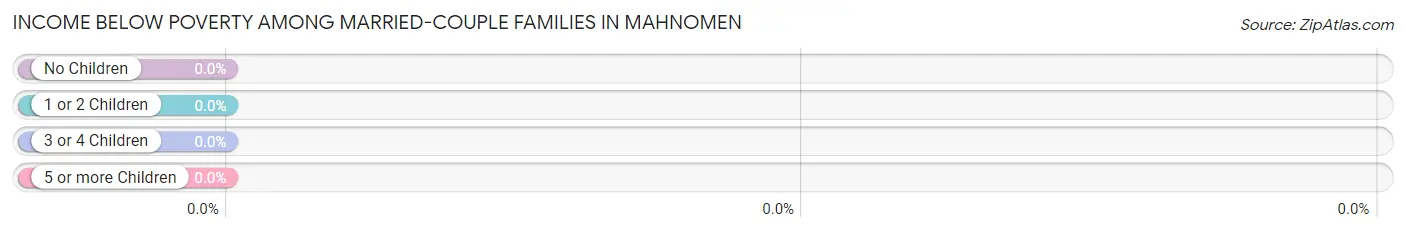
| Children | Above Poverty | Below Poverty |
| No Children | 0 (0.0%) | 0 (0.0%) |
| 1 or 2 Children | 2 (100.0%) | 0 (0.0%) |
| 3 or 4 Children | 0 (0.0%) | 0 (0.0%) |
| 5 or more Children | 0 (0.0%) | 0 (0.0%) |
| Total | 2 (100.0%) | 0 (0.0%) |
Income Below Poverty Among Single-Parent Households in Mahnomen
According to the poverty data in Mahnomen, 50.0% or 3 single-father households and 80.8% or 21 single-mother households are living below the poverty line. Among single-father households, those with no children have the highest poverty rate, with 3 households (100.0%) experiencing poverty. Likewise, among single-mother households, those with 3 or 4 children have the highest poverty rate, with 16 households (100.0%) falling below the poverty line.
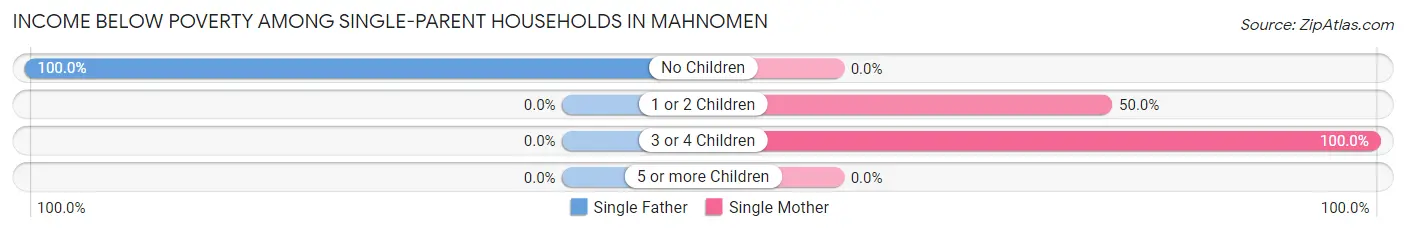
| Children | Single Father | Single Mother |
| No Children | 3 (100.0%) | 0 (0.0%) |
| 1 or 2 Children | 0 (0.0%) | 5 (50.0%) |
| 3 or 4 Children | 0 (0.0%) | 16 (100.0%) |
| 5 or more Children | 0 (0.0%) | 0 (0.0%) |
| Total | 3 (50.0%) | 21 (80.8%) |
Income Below Poverty Among Married-Couple vs Single-Parent Households in Mahnomen
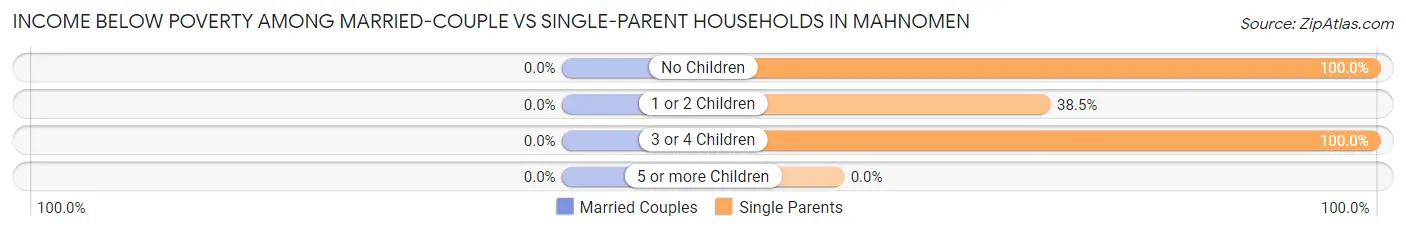
| Children | Married-Couple Families | Single-Parent Households |
| No Children | 0 (0.0%) | 3 (100.0%) |
| 1 or 2 Children | 0 (0.0%) | 5 (38.5%) |
| 3 or 4 Children | 0 (0.0%) | 16 (100.0%) |
| 5 or more Children | 0 (0.0%) | 0 (0.0%) |
| Total | 0 (0.0%) | 24 (75.0%) |
Race in Mahnomen
The most populous races in Mahnomen are Native / Alaskan (127 | 66.8%), Two or more Races (37 | 19.5%), and Hispanic or Latino (33 | 17.4%).
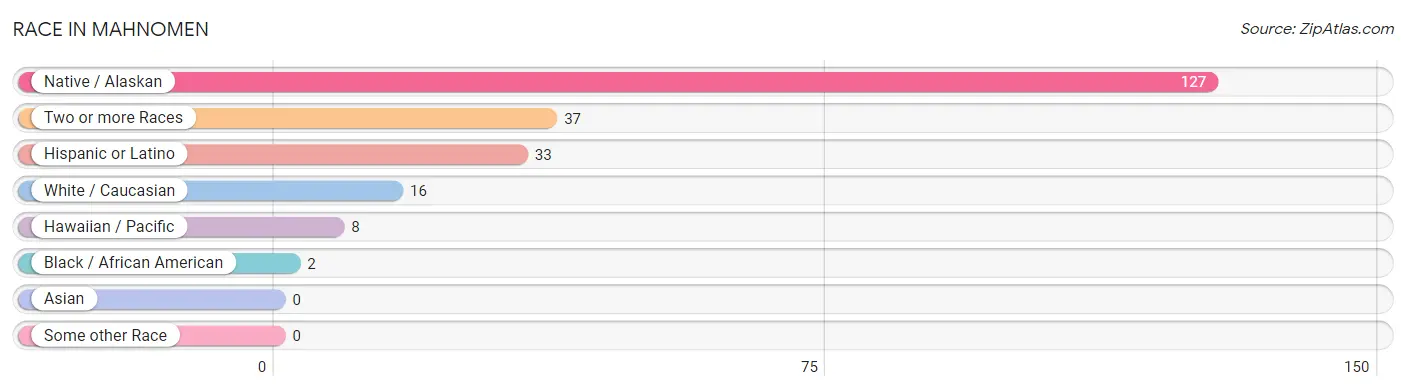
| Race | # Population | % Population |
| Asian | 0 | 0.0% |
| Black / African American | 2 | 1.1% |
| Hawaiian / Pacific | 8 | 4.2% |
| Hispanic or Latino | 33 | 17.4% |
| Native / Alaskan | 127 | 66.8% |
| White / Caucasian | 16 | 8.4% |
| Two or more Races | 37 | 19.5% |
| Some other Race | 0 | 0.0% |
| Total | 190 | 100.0% |
Ancestry in Mahnomen
The most populous ancestries reported in Mahnomen are Chippewa (159 | 83.7%), Mexican (33 | 17.4%), German (18 | 9.5%), Swedish (17 | 8.9%), and Polish (10 | 5.3%), together accounting for 124.7% of all Mahnomen residents.
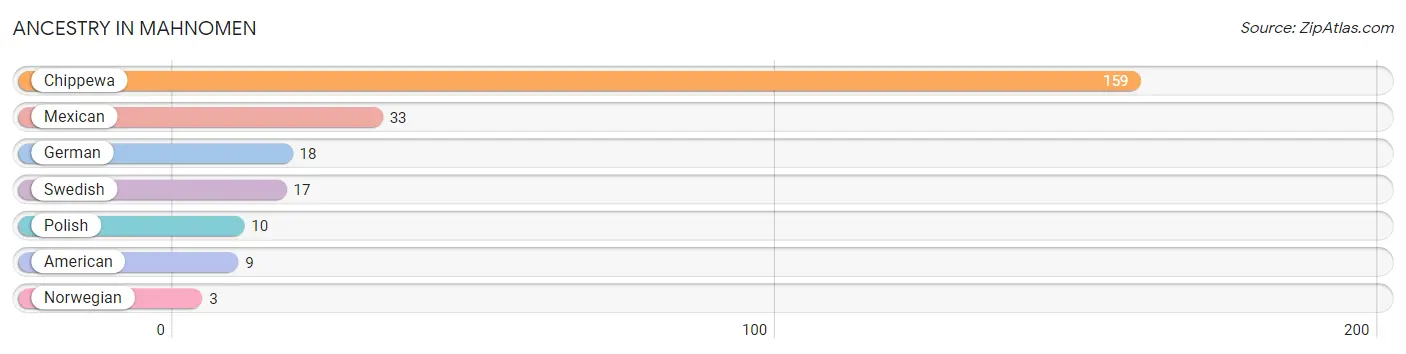
| Ancestry | # Population | % Population |
| American | 9 | 4.7% |
| Chippewa | 159 | 83.7% |
| German | 18 | 9.5% |
| Mexican | 33 | 17.4% |
| Norwegian | 3 | 1.6% |
| Polish | 10 | 5.3% |
| Swedish | 17 | 8.9% | View All 7 Rows |
Immigrants in Mahnomen

| Immigration Origin | # Population | % Population | View All 0 Rows |
Sex and Age in Mahnomen
Sex and Age in Mahnomen
The most populous age groups in Mahnomen are 10 to 14 Years (23 | 23.5%) for men and 10 to 14 Years (25 | 27.2%) for women.
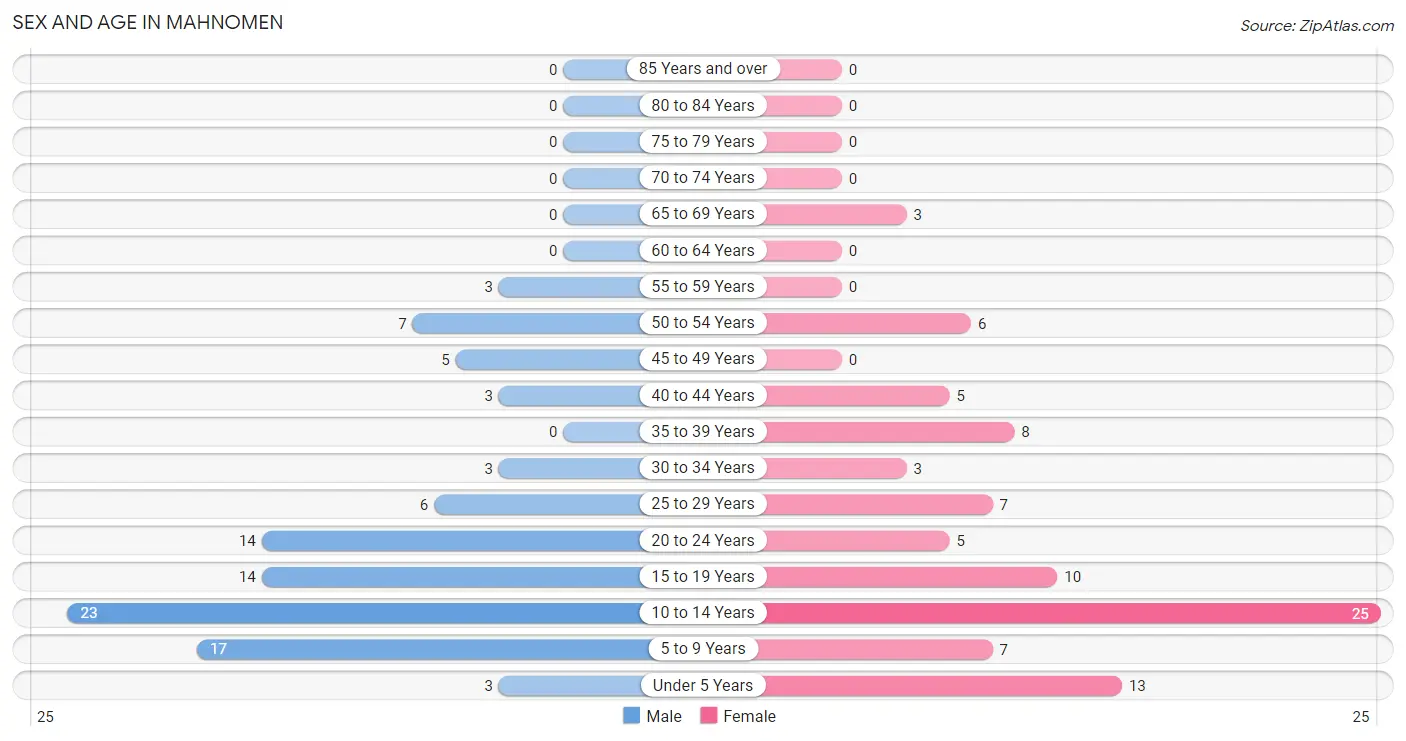
| Age Bracket | Male | Female |
| Under 5 Years | 3 (3.1%) | 13 (14.1%) |
| 5 to 9 Years | 17 (17.3%) | 7 (7.6%) |
| 10 to 14 Years | 23 (23.5%) | 25 (27.2%) |
| 15 to 19 Years | 14 (14.3%) | 10 (10.9%) |
| 20 to 24 Years | 14 (14.3%) | 5 (5.4%) |
| 25 to 29 Years | 6 (6.1%) | 7 (7.6%) |
| 30 to 34 Years | 3 (3.1%) | 3 (3.3%) |
| 35 to 39 Years | 0 (0.0%) | 8 (8.7%) |
| 40 to 44 Years | 3 (3.1%) | 5 (5.4%) |
| 45 to 49 Years | 5 (5.1%) | 0 (0.0%) |
| 50 to 54 Years | 7 (7.1%) | 6 (6.5%) |
| 55 to 59 Years | 3 (3.1%) | 0 (0.0%) |
| 60 to 64 Years | 0 (0.0%) | 0 (0.0%) |
| 65 to 69 Years | 0 (0.0%) | 3 (3.3%) |
| 70 to 74 Years | 0 (0.0%) | 0 (0.0%) |
| 75 to 79 Years | 0 (0.0%) | 0 (0.0%) |
| 80 to 84 Years | 0 (0.0%) | 0 (0.0%) |
| 85 Years and over | 0 (0.0%) | 0 (0.0%) |
| Total | 98 (100.0%) | 92 (100.0%) |
Families and Households in Mahnomen
Median Family Size in Mahnomen
The median family size in Mahnomen is 4.97 persons per family, with single male/father families (6 | 17.6%) accounting for the largest median family size of 5 persons per family. On the other hand, married-couple families (2 | 5.9%) represent the smallest median family size with 4.50 persons per family.
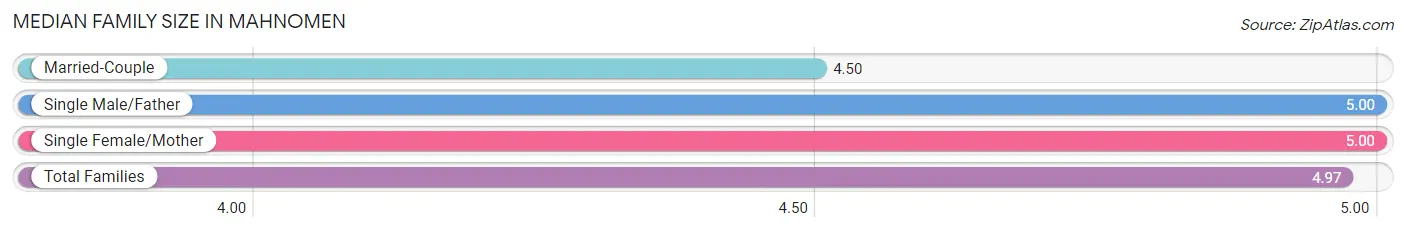
| Family Type | # Families | Family Size |
| Married-Couple | 2 (5.9%) | 4.50 |
| Single Male/Father | 6 (17.6%) | 5.00 |
| Single Female/Mother | 26 (76.5%) | 5.00 |
| Total Families | 34 (100.0%) | 4.97 |
Median Household Size in Mahnomen
The median household size in Mahnomen is 5.00 persons per household, with single male/father households (6 | 15.8%) accounting for the largest median household size of 6.17 persons per household. non-family households (4 | 10.5%) represent the smallest median household size with 2.00 persons per household.
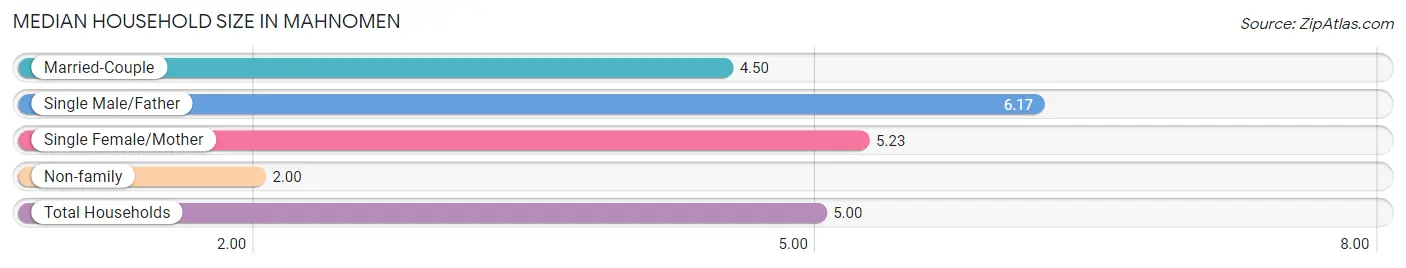
| Household Type | # Households | Household Size |
| Married-Couple | 2 (5.3%) | 4.50 |
| Single Male/Father | 6 (15.8%) | 6.17 |
| Single Female/Mother | 26 (68.4%) | 5.23 |
| Non-family | 4 (10.5%) | 2.00 |
| Total Households | 38 (100.0%) | 5.00 |
Household Size by Marriage Status in Mahnomen
Out of a total of 38 households in Mahnomen, 34 (89.5%) are family households, while 4 (10.5%) are nonfamily households. The most numerous type of family households are 4-person households, comprising 15, and the most common type of nonfamily households are 1-person households, comprising 2.
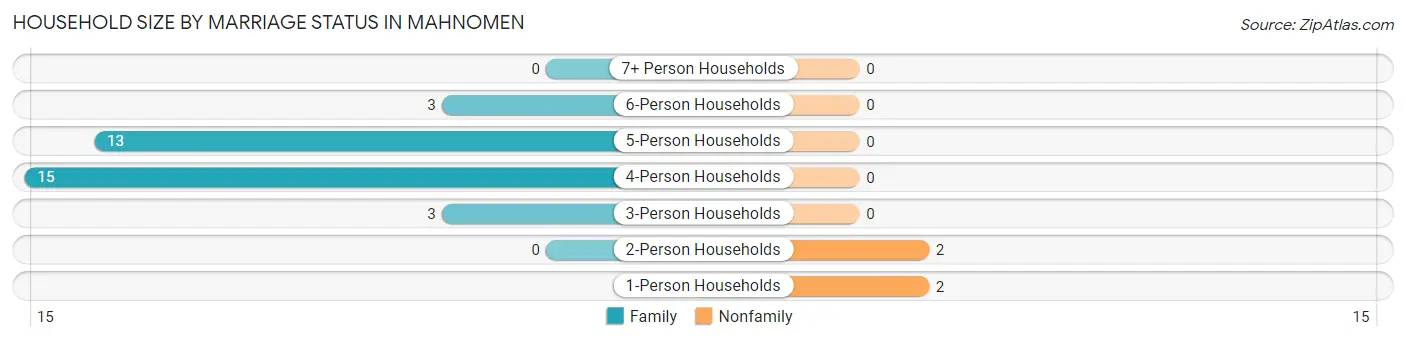
| Household Size | Family Households | Nonfamily Households |
| 1-Person Households | - | 2 (5.3%) |
| 2-Person Households | 0 (0.0%) | 2 (5.3%) |
| 3-Person Households | 3 (7.9%) | 0 (0.0%) |
| 4-Person Households | 15 (39.5%) | 0 (0.0%) |
| 5-Person Households | 13 (34.2%) | 0 (0.0%) |
| 6-Person Households | 3 (7.9%) | 0 (0.0%) |
| 7+ Person Households | 0 (0.0%) | 0 (0.0%) |
| Total | 34 (89.5%) | 4 (10.5%) |
Female Fertility in Mahnomen
Fertility by Age in Mahnomen
Average fertility rate in Mahnomen is 316.0 births per 1,000 women. Women in the age bracket of 15 to 19 years have the highest fertility rate with 500.0 births per 1,000 women. Women in the age bracket of 20 to 34 years acount for 58.3% of all women with births.
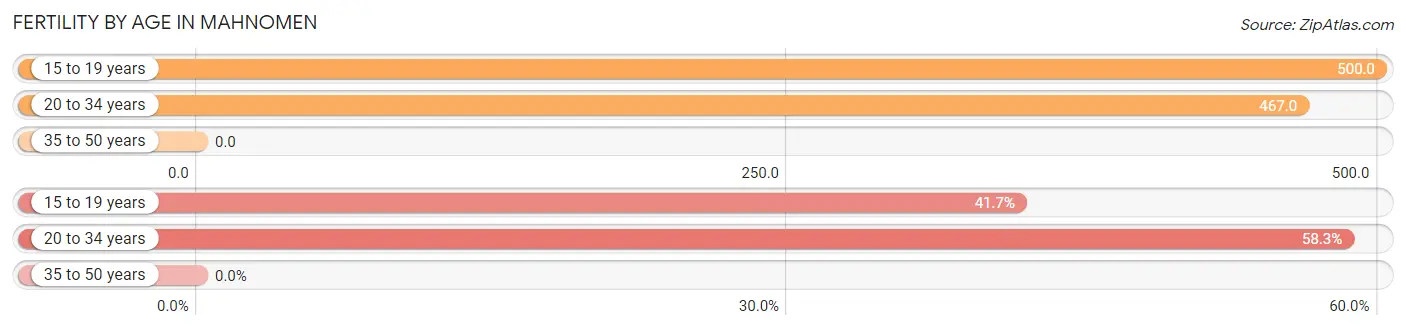
| Age Bracket | Women with Births | Births / 1,000 Women |
| 15 to 19 years | 5 (41.7%) | 500.0 |
| 20 to 34 years | 7 (58.3%) | 467.0 |
| 35 to 50 years | 0 (0.0%) | 0.0 |
| Total | 12 (100.0%) | 316.0 |
Fertility by Age by Marriage Status in Mahnomen
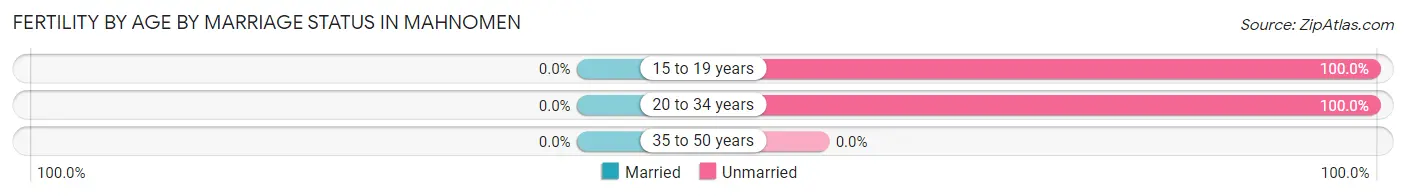
| Age Bracket | Married | Unmarried |
| 15 to 19 years | 0 (0.0%) | 5 (100.0%) |
| 20 to 34 years | 0 (0.0%) | 7 (100.0%) |
| 35 to 50 years | 0 (0.0%) | 0 (0.0%) |
| Total | 0 (0.0%) | 12 (100.0%) |
Fertility by Education in Mahnomen
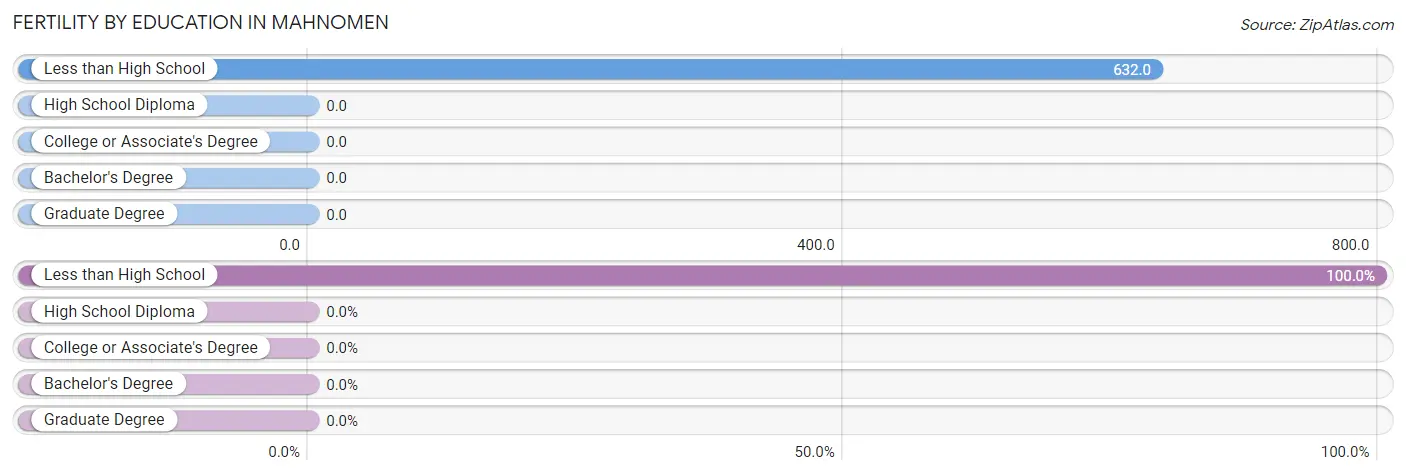
| Educational Attainment | Women with Births | Births / 1,000 Women |
| Less than High School | 12 (100.0%) | 632.0 |
| High School Diploma | 0 (0.0%) | 0.0 |
| College or Associate's Degree | 0 (0.0%) | 0.0 |
| Bachelor's Degree | 0 (0.0%) | 0.0 |
| Graduate Degree | 0 (0.0%) | 0.0 |
| Total | 12 (100.0%) | 316.0 |
Fertility by Education by Marriage Status in Mahnomen
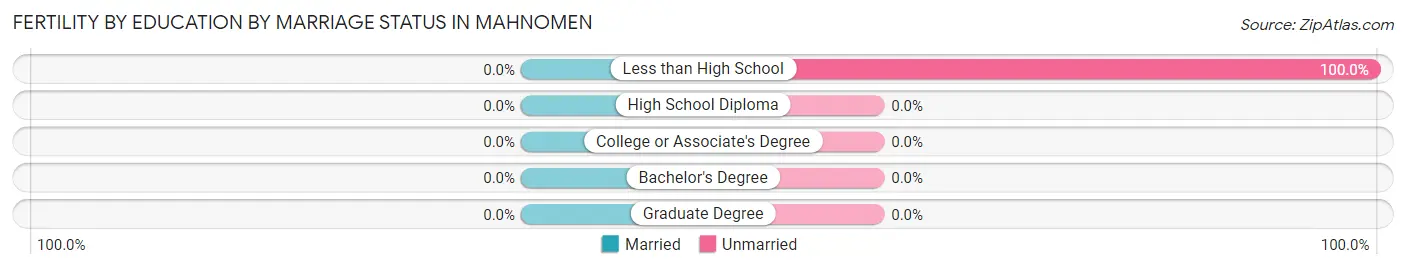
| Educational Attainment | Married | Unmarried |
| Less than High School | 0 (0.0%) | 12 (100.0%) |
| High School Diploma | 0 (0.0%) | 0 (0.0%) |
| College or Associate's Degree | 0 (0.0%) | 0 (0.0%) |
| Bachelor's Degree | 0 (0.0%) | 0 (0.0%) |
| Graduate Degree | 0 (0.0%) | 0 (0.0%) |
| Total | 0 (0.0%) | 12 (100.0%) |
Employment Characteristics in Mahnomen
Employment by Class of Employer in Mahnomen
Among the 39 employed individuals in Mahnomen, private company employees (24 | 61.5%), local government employees (12 | 30.8%), and federal government employees (3 | 7.7%) make up the most common classes of employment.
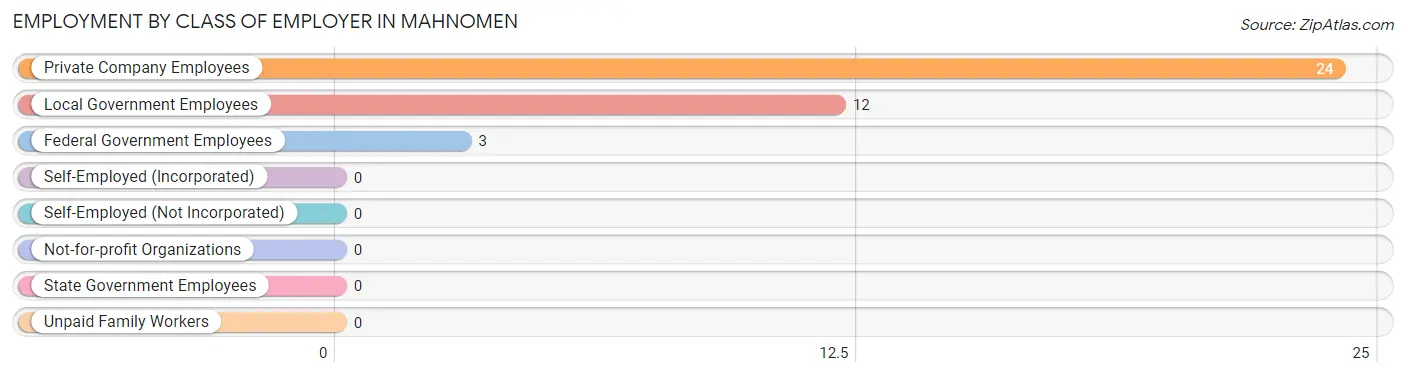
| Employer Class | # Employees | % Employees |
| Private Company Employees | 24 | 61.5% |
| Self-Employed (Incorporated) | 0 | 0.0% |
| Self-Employed (Not Incorporated) | 0 | 0.0% |
| Not-for-profit Organizations | 0 | 0.0% |
| Local Government Employees | 12 | 30.8% |
| State Government Employees | 0 | 0.0% |
| Federal Government Employees | 3 | 7.7% |
| Unpaid Family Workers | 0 | 0.0% |
| Total | 39 | 100.0% |
Employment Status by Age in Mahnomen
According to the labor force statistics for Mahnomen, out of the total population over 16 years of age (100), 59.0% or 59 individuals are in the labor force, with 33.9% or 20 of them unemployed. The age group with the highest labor force participation rate is 20 to 24 years, with 100.0% or 19 individuals in the labor force. Within the labor force, the 45 to 54 years age range has the highest percentage of unemployed individuals, with 55.6% or 5 of them being unemployed.
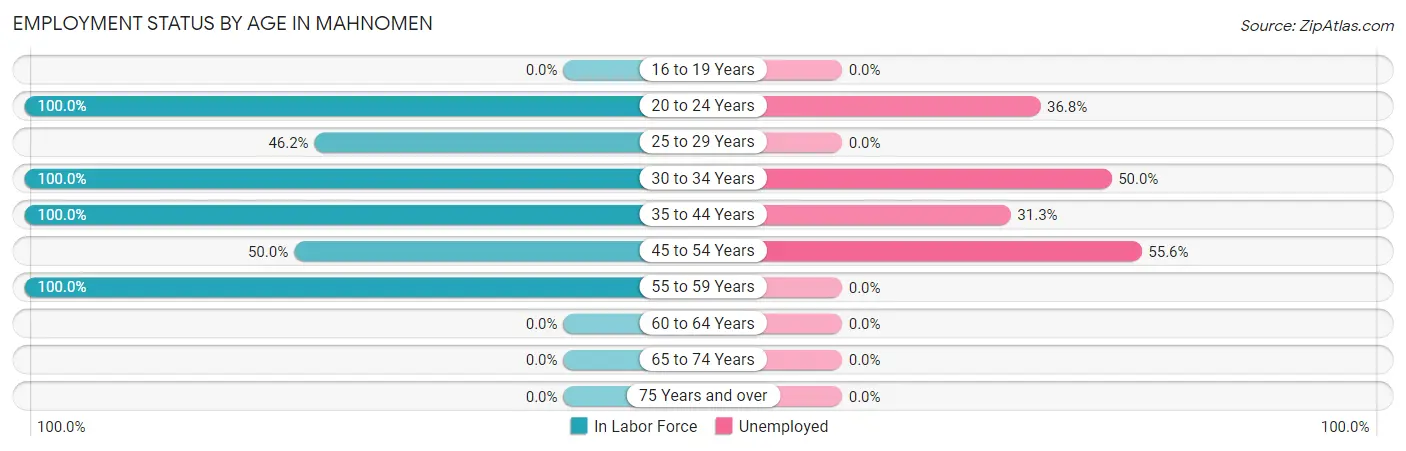
| Age Bracket | In Labor Force | Unemployed |
| 16 to 19 Years | 0 (0.0%) | 0 (0.0%) |
| 20 to 24 Years | 19 (100.0%) | 7 (36.8%) |
| 25 to 29 Years | 6 (46.2%) | 0 (0.0%) |
| 30 to 34 Years | 6 (100.0%) | 3 (50.0%) |
| 35 to 44 Years | 16 (100.0%) | 5 (31.3%) |
| 45 to 54 Years | 9 (50.0%) | 5 (55.6%) |
| 55 to 59 Years | 3 (100.0%) | 0 (0.0%) |
| 60 to 64 Years | 0 (0.0%) | 0 (0.0%) |
| 65 to 74 Years | 0 (0.0%) | 0 (0.0%) |
| 75 Years and over | 0 (0.0%) | 0 (0.0%) |
| Total | 59 (59.0%) | 20 (33.9%) |
Employment Status by Educational Attainment in Mahnomen
According to labor force statistics for Mahnomen, 71.4% of individuals (40) out of the total population between 25 and 64 years of age (56) are in the labor force, with 32.5% or 13 of them being unemployed. The group with the highest labor force participation rate are those with the educational attainment of college / associate degree, with 100.0% or 14 individuals in the labor force. Within the labor force, individuals with high school diploma education have the highest percentage of unemployment, with 62.5% or 5 of them being unemployed.
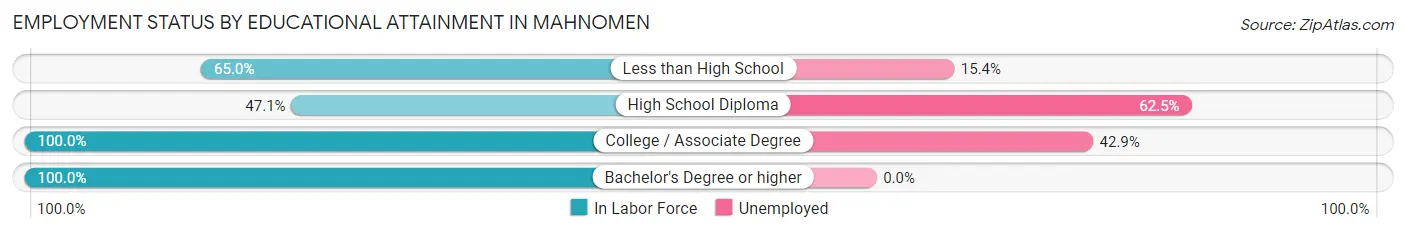
| Educational Attainment | In Labor Force | Unemployed |
| Less than High School | 13 (65.0%) | 3 (15.4%) |
| High School Diploma | 8 (47.1%) | 11 (62.5%) |
| College / Associate Degree | 14 (100.0%) | 6 (42.9%) |
| Bachelor's Degree or higher | 5 (100.0%) | 0 (0.0%) |
| Total | 40 (71.4%) | 18 (32.5%) |
Employment Occupations by Sex in Mahnomen
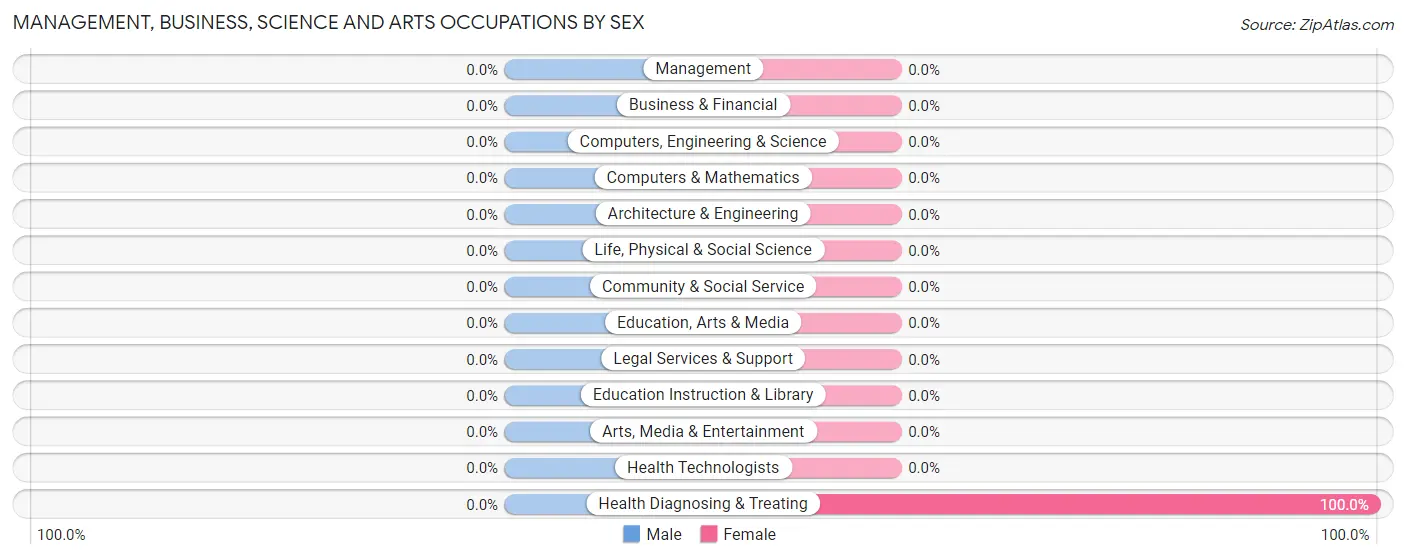
Management, Business, Science and Arts Occupations
The most common Management, Business, Science and Arts occupations in Mahnomen are , and Health Diagnosing & Treating (2 | 5.1%).
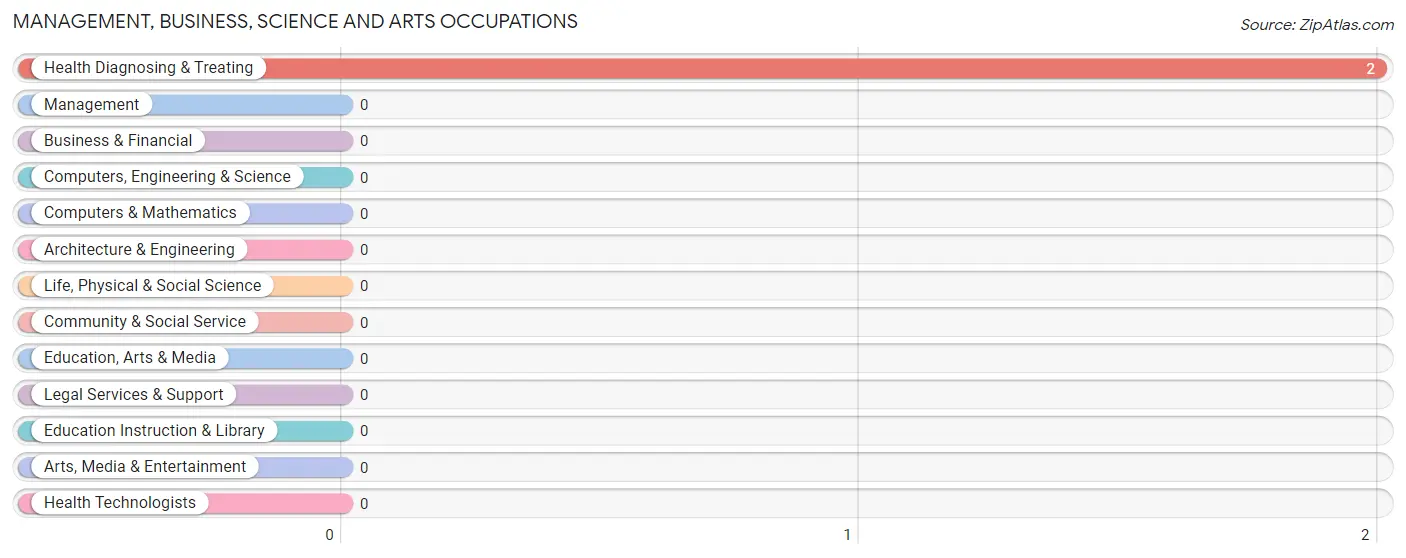
Management, Business, Science and Arts Occupations by Sex
| Occupation | Male | Female |
| Management | 0 (0.0%) | 0 (0.0%) |
| Business & Financial | 0 (0.0%) | 0 (0.0%) |
| Computers, Engineering & Science | 0 (0.0%) | 0 (0.0%) |
| Computers & Mathematics | 0 (0.0%) | 0 (0.0%) |
| Architecture & Engineering | 0 (0.0%) | 0 (0.0%) |
| Life, Physical & Social Science | 0 (0.0%) | 0 (0.0%) |
| Community & Social Service | 0 (0.0%) | 0 (0.0%) |
| Education, Arts & Media | 0 (0.0%) | 0 (0.0%) |
| Legal Services & Support | 0 (0.0%) | 0 (0.0%) |
| Education Instruction & Library | 0 (0.0%) | 0 (0.0%) |
| Arts, Media & Entertainment | 0 (0.0%) | 0 (0.0%) |
| Health Diagnosing & Treating | 0 (0.0%) | 2 (100.0%) |
| Health Technologists | 0 (0.0%) | 0 (0.0%) |
| Total (Category) | 0 (0.0%) | 2 (100.0%) |
| Total (Overall) | 24 (61.5%) | 15 (38.5%) |
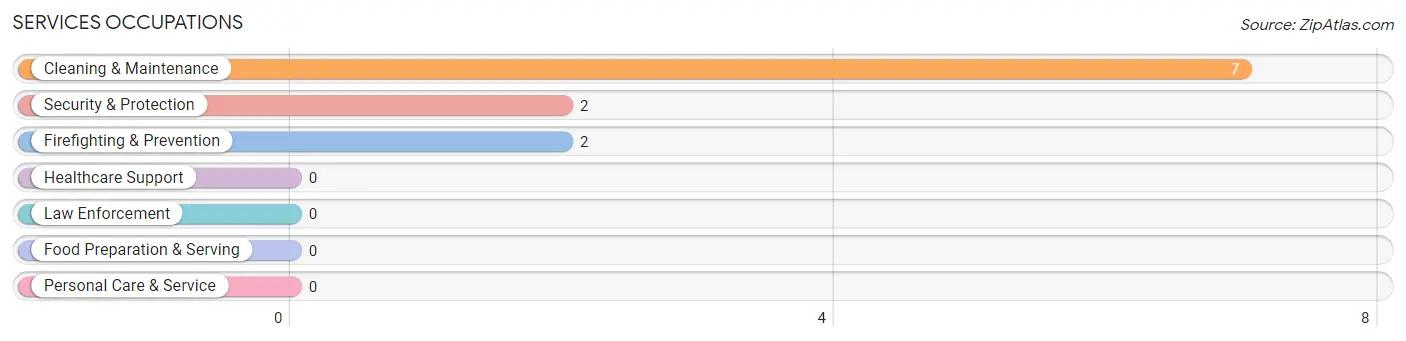
Services Occupations
The most common Services occupations in Mahnomen are Cleaning & Maintenance (7 | 17.9%), Security & Protection (2 | 5.1%), and Firefighting & Prevention (2 | 5.1%).
Services Occupations by Sex
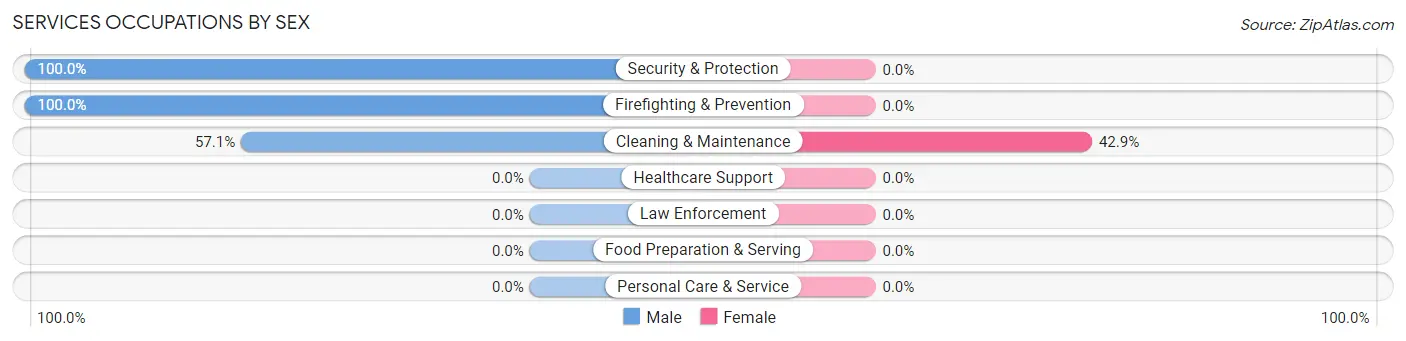
| Occupation | Male | Female |
| Healthcare Support | 0 (0.0%) | 0 (0.0%) |
| Security & Protection | 2 (100.0%) | 0 (0.0%) |
| Firefighting & Prevention | 2 (100.0%) | 0 (0.0%) |
| Law Enforcement | 0 (0.0%) | 0 (0.0%) |
| Food Preparation & Serving | 0 (0.0%) | 0 (0.0%) |
| Cleaning & Maintenance | 4 (57.1%) | 3 (42.9%) |
| Personal Care & Service | 0 (0.0%) | 0 (0.0%) |
| Total (Category) | 6 (66.7%) | 3 (33.3%) |
| Total (Overall) | 24 (61.5%) | 15 (38.5%) |
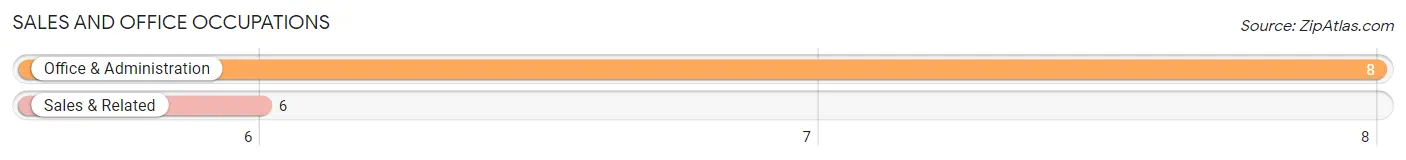
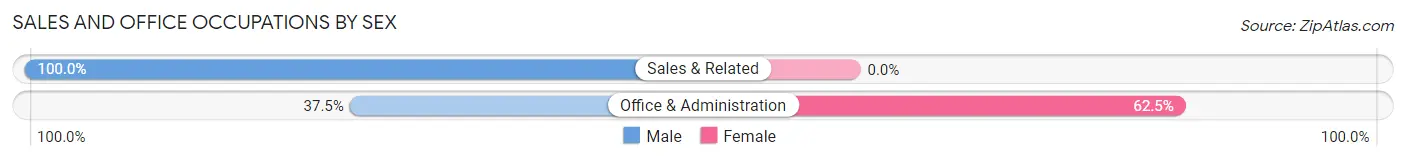
Sales and Office Occupations
The most common Sales and Office occupations in Mahnomen are Office & Administration (8 | 20.5%), and Sales & Related (6 | 15.4%).
Sales and Office Occupations by Sex
| Occupation | Male | Female |
| Sales & Related | 6 (100.0%) | 0 (0.0%) |
| Office & Administration | 3 (37.5%) | 5 (62.5%) |
| Total (Category) | 9 (64.3%) | 5 (35.7%) |
| Total (Overall) | 24 (61.5%) | 15 (38.5%) |
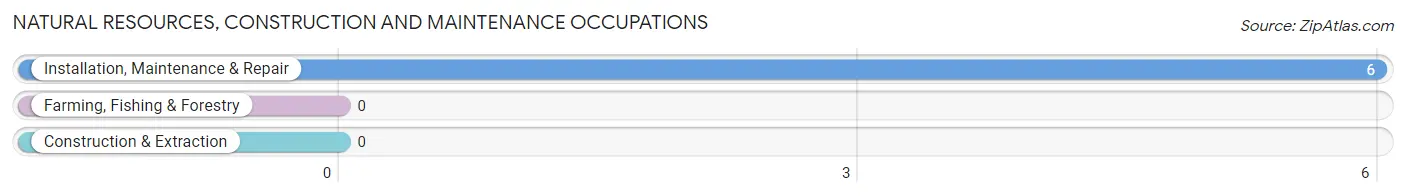
Natural Resources, Construction and Maintenance Occupations
The most common Natural Resources, Construction and Maintenance occupations in Mahnomen are , and Installation, Maintenance & Repair (6 | 15.4%).
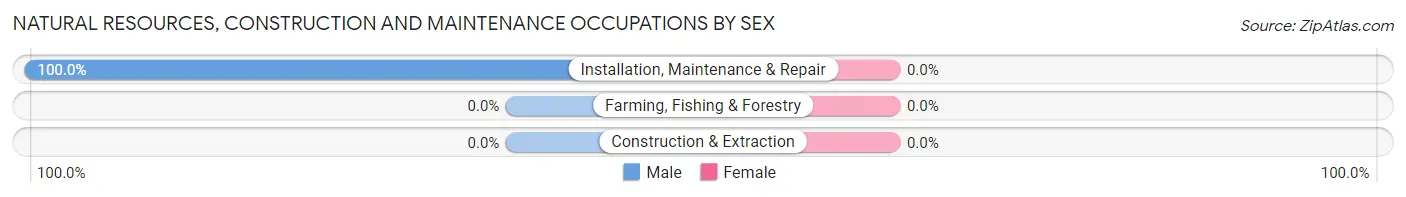
Natural Resources, Construction and Maintenance Occupations by Sex
| Occupation | Male | Female |
| Farming, Fishing & Forestry | 0 (0.0%) | 0 (0.0%) |
| Construction & Extraction | 0 (0.0%) | 0 (0.0%) |
| Installation, Maintenance & Repair | 6 (100.0%) | 0 (0.0%) |
| Total (Category) | 6 (100.0%) | 0 (0.0%) |
| Total (Overall) | 24 (61.5%) | 15 (38.5%) |
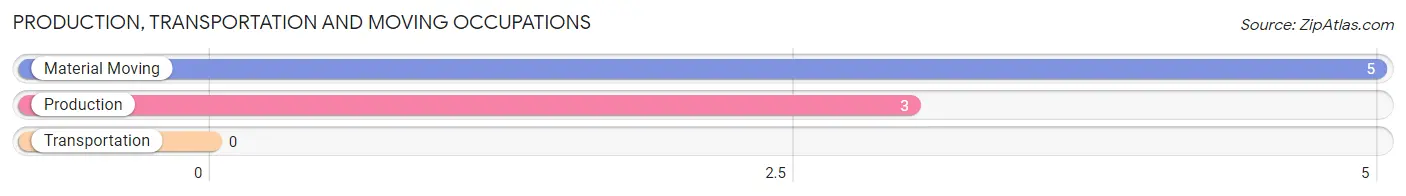
Production, Transportation and Moving Occupations
The most common Production, Transportation and Moving occupations in Mahnomen are Material Moving (5 | 12.8%), and Production (3 | 7.7%).
Production, Transportation and Moving Occupations by Sex
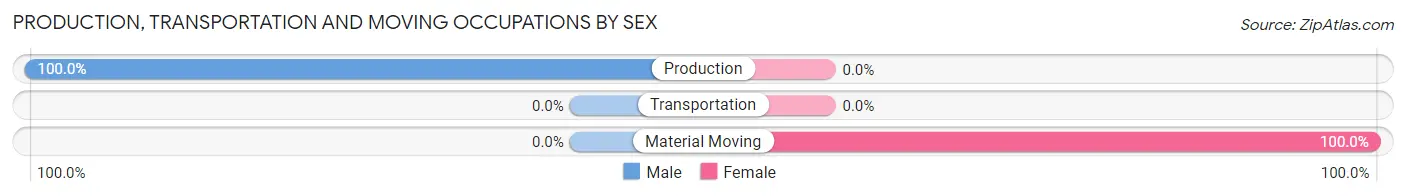
| Occupation | Male | Female |
| Production | 3 (100.0%) | 0 (0.0%) |
| Transportation | 0 (0.0%) | 0 (0.0%) |
| Material Moving | 0 (0.0%) | 5 (100.0%) |
| Total (Category) | 3 (37.5%) | 5 (62.5%) |
| Total (Overall) | 24 (61.5%) | 15 (38.5%) |
Employment Industries by Sex in Mahnomen
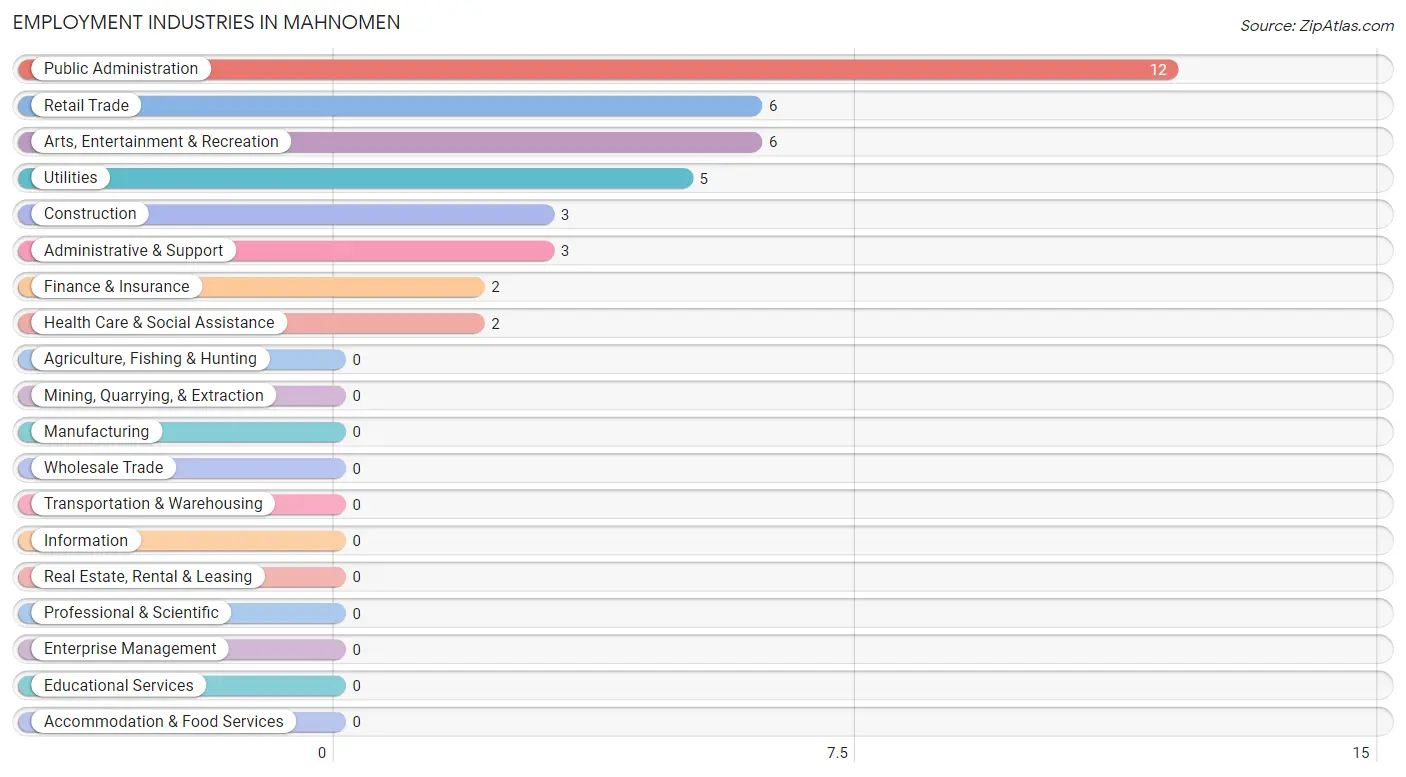
Employment Industries in Mahnomen
The major employment industries in Mahnomen include Public Administration (12 | 30.8%), Retail Trade (6 | 15.4%), Arts, Entertainment & Recreation (6 | 15.4%), Utilities (5 | 12.8%), and Construction (3 | 7.7%).
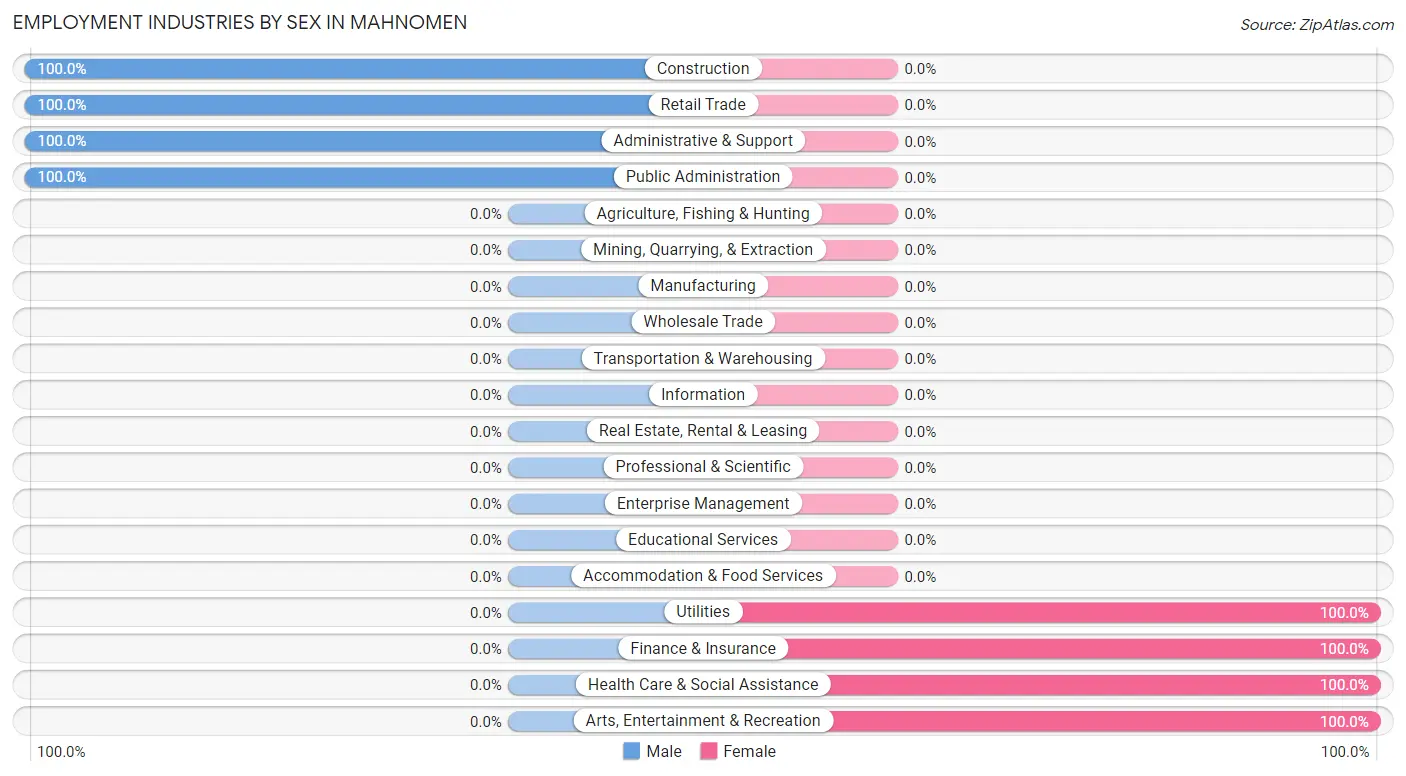
Employment Industries by Sex in Mahnomen
The Mahnomen industries that see more men than women are Construction (100.0%), Retail Trade (100.0%), and Administrative & Support (100.0%), whereas the industries that tend to have a higher number of women are Utilities (100.0%), Finance & Insurance (100.0%), and Health Care & Social Assistance (100.0%).
| Industry | Male | Female |
| Agriculture, Fishing & Hunting | 0 (0.0%) | 0 (0.0%) |
| Mining, Quarrying, & Extraction | 0 (0.0%) | 0 (0.0%) |
| Construction | 3 (100.0%) | 0 (0.0%) |
| Manufacturing | 0 (0.0%) | 0 (0.0%) |
| Wholesale Trade | 0 (0.0%) | 0 (0.0%) |
| Retail Trade | 6 (100.0%) | 0 (0.0%) |
| Transportation & Warehousing | 0 (0.0%) | 0 (0.0%) |
| Utilities | 0 (0.0%) | 5 (100.0%) |
| Information | 0 (0.0%) | 0 (0.0%) |
| Finance & Insurance | 0 (0.0%) | 2 (100.0%) |
| Real Estate, Rental & Leasing | 0 (0.0%) | 0 (0.0%) |
| Professional & Scientific | 0 (0.0%) | 0 (0.0%) |
| Enterprise Management | 0 (0.0%) | 0 (0.0%) |
| Administrative & Support | 3 (100.0%) | 0 (0.0%) |
| Educational Services | 0 (0.0%) | 0 (0.0%) |
| Health Care & Social Assistance | 0 (0.0%) | 2 (100.0%) |
| Arts, Entertainment & Recreation | 0 (0.0%) | 6 (100.0%) |
| Accommodation & Food Services | 0 (0.0%) | 0 (0.0%) |
| Public Administration | 12 (100.0%) | 0 (0.0%) |
| Total | 24 (61.5%) | 15 (38.5%) |
Education in Mahnomen
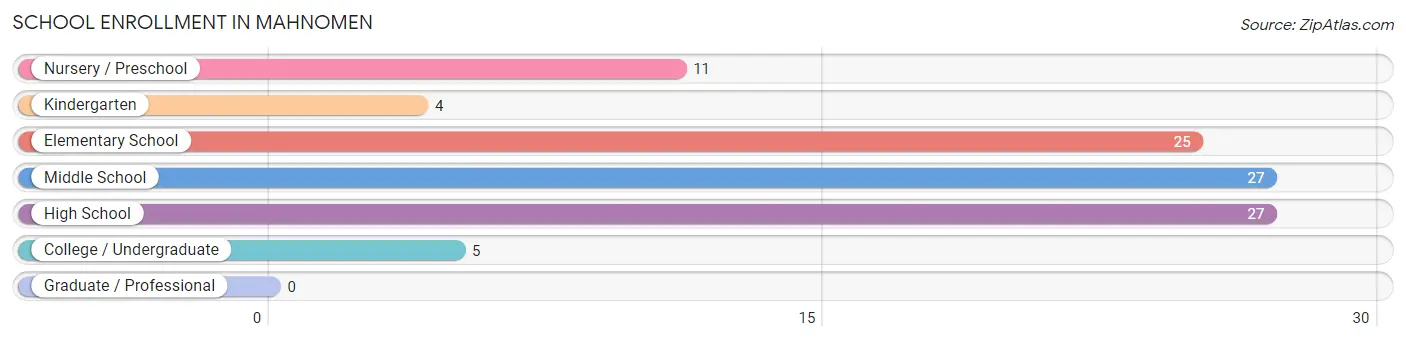
School Enrollment in Mahnomen
The most common levels of schooling among the 99 students in Mahnomen are middle school (27 | 27.3%), high school (27 | 27.3%), and elementary school (25 | 25.3%).
| School Level | # Students | % Students |
| Nursery / Preschool | 11 | 11.1% |
| Kindergarten | 4 | 4.0% |
| Elementary School | 25 | 25.3% |
| Middle School | 27 | 27.3% |
| High School | 27 | 27.3% |
| College / Undergraduate | 5 | 5.1% |
| Graduate / Professional | 0 | 0.0% |
| Total | 99 | 100.0% |
School Enrollment by Age by Funding Source in Mahnomen
Out of a total of 99 students who are enrolled in schools in Mahnomen, 23 (23.2%) attend a private institution, while the remaining 76 (76.8%) are enrolled in public schools. The age group of 18 to 19 year olds has the highest likelihood of being enrolled in private schools, with 5 (100.0% in the age bracket) enrolled. Conversely, the age group of 3 to 4 year olds has the lowest likelihood of being enrolled in a private school, with 3 (100.0% in the age bracket) attending a public institution.
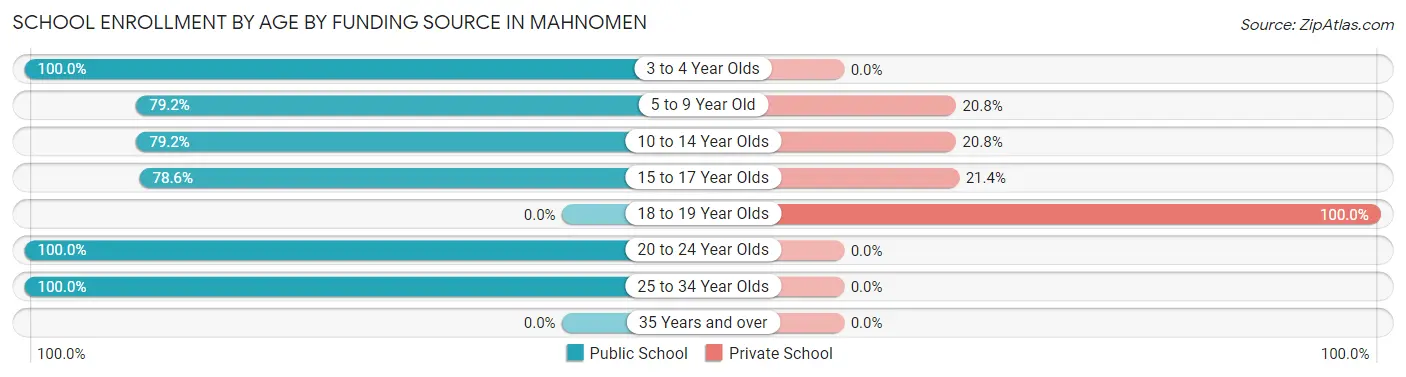
| Age Bracket | Public School | Private School |
| 3 to 4 Year Olds | 3 (100.0%) | 0 (0.0%) |
| 5 to 9 Year Old | 19 (79.2%) | 5 (20.8%) |
| 10 to 14 Year Olds | 38 (79.2%) | 10 (20.8%) |
| 15 to 17 Year Olds | 11 (78.6%) | 3 (21.4%) |
| 18 to 19 Year Olds | 0 (0.0%) | 5 (100.0%) |
| 20 to 24 Year Olds | 2 (100.0%) | 0 (0.0%) |
| 25 to 34 Year Olds | 3 (100.0%) | 0 (0.0%) |
| 35 Years and over | 0 (0.0%) | 0 (0.0%) |
| Total | 76 (76.8%) | 23 (23.2%) |
Educational Attainment by Field of Study in Mahnomen
Engineering (3 | 60.0%), and science & technology (2 | 40.0%) are the most common fields of study among 5 individuals in Mahnomen who have obtained a bachelor's degree or higher.
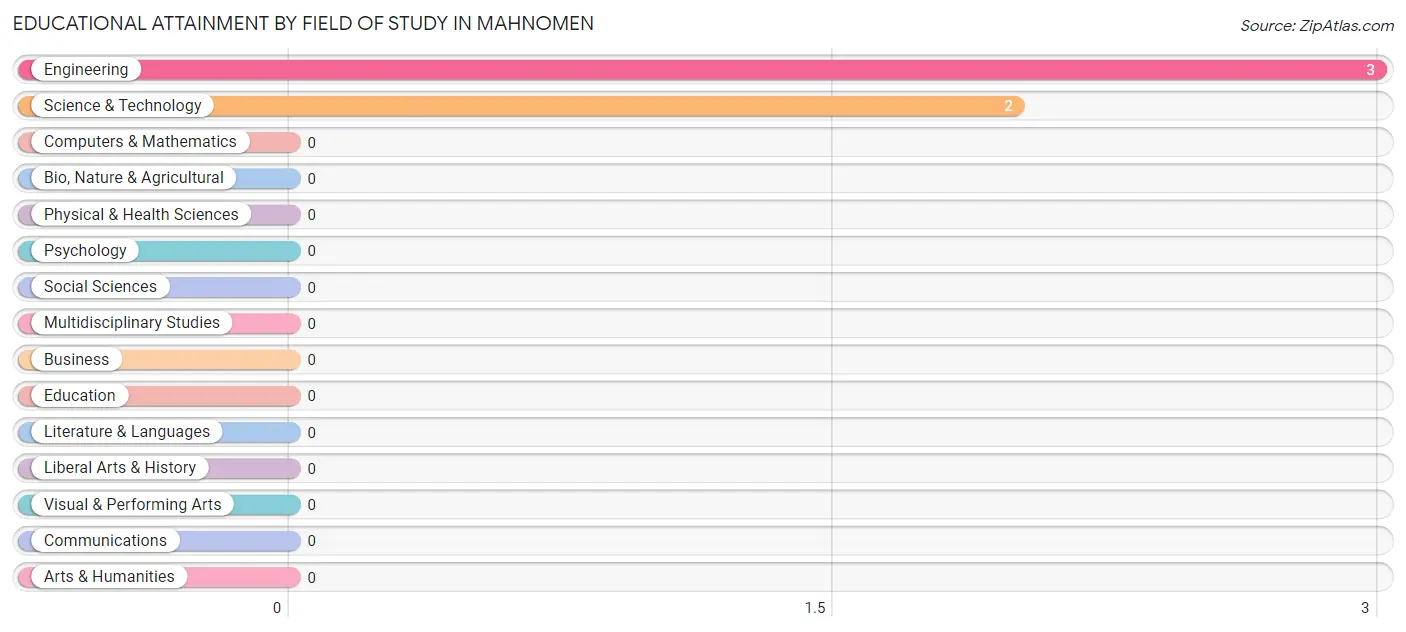
| Field of Study | # Graduates | % Graduates |
| Computers & Mathematics | 0 | 0.0% |
| Bio, Nature & Agricultural | 0 | 0.0% |
| Physical & Health Sciences | 0 | 0.0% |
| Psychology | 0 | 0.0% |
| Social Sciences | 0 | 0.0% |
| Engineering | 3 | 60.0% |
| Multidisciplinary Studies | 0 | 0.0% |
| Science & Technology | 2 | 40.0% |
| Business | 0 | 0.0% |
| Education | 0 | 0.0% |
| Literature & Languages | 0 | 0.0% |
| Liberal Arts & History | 0 | 0.0% |
| Visual & Performing Arts | 0 | 0.0% |
| Communications | 0 | 0.0% |
| Arts & Humanities | 0 | 0.0% |
| Total | 5 | 100.0% |
Transportation & Commute in Mahnomen
Vehicle Availability by Sex in Mahnomen
The most prevalent vehicle ownership categories in Mahnomen are males with 2 vehicles (9, accounting for 37.5%) and females with 2 vehicles (7, making up 60.0%).
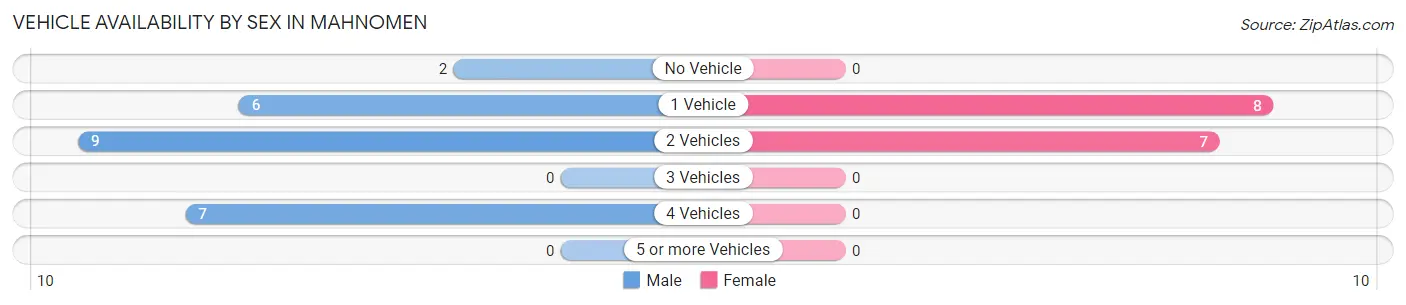
| Vehicles Available | Male | Female |
| No Vehicle | 2 (8.3%) | 0 (0.0%) |
| 1 Vehicle | 6 (25.0%) | 8 (53.3%) |
| 2 Vehicles | 9 (37.5%) | 7 (46.7%) |
| 3 Vehicles | 0 (0.0%) | 0 (0.0%) |
| 4 Vehicles | 7 (29.2%) | 0 (0.0%) |
| 5 or more Vehicles | 0 (0.0%) | 0 (0.0%) |
| Total | 24 (100.0%) | 15 (100.0%) |
Commute Time in Mahnomen
The most frequently occuring commute durations in Mahnomen are 20 to 24 minutes (14 commuters, 35.9%), 10 to 14 minutes (12 commuters, 30.8%), and 40 to 44 minutes (5 commuters, 12.8%).
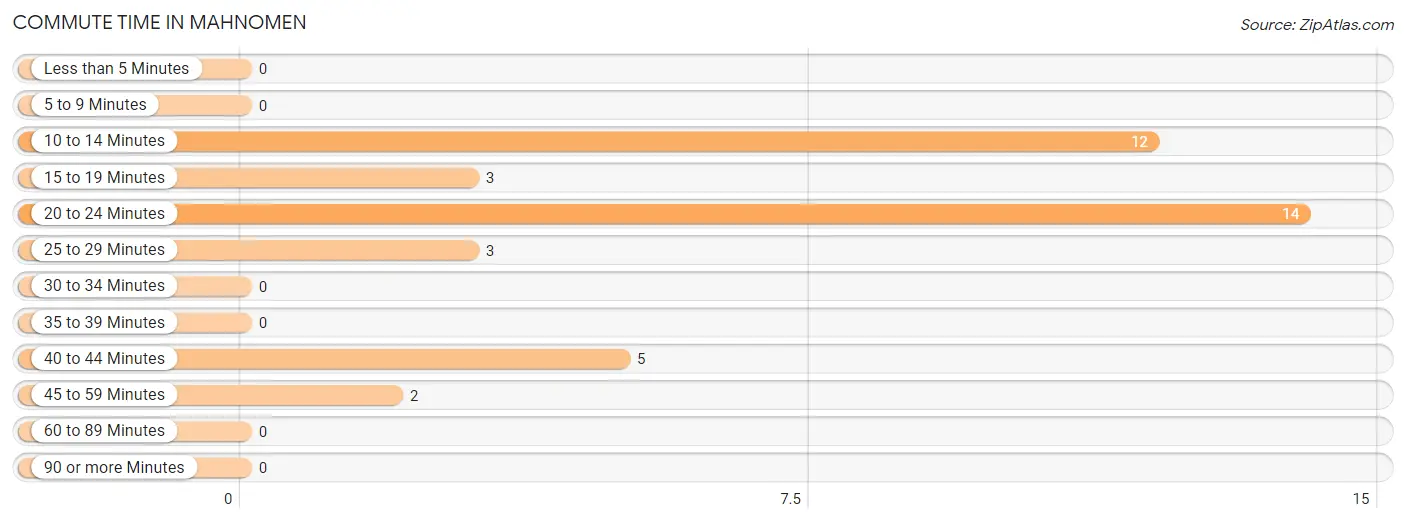
| Commute Time | # Commuters | % Commuters |
| Less than 5 Minutes | 0 | 0.0% |
| 5 to 9 Minutes | 0 | 0.0% |
| 10 to 14 Minutes | 12 | 30.8% |
| 15 to 19 Minutes | 3 | 7.7% |
| 20 to 24 Minutes | 14 | 35.9% |
| 25 to 29 Minutes | 3 | 7.7% |
| 30 to 34 Minutes | 0 | 0.0% |
| 35 to 39 Minutes | 0 | 0.0% |
| 40 to 44 Minutes | 5 | 12.8% |
| 45 to 59 Minutes | 2 | 5.1% |
| 60 to 89 Minutes | 0 | 0.0% |
| 90 or more Minutes | 0 | 0.0% |
Commute Time by Sex in Mahnomen
The most common commute times in Mahnomen are 10 to 14 minutes (10 commuters, 41.7%) for males and 20 to 24 minutes (5 commuters, 33.3%) for females.
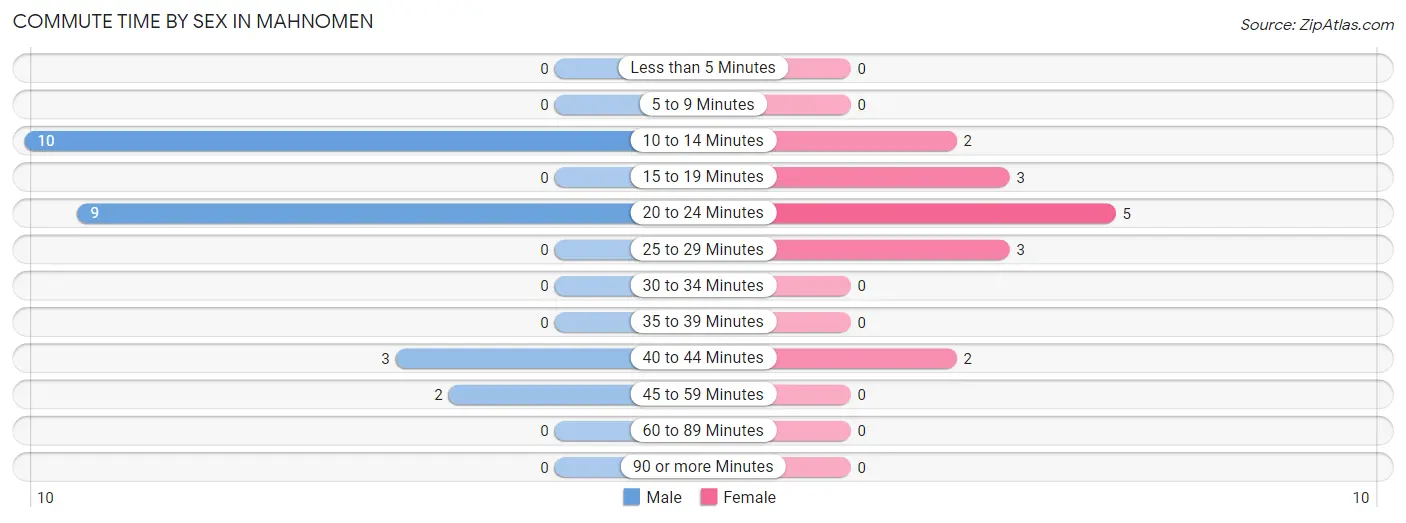
| Commute Time | Male | Female |
| Less than 5 Minutes | 0 (0.0%) | 0 (0.0%) |
| 5 to 9 Minutes | 0 (0.0%) | 0 (0.0%) |
| 10 to 14 Minutes | 10 (41.7%) | 2 (13.3%) |
| 15 to 19 Minutes | 0 (0.0%) | 3 (20.0%) |
| 20 to 24 Minutes | 9 (37.5%) | 5 (33.3%) |
| 25 to 29 Minutes | 0 (0.0%) | 3 (20.0%) |
| 30 to 34 Minutes | 0 (0.0%) | 0 (0.0%) |
| 35 to 39 Minutes | 0 (0.0%) | 0 (0.0%) |
| 40 to 44 Minutes | 3 (12.5%) | 2 (13.3%) |
| 45 to 59 Minutes | 2 (8.3%) | 0 (0.0%) |
| 60 to 89 Minutes | 0 (0.0%) | 0 (0.0%) |
| 90 or more Minutes | 0 (0.0%) | 0 (0.0%) |
Time of Departure to Work by Sex in Mahnomen
The most frequent times of departure to work in Mahnomen are 7:30 AM to 7:59 AM (13, 54.2%) for males and 5:00 AM to 5:29 AM (5, 33.3%) for females.
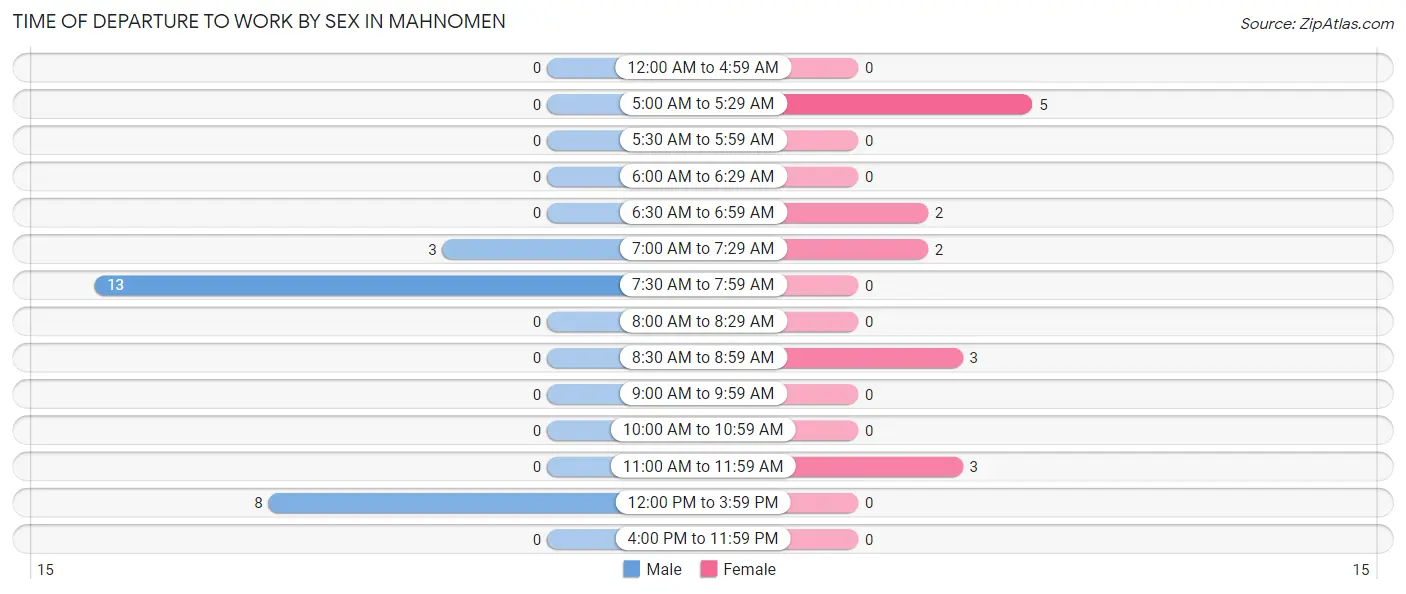
| Time of Departure | Male | Female |
| 12:00 AM to 4:59 AM | 0 (0.0%) | 0 (0.0%) |
| 5:00 AM to 5:29 AM | 0 (0.0%) | 5 (33.3%) |
| 5:30 AM to 5:59 AM | 0 (0.0%) | 0 (0.0%) |
| 6:00 AM to 6:29 AM | 0 (0.0%) | 0 (0.0%) |
| 6:30 AM to 6:59 AM | 0 (0.0%) | 2 (13.3%) |
| 7:00 AM to 7:29 AM | 3 (12.5%) | 2 (13.3%) |
| 7:30 AM to 7:59 AM | 13 (54.2%) | 0 (0.0%) |
| 8:00 AM to 8:29 AM | 0 (0.0%) | 0 (0.0%) |
| 8:30 AM to 8:59 AM | 0 (0.0%) | 3 (20.0%) |
| 9:00 AM to 9:59 AM | 0 (0.0%) | 0 (0.0%) |
| 10:00 AM to 10:59 AM | 0 (0.0%) | 0 (0.0%) |
| 11:00 AM to 11:59 AM | 0 (0.0%) | 3 (20.0%) |
| 12:00 PM to 3:59 PM | 8 (33.3%) | 0 (0.0%) |
| 4:00 PM to 11:59 PM | 0 (0.0%) | 0 (0.0%) |
| Total | 24 (100.0%) | 15 (100.0%) |
Housing Occupancy in Mahnomen
Occupancy by Ownership in Mahnomen
Of the total 424 dwellings in Mahnomen, owner-occupied units account for 229 (54.0%), while renter-occupied units make up 195 (46.0%).
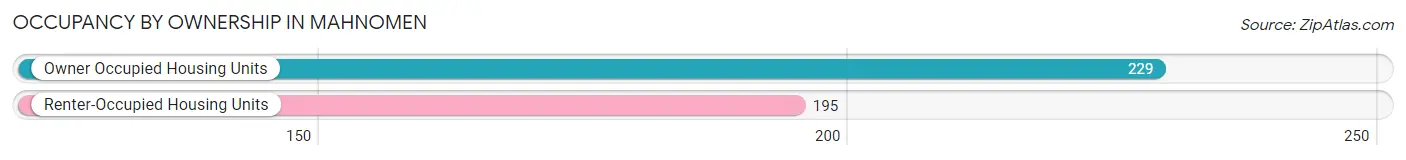
| Occupancy | # Housing Units | % Housing Units |
| Owner Occupied Housing Units | 229 | 54.0% |
| Renter-Occupied Housing Units | 195 | 46.0% |
| Total Occupied Housing Units | 424 | 100.0% |
Occupancy by Household Size in Mahnomen
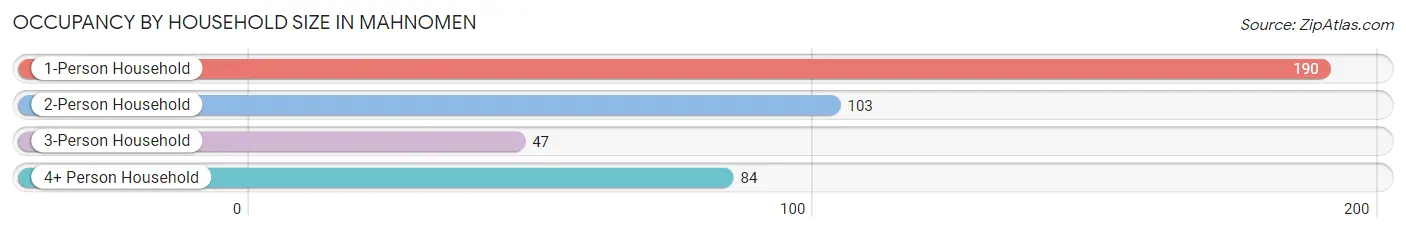
| Household Size | # Housing Units | % Housing Units |
| 1-Person Household | 190 | 44.8% |
| 2-Person Household | 103 | 24.3% |
| 3-Person Household | 47 | 11.1% |
| 4+ Person Household | 84 | 19.8% |
| Total Housing Units | 424 | 100.0% |
Occupancy by Ownership by Household Size in Mahnomen
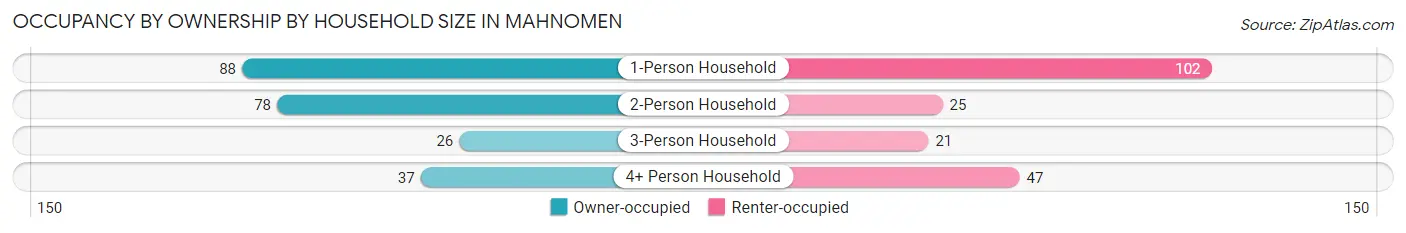
| Household Size | Owner-occupied | Renter-occupied |
| 1-Person Household | 88 (46.3%) | 102 (53.7%) |
| 2-Person Household | 78 (75.7%) | 25 (24.3%) |
| 3-Person Household | 26 (55.3%) | 21 (44.7%) |
| 4+ Person Household | 37 (44.1%) | 47 (55.9%) |
| Total Housing Units | 229 (54.0%) | 195 (46.0%) |
Occupancy by Educational Attainment in Mahnomen
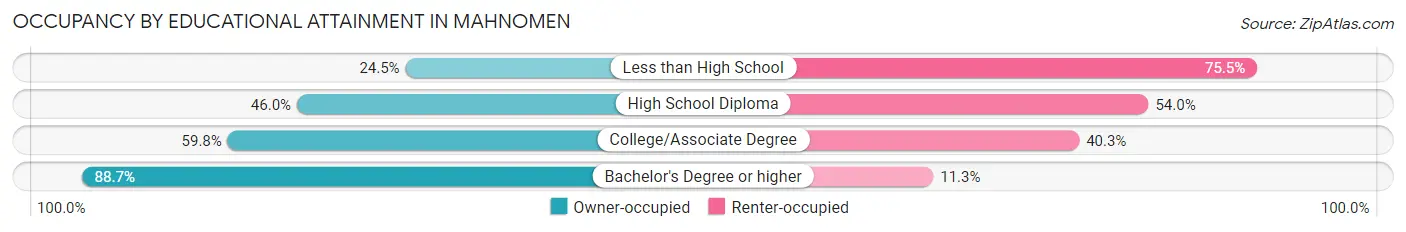
| Household Size | Owner-occupied | Renter-occupied |
| Less than High School | 12 (24.5%) | 37 (75.5%) |
| High School Diploma | 75 (46.0%) | 88 (54.0%) |
| College/Associate Degree | 95 (59.8%) | 64 (40.3%) |
| Bachelor's Degree or higher | 47 (88.7%) | 6 (11.3%) |
Occupancy by Age of Householder in Mahnomen
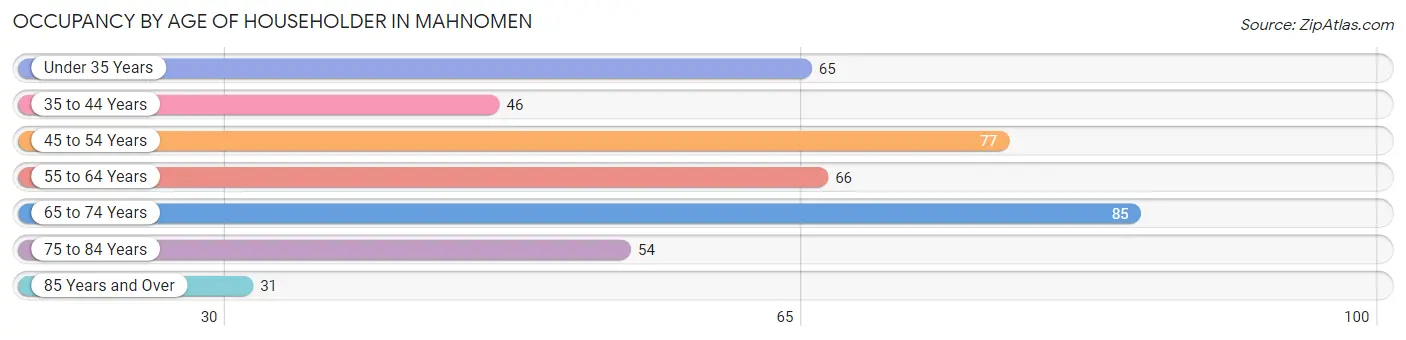
| Age Bracket | # Households | % Households |
| Under 35 Years | 65 | 15.3% |
| 35 to 44 Years | 46 | 10.8% |
| 45 to 54 Years | 77 | 18.2% |
| 55 to 64 Years | 66 | 15.6% |
| 65 to 74 Years | 85 | 20.1% |
| 75 to 84 Years | 54 | 12.7% |
| 85 Years and Over | 31 | 7.3% |
| Total | 424 | 100.0% |
Housing Finances in Mahnomen
Median Income by Occupancy in Mahnomen
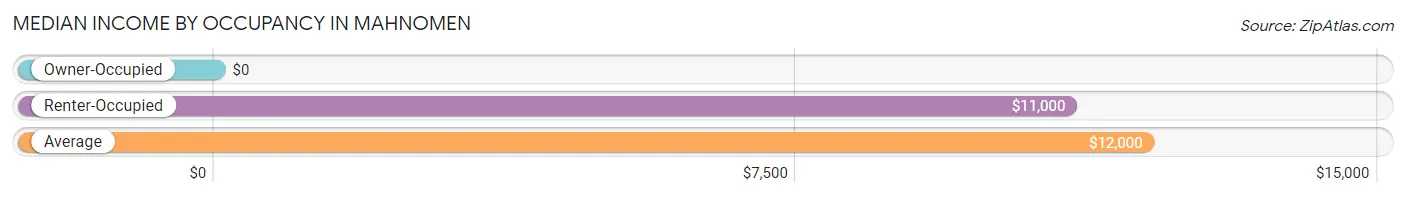
| Occupancy Type | # Households | Median Income |
| Owner-Occupied | 4 (10.5%) | $0 |
| Renter-Occupied | 34 (89.5%) | $11,000 |
| Average | 38 (100.0%) | $12,000 |
Occupancy by Householder Income Bracket in Mahnomen
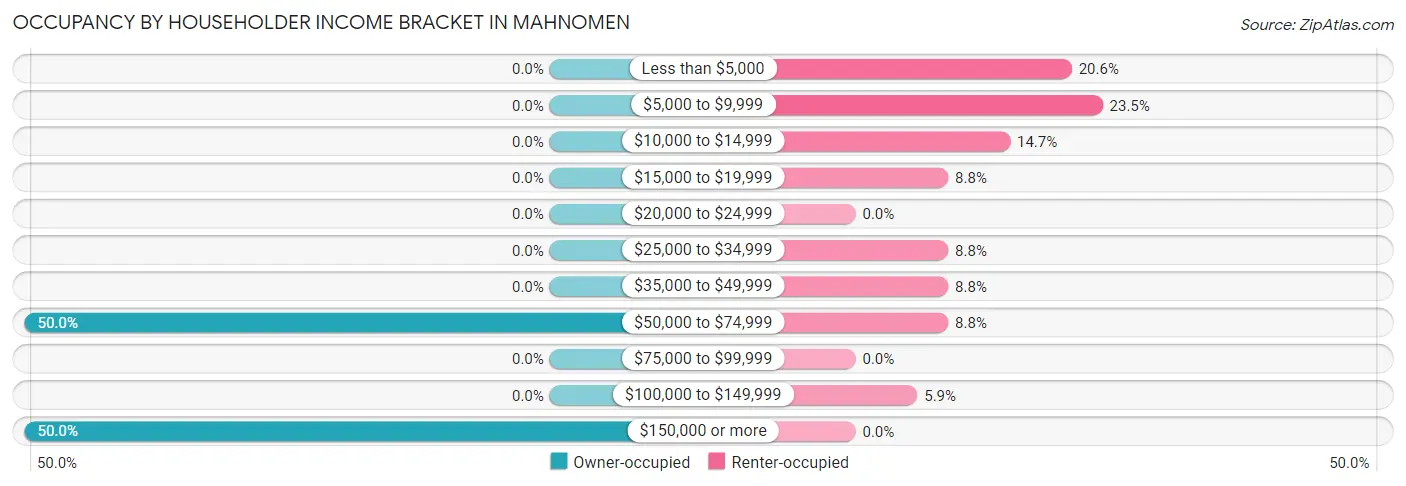
| Income Bracket | Owner-occupied | Renter-occupied |
| Less than $5,000 | 0 (0.0%) | 7 (20.6%) |
| $5,000 to $9,999 | 0 (0.0%) | 8 (23.5%) |
| $10,000 to $14,999 | 0 (0.0%) | 5 (14.7%) |
| $15,000 to $19,999 | 0 (0.0%) | 3 (8.8%) |
| $20,000 to $24,999 | 0 (0.0%) | 0 (0.0%) |
| $25,000 to $34,999 | 0 (0.0%) | 3 (8.8%) |
| $35,000 to $49,999 | 0 (0.0%) | 3 (8.8%) |
| $50,000 to $74,999 | 2 (50.0%) | 3 (8.8%) |
| $75,000 to $99,999 | 0 (0.0%) | 0 (0.0%) |
| $100,000 to $149,999 | 0 (0.0%) | 2 (5.9%) |
| $150,000 or more | 2 (50.0%) | 0 (0.0%) |
| Total | 4 (100.0%) | 34 (100.0%) |
Monthly Housing Cost Tiers in Mahnomen
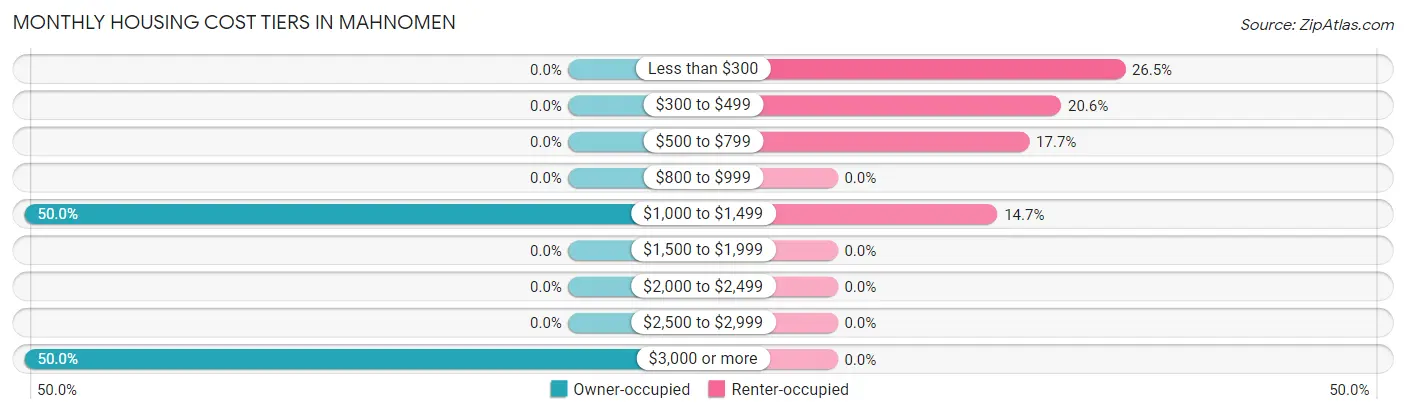
| Monthly Cost | Owner-occupied | Renter-occupied |
| Less than $300 | 0 (0.0%) | 9 (26.5%) |
| $300 to $499 | 0 (0.0%) | 7 (20.6%) |
| $500 to $799 | 0 (0.0%) | 6 (17.6%) |
| $800 to $999 | 0 (0.0%) | 0 (0.0%) |
| $1,000 to $1,499 | 2 (50.0%) | 5 (14.7%) |
| $1,500 to $1,999 | 0 (0.0%) | 0 (0.0%) |
| $2,000 to $2,499 | 0 (0.0%) | 0 (0.0%) |
| $2,500 to $2,999 | 0 (0.0%) | 0 (0.0%) |
| $3,000 or more | 2 (50.0%) | 0 (0.0%) |
| Total | 4 (100.0%) | 34 (100.0%) |
Physical Housing Characteristics in Mahnomen
Housing Structures in Mahnomen
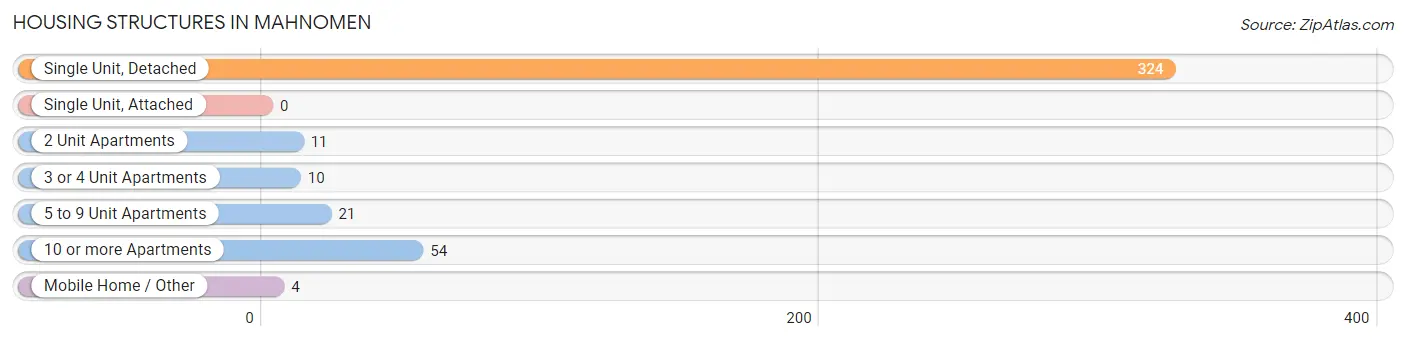
| Structure Type | # Housing Units | % Housing Units |
| Single Unit, Detached | 324 | 76.4% |
| Single Unit, Attached | 0 | 0.0% |
| 2 Unit Apartments | 11 | 2.6% |
| 3 or 4 Unit Apartments | 10 | 2.4% |
| 5 to 9 Unit Apartments | 21 | 5.0% |
| 10 or more Apartments | 54 | 12.7% |
| Mobile Home / Other | 4 | 0.9% |
| Total | 424 | 100.0% |
Housing Structures by Occupancy in Mahnomen
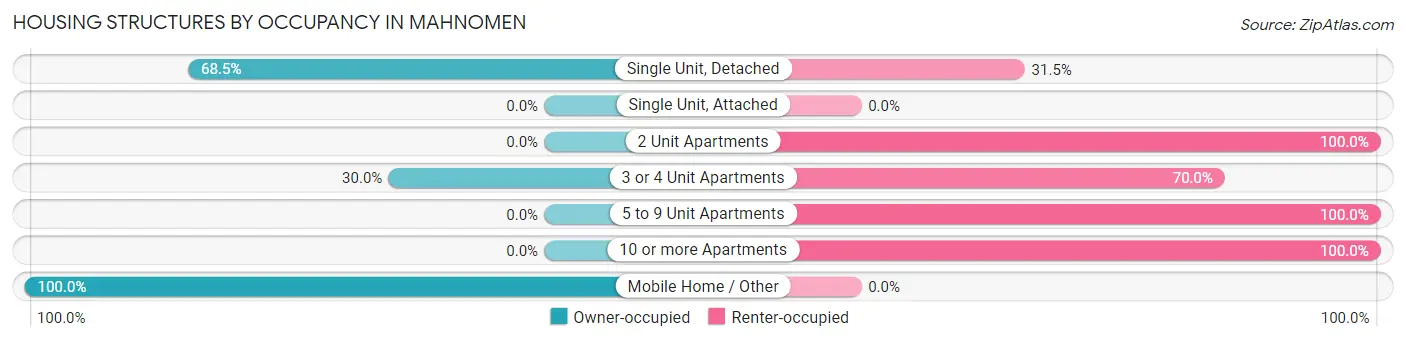
| Structure Type | Owner-occupied | Renter-occupied |
| Single Unit, Detached | 222 (68.5%) | 102 (31.5%) |
| Single Unit, Attached | 0 (0.0%) | 0 (0.0%) |
| 2 Unit Apartments | 0 (0.0%) | 11 (100.0%) |
| 3 or 4 Unit Apartments | 3 (30.0%) | 7 (70.0%) |
| 5 to 9 Unit Apartments | 0 (0.0%) | 21 (100.0%) |
| 10 or more Apartments | 0 (0.0%) | 54 (100.0%) |
| Mobile Home / Other | 4 (100.0%) | 0 (0.0%) |
| Total | 229 (54.0%) | 195 (46.0%) |
Housing Structures by Number of Rooms in Mahnomen
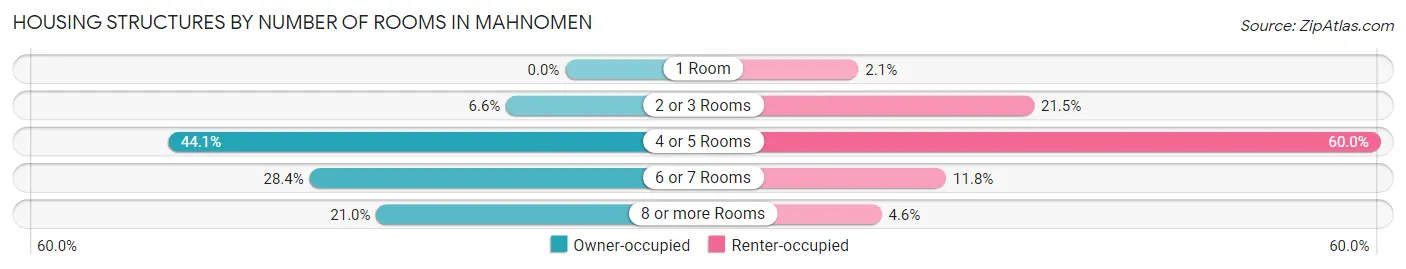
| Number of Rooms | Owner-occupied | Renter-occupied |
| 1 Room | 0 (0.0%) | 4 (2.1%) |
| 2 or 3 Rooms | 15 (6.6%) | 42 (21.5%) |
| 4 or 5 Rooms | 101 (44.1%) | 117 (60.0%) |
| 6 or 7 Rooms | 65 (28.4%) | 23 (11.8%) |
| 8 or more Rooms | 48 (21.0%) | 9 (4.6%) |
| Total | 229 (100.0%) | 195 (100.0%) |
Housing Structure by Heating Type in Mahnomen
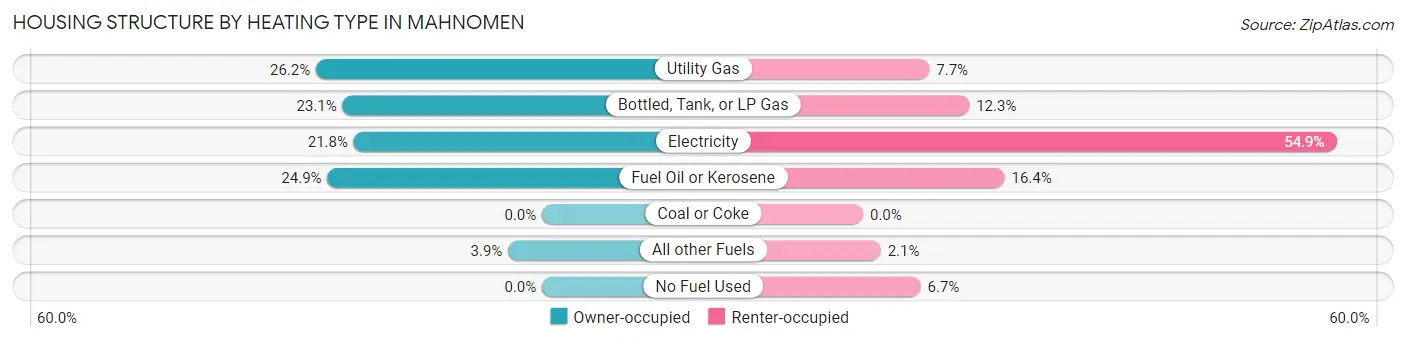
| Heating Type | Owner-occupied | Renter-occupied |
| Utility Gas | 60 (26.2%) | 15 (7.7%) |
| Bottled, Tank, or LP Gas | 53 (23.1%) | 24 (12.3%) |
| Electricity | 50 (21.8%) | 107 (54.9%) |
| Fuel Oil or Kerosene | 57 (24.9%) | 32 (16.4%) |
| Coal or Coke | 0 (0.0%) | 0 (0.0%) |
| All other Fuels | 9 (3.9%) | 4 (2.1%) |
| No Fuel Used | 0 (0.0%) | 13 (6.7%) |
| Total | 229 (100.0%) | 195 (100.0%) |
Household Vehicle Usage in Mahnomen
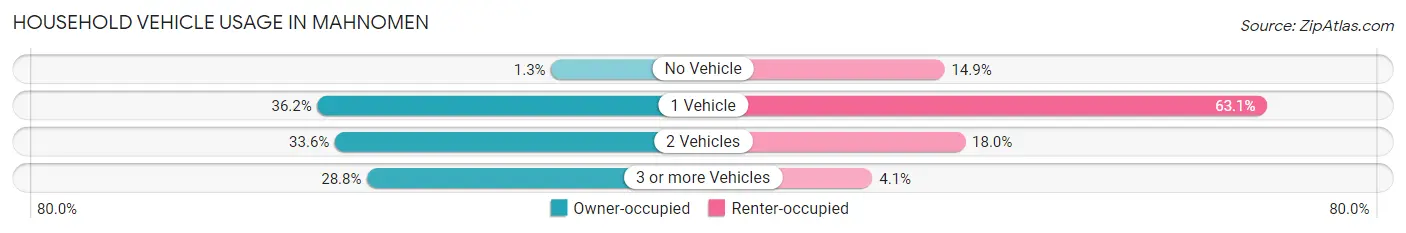
| Vehicles per Household | Owner-occupied | Renter-occupied |
| No Vehicle | 3 (1.3%) | 29 (14.9%) |
| 1 Vehicle | 83 (36.2%) | 123 (63.1%) |
| 2 Vehicles | 77 (33.6%) | 35 (17.9%) |
| 3 or more Vehicles | 66 (28.8%) | 8 (4.1%) |
| Total | 229 (100.0%) | 195 (100.0%) |
Real Estate & Mortgages in Mahnomen
Real Estate and Mortgage Overview in Mahnomen
| Characteristic | Without Mortgage | With Mortgage |
| Housing Units | 113 | 4 |
| Median Property Value | $74,400 | $0 |
| Median Household Income | $40,313 | $2 |
| Monthly Housing Costs | $384 | $2 |
| Real Estate Taxes | $852 | $2 |
Property Value by Mortgage Status in Mahnomen
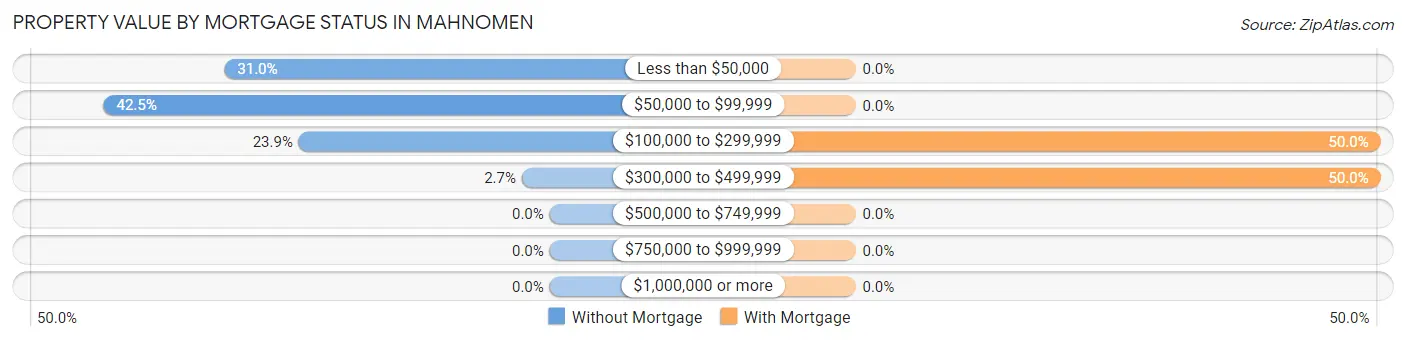
| Property Value | Without Mortgage | With Mortgage |
| Less than $50,000 | 35 (31.0%) | 0 (0.0%) |
| $50,000 to $99,999 | 48 (42.5%) | 0 (0.0%) |
| $100,000 to $299,999 | 27 (23.9%) | 2 (50.0%) |
| $300,000 to $499,999 | 3 (2.6%) | 2 (50.0%) |
| $500,000 to $749,999 | 0 (0.0%) | 0 (0.0%) |
| $750,000 to $999,999 | 0 (0.0%) | 0 (0.0%) |
| $1,000,000 or more | 0 (0.0%) | 0 (0.0%) |
| Total | 113 (100.0%) | 4 (100.0%) |
Household Income by Mortgage Status in Mahnomen
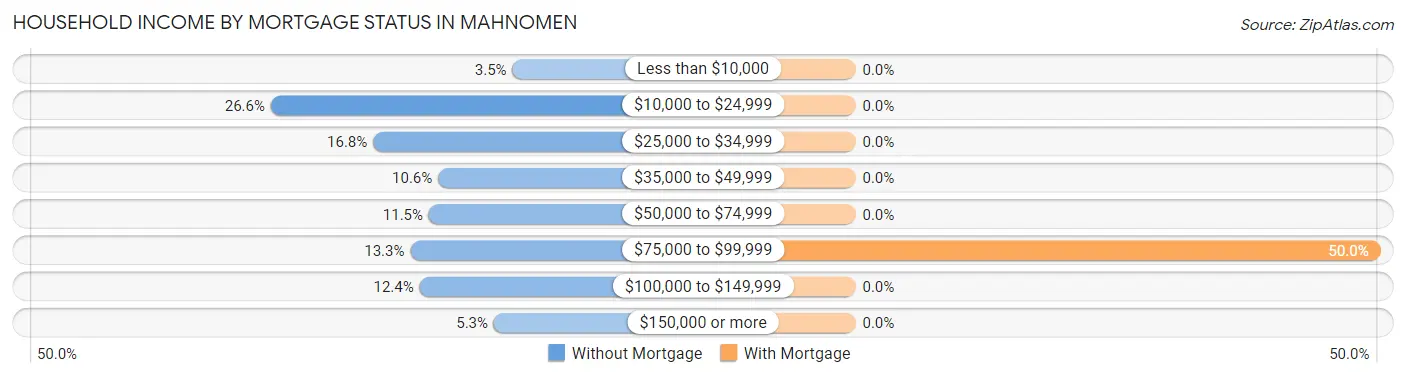
| Household Income | Without Mortgage | With Mortgage |
| Less than $10,000 | 4 (3.5%) | 0 (0.0%) |
| $10,000 to $24,999 | 30 (26.6%) | 0 (0.0%) |
| $25,000 to $34,999 | 19 (16.8%) | 0 (0.0%) |
| $35,000 to $49,999 | 12 (10.6%) | 0 (0.0%) |
| $50,000 to $74,999 | 13 (11.5%) | 0 (0.0%) |
| $75,000 to $99,999 | 15 (13.3%) | 2 (50.0%) |
| $100,000 to $149,999 | 14 (12.4%) | 0 (0.0%) |
| $150,000 or more | 6 (5.3%) | 0 (0.0%) |
| Total | 113 (100.0%) | 4 (100.0%) |
Property Value to Household Income Ratio in Mahnomen
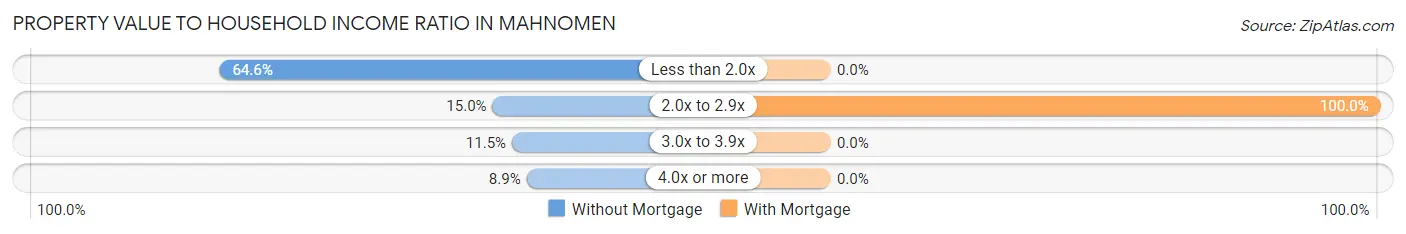
| Value-to-Income Ratio | Without Mortgage | With Mortgage |
| Less than 2.0x | 73 (64.6%) | 0 (0.0%) |
| 2.0x to 2.9x | 17 (15.0%) | 4 (100.0%) |
| 3.0x to 3.9x | 13 (11.5%) | 0 (0.0%) |
| 4.0x or more | 10 (8.8%) | 0 (0.0%) |
| Total | 113 (100.0%) | 4 (100.0%) |
Real Estate Taxes by Mortgage Status in Mahnomen
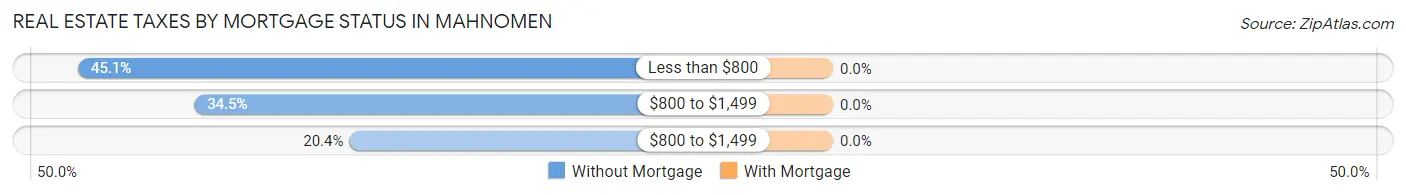
| Property Taxes | Without Mortgage | With Mortgage |
| Less than $800 | 51 (45.1%) | 0 (0.0%) |
| $800 to $1,499 | 39 (34.5%) | 0 (0.0%) |
| $800 to $1,499 | 23 (20.3%) | 0 (0.0%) |
| Total | 113 (100.0%) | 4 (100.0%) |
Health & Disability in Mahnomen
Health Insurance Coverage by Age in Mahnomen
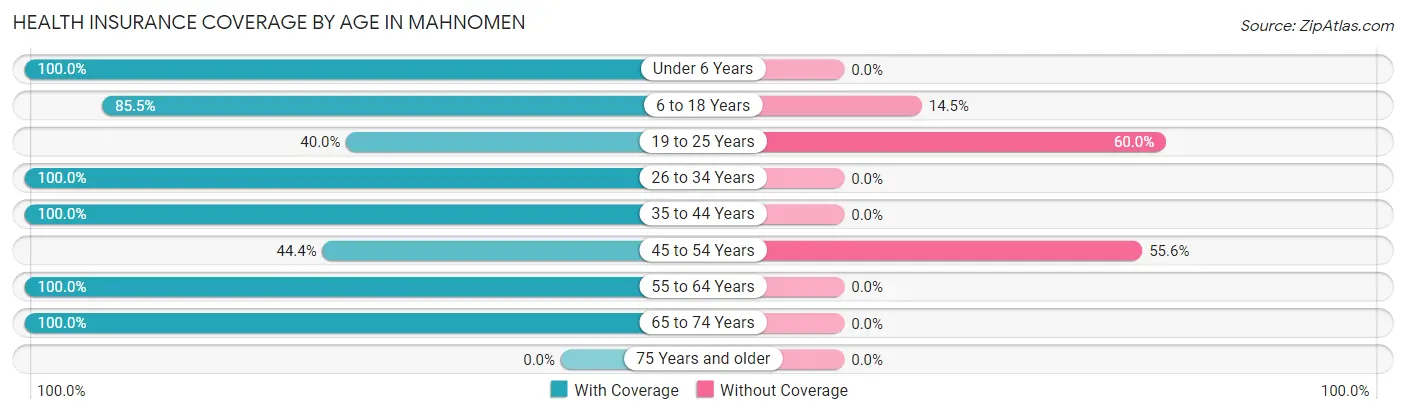
| Age Bracket | With Coverage | Without Coverage |
| Under 6 Years | 24 (100.0%) | 0 (0.0%) |
| 6 to 18 Years | 71 (85.5%) | 12 (14.5%) |
| 19 to 25 Years | 12 (40.0%) | 18 (60.0%) |
| 26 to 34 Years | 13 (100.0%) | 0 (0.0%) |
| 35 to 44 Years | 16 (100.0%) | 0 (0.0%) |
| 45 to 54 Years | 8 (44.4%) | 10 (55.6%) |
| 55 to 64 Years | 3 (100.0%) | 0 (0.0%) |
| 65 to 74 Years | 3 (100.0%) | 0 (0.0%) |
| 75 Years and older | 0 (0.0%) | 0 (0.0%) |
| Total | 150 (78.9%) | 40 (21.0%) |
Health Insurance Coverage by Citizenship Status in Mahnomen
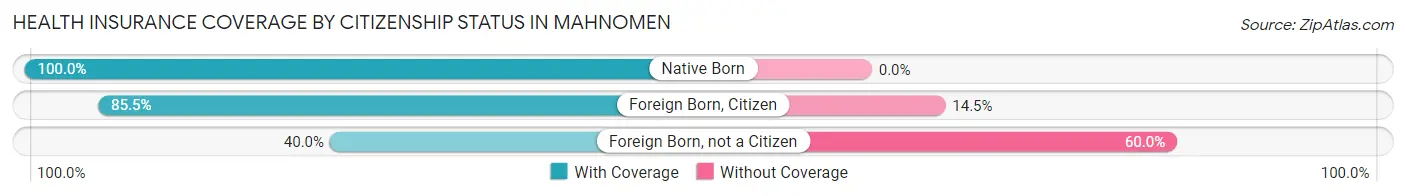
| Citizenship Status | With Coverage | Without Coverage |
| Native Born | 24 (100.0%) | 0 (0.0%) |
| Foreign Born, Citizen | 71 (85.5%) | 12 (14.5%) |
| Foreign Born, not a Citizen | 12 (40.0%) | 18 (60.0%) |
Health Insurance Coverage by Household Income in Mahnomen
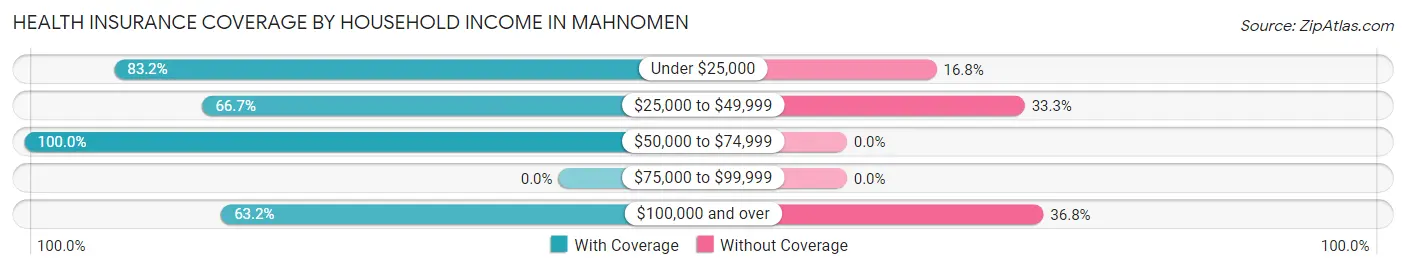
| Household Income | With Coverage | Without Coverage |
| Under $25,000 | 89 (83.2%) | 18 (16.8%) |
| $25,000 to $49,999 | 30 (66.7%) | 15 (33.3%) |
| $50,000 to $74,999 | 19 (100.0%) | 0 (0.0%) |
| $75,000 to $99,999 | 0 (0.0%) | 0 (0.0%) |
| $100,000 and over | 12 (63.2%) | 7 (36.8%) |
Public vs Private Health Insurance Coverage by Age in Mahnomen
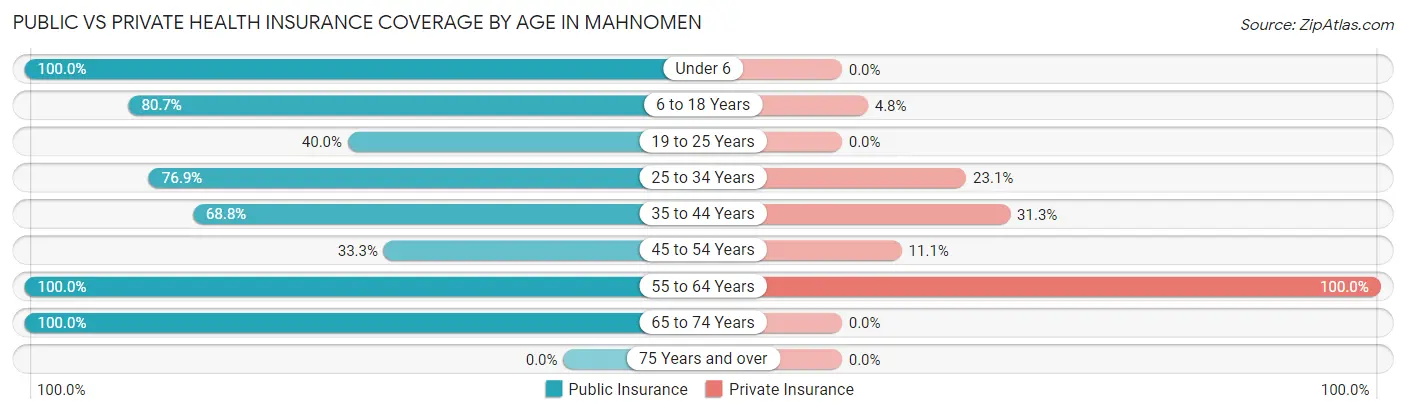
| Age Bracket | Public Insurance | Private Insurance |
| Under 6 | 24 (100.0%) | 0 (0.0%) |
| 6 to 18 Years | 67 (80.7%) | 4 (4.8%) |
| 19 to 25 Years | 12 (40.0%) | 0 (0.0%) |
| 25 to 34 Years | 10 (76.9%) | 3 (23.1%) |
| 35 to 44 Years | 11 (68.8%) | 5 (31.2%) |
| 45 to 54 Years | 6 (33.3%) | 2 (11.1%) |
| 55 to 64 Years | 3 (100.0%) | 3 (100.0%) |
| 65 to 74 Years | 3 (100.0%) | 0 (0.0%) |
| 75 Years and over | 0 (0.0%) | 0 (0.0%) |
| Total | 136 (71.6%) | 17 (8.9%) |
Disability Status by Sex by Age in Mahnomen
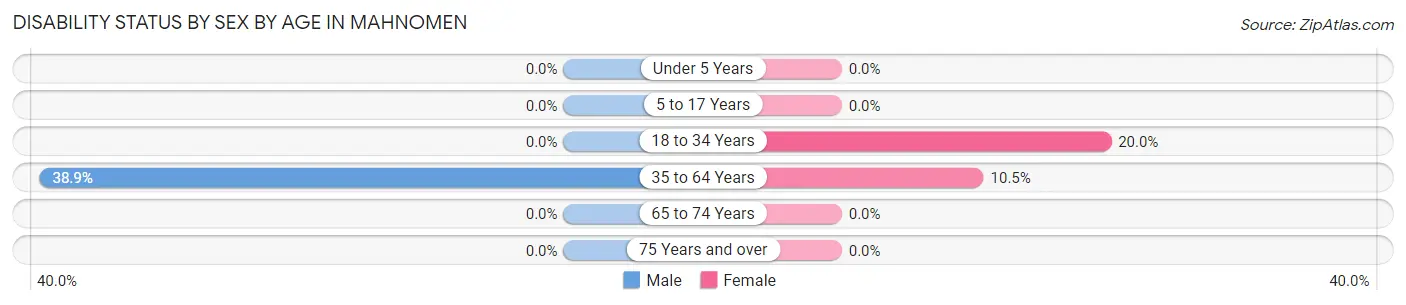
| Age Bracket | Male | Female |
| Under 5 Years | 0 (0.0%) | 0 (0.0%) |
| 5 to 17 Years | 0 (0.0%) | 0 (0.0%) |
| 18 to 34 Years | 0 (0.0%) | 5 (20.0%) |
| 35 to 64 Years | 7 (38.9%) | 2 (10.5%) |
| 65 to 74 Years | 0 (0.0%) | 0 (0.0%) |
| 75 Years and over | 0 (0.0%) | 0 (0.0%) |
Disability Class by Sex by Age in Mahnomen
Disability Class: Hearing Difficulty
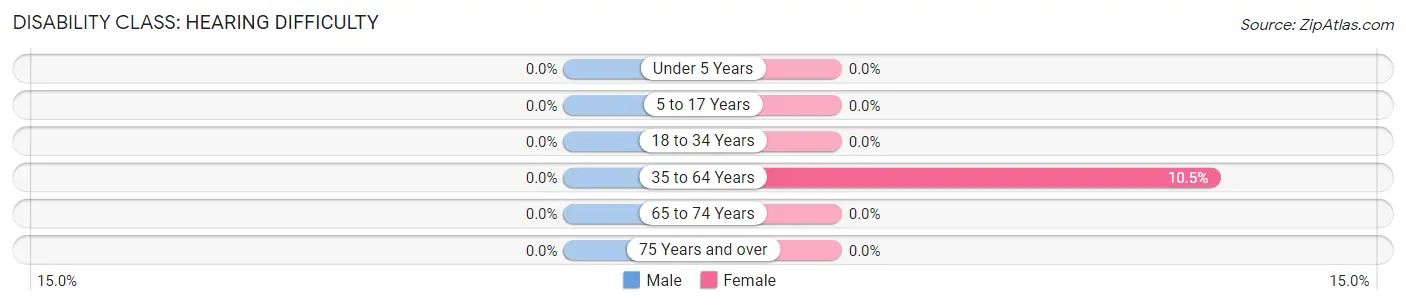
| Age Bracket | Male | Female |
| Under 5 Years | 0 (0.0%) | 0 (0.0%) |
| 5 to 17 Years | 0 (0.0%) | 0 (0.0%) |
| 18 to 34 Years | 0 (0.0%) | 0 (0.0%) |
| 35 to 64 Years | 0 (0.0%) | 2 (10.5%) |
| 65 to 74 Years | 0 (0.0%) | 0 (0.0%) |
| 75 Years and over | 0 (0.0%) | 0 (0.0%) |
Disability Class: Vision Difficulty
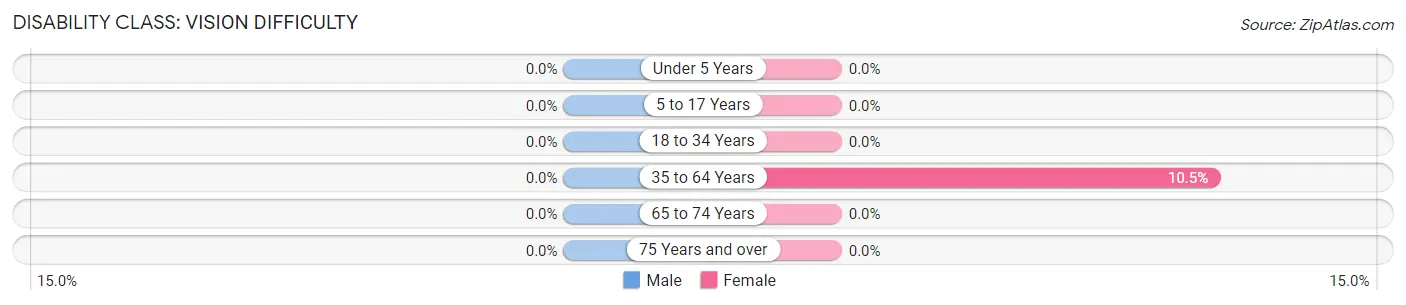
| Age Bracket | Male | Female |
| Under 5 Years | 0 (0.0%) | 0 (0.0%) |
| 5 to 17 Years | 0 (0.0%) | 0 (0.0%) |
| 18 to 34 Years | 0 (0.0%) | 0 (0.0%) |
| 35 to 64 Years | 0 (0.0%) | 2 (10.5%) |
| 65 to 74 Years | 0 (0.0%) | 0 (0.0%) |
| 75 Years and over | 0 (0.0%) | 0 (0.0%) |
Disability Class: Cognitive Difficulty
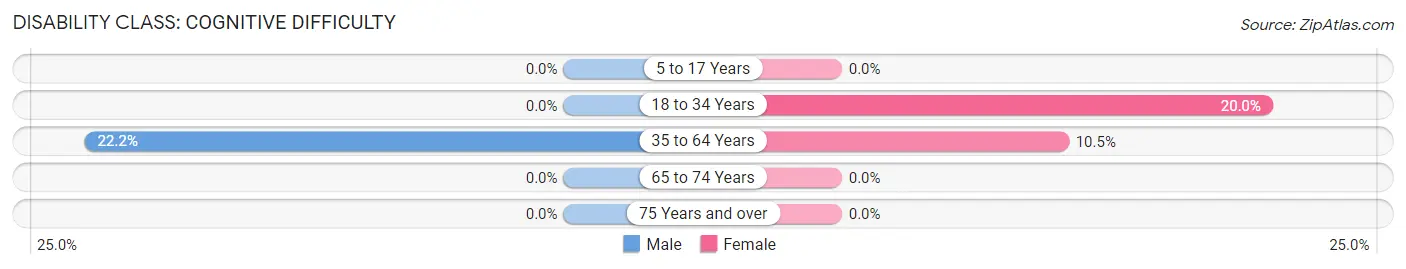
| Age Bracket | Male | Female |
| 5 to 17 Years | 0 (0.0%) | 0 (0.0%) |
| 18 to 34 Years | 0 (0.0%) | 5 (20.0%) |
| 35 to 64 Years | 4 (22.2%) | 2 (10.5%) |
| 65 to 74 Years | 0 (0.0%) | 0 (0.0%) |
| 75 Years and over | 0 (0.0%) | 0 (0.0%) |
Disability Class: Ambulatory Difficulty
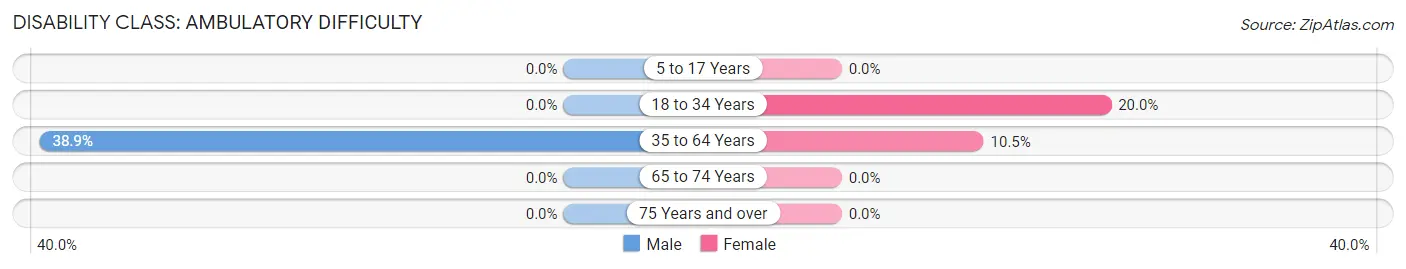
| Age Bracket | Male | Female |
| 5 to 17 Years | 0 (0.0%) | 0 (0.0%) |
| 18 to 34 Years | 0 (0.0%) | 5 (20.0%) |
| 35 to 64 Years | 7 (38.9%) | 2 (10.5%) |
| 65 to 74 Years | 0 (0.0%) | 0 (0.0%) |
| 75 Years and over | 0 (0.0%) | 0 (0.0%) |
Disability Class: Self-Care Difficulty
| Age Bracket | Male | Female |
| 5 to 17 Years | 0 (0.0%) | 0 (0.0%) |
| 18 to 34 Years | 0 (0.0%) | 0 (0.0%) |
| 35 to 64 Years | 0 (0.0%) | 0 (0.0%) |
| 65 to 74 Years | 0 (0.0%) | 0 (0.0%) |
| 75 Years and over | 0 (0.0%) | 0 (0.0%) |
Technology Access in Mahnomen
Computing Device Access in Mahnomen
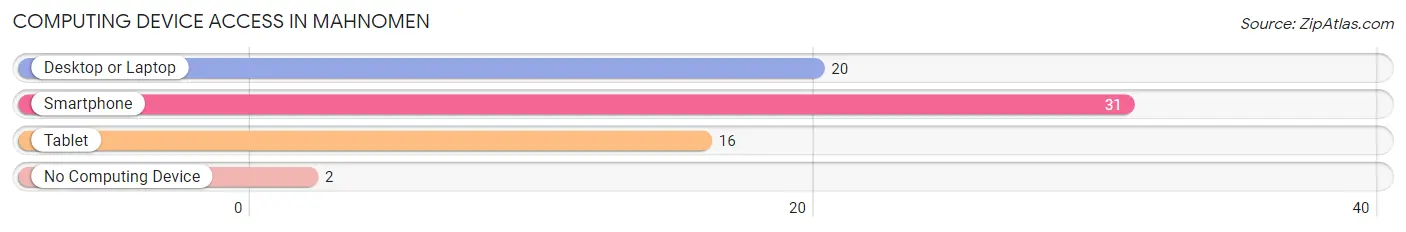
| Device Type | # Households | % Households |
| Desktop or Laptop | 20 | 52.6% |
| Smartphone | 31 | 81.6% |
| Tablet | 16 | 42.1% |
| No Computing Device | 2 | 5.3% |
| Total | 38 | 100.0% |
Internet Access in Mahnomen
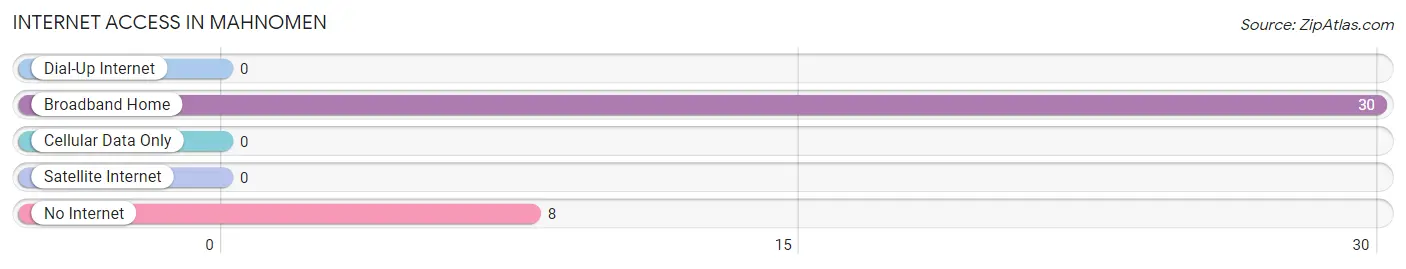
| Internet Type | # Households | % Households |
| Dial-Up Internet | 0 | 0.0% |
| Broadband Home | 30 | 78.9% |
| Cellular Data Only | 0 | 0.0% |
| Satellite Internet | 0 | 0.0% |
| No Internet | 8 | 21.0% |
| Total | 38 | 100.0% |
Mahnomen Summary
Mahnomen is a city located in northwestern Minnesota, United States. It is the county seat of Mahnomen County and is located along the Wild Rice River. The population was 1,214 at the 2010 census.
History
Mahnomen was first settled in 1871 by a group of Norwegian immigrants. The city was named after the Ojibwe word for wild rice, which was abundant in the area. The city was incorporated in 1881 and was the first city in Mahnomen County.
In the late 19th century, Mahnomen was a major trading center for the surrounding area. It was also a major stop on the Great Northern Railway. The city was home to a number of businesses, including a flour mill, a creamery, a lumber mill, and a hotel.
Geography
Mahnomen is located at the intersection of U.S. Route 59 and Minnesota State Highway 200. It is approximately 75 miles northwest of Fargo, North Dakota and 90 miles east of Grand Forks, North Dakota.
The city is situated on the Wild Rice River, which flows through the city and is a major tributary of the Red River of the North. The city is located in a rolling, wooded area of northwestern Minnesota.
Economy
Mahnomen's economy is largely based on agriculture and tourism. The city is home to a number of farms, which produce a variety of crops, including corn, soybeans, wheat, and hay.
The city is also home to a number of tourist attractions, including the Mahnomen County Historical Museum, the Mahnomen County Fairgrounds, and the Mahnomen County Park. The city is also home to a number of restaurants, bars, and hotels.
Demographics
As of the 2010 census, there were 1,214 people, 486 households, and 308 families residing in the city. The population density was 1,092.3 people per square mile (421.7/km2). There were 545 housing units at an average density of 483.3 per square mile (186.7/km2). The racial makeup of the city was 94.2% White, 0.2% African American, 3.3% Native American, 0.2% Asian, 0.2% from other races, and 1.9% from two or more races. Hispanic or Latino of any race were 0.7% of the population.
There were 486 households, out of which 28.2% had children under the age of 18 living with them, 46.3% were married couples living together, 11.3% had a female householder with no husband present, and 37.2% were non-families. 33.2% of all households were made up of individuals, and 16.2% had someone living alone who was 65 years of age or older. The average household size was 2.41 and the average family size was 3.06.
In the city, the population was spread out, with 25.7% under the age of 18, 8.2% from 18 to 24, 24.2% from 25 to 44, 22.2% from 45 to 64, and 19.7% who were 65 years of age or older. The median age was 39 years. For every 100 females, there were 91.2 males. For every 100 females age 18 and over, there were 87.2 males.
The median income for a household in the city was $30,000, and the median income for a family was $36,250. Males had a median income of $30,000 versus $20,000 for females. The per capita income for the city was $14,945. About 11.2% of families and 14.2% of the population were below the poverty line, including 19.2% of those under age 18 and 11.2% of those age 65 or over.
Common Questions
What is Per Capita Income in Mahnomen?
Per Capita income in Mahnomen is $8,325.
What is the Median Family Income in Mahnomen?
Median Family Income in Mahnomen is $11,667.
What is the Median Household income in Mahnomen?
Median Household Income in Mahnomen is $12,000.
What is Income or Wage Gap in Mahnomen?
Income or Wage Gap in Mahnomen is 2.5%.
Women in Mahnomen earn 97.5 cents for every dollar earned by a man.
What is Inequality or Gini Index in Mahnomen?
Inequality or Gini Index in Mahnomen is 0.64.
What is the Total Population of Mahnomen?
Total Population of Mahnomen is 190.
What is the Total Male Population of Mahnomen?
Total Male Population of Mahnomen is 98.
What is the Total Female Population of Mahnomen?
Total Female Population of Mahnomen is 92.
What is the Ratio of Males per 100 Females in Mahnomen?
There are 106.52 Males per 100 Females in Mahnomen.
What is the Ratio of Females per 100 Males in Mahnomen?
There are 93.88 Females per 100 Males in Mahnomen.
What is the Median Population Age in Mahnomen?
Median Population Age in Mahnomen is 16.6 Years.
What is the Average Family Size in Mahnomen
Average Family Size in Mahnomen is 5.0 People.
What is the Average Household Size in Mahnomen
Average Household Size in Mahnomen is 5.0 People.
How Large is the Labor Force in Mahnomen?
There are 59 People in the Labor Forcein in Mahnomen.
What is the Percentage of People in the Labor Force in Mahnomen?
59.0% of People are in the Labor Force in Mahnomen.
What is the Unemployment Rate in Mahnomen?
Unemployment Rate in Mahnomen is 33.9%.