Zip Codes with the Highest Percentage of Population Employed in Administrative & Support Services in Minnesota
RELATED REPORTS & OPTIONS
Administrative & Support Services
Minnesota
Compare Zip Codes
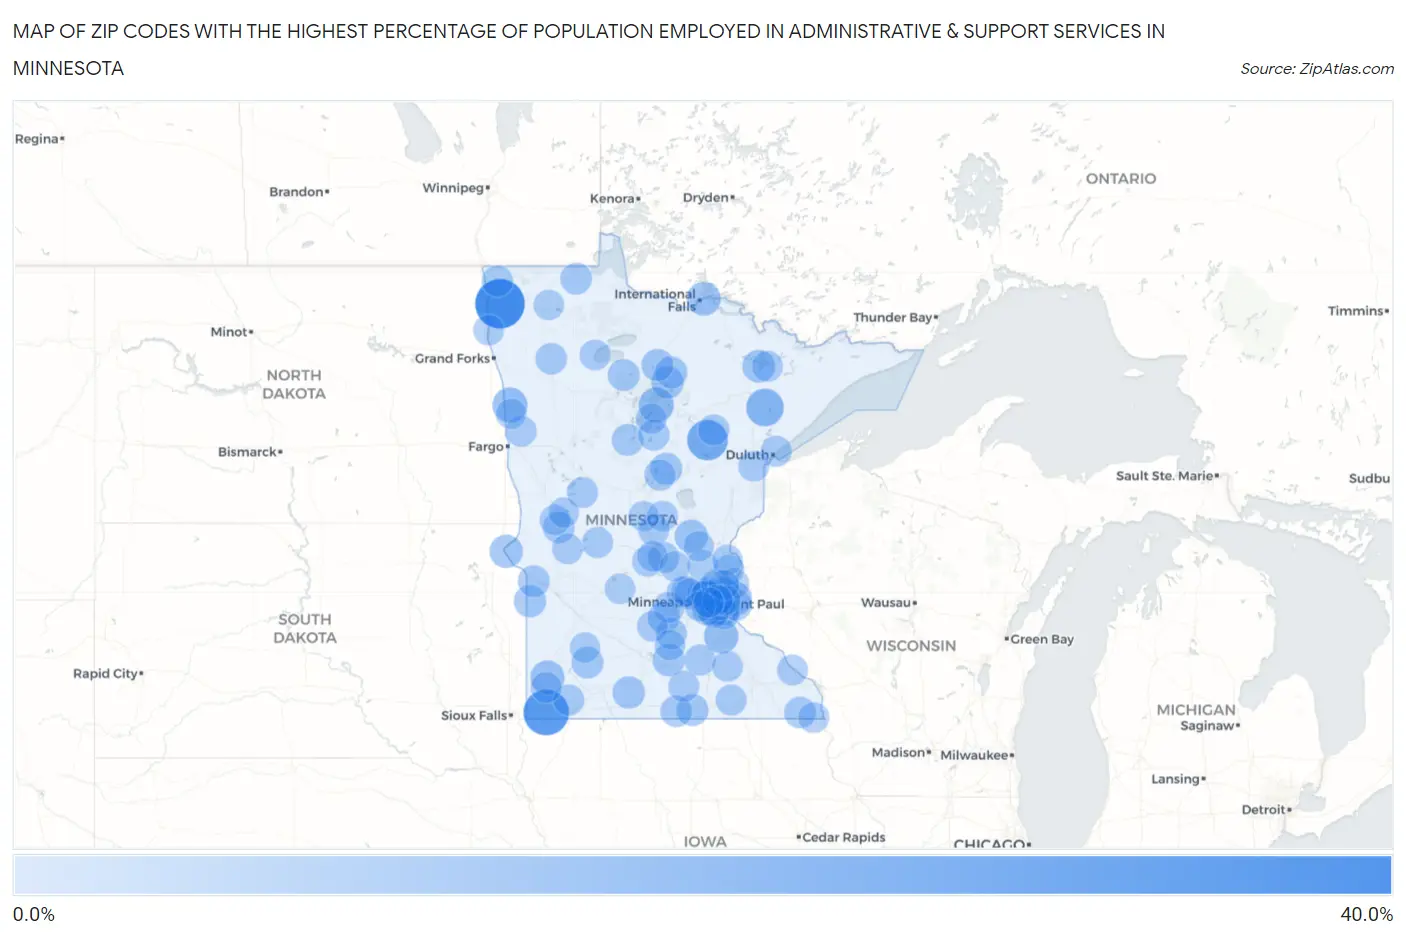
Map of Zip Codes with the Highest Percentage of Population Employed in Administrative & Support Services in Minnesota
0.0%
40.0%
Zip Codes with the Highest Percentage of Population Employed in Administrative & Support Services in Minnesota
| Zip Code | % Employed | vs State | vs National | |
| 1. | 56720 | 33.3% | 3.0%(+30.3)#1 | 4.1%(+29.2)#121 |
| 2. | 56146 | 27.3% | 3.0%(+24.2)#2 | 4.1%(+23.1)#166 |
| 3. | 55752 | 19.7% | 3.0%(+16.7)#3 | 4.1%(+15.5)#297 |
| 4. | 55763 | 15.1% | 3.0%(+12.1)#4 | 4.1%(+11.0)#526 |
| 5. | 56626 | 11.7% | 3.0%(+8.67)#5 | 4.1%(+7.56)#886 |
| 6. | 56548 | 11.1% | 3.0%(+8.04)#6 | 4.1%(+6.93)#1,004 |
| 7. | 55065 | 10.5% | 3.0%(+7.41)#7 | 4.1%(+6.30)#1,166 |
| 8. | 56186 | 9.8% | 3.0%(+6.79)#8 | 4.1%(+5.68)#1,352 |
| 9. | 56668 | 9.7% | 3.0%(+6.67)#9 | 4.1%(+5.56)#1,391 |
| 10. | 55003 | 9.7% | 3.0%(+6.66)#10 | 4.1%(+5.55)#1,395 |
| 11. | 56313 | 8.7% | 3.0%(+5.65)#11 | 4.1%(+4.55)#1,851 |
| 12. | 56219 | 8.6% | 3.0%(+5.60)#12 | 4.1%(+4.50)#1,885 |
| 13. | 55150 | 8.6% | 3.0%(+5.53)#13 | 4.1%(+4.42)#1,929 |
| 14. | 55090 | 8.2% | 3.0%(+5.20)#14 | 4.1%(+4.09)#2,118 |
| 15. | 55790 | 7.9% | 3.0%(+4.84)#15 | 4.1%(+3.73)#2,367 |
| 16. | 56162 | 7.6% | 3.0%(+4.52)#16 | 4.1%(+3.41)#2,629 |
| 17. | 56680 | 7.5% | 3.0%(+4.46)#17 | 4.1%(+3.35)#2,691 |
| 18. | 56050 | 7.5% | 3.0%(+4.44)#18 | 4.1%(+3.34)#2,700 |
| 19. | 56257 | 7.2% | 3.0%(+4.14)#19 | 4.1%(+3.04)#2,996 |
| 20. | 56688 | 7.1% | 3.0%(+4.10)#20 | 4.1%(+2.99)#3,041 |
| 21. | 56661 | 7.1% | 3.0%(+4.07)#21 | 4.1%(+2.96)#3,086 |
| 22. | 56441 | 7.0% | 3.0%(+3.96)#22 | 4.1%(+2.85)#3,217 |
| 23. | 55421 | 7.0% | 3.0%(+3.93)#23 | 4.1%(+2.82)#3,253 |
| 24. | 55429 | 6.9% | 3.0%(+3.81)#24 | 4.1%(+2.70)#3,413 |
| 25. | 56683 | 6.8% | 3.0%(+3.71)#25 | 4.1%(+2.60)#3,549 |
| 26. | 56166 | 6.7% | 3.0%(+3.70)#26 | 4.1%(+2.59)#3,561 |
| 27. | 55370 | 6.7% | 3.0%(+3.64)#27 | 4.1%(+2.54)#3,641 |
| 28. | 56020 | 6.7% | 3.0%(+3.62)#28 | 4.1%(+2.52)#3,686 |
| 29. | 55454 | 6.6% | 3.0%(+3.59)#29 | 4.1%(+2.48)#3,723 |
| 30. | 56276 | 6.5% | 3.0%(+3.46)#30 | 4.1%(+2.35)#3,902 |
| 31. | 56433 | 6.5% | 3.0%(+3.42)#31 | 4.1%(+2.32)#3,965 |
| 32. | 56014 | 6.5% | 3.0%(+3.41)#32 | 4.1%(+2.30)#3,986 |
| 33. | 56311 | 6.5% | 3.0%(+3.41)#33 | 4.1%(+2.30)#3,987 |
| 34. | 56756 | 6.4% | 3.0%(+3.38)#34 | 4.1%(+2.27)#4,033 |
| 35. | 56748 | 6.4% | 3.0%(+3.32)#35 | 4.1%(+2.21)#4,135 |
| 36. | 55412 | 6.4% | 3.0%(+3.32)#36 | 4.1%(+2.21)#4,139 |
| 37. | 55974 | 6.3% | 3.0%(+3.23)#37 | 4.1%(+2.12)#4,287 |
| 38. | 55373 | 6.2% | 3.0%(+3.15)#38 | 4.1%(+2.04)#4,421 |
| 39. | 56465 | 5.9% | 3.0%(+2.85)#39 | 4.1%(+1.74)#4,961 |
| 40. | 55055 | 5.9% | 3.0%(+2.83)#40 | 4.1%(+1.72)#5,011 |
| 41. | 56044 | 5.9% | 3.0%(+2.81)#41 | 4.1%(+1.70)#5,053 |
| 42. | 56655 | 5.8% | 3.0%(+2.79)#42 | 4.1%(+1.68)#5,089 |
| 43. | 55071 | 5.8% | 3.0%(+2.78)#43 | 4.1%(+1.67)#5,101 |
| 44. | 55107 | 5.8% | 3.0%(+2.75)#44 | 4.1%(+1.64)#5,165 |
| 45. | 56728 | 5.8% | 3.0%(+2.74)#45 | 4.1%(+1.64)#5,185 |
| 46. | 55043 | 5.7% | 3.0%(+2.70)#46 | 4.1%(+1.59)#5,267 |
| 47. | 55784 | 5.7% | 3.0%(+2.62)#47 | 4.1%(+1.51)#5,440 |
| 48. | 56373 | 5.6% | 3.0%(+2.58)#48 | 4.1%(+1.47)#5,553 |
| 49. | 55087 | 5.5% | 3.0%(+2.49)#49 | 4.1%(+1.38)#5,760 |
| 50. | 56165 | 5.5% | 3.0%(+2.48)#50 | 4.1%(+1.37)#5,788 |
| 51. | 55432 | 5.5% | 3.0%(+2.47)#51 | 4.1%(+1.36)#5,815 |
| 52. | 56551 | 5.5% | 3.0%(+2.46)#52 | 4.1%(+1.35)#5,837 |
| 53. | 56304 | 5.5% | 3.0%(+2.46)#53 | 4.1%(+1.35)#5,838 |
| 54. | 56385 | 5.5% | 3.0%(+2.45)#54 | 4.1%(+1.34)#5,866 |
| 55. | 55918 | 5.5% | 3.0%(+2.45)#55 | 4.1%(+1.34)#5,872 |
| 56. | 55367 | 5.5% | 3.0%(+2.42)#56 | 4.1%(+1.32)#5,926 |
| 57. | 55407 | 5.4% | 3.0%(+2.37)#57 | 4.1%(+1.26)#6,046 |
| 58. | 55812 | 5.4% | 3.0%(+2.33)#58 | 4.1%(+1.22)#6,140 |
| 59. | 56091 | 5.3% | 3.0%(+2.30)#59 | 4.1%(+1.19)#6,211 |
| 60. | 56128 | 5.3% | 3.0%(+2.29)#60 | 4.1%(+1.18)#6,251 |
| 61. | 55340 | 5.3% | 3.0%(+2.25)#61 | 4.1%(+1.15)#6,339 |
| 62. | 56323 | 5.3% | 3.0%(+2.22)#62 | 4.1%(+1.11)#6,426 |
| 63. | 55782 | 5.2% | 3.0%(+2.19)#63 | 4.1%(+1.09)#6,510 |
| 64. | 55047 | 5.2% | 3.0%(+2.17)#64 | 4.1%(+1.06)#6,573 |
| 65. | 56536 | 5.2% | 3.0%(+2.14)#65 | 4.1%(+1.03)#6,636 |
| 66. | 55366 | 5.2% | 3.0%(+2.14)#66 | 4.1%(+1.03)#6,643 |
| 67. | 56369 | 5.2% | 3.0%(+2.14)#67 | 4.1%(+1.03)#6,644 |
| 68. | 55931 | 5.1% | 3.0%(+2.10)#68 | 4.1%(+0.990)#6,736 |
| 69. | 55985 | 5.1% | 3.0%(+2.09)#69 | 4.1%(+0.984)#6,746 |
| 70. | 55718 | 5.1% | 3.0%(+2.07)#70 | 4.1%(+0.966)#6,813 |
| 71. | 55959 | 5.1% | 3.0%(+2.06)#71 | 4.1%(+0.951)#6,843 |
| 72. | 56387 | 5.1% | 3.0%(+2.06)#72 | 4.1%(+0.950)#6,846 |
| 73. | 55106 | 5.0% | 3.0%(+1.98)#73 | 4.1%(+0.871)#7,051 |
| 74. | 56671 | 5.0% | 3.0%(+1.97)#74 | 4.1%(+0.860)#7,074 |
| 75. | 56641 | 5.0% | 3.0%(+1.96)#75 | 4.1%(+0.850)#7,103 |
| 76. | 56364 | 5.0% | 3.0%(+1.95)#76 | 4.1%(+0.847)#7,114 |
| 77. | 55014 | 4.9% | 3.0%(+1.85)#77 | 4.1%(+0.739)#7,440 |
| 78. | 55423 | 4.9% | 3.0%(+1.84)#78 | 4.1%(+0.729)#7,467 |
| 79. | 56744 | 4.9% | 3.0%(+1.84)#79 | 4.1%(+0.728)#7,474 |
| 80. | 55121 | 4.9% | 3.0%(+1.83)#80 | 4.1%(+0.720)#7,505 |
| 81. | 56531 | 4.9% | 3.0%(+1.81)#81 | 4.1%(+0.707)#7,553 |
| 82. | 55357 | 4.8% | 3.0%(+1.76)#82 | 4.1%(+0.652)#7,729 |
| 83. | 56550 | 4.8% | 3.0%(+1.72)#83 | 4.1%(+0.612)#7,843 |
| 84. | 56209 | 4.8% | 3.0%(+1.72)#84 | 4.1%(+0.608)#7,853 |
| 85. | 55013 | 4.7% | 3.0%(+1.70)#85 | 4.1%(+0.597)#7,884 |
| 86. | 55430 | 4.7% | 3.0%(+1.70)#86 | 4.1%(+0.594)#7,902 |
| 87. | 56058 | 4.7% | 3.0%(+1.70)#87 | 4.1%(+0.588)#7,916 |
| 88. | 55070 | 4.7% | 3.0%(+1.65)#88 | 4.1%(+0.544)#8,051 |
| 89. | 56345 | 4.7% | 3.0%(+1.63)#89 | 4.1%(+0.520)#8,126 |
| 90. | 56255 | 4.7% | 3.0%(+1.62)#90 | 4.1%(+0.513)#8,153 |
| 91. | 55128 | 4.6% | 3.0%(+1.61)#91 | 4.1%(+0.499)#8,193 |
| 92. | 55056 | 4.6% | 3.0%(+1.60)#92 | 4.1%(+0.490)#8,225 |
| 93. | 55017 | 4.6% | 3.0%(+1.58)#93 | 4.1%(+0.473)#8,294 |
| 94. | 55038 | 4.6% | 3.0%(+1.57)#94 | 4.1%(+0.460)#8,344 |
| 95. | 55117 | 4.6% | 3.0%(+1.56)#95 | 4.1%(+0.454)#8,363 |
| 96. | 55343 | 4.6% | 3.0%(+1.56)#96 | 4.1%(+0.448)#8,382 |
| 97. | 55308 | 4.6% | 3.0%(+1.52)#97 | 4.1%(+0.410)#8,508 |
| 98. | 56759 | 4.5% | 3.0%(+1.48)#98 | 4.1%(+0.370)#8,659 |
| 99. | 55404 | 4.5% | 3.0%(+1.47)#99 | 4.1%(+0.361)#8,684 |
| 100. | 56309 | 4.5% | 3.0%(+1.46)#100 | 4.1%(+0.355)#8,705 |
Common Questions
What are the Top 10 Zip Codes with the Highest Percentage of Population Employed in Administrative & Support Services in Minnesota?
Top 10 Zip Codes with the Highest Percentage of Population Employed in Administrative & Support Services in Minnesota are:
What zip code has the Highest Percentage of Population Employed in Administrative & Support Services in Minnesota?
56720 has the Highest Percentage of Population Employed in Administrative & Support Services in Minnesota with 33.3%.
What is the Percentage of Population Employed in Administrative & Support Services in the State of Minnesota?
Percentage of Population Employed in Administrative & Support Services in Minnesota is 3.0%.
What is the Percentage of Population Employed in Administrative & Support Services in the United States?
Percentage of Population Employed in Administrative & Support Services in the United States is 4.1%.