Lastrup, MN Map & Demographics
Lastrup Map
Lastrup Overview
$29,242
PER CAPITA INCOME
$59,375
AVG FAMILY INCOME
$55,000
AVG HOUSEHOLD INCOME
0.27
INEQUALITY / GINI INDEX
98
TOTAL POPULATION
58
MALE POPULATION
40
FEMALE POPULATION
145.00
MALES / 100 FEMALES
68.97
FEMALES / 100 MALES
51.8
MEDIAN AGE
2.6
AVG FAMILY SIZE
2.2
AVG HOUSEHOLD SIZE
57
LABOR FORCE [ PEOPLE ]
65.5%
PERCENT IN LABOR FORCE
7.0%
UNEMPLOYMENT RATE
Lastrup Area Codes
Income in Lastrup
Income Overview in Lastrup
Per Capita Income in Lastrup is $29,242, while median incomes of families and households are $59,375 and $55,000 respectively.
| Characteristic | Number | Measure |
| Per Capita Income | 98 | $29,242 |
| Median Family Income | 31 | $59,375 |
| Mean Family Income | 31 | $64,029 |
| Median Household Income | 44 | $55,000 |
| Mean Household Income | 44 | $64,041 |
| Income Deficit | 31 | $0 |
| Wage / Income Gap (%) | 98 | 0.00% |
| Wage / Income Gap ($) | 98 | 100.00¢ per $1 |
| Gini / Inequality Index | 98 | 0.27 |
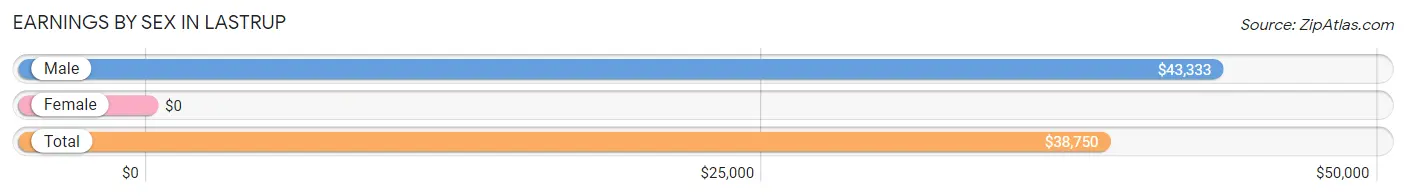
Earnings by Sex in Lastrup
| Sex | Number | Average Earnings |
| Male | 36 (60.0%) | $43,333 |
| Female | 24 (40.0%) | $0 |
| Total | 60 (100.0%) | $38,750 |
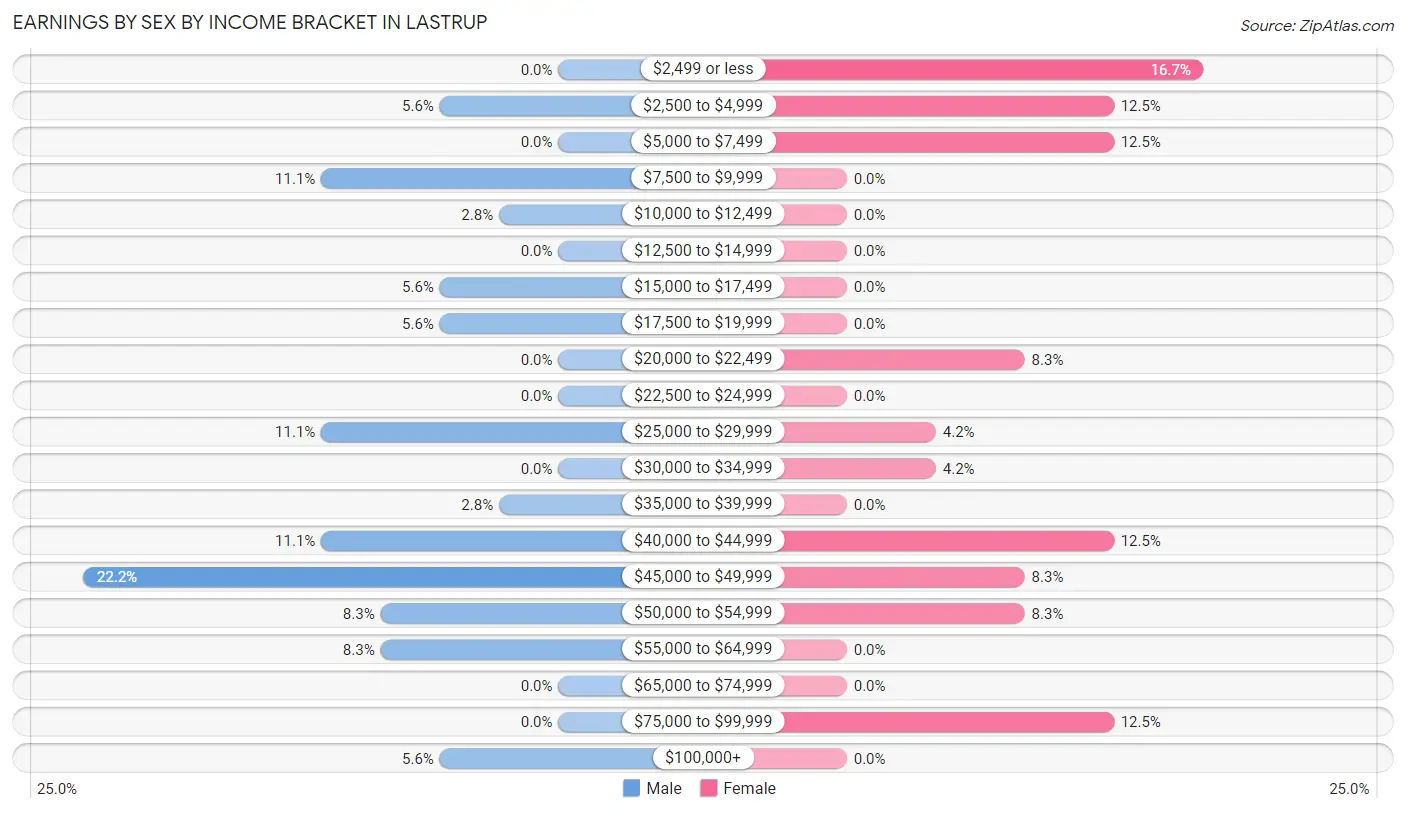
Earnings by Sex by Income Bracket in Lastrup
The most common earnings brackets in Lastrup are $45,000 to $49,999 for men (8 | 22.2%) and $2,499 or less for women (4 | 16.7%).
| Income | Male | Female |
| $2,499 or less | 0 (0.0%) | 4 (16.7%) |
| $2,500 to $4,999 | 2 (5.6%) | 3 (12.5%) |
| $5,000 to $7,499 | 0 (0.0%) | 3 (12.5%) |
| $7,500 to $9,999 | 4 (11.1%) | 0 (0.0%) |
| $10,000 to $12,499 | 1 (2.8%) | 0 (0.0%) |
| $12,500 to $14,999 | 0 (0.0%) | 0 (0.0%) |
| $15,000 to $17,499 | 2 (5.6%) | 0 (0.0%) |
| $17,500 to $19,999 | 2 (5.6%) | 0 (0.0%) |
| $20,000 to $22,499 | 0 (0.0%) | 2 (8.3%) |
| $22,500 to $24,999 | 0 (0.0%) | 0 (0.0%) |
| $25,000 to $29,999 | 4 (11.1%) | 1 (4.2%) |
| $30,000 to $34,999 | 0 (0.0%) | 1 (4.2%) |
| $35,000 to $39,999 | 1 (2.8%) | 0 (0.0%) |
| $40,000 to $44,999 | 4 (11.1%) | 3 (12.5%) |
| $45,000 to $49,999 | 8 (22.2%) | 2 (8.3%) |
| $50,000 to $54,999 | 3 (8.3%) | 2 (8.3%) |
| $55,000 to $64,999 | 3 (8.3%) | 0 (0.0%) |
| $65,000 to $74,999 | 0 (0.0%) | 0 (0.0%) |
| $75,000 to $99,999 | 0 (0.0%) | 3 (12.5%) |
| $100,000+ | 2 (5.6%) | 0 (0.0%) |
| Total | 36 (100.0%) | 24 (100.0%) |
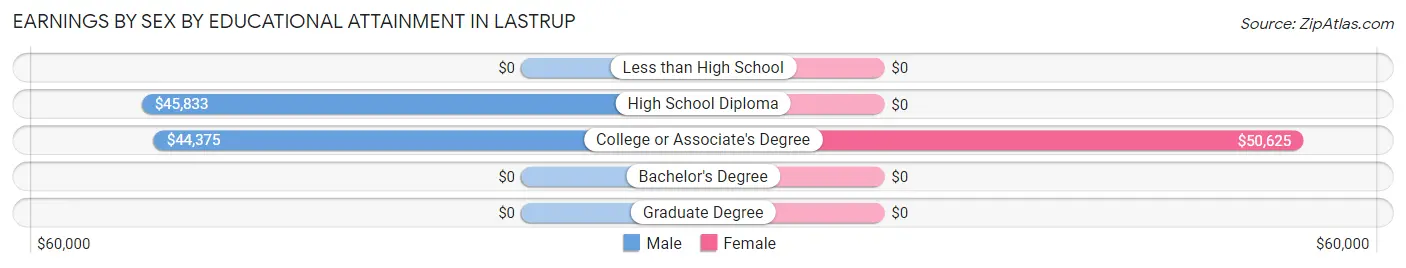
Earnings by Sex by Educational Attainment in Lastrup
Average earnings in Lastrup are $45,000 for men and $42,917 for women, a difference of 4.6%. Men with an educational attainment of high school diploma enjoy the highest average annual earnings of $45,833, while those with college or associate's degree education earn the least with $44,375. Women with an educational attainment of college or associate's degree earn the most with the average annual earnings of $50,625, while those with college or associate's degree education have the smallest earnings of $50,625.
| Educational Attainment | Male Income | Female Income |
| Less than High School | - | - |
| High School Diploma | $45,833 | $0 |
| College or Associate's Degree | $44,375 | $50,625 |
| Bachelor's Degree | - | - |
| Graduate Degree | - | - |
| Total | $45,000 | $42,917 |
Family Income in Lastrup
Family Income Brackets in Lastrup
According to the Lastrup family income data, there are 8 families falling into the $100,000 to $149,999 income range, which is the most common income bracket and makes up 25.8% of all families.
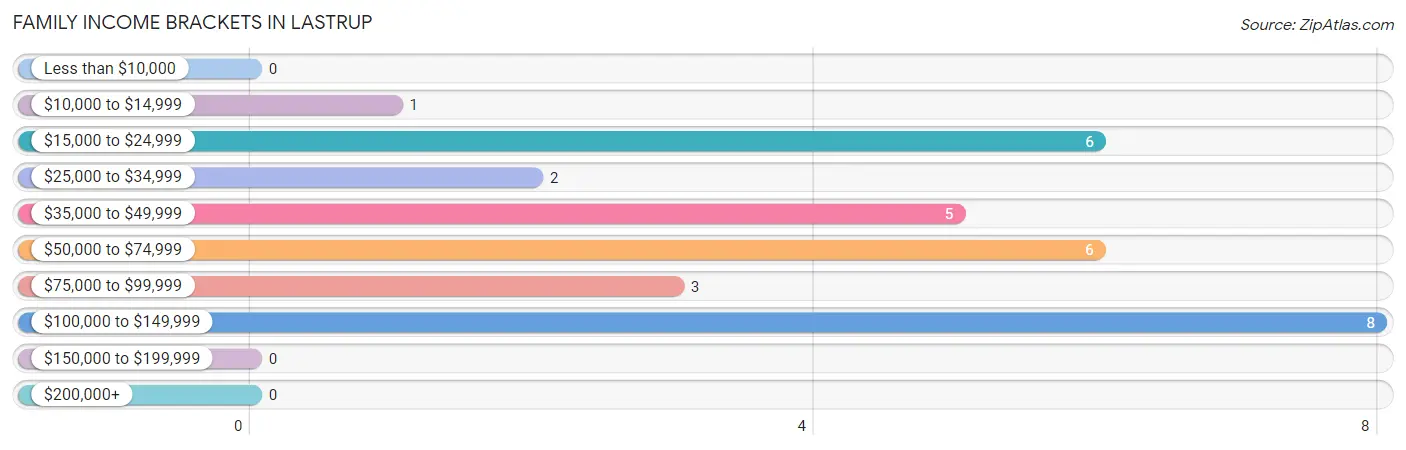
| Income Bracket | # Families | % Families |
| Less than $10,000 | 0 | 0.0% |
| $10,000 to $14,999 | 1 | 3.2% |
| $15,000 to $24,999 | 6 | 19.4% |
| $25,000 to $34,999 | 2 | 6.5% |
| $35,000 to $49,999 | 5 | 16.1% |
| $50,000 to $74,999 | 6 | 19.4% |
| $75,000 to $99,999 | 3 | 9.7% |
| $100,000 to $149,999 | 8 | 25.8% |
| $150,000 to $199,999 | 0 | 0.0% |
| $200,000+ | 0 | 0.0% |
Family Income by Famaliy Size in Lastrup
4-person families (4 | 12.9%) account for the highest median family income in Lastrup with $63,750 per family, while 2-person families (18 | 58.1%) have the highest median income of $22,000 per family member.
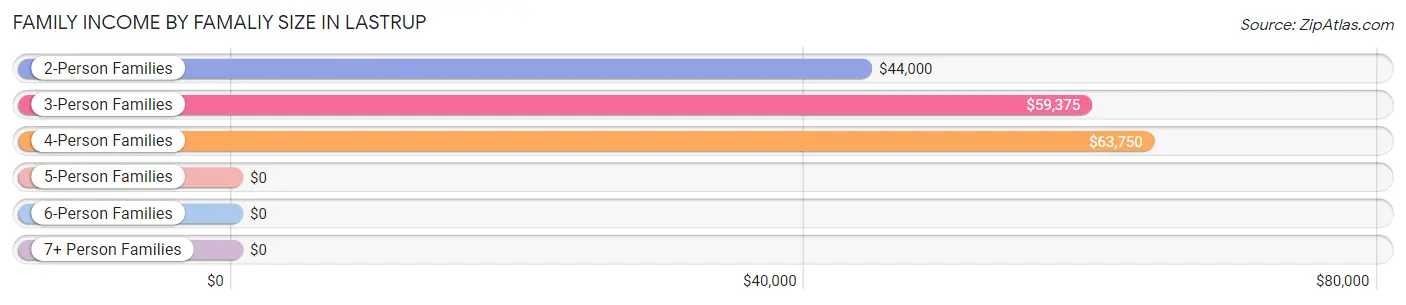
| Income Bracket | # Families | Median Income |
| 2-Person Families | 18 (58.1%) | $44,000 |
| 3-Person Families | 7 (22.6%) | $59,375 |
| 4-Person Families | 4 (12.9%) | $63,750 |
| 5-Person Families | 2 (6.5%) | $0 |
| 6-Person Families | 0 (0.0%) | $0 |
| 7+ Person Families | 0 (0.0%) | $0 |
| Total | 31 (100.0%) | $59,375 |
Family Income by Number of Earners in Lastrup
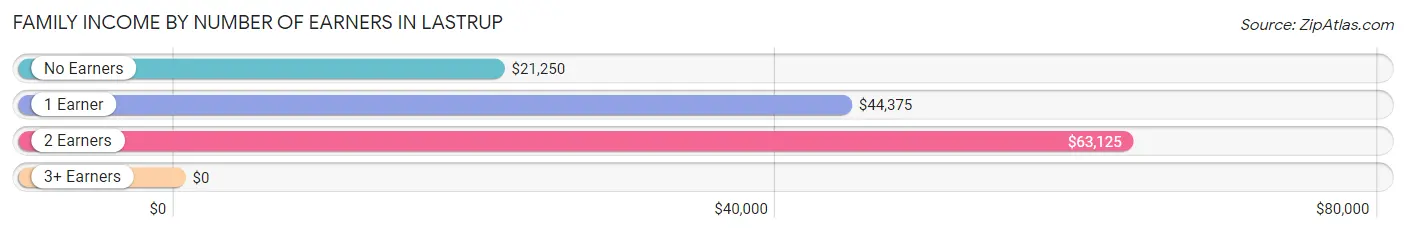
| Number of Earners | # Families | Median Income |
| No Earners | 6 (19.4%) | $21,250 |
| 1 Earner | 11 (35.5%) | $44,375 |
| 2 Earners | 11 (35.5%) | $63,125 |
| 3+ Earners | 3 (9.7%) | $0 |
| Total | 31 (100.0%) | $59,375 |
Household Income in Lastrup
Household Income Brackets in Lastrup
With 15 households falling in the category, the $35,000 to $49,999 income range is the most frequent in Lastrup, accounting for 34.1% of all households.
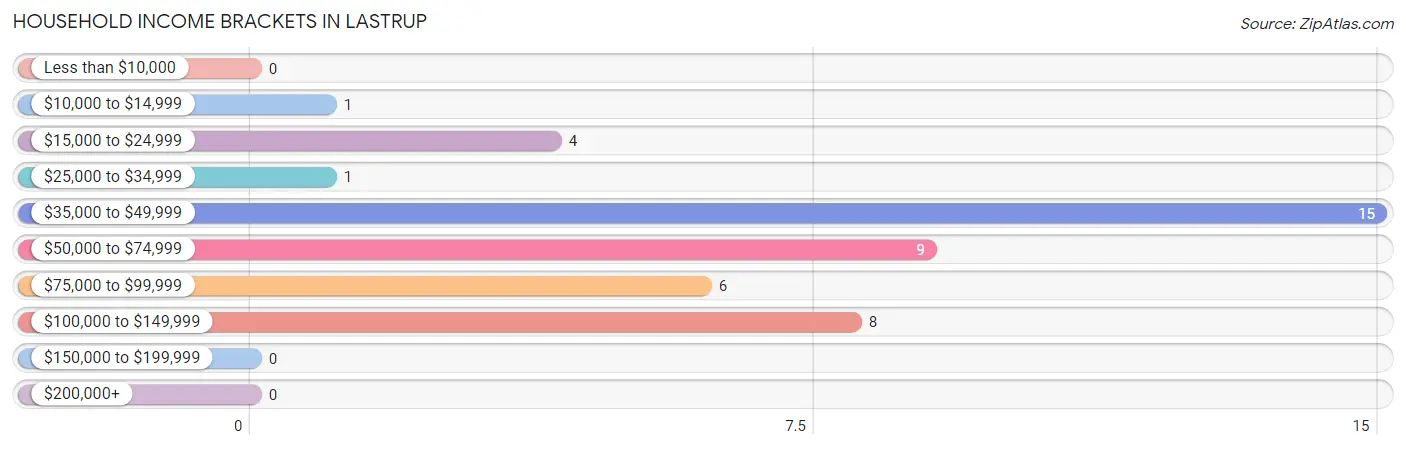
| Income Bracket | # Households | % Households |
| Less than $10,000 | 0 | 0.0% |
| $10,000 to $14,999 | 1 | 2.3% |
| $15,000 to $24,999 | 4 | 9.1% |
| $25,000 to $34,999 | 1 | 2.3% |
| $35,000 to $49,999 | 15 | 34.1% |
| $50,000 to $74,999 | 9 | 20.5% |
| $75,000 to $99,999 | 6 | 13.6% |
| $100,000 to $149,999 | 8 | 18.2% |
| $150,000 to $199,999 | 0 | 0.0% |
| $200,000+ | 0 | 0.0% |
Household Income by Householder Age in Lastrup
The median household income in Lastrup is $55,000, with the highest median household income of $91,667 found in the 25 to 44 years age bracket for the primary householder. A total of 12 households (27.3%) fall into this category.
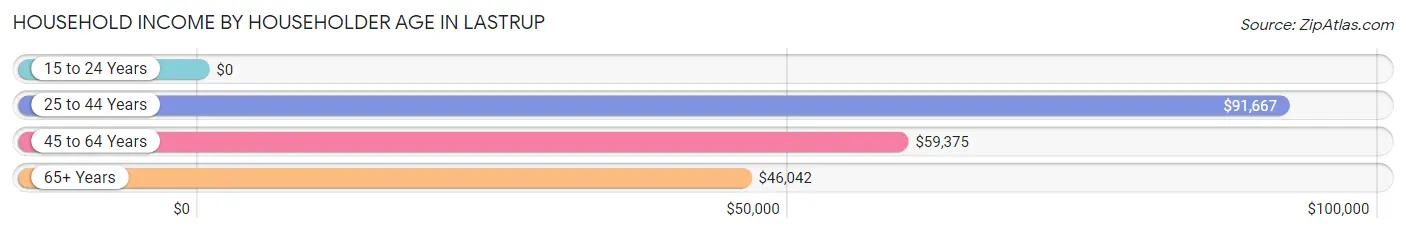
| Income Bracket | # Households | Median Income |
| 15 to 24 Years | 0 (0.0%) | $0 |
| 25 to 44 Years | 12 (27.3%) | $91,667 |
| 45 to 64 Years | 13 (29.5%) | $59,375 |
| 65+ Years | 19 (43.2%) | $46,042 |
| Total | 44 (100.0%) | $55,000 |
Poverty in Lastrup
Income Below Poverty by Sex and Age in Lastrup
With 12.1% poverty level for males and 15.0% for females among the residents of Lastrup, under 5 year old males and 5 year old females are the most vulnerable to poverty, with 2 males (66.7%) and 3 females (100.0%) in their respective age groups living below the poverty level.
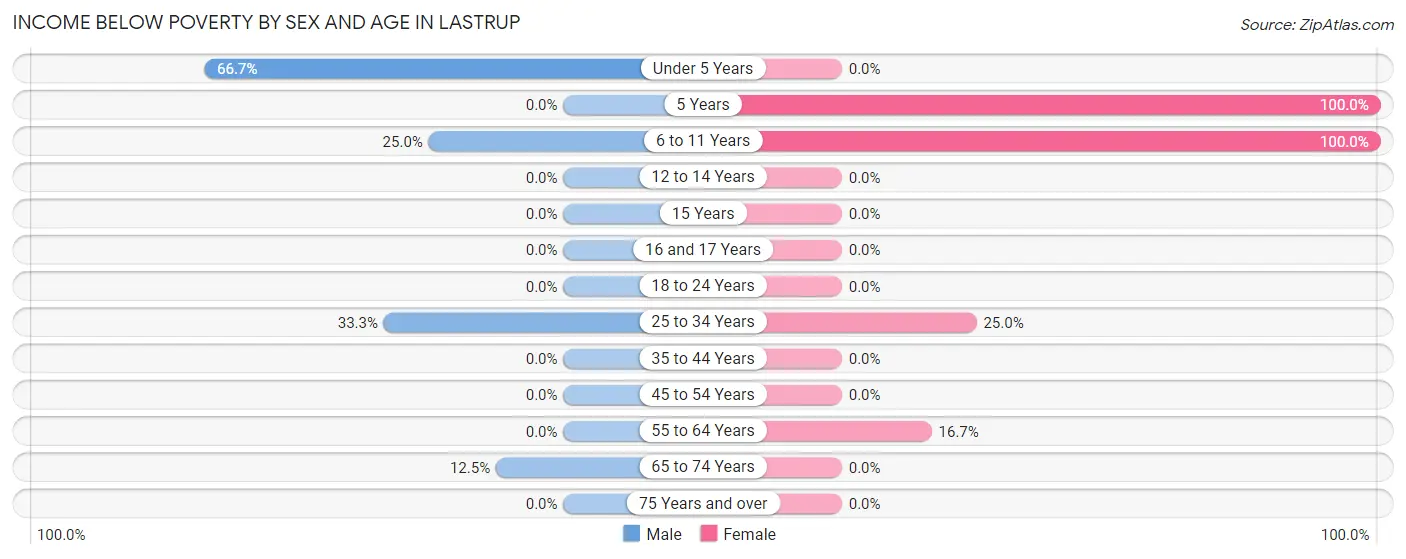
| Age Bracket | Male | Female |
| Under 5 Years | 2 (66.7%) | 0 (0.0%) |
| 5 Years | 0 (0.0%) | 3 (100.0%) |
| 6 to 11 Years | 1 (25.0%) | 1 (100.0%) |
| 12 to 14 Years | 0 (0.0%) | 0 (0.0%) |
| 15 Years | 0 (0.0%) | 0 (0.0%) |
| 16 and 17 Years | 0 (0.0%) | 0 (0.0%) |
| 18 to 24 Years | 0 (0.0%) | 0 (0.0%) |
| 25 to 34 Years | 2 (33.3%) | 1 (25.0%) |
| 35 to 44 Years | 0 (0.0%) | 0 (0.0%) |
| 45 to 54 Years | 0 (0.0%) | 0 (0.0%) |
| 55 to 64 Years | 0 (0.0%) | 1 (16.7%) |
| 65 to 74 Years | 2 (12.5%) | 0 (0.0%) |
| 75 Years and over | 0 (0.0%) | 0 (0.0%) |
| Total | 7 (12.1%) | 6 (15.0%) |
Income Above Poverty by Sex and Age in Lastrup
According to the poverty statistics in Lastrup, males aged 18 to 24 years and females aged 16 and 17 years are the age groups that are most secure financially, with 100.0% of males and 100.0% of females in these age groups living above the poverty line.
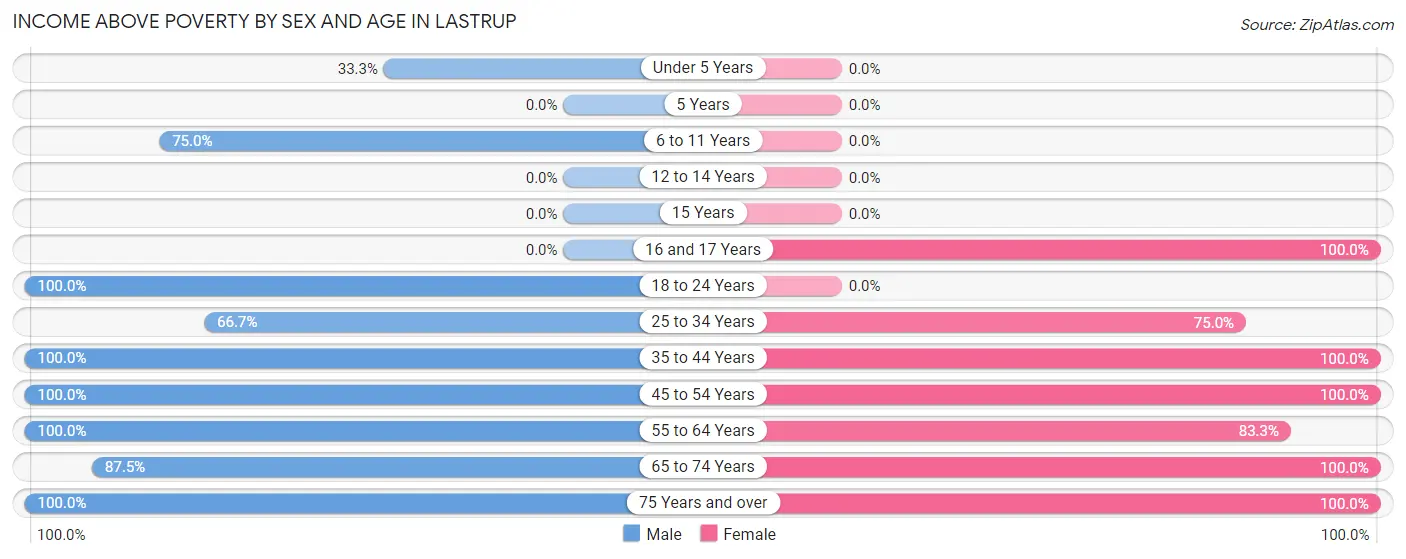
| Age Bracket | Male | Female |
| Under 5 Years | 1 (33.3%) | 0 (0.0%) |
| 5 Years | 0 (0.0%) | 0 (0.0%) |
| 6 to 11 Years | 3 (75.0%) | 0 (0.0%) |
| 12 to 14 Years | 0 (0.0%) | 0 (0.0%) |
| 15 Years | 0 (0.0%) | 0 (0.0%) |
| 16 and 17 Years | 0 (0.0%) | 5 (100.0%) |
| 18 to 24 Years | 4 (100.0%) | 0 (0.0%) |
| 25 to 34 Years | 4 (66.7%) | 3 (75.0%) |
| 35 to 44 Years | 5 (100.0%) | 5 (100.0%) |
| 45 to 54 Years | 5 (100.0%) | 7 (100.0%) |
| 55 to 64 Years | 9 (100.0%) | 5 (83.3%) |
| 65 to 74 Years | 14 (87.5%) | 8 (100.0%) |
| 75 Years and over | 6 (100.0%) | 1 (100.0%) |
| Total | 51 (87.9%) | 34 (85.0%) |
Income Below Poverty Among Married-Couple Families in Lastrup
The poverty statistics for married-couple families in Lastrup show that 4.3% or 1 of the total 23 families live below the poverty line. Families with no children have the highest poverty rate of 5.6%, comprising of 1 families. On the other hand, families with 1 or 2 children have the lowest poverty rate of 0.0%, which includes 0 families.
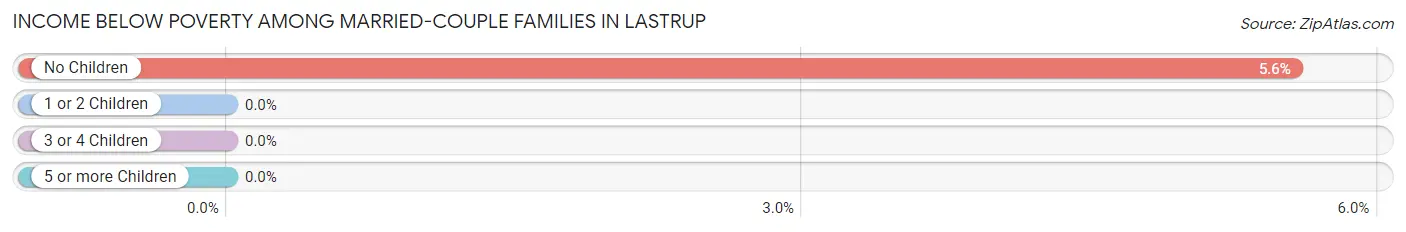
| Children | Above Poverty | Below Poverty |
| No Children | 17 (94.4%) | 1 (5.6%) |
| 1 or 2 Children | 3 (100.0%) | 0 (0.0%) |
| 3 or 4 Children | 2 (100.0%) | 0 (0.0%) |
| 5 or more Children | 0 (0.0%) | 0 (0.0%) |
| Total | 22 (95.7%) | 1 (4.3%) |
Income Below Poverty Among Single-Parent Households in Lastrup
According to the poverty data in Lastrup, 33.3% or 2 single-father households and 50.0% or 1 single-mother households are living below the poverty line. Among single-father households, those with 1 or 2 children have the highest poverty rate, with 2 households (50.0%) experiencing poverty. Likewise, among single-mother households, those with 3 or 4 children have the highest poverty rate, with 1 households (100.0%) falling below the poverty line.
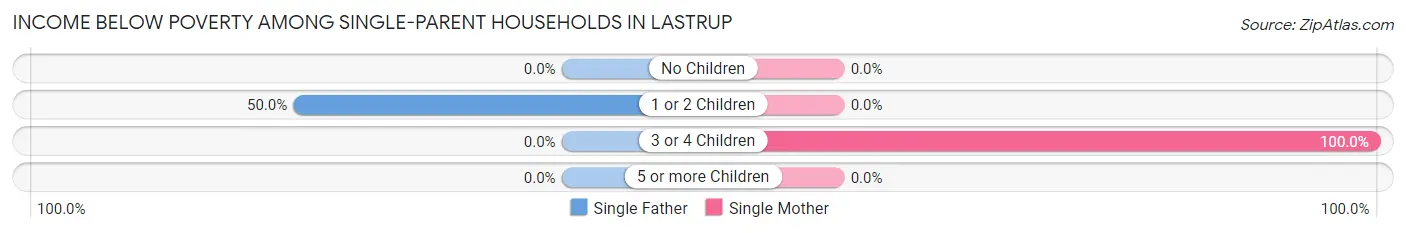
| Children | Single Father | Single Mother |
| No Children | 0 (0.0%) | 0 (0.0%) |
| 1 or 2 Children | 2 (50.0%) | 0 (0.0%) |
| 3 or 4 Children | 0 (0.0%) | 1 (100.0%) |
| 5 or more Children | 0 (0.0%) | 0 (0.0%) |
| Total | 2 (33.3%) | 1 (50.0%) |
Income Below Poverty Among Married-Couple vs Single-Parent Households in Lastrup
The poverty data for Lastrup shows that 1 of the married-couple family households (4.3%) and 3 of the single-parent households (37.5%) are living below the poverty level. Within the married-couple family households, those with no children have the highest poverty rate, with 1 households (5.6%) falling below the poverty line. Among the single-parent households, those with 3 or 4 children have the highest poverty rate, with 1 household (100.0%) living below poverty.
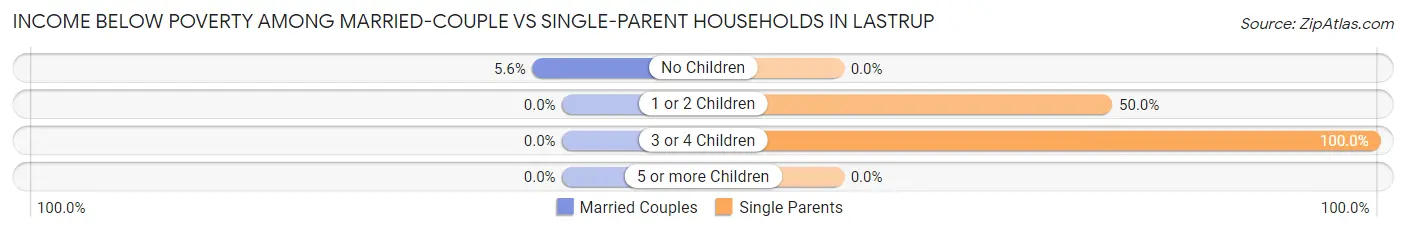
| Children | Married-Couple Families | Single-Parent Households |
| No Children | 1 (5.6%) | 0 (0.0%) |
| 1 or 2 Children | 0 (0.0%) | 2 (50.0%) |
| 3 or 4 Children | 0 (0.0%) | 1 (100.0%) |
| 5 or more Children | 0 (0.0%) | 0 (0.0%) |
| Total | 1 (4.3%) | 3 (37.5%) |
Race in Lastrup
The most populous races in Lastrup are White / Caucasian (93 | 94.9%), Two or more Races (3 | 3.1%), and Asian (1 | 1.0%).
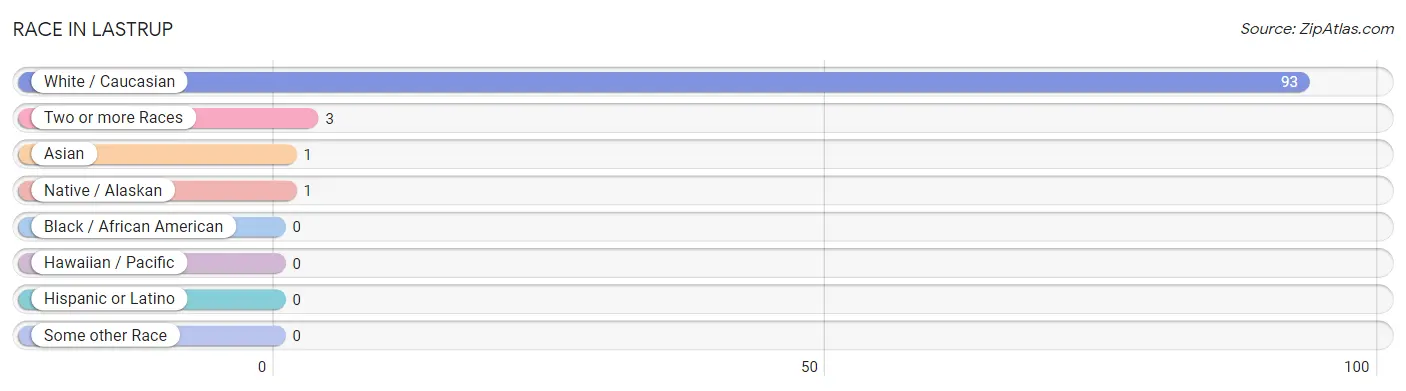
| Race | # Population | % Population |
| Asian | 1 | 1.0% |
| Black / African American | 0 | 0.0% |
| Hawaiian / Pacific | 0 | 0.0% |
| Hispanic or Latino | 0 | 0.0% |
| Native / Alaskan | 1 | 1.0% |
| White / Caucasian | 93 | 94.9% |
| Two or more Races | 3 | 3.1% |
| Some other Race | 0 | 0.0% |
| Total | 98 | 100.0% |
Ancestry in Lastrup
The most populous ancestries reported in Lastrup are German (74 | 75.5%), Polish (11 | 11.2%), Norwegian (9 | 9.2%), French Canadian (6 | 6.1%), and English (5 | 5.1%), together accounting for 107.1% of all Lastrup residents.
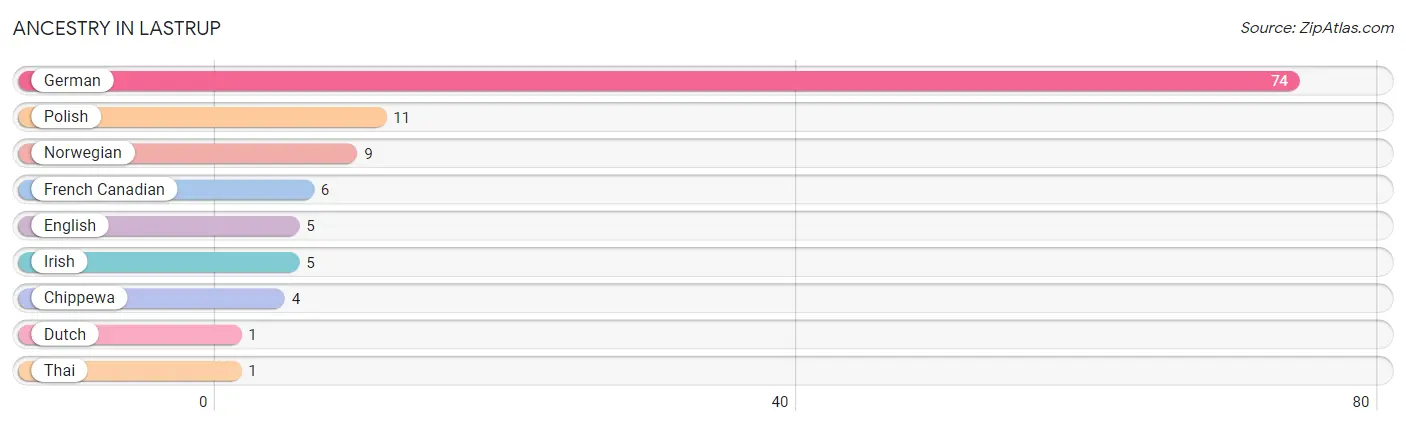
| Ancestry | # Population | % Population |
| Chippewa | 4 | 4.1% |
| Dutch | 1 | 1.0% |
| English | 5 | 5.1% |
| French Canadian | 6 | 6.1% |
| German | 74 | 75.5% |
| Irish | 5 | 5.1% |
| Norwegian | 9 | 9.2% |
| Polish | 11 | 11.2% |
| Thai | 1 | 1.0% | View All 9 Rows |
Immigrants in Lastrup
The most numerous immigrant groups reported in Lastrup came from Canada (2 | 2.0%), Asia (1 | 1.0%), India (1 | 1.0%), and South Central Asia (1 | 1.0%), together accounting for 5.1% of all Lastrup residents.
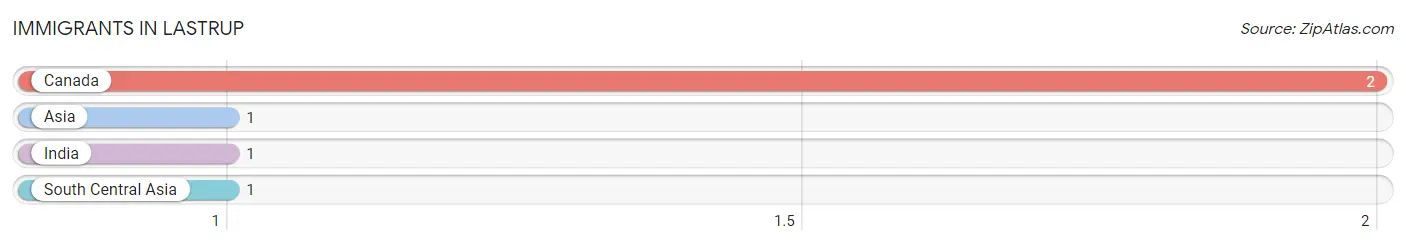
| Immigration Origin | # Population | % Population |
| Asia | 1 | 1.0% |
| Canada | 2 | 2.0% |
| India | 1 | 1.0% |
| South Central Asia | 1 | 1.0% | View All 4 Rows |
Sex and Age in Lastrup
Sex and Age in Lastrup
The most populous age groups in Lastrup are 65 to 69 Years (9 | 15.5%) for men and 70 to 74 Years (8 | 20.0%) for women.
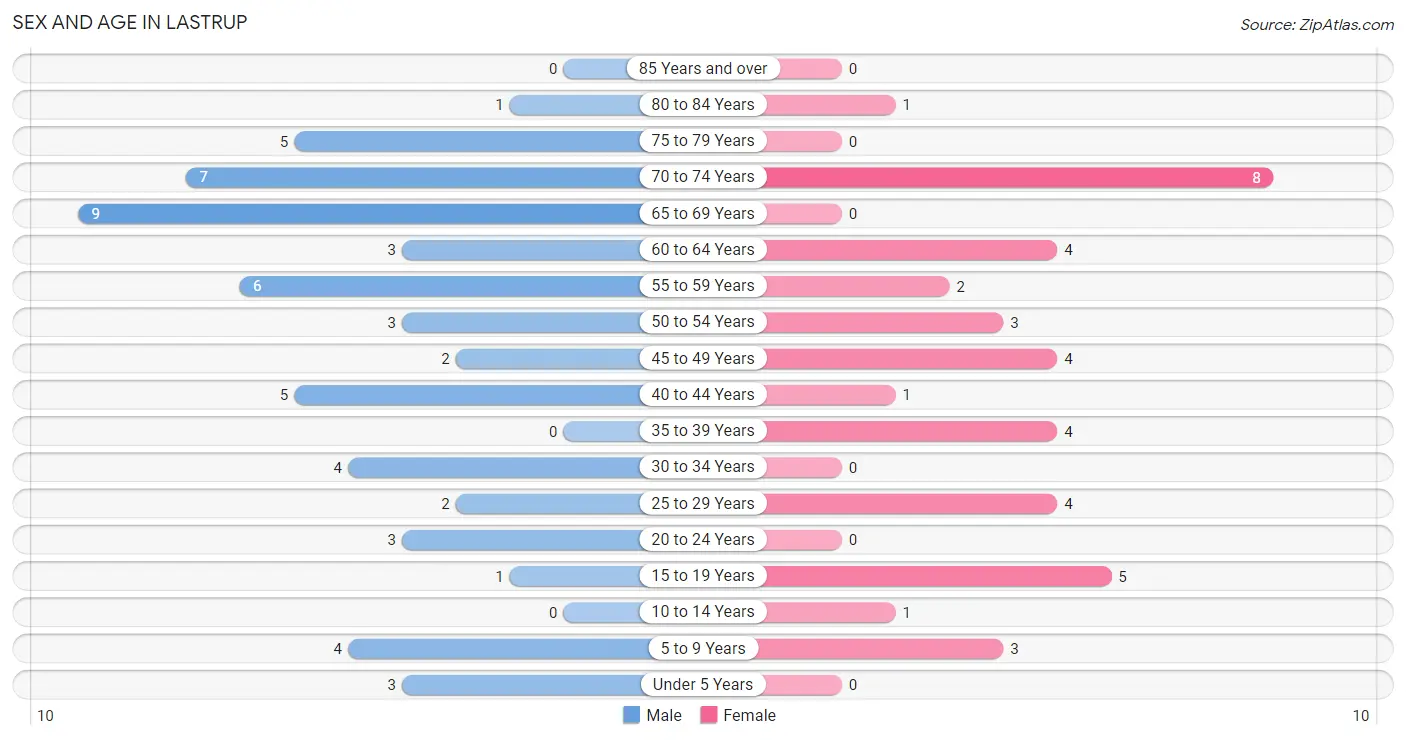
| Age Bracket | Male | Female |
| Under 5 Years | 3 (5.2%) | 0 (0.0%) |
| 5 to 9 Years | 4 (6.9%) | 3 (7.5%) |
| 10 to 14 Years | 0 (0.0%) | 1 (2.5%) |
| 15 to 19 Years | 1 (1.7%) | 5 (12.5%) |
| 20 to 24 Years | 3 (5.2%) | 0 (0.0%) |
| 25 to 29 Years | 2 (3.5%) | 4 (10.0%) |
| 30 to 34 Years | 4 (6.9%) | 0 (0.0%) |
| 35 to 39 Years | 0 (0.0%) | 4 (10.0%) |
| 40 to 44 Years | 5 (8.6%) | 1 (2.5%) |
| 45 to 49 Years | 2 (3.5%) | 4 (10.0%) |
| 50 to 54 Years | 3 (5.2%) | 3 (7.5%) |
| 55 to 59 Years | 6 (10.3%) | 2 (5.0%) |
| 60 to 64 Years | 3 (5.2%) | 4 (10.0%) |
| 65 to 69 Years | 9 (15.5%) | 0 (0.0%) |
| 70 to 74 Years | 7 (12.1%) | 8 (20.0%) |
| 75 to 79 Years | 5 (8.6%) | 0 (0.0%) |
| 80 to 84 Years | 1 (1.7%) | 1 (2.5%) |
| 85 Years and over | 0 (0.0%) | 0 (0.0%) |
| Total | 58 (100.0%) | 40 (100.0%) |
Families and Households in Lastrup
Median Family Size in Lastrup
The median family size in Lastrup is 2.61 persons per family, with single female/mother families (2 | 6.5%) accounting for the largest median family size of 5 persons per family. On the other hand, single male/father families (6 | 19.4%) represent the smallest median family size with 1.83 persons per family.
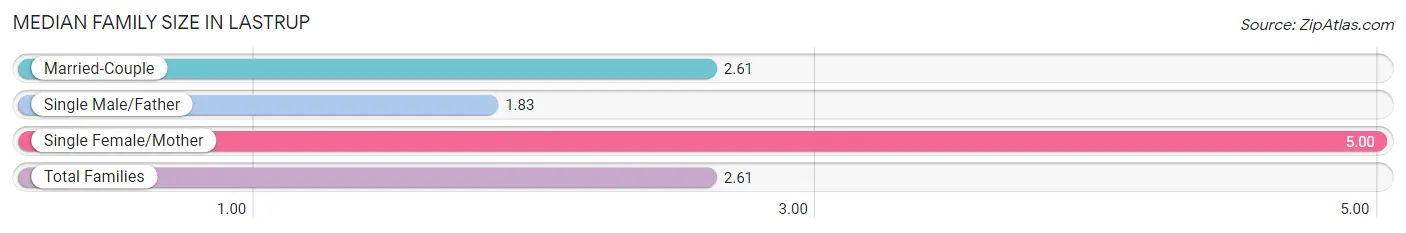
| Family Type | # Families | Family Size |
| Married-Couple | 23 (74.2%) | 2.61 |
| Single Male/Father | 6 (19.4%) | 1.83 |
| Single Female/Mother | 2 (6.5%) | 5.00 |
| Total Families | 31 (100.0%) | 2.61 |
Median Household Size in Lastrup
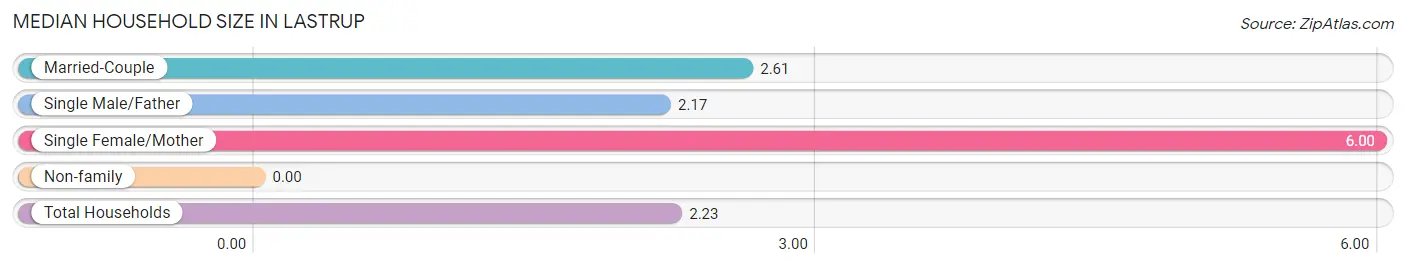
| Household Type | # Households | Household Size |
| Married-Couple | 23 (52.3%) | 2.61 |
| Single Male/Father | 6 (13.6%) | 2.17 |
| Single Female/Mother | 2 (4.5%) | 6.00 |
| Non-family | 13 (29.5%) | - |
| Total Households | 44 (100.0%) | 2.23 |
Household Size by Marriage Status in Lastrup
Out of a total of 44 households in Lastrup, 31 (70.5%) are family households, while 13 (29.5%) are nonfamily households. The most numerous type of family households are 2-person households, comprising 18, and the most common type of nonfamily households are 1-person households, comprising 13.
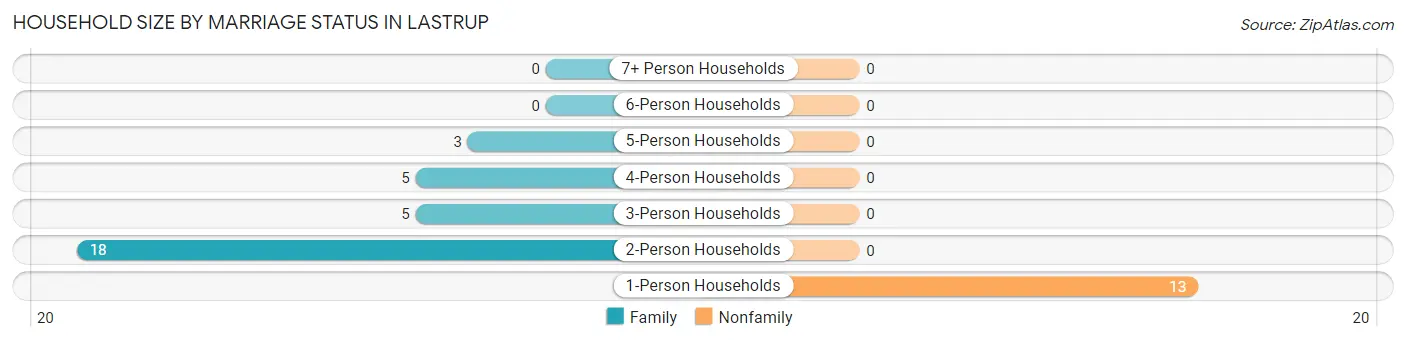
| Household Size | Family Households | Nonfamily Households |
| 1-Person Households | - | 13 (29.5%) |
| 2-Person Households | 18 (40.9%) | 0 (0.0%) |
| 3-Person Households | 5 (11.4%) | 0 (0.0%) |
| 4-Person Households | 5 (11.4%) | 0 (0.0%) |
| 5-Person Households | 3 (6.8%) | 0 (0.0%) |
| 6-Person Households | 0 (0.0%) | 0 (0.0%) |
| 7+ Person Households | 0 (0.0%) | 0 (0.0%) |
| Total | 31 (70.5%) | 13 (29.5%) |
Female Fertility in Lastrup
Fertility by Age in Lastrup
| Age Bracket | Women with Births | Births / 1,000 Women |
| 15 to 19 years | 0 (0.0%) | 0.0 |
| 20 to 34 years | 0 (0.0%) | 0.0 |
| 35 to 50 years | 0 (0.0%) | 0.0 |
| Total | 0 (0.0%) | 0.0 |
Fertility by Age by Marriage Status in Lastrup
| Age Bracket | Married | Unmarried |
| 15 to 19 years | 0 (0.0%) | 0 (0.0%) |
| 20 to 34 years | 0 (0.0%) | 0 (0.0%) |
| 35 to 50 years | 0 (0.0%) | 0 (0.0%) |
| Total | 0 (0.0%) | 0 (0.0%) |
Fertility by Education in Lastrup
| Educational Attainment | Women with Births | Births / 1,000 Women |
| Less than High School | 0 (0.0%) | 0.0 |
| High School Diploma | 0 (0.0%) | 0.0 |
| College or Associate's Degree | 0 (0.0%) | 0.0 |
| Bachelor's Degree | 0 (0.0%) | 0.0 |
| Graduate Degree | 0 (0.0%) | 0.0 |
| Total | 0 (0.0%) | 0.0 |
Fertility by Education by Marriage Status in Lastrup
| Educational Attainment | Married | Unmarried |
| Less than High School | 0 (0.0%) | 0 (0.0%) |
| High School Diploma | 0 (0.0%) | 0 (0.0%) |
| College or Associate's Degree | 0 (0.0%) | 0 (0.0%) |
| Bachelor's Degree | 0 (0.0%) | 0 (0.0%) |
| Graduate Degree | 0 (0.0%) | 0 (0.0%) |
| Total | 0 (0.0%) | 0 (0.0%) |
Employment Characteristics in Lastrup
Employment by Class of Employer in Lastrup
Among the 53 employed individuals in Lastrup, private company employees (31 | 58.5%), not-for-profit organizations (11 | 20.7%), and local government employees (6 | 11.3%) make up the most common classes of employment.
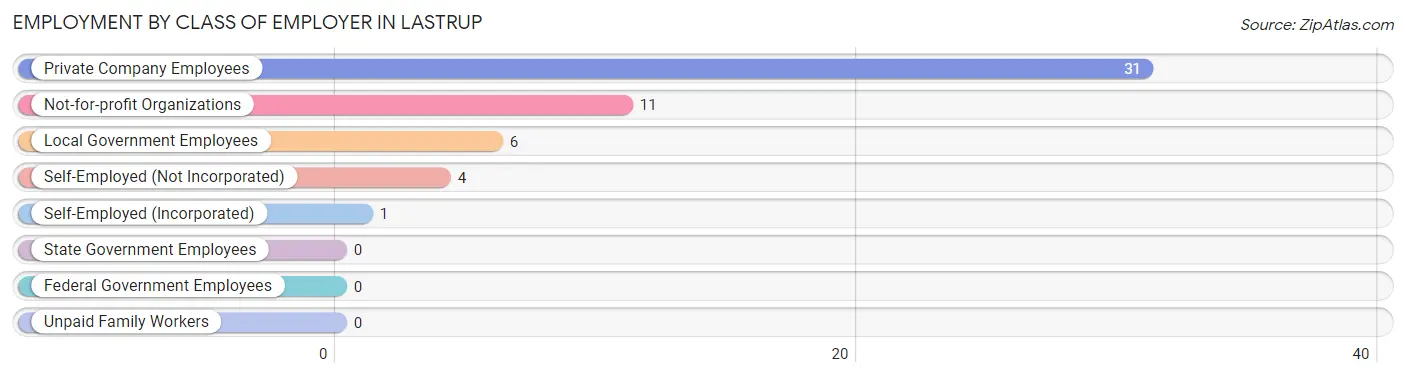
| Employer Class | # Employees | % Employees |
| Private Company Employees | 31 | 58.5% |
| Self-Employed (Incorporated) | 1 | 1.9% |
| Self-Employed (Not Incorporated) | 4 | 7.5% |
| Not-for-profit Organizations | 11 | 20.7% |
| Local Government Employees | 6 | 11.3% |
| State Government Employees | 0 | 0.0% |
| Federal Government Employees | 0 | 0.0% |
| Unpaid Family Workers | 0 | 0.0% |
| Total | 53 | 100.0% |
Employment Status by Age in Lastrup
According to the labor force statistics for Lastrup, out of the total population over 16 years of age (87), 65.5% or 57 individuals are in the labor force, with 7.0% or 4 of them unemployed. The age group with the highest labor force participation rate is 16 to 19 years, with 100.0% or 6 individuals in the labor force. Within the labor force, the 30 to 34 years age range has the highest percentage of unemployed individuals, with 50.0% or 2 of them being unemployed.
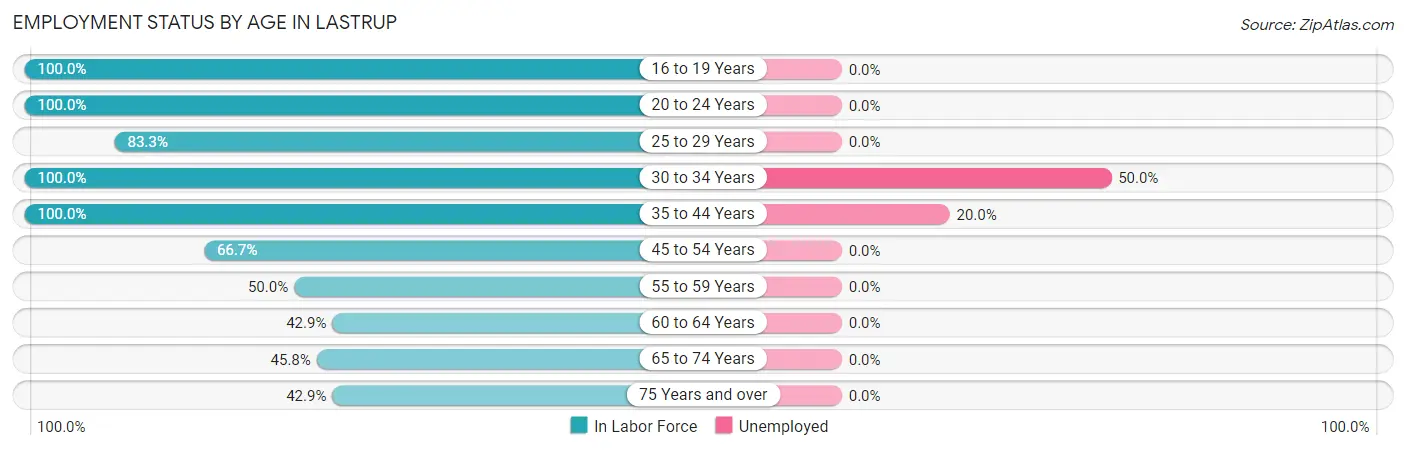
| Age Bracket | In Labor Force | Unemployed |
| 16 to 19 Years | 6 (100.0%) | 0 (0.0%) |
| 20 to 24 Years | 3 (100.0%) | 0 (0.0%) |
| 25 to 29 Years | 5 (83.3%) | 0 (0.0%) |
| 30 to 34 Years | 4 (100.0%) | 2 (50.0%) |
| 35 to 44 Years | 10 (100.0%) | 2 (20.0%) |
| 45 to 54 Years | 8 (66.7%) | 0 (0.0%) |
| 55 to 59 Years | 4 (50.0%) | 0 (0.0%) |
| 60 to 64 Years | 3 (42.9%) | 0 (0.0%) |
| 65 to 74 Years | 11 (45.8%) | 0 (0.0%) |
| 75 Years and over | 3 (42.9%) | 0 (0.0%) |
| Total | 57 (65.5%) | 4 (7.0%) |
Employment Status by Educational Attainment in Lastrup
According to labor force statistics for Lastrup, 72.3% of individuals (34) out of the total population between 25 and 64 years of age (47) are in the labor force, with 11.8% or 4 of them being unemployed. The group with the highest labor force participation rate are those with the educational attainment of bachelor's degree or higher, with 100.0% or 5 individuals in the labor force. Within the labor force, individuals with high school diploma education have the highest percentage of unemployment, with 30.8% or 4 of them being unemployed.
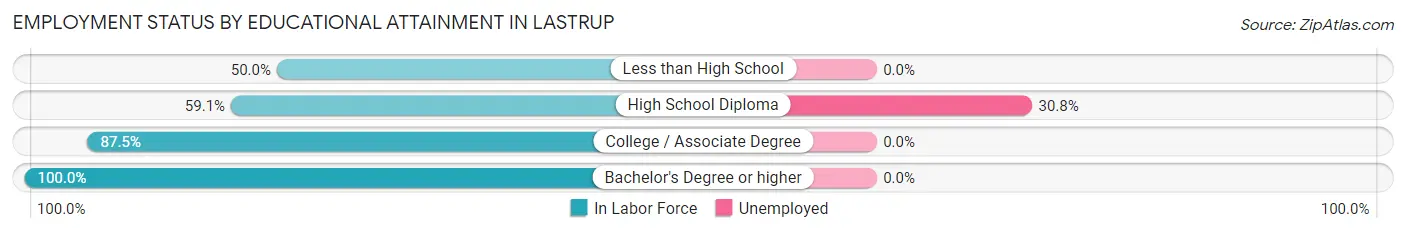
| Educational Attainment | In Labor Force | Unemployed |
| Less than High School | 2 (50.0%) | 0 (0.0%) |
| High School Diploma | 13 (59.1%) | 7 (30.8%) |
| College / Associate Degree | 14 (87.5%) | 0 (0.0%) |
| Bachelor's Degree or higher | 5 (100.0%) | 0 (0.0%) |
| Total | 34 (72.3%) | 6 (11.8%) |
Employment Occupations by Sex in Lastrup
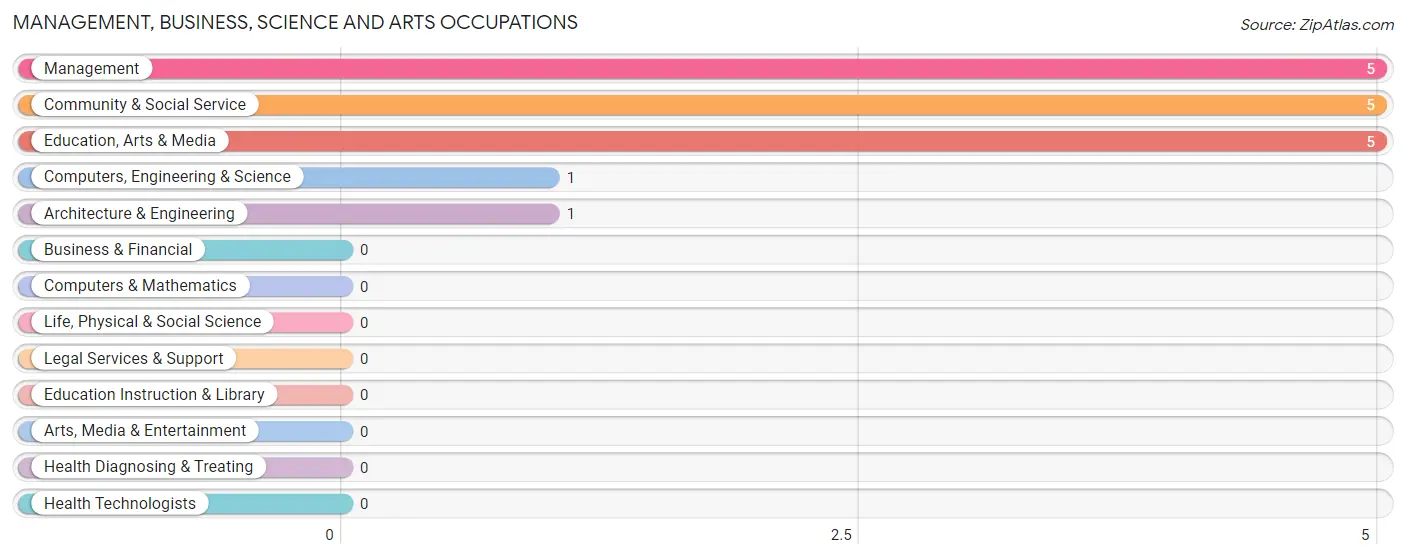
Management, Business, Science and Arts Occupations
The most common Management, Business, Science and Arts occupations in Lastrup are Management (5 | 9.4%), Community & Social Service (5 | 9.4%), Education, Arts & Media (5 | 9.4%), Computers, Engineering & Science (1 | 1.9%), and Architecture & Engineering (1 | 1.9%).
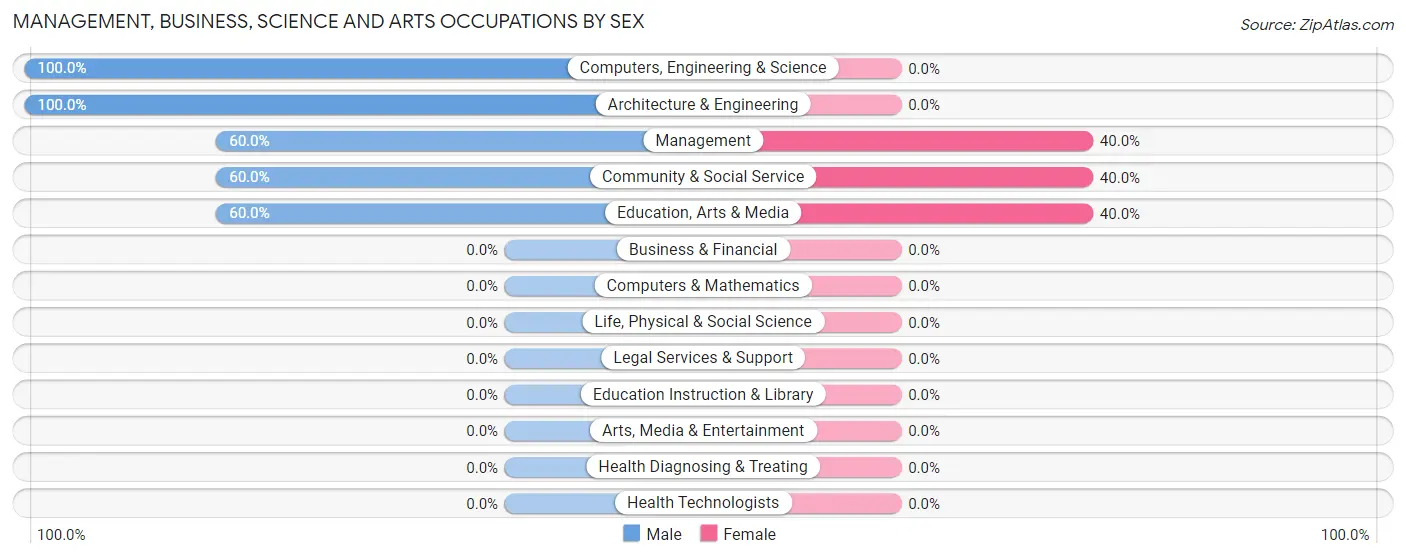
Management, Business, Science and Arts Occupations by Sex
Within the Management, Business, Science and Arts occupations in Lastrup, the most male-oriented occupations are Computers, Engineering & Science (100.0%), Architecture & Engineering (100.0%), and Management (60.0%), while the most female-oriented occupations are Management (40.0%), Community & Social Service (40.0%), and Education, Arts & Media (40.0%).
| Occupation | Male | Female |
| Management | 3 (60.0%) | 2 (40.0%) |
| Business & Financial | 0 (0.0%) | 0 (0.0%) |
| Computers, Engineering & Science | 1 (100.0%) | 0 (0.0%) |
| Computers & Mathematics | 0 (0.0%) | 0 (0.0%) |
| Architecture & Engineering | 1 (100.0%) | 0 (0.0%) |
| Life, Physical & Social Science | 0 (0.0%) | 0 (0.0%) |
| Community & Social Service | 3 (60.0%) | 2 (40.0%) |
| Education, Arts & Media | 3 (60.0%) | 2 (40.0%) |
| Legal Services & Support | 0 (0.0%) | 0 (0.0%) |
| Education Instruction & Library | 0 (0.0%) | 0 (0.0%) |
| Arts, Media & Entertainment | 0 (0.0%) | 0 (0.0%) |
| Health Diagnosing & Treating | 0 (0.0%) | 0 (0.0%) |
| Health Technologists | 0 (0.0%) | 0 (0.0%) |
| Total (Category) | 7 (63.6%) | 4 (36.4%) |
| Total (Overall) | 33 (62.3%) | 20 (37.7%) |
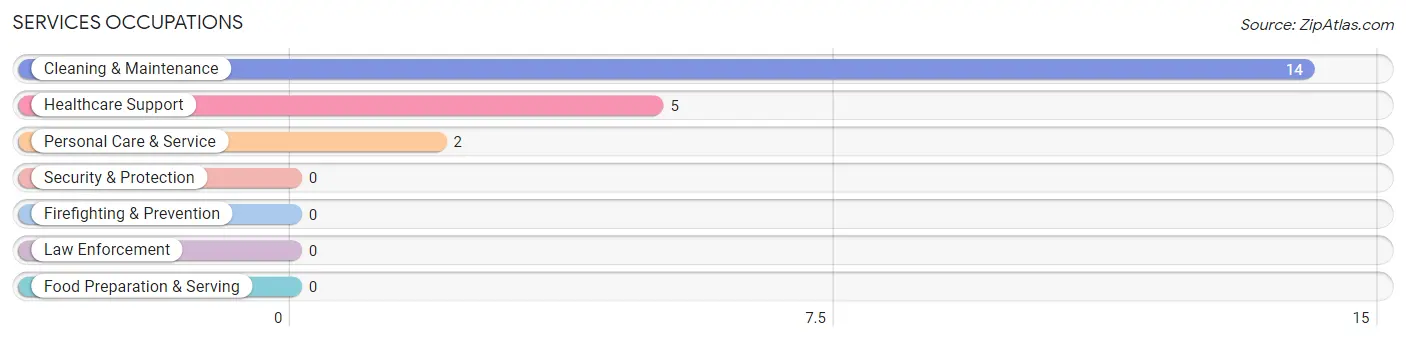
Services Occupations
The most common Services occupations in Lastrup are Cleaning & Maintenance (14 | 26.4%), Healthcare Support (5 | 9.4%), and Personal Care & Service (2 | 3.8%).
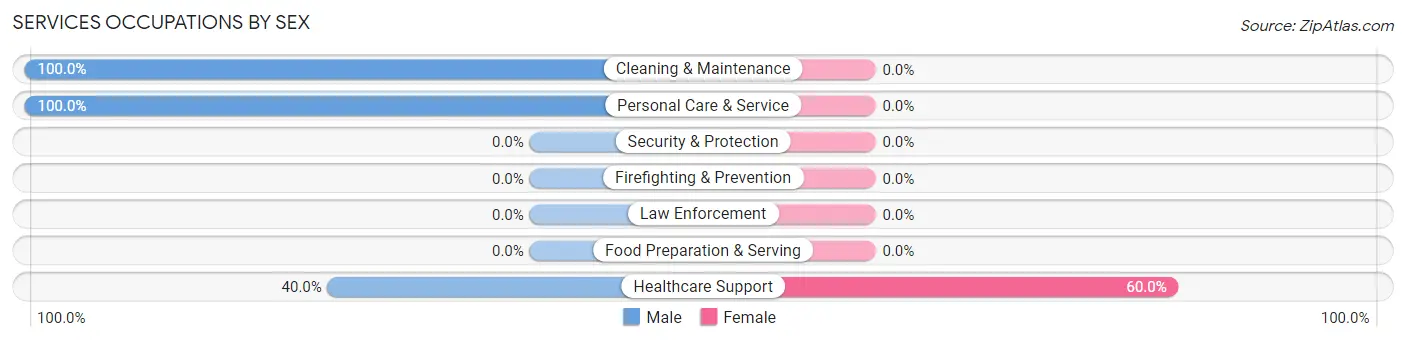
Services Occupations by Sex
| Occupation | Male | Female |
| Healthcare Support | 2 (40.0%) | 3 (60.0%) |
| Security & Protection | 0 (0.0%) | 0 (0.0%) |
| Firefighting & Prevention | 0 (0.0%) | 0 (0.0%) |
| Law Enforcement | 0 (0.0%) | 0 (0.0%) |
| Food Preparation & Serving | 0 (0.0%) | 0 (0.0%) |
| Cleaning & Maintenance | 14 (100.0%) | 0 (0.0%) |
| Personal Care & Service | 2 (100.0%) | 0 (0.0%) |
| Total (Category) | 18 (85.7%) | 3 (14.3%) |
| Total (Overall) | 33 (62.3%) | 20 (37.7%) |
Sales and Office Occupations
The most common Sales and Office occupations in Lastrup are Office & Administration (8 | 15.1%), and Sales & Related (5 | 9.4%).
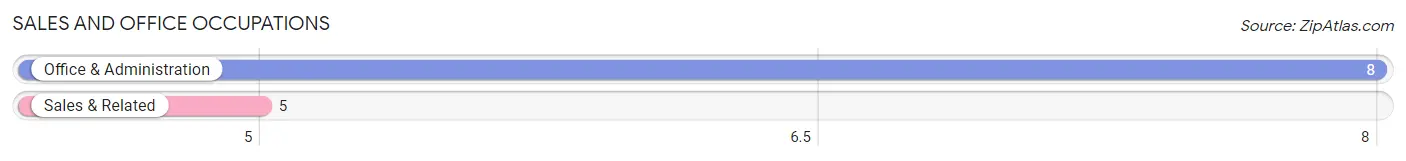
Sales and Office Occupations by Sex
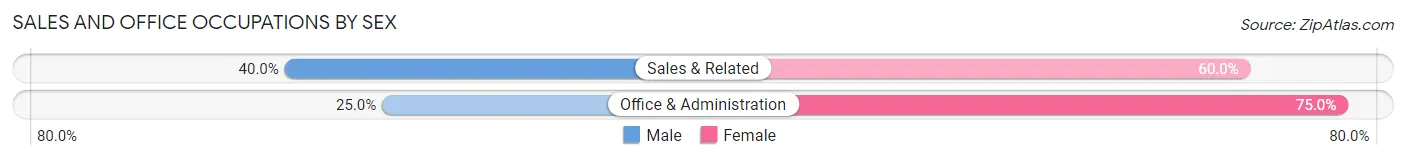
| Occupation | Male | Female |
| Sales & Related | 2 (40.0%) | 3 (60.0%) |
| Office & Administration | 2 (25.0%) | 6 (75.0%) |
| Total (Category) | 4 (30.8%) | 9 (69.2%) |
| Total (Overall) | 33 (62.3%) | 20 (37.7%) |
Natural Resources, Construction and Maintenance Occupations
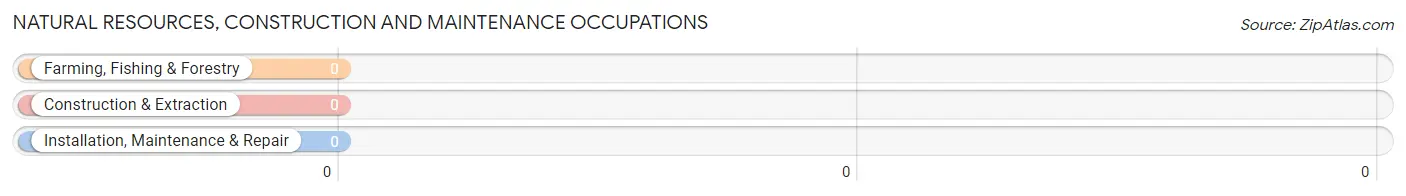
Natural Resources, Construction and Maintenance Occupations by Sex
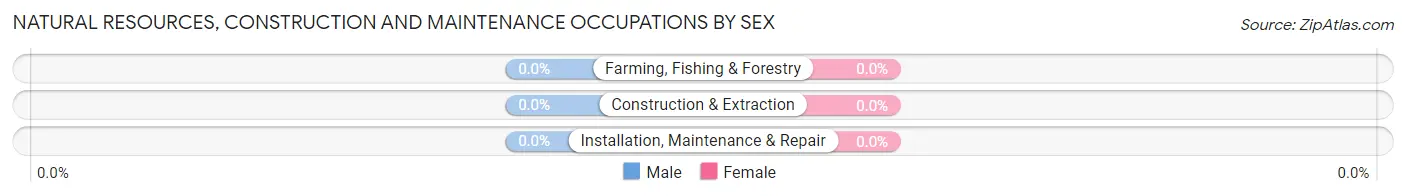
| Occupation | Male | Female |
| Farming, Fishing & Forestry | 0 (0.0%) | 0 (0.0%) |
| Construction & Extraction | 0 (0.0%) | 0 (0.0%) |
| Installation, Maintenance & Repair | 0 (0.0%) | 0 (0.0%) |
| Total (Category) | 0 (0.0%) | 0 (0.0%) |
| Total (Overall) | 33 (62.3%) | 20 (37.7%) |
Production, Transportation and Moving Occupations
The most common Production, Transportation and Moving occupations in Lastrup are Production (6 | 11.3%), and Transportation (2 | 3.8%).
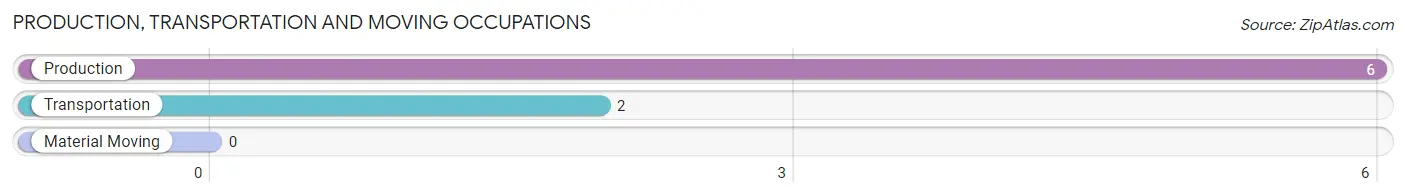
Production, Transportation and Moving Occupations by Sex
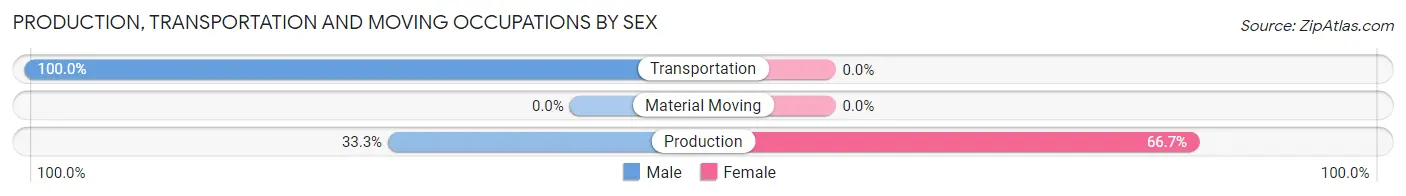
| Occupation | Male | Female |
| Production | 2 (33.3%) | 4 (66.7%) |
| Transportation | 2 (100.0%) | 0 (0.0%) |
| Material Moving | 0 (0.0%) | 0 (0.0%) |
| Total (Category) | 4 (50.0%) | 4 (50.0%) |
| Total (Overall) | 33 (62.3%) | 20 (37.7%) |
Employment Industries by Sex in Lastrup
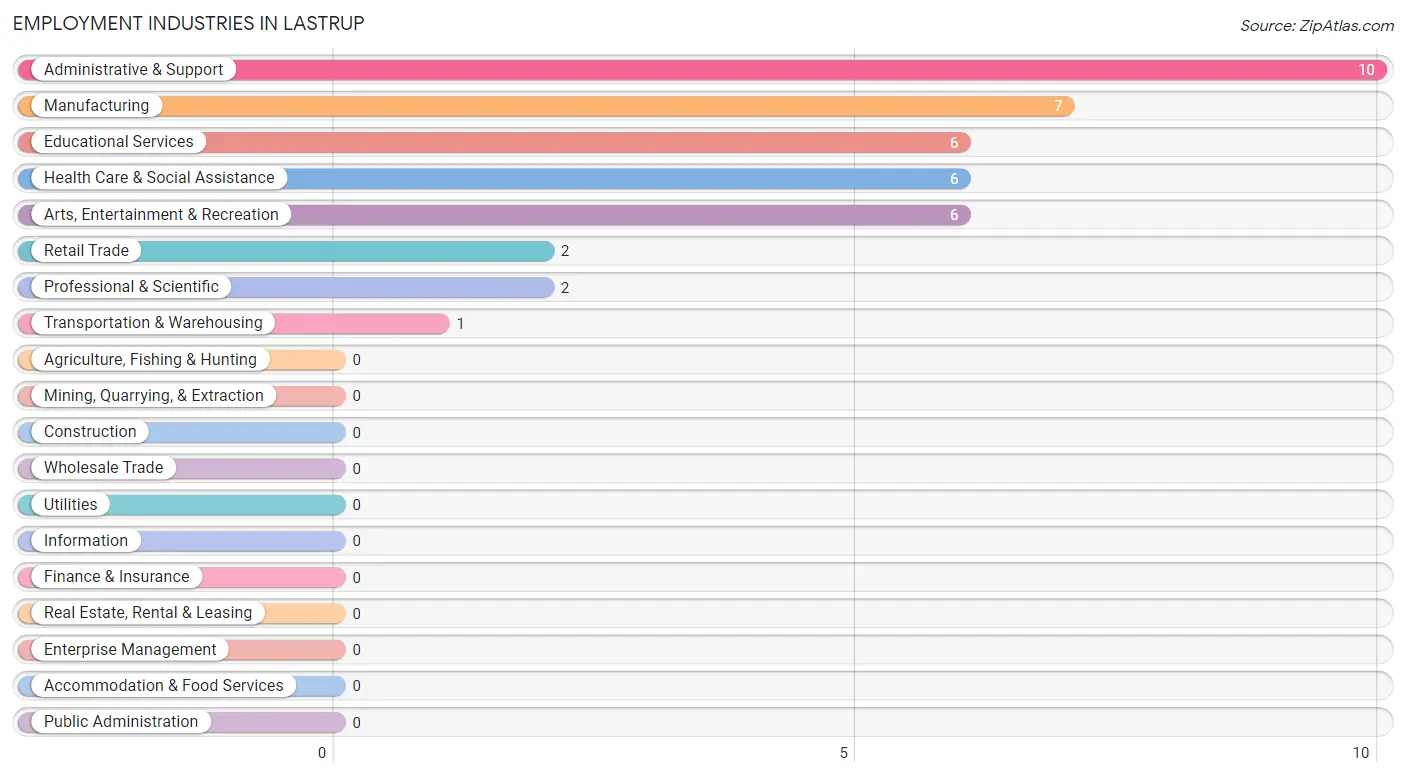
Employment Industries in Lastrup
The major employment industries in Lastrup include Administrative & Support (10 | 18.9%), Manufacturing (7 | 13.2%), Educational Services (6 | 11.3%), Health Care & Social Assistance (6 | 11.3%), and Arts, Entertainment & Recreation (6 | 11.3%).
Employment Industries by Sex in Lastrup
The Lastrup industries that see more men than women are Transportation & Warehousing (100.0%), Professional & Scientific (100.0%), and Administrative & Support (100.0%), whereas the industries that tend to have a higher number of women are Retail Trade (100.0%), Health Care & Social Assistance (83.3%), and Manufacturing (57.1%).
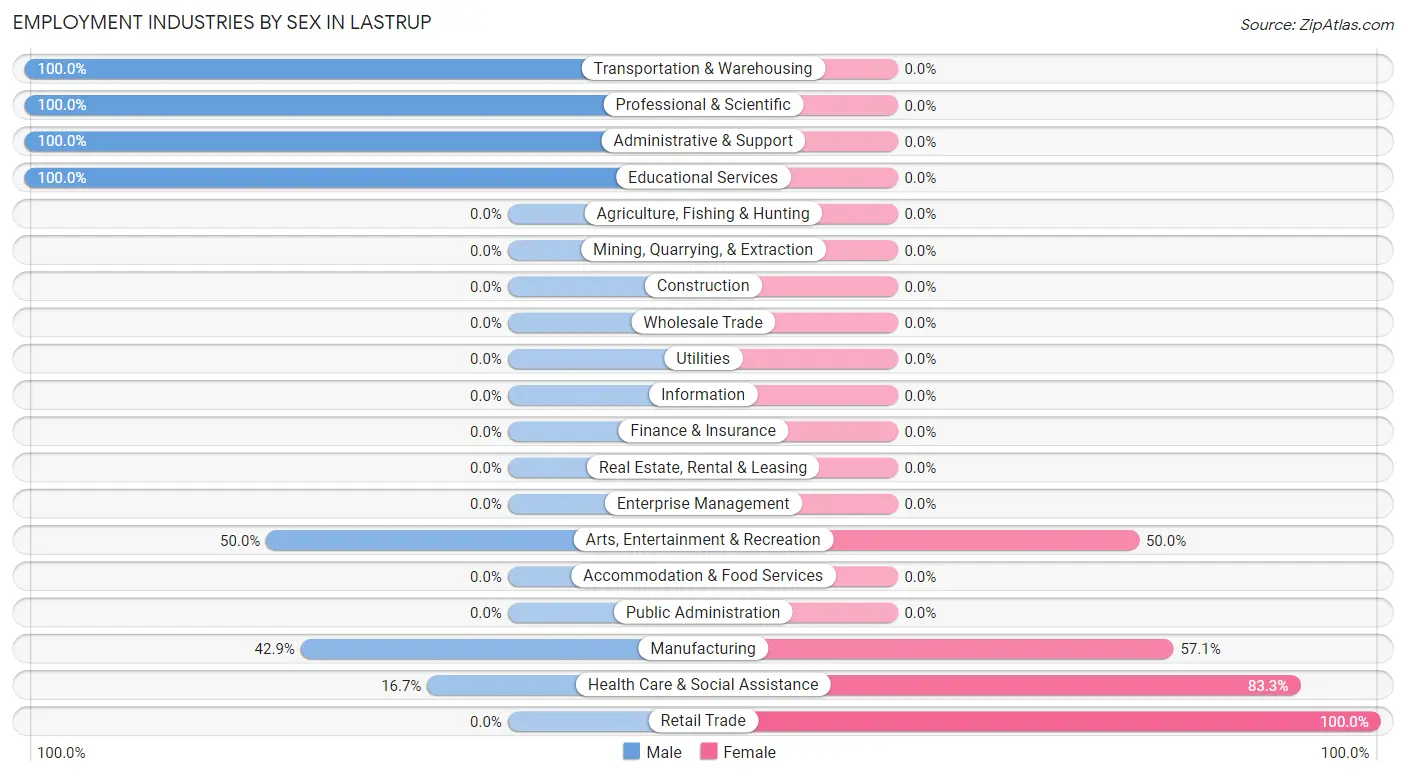
| Industry | Male | Female |
| Agriculture, Fishing & Hunting | 0 (0.0%) | 0 (0.0%) |
| Mining, Quarrying, & Extraction | 0 (0.0%) | 0 (0.0%) |
| Construction | 0 (0.0%) | 0 (0.0%) |
| Manufacturing | 3 (42.9%) | 4 (57.1%) |
| Wholesale Trade | 0 (0.0%) | 0 (0.0%) |
| Retail Trade | 0 (0.0%) | 2 (100.0%) |
| Transportation & Warehousing | 1 (100.0%) | 0 (0.0%) |
| Utilities | 0 (0.0%) | 0 (0.0%) |
| Information | 0 (0.0%) | 0 (0.0%) |
| Finance & Insurance | 0 (0.0%) | 0 (0.0%) |
| Real Estate, Rental & Leasing | 0 (0.0%) | 0 (0.0%) |
| Professional & Scientific | 2 (100.0%) | 0 (0.0%) |
| Enterprise Management | 0 (0.0%) | 0 (0.0%) |
| Administrative & Support | 10 (100.0%) | 0 (0.0%) |
| Educational Services | 6 (100.0%) | 0 (0.0%) |
| Health Care & Social Assistance | 1 (16.7%) | 5 (83.3%) |
| Arts, Entertainment & Recreation | 3 (50.0%) | 3 (50.0%) |
| Accommodation & Food Services | 0 (0.0%) | 0 (0.0%) |
| Public Administration | 0 (0.0%) | 0 (0.0%) |
| Total | 33 (62.3%) | 20 (37.7%) |
Education in Lastrup
School Enrollment in Lastrup
The most common levels of schooling among the 13 students in Lastrup are high school (5 | 38.5%), elementary school (4 | 30.8%), and kindergarten (3 | 23.1%).
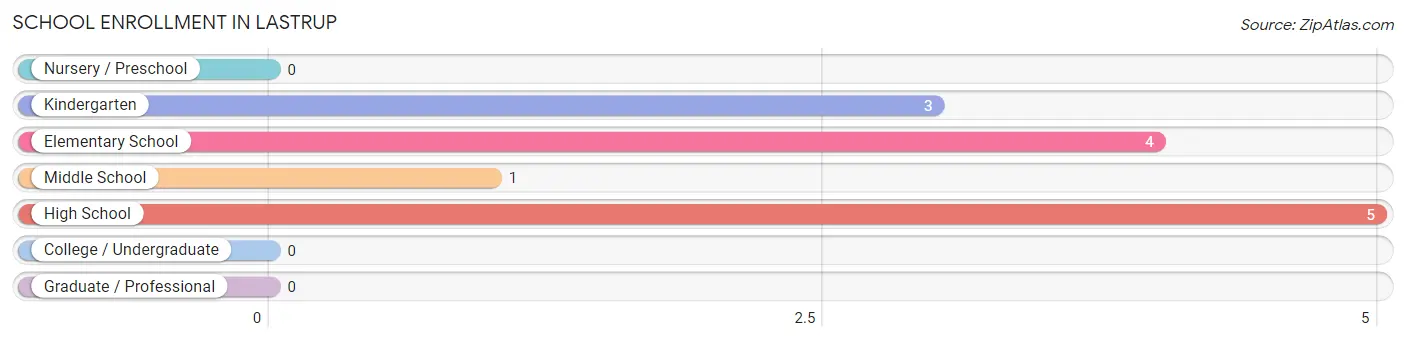
| School Level | # Students | % Students |
| Nursery / Preschool | 0 | 0.0% |
| Kindergarten | 3 | 23.1% |
| Elementary School | 4 | 30.8% |
| Middle School | 1 | 7.7% |
| High School | 5 | 38.5% |
| College / Undergraduate | 0 | 0.0% |
| Graduate / Professional | 0 | 0.0% |
| Total | 13 | 100.0% |
School Enrollment by Age by Funding Source in Lastrup
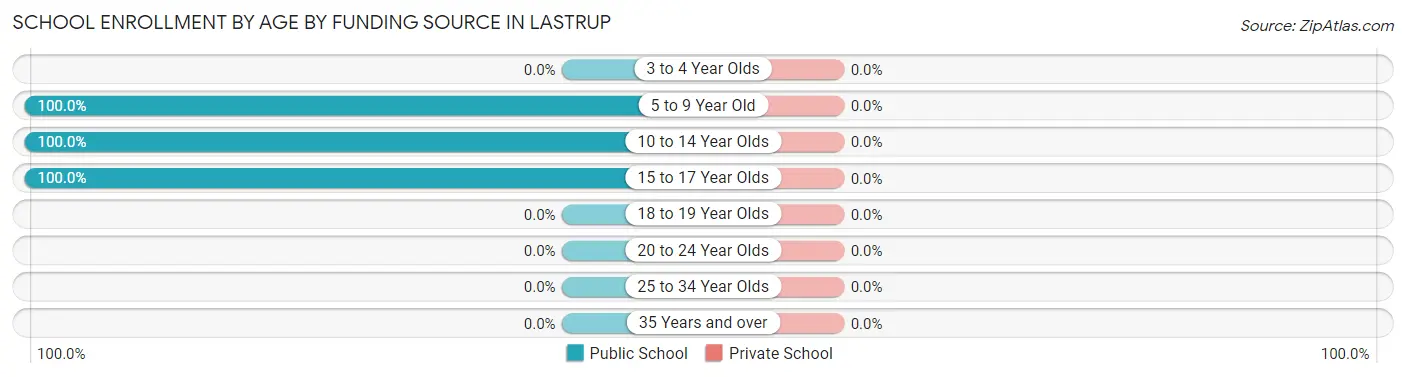
| Age Bracket | Public School | Private School |
| 3 to 4 Year Olds | 0 (0.0%) | 0 (0.0%) |
| 5 to 9 Year Old | 7 (100.0%) | 0 (0.0%) |
| 10 to 14 Year Olds | 1 (100.0%) | 0 (0.0%) |
| 15 to 17 Year Olds | 5 (100.0%) | 0 (0.0%) |
| 18 to 19 Year Olds | 0 (0.0%) | 0 (0.0%) |
| 20 to 24 Year Olds | 0 (0.0%) | 0 (0.0%) |
| 25 to 34 Year Olds | 0 (0.0%) | 0 (0.0%) |
| 35 Years and over | 0 (0.0%) | 0 (0.0%) |
| Total | 13 (100.0%) | 0 (0.0%) |
Educational Attainment by Field of Study in Lastrup
Social sciences (4 | 33.3%), education (3 | 25.0%), liberal arts & history (3 | 25.0%), and literature & languages (2 | 16.7%) are the most common fields of study among 12 individuals in Lastrup who have obtained a bachelor's degree or higher.
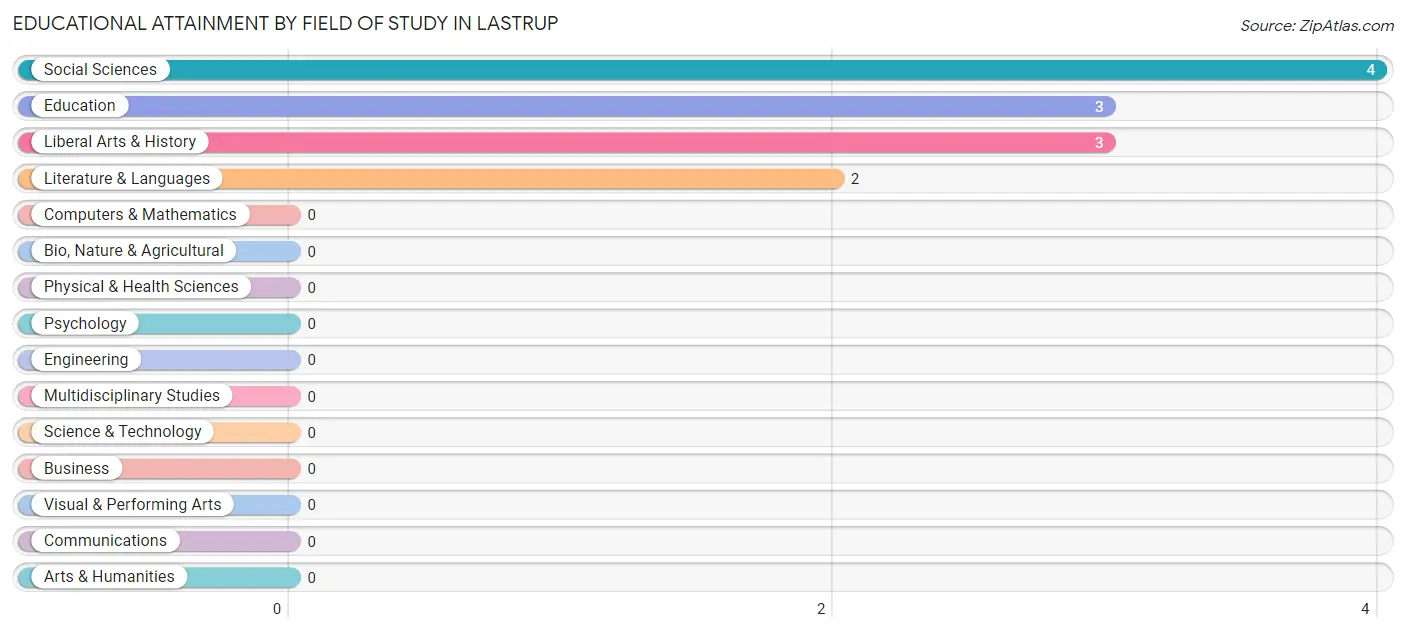
| Field of Study | # Graduates | % Graduates |
| Computers & Mathematics | 0 | 0.0% |
| Bio, Nature & Agricultural | 0 | 0.0% |
| Physical & Health Sciences | 0 | 0.0% |
| Psychology | 0 | 0.0% |
| Social Sciences | 4 | 33.3% |
| Engineering | 0 | 0.0% |
| Multidisciplinary Studies | 0 | 0.0% |
| Science & Technology | 0 | 0.0% |
| Business | 0 | 0.0% |
| Education | 3 | 25.0% |
| Literature & Languages | 2 | 16.7% |
| Liberal Arts & History | 3 | 25.0% |
| Visual & Performing Arts | 0 | 0.0% |
| Communications | 0 | 0.0% |
| Arts & Humanities | 0 | 0.0% |
| Total | 12 | 100.0% |
Transportation & Commute in Lastrup
Vehicle Availability by Sex in Lastrup
The most prevalent vehicle ownership categories in Lastrup are males with 3 vehicles (12, accounting for 36.4%) and females with 3 vehicles (10, making up 60.0%).
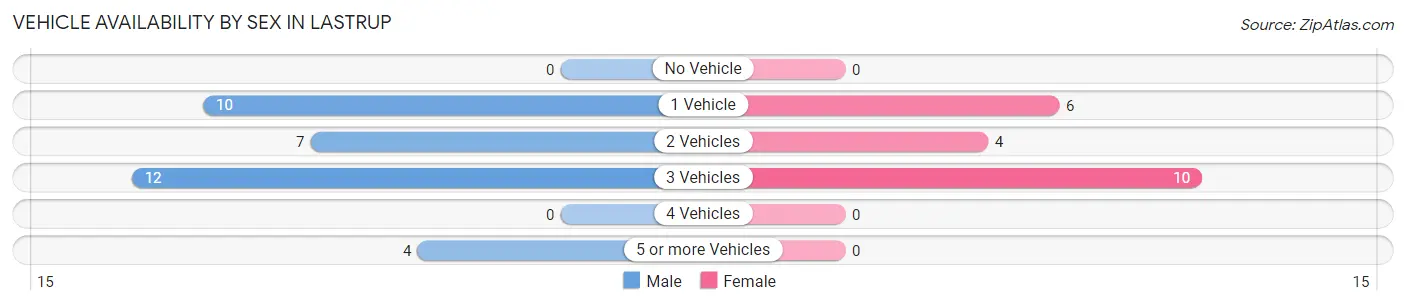
| Vehicles Available | Male | Female |
| No Vehicle | 0 (0.0%) | 0 (0.0%) |
| 1 Vehicle | 10 (30.3%) | 6 (30.0%) |
| 2 Vehicles | 7 (21.2%) | 4 (20.0%) |
| 3 Vehicles | 12 (36.4%) | 10 (50.0%) |
| 4 Vehicles | 0 (0.0%) | 0 (0.0%) |
| 5 or more Vehicles | 4 (12.1%) | 0 (0.0%) |
| Total | 33 (100.0%) | 20 (100.0%) |
Commute Time in Lastrup
The most frequently occuring commute durations in Lastrup are 10 to 14 minutes (13 commuters, 28.9%), 60 to 89 minutes (7 commuters, 15.6%), and 20 to 24 minutes (5 commuters, 11.1%).
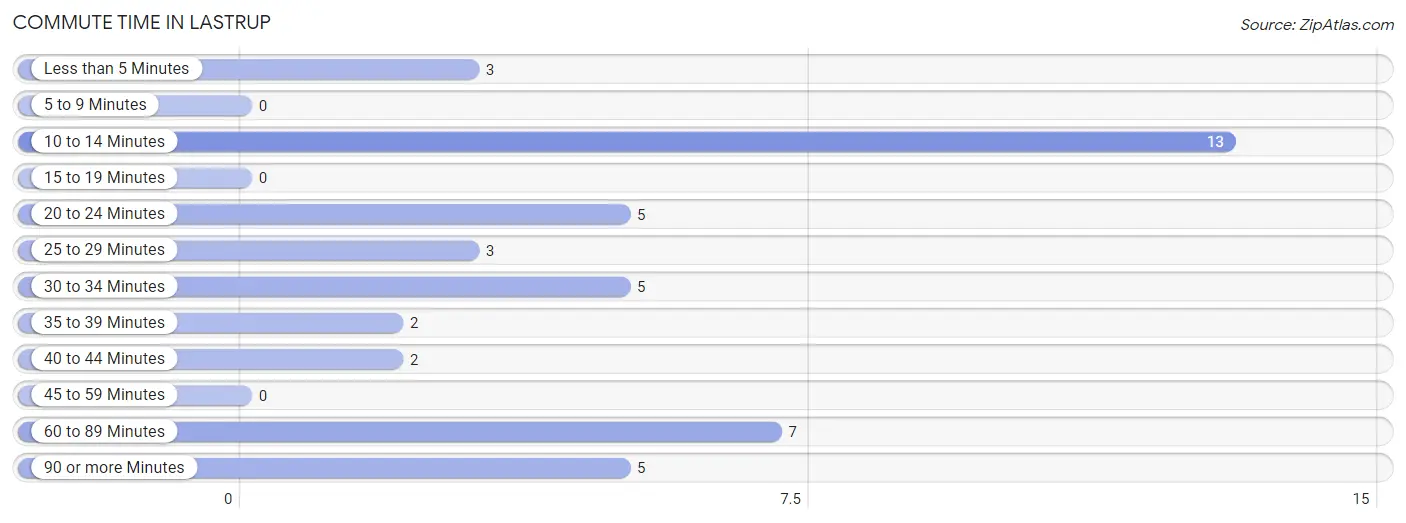
| Commute Time | # Commuters | % Commuters |
| Less than 5 Minutes | 3 | 6.7% |
| 5 to 9 Minutes | 0 | 0.0% |
| 10 to 14 Minutes | 13 | 28.9% |
| 15 to 19 Minutes | 0 | 0.0% |
| 20 to 24 Minutes | 5 | 11.1% |
| 25 to 29 Minutes | 3 | 6.7% |
| 30 to 34 Minutes | 5 | 11.1% |
| 35 to 39 Minutes | 2 | 4.4% |
| 40 to 44 Minutes | 2 | 4.4% |
| 45 to 59 Minutes | 0 | 0.0% |
| 60 to 89 Minutes | 7 | 15.6% |
| 90 or more Minutes | 5 | 11.1% |
Commute Time by Sex in Lastrup
The most common commute times in Lastrup are 10 to 14 minutes (10 commuters, 35.7%) for males and 10 to 14 minutes (3 commuters, 17.6%) for females.
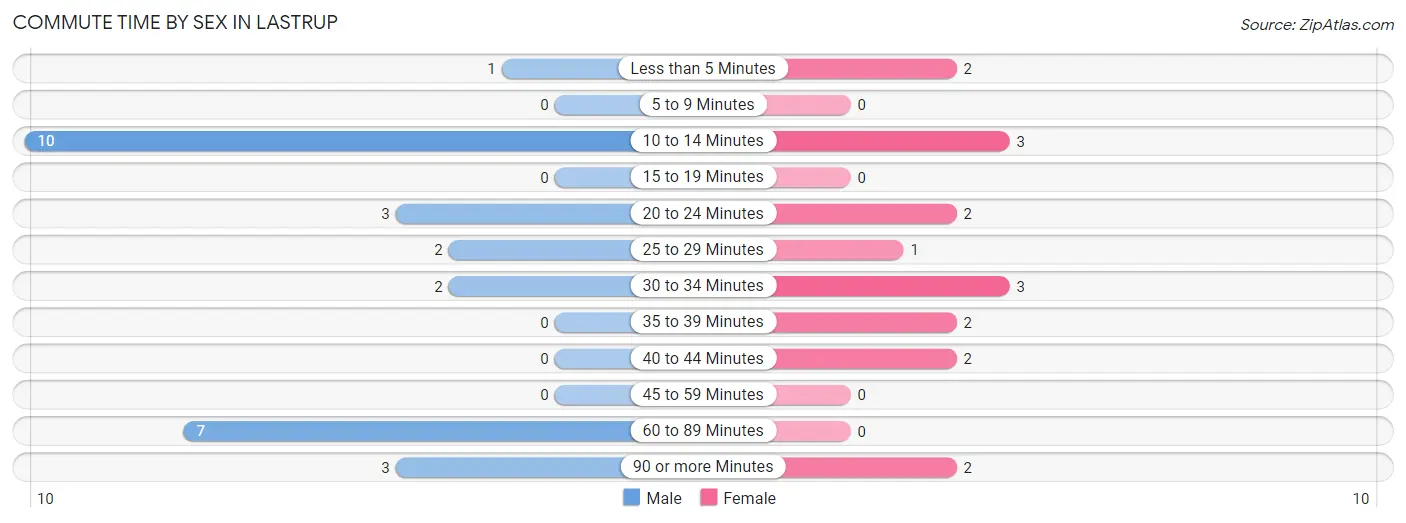
| Commute Time | Male | Female |
| Less than 5 Minutes | 1 (3.6%) | 2 (11.8%) |
| 5 to 9 Minutes | 0 (0.0%) | 0 (0.0%) |
| 10 to 14 Minutes | 10 (35.7%) | 3 (17.6%) |
| 15 to 19 Minutes | 0 (0.0%) | 0 (0.0%) |
| 20 to 24 Minutes | 3 (10.7%) | 2 (11.8%) |
| 25 to 29 Minutes | 2 (7.1%) | 1 (5.9%) |
| 30 to 34 Minutes | 2 (7.1%) | 3 (17.6%) |
| 35 to 39 Minutes | 0 (0.0%) | 2 (11.8%) |
| 40 to 44 Minutes | 0 (0.0%) | 2 (11.8%) |
| 45 to 59 Minutes | 0 (0.0%) | 0 (0.0%) |
| 60 to 89 Minutes | 7 (25.0%) | 0 (0.0%) |
| 90 or more Minutes | 3 (10.7%) | 2 (11.8%) |
Time of Departure to Work by Sex in Lastrup
The most frequent times of departure to work in Lastrup are 7:30 AM to 7:59 AM (6, 21.4%) for males and 7:00 AM to 7:29 AM (5, 29.4%) for females.
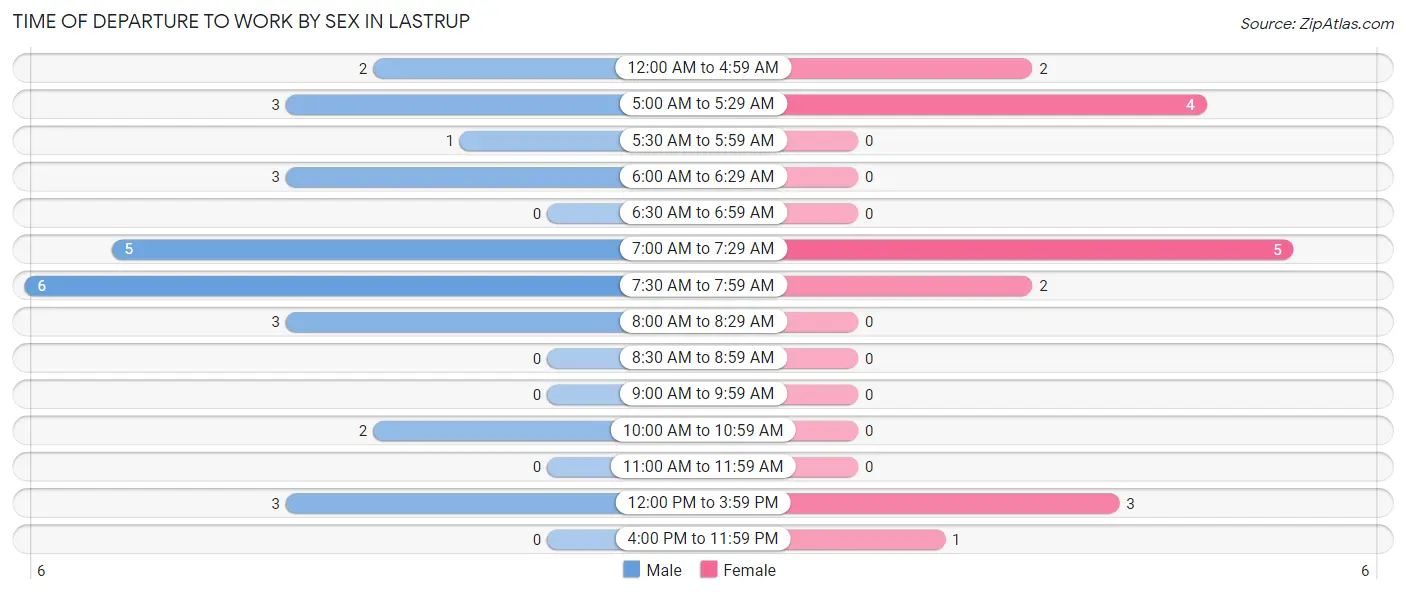
| Time of Departure | Male | Female |
| 12:00 AM to 4:59 AM | 2 (7.1%) | 2 (11.8%) |
| 5:00 AM to 5:29 AM | 3 (10.7%) | 4 (23.5%) |
| 5:30 AM to 5:59 AM | 1 (3.6%) | 0 (0.0%) |
| 6:00 AM to 6:29 AM | 3 (10.7%) | 0 (0.0%) |
| 6:30 AM to 6:59 AM | 0 (0.0%) | 0 (0.0%) |
| 7:00 AM to 7:29 AM | 5 (17.9%) | 5 (29.4%) |
| 7:30 AM to 7:59 AM | 6 (21.4%) | 2 (11.8%) |
| 8:00 AM to 8:29 AM | 3 (10.7%) | 0 (0.0%) |
| 8:30 AM to 8:59 AM | 0 (0.0%) | 0 (0.0%) |
| 9:00 AM to 9:59 AM | 0 (0.0%) | 0 (0.0%) |
| 10:00 AM to 10:59 AM | 2 (7.1%) | 0 (0.0%) |
| 11:00 AM to 11:59 AM | 0 (0.0%) | 0 (0.0%) |
| 12:00 PM to 3:59 PM | 3 (10.7%) | 3 (17.6%) |
| 4:00 PM to 11:59 PM | 0 (0.0%) | 1 (5.9%) |
| Total | 28 (100.0%) | 17 (100.0%) |
Housing Occupancy in Lastrup
Occupancy by Ownership in Lastrup
Of the total 44 dwellings in Lastrup, owner-occupied units account for 35 (79.5%), while renter-occupied units make up 9 (20.4%).
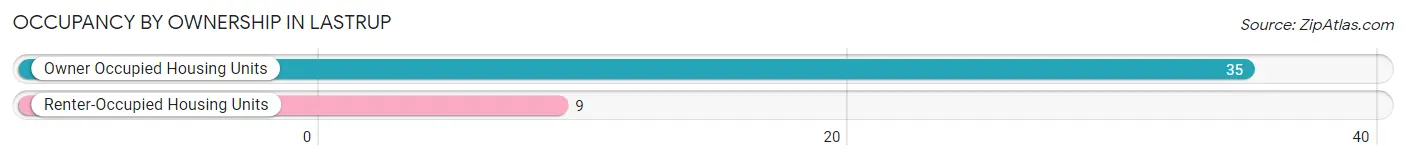
| Occupancy | # Housing Units | % Housing Units |
| Owner Occupied Housing Units | 35 | 79.5% |
| Renter-Occupied Housing Units | 9 | 20.4% |
| Total Occupied Housing Units | 44 | 100.0% |
Occupancy by Household Size in Lastrup
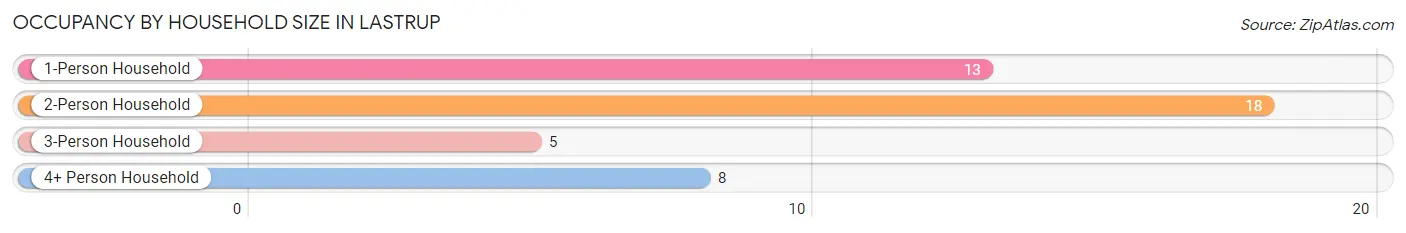
| Household Size | # Housing Units | % Housing Units |
| 1-Person Household | 13 | 29.5% |
| 2-Person Household | 18 | 40.9% |
| 3-Person Household | 5 | 11.4% |
| 4+ Person Household | 8 | 18.2% |
| Total Housing Units | 44 | 100.0% |
Occupancy by Ownership by Household Size in Lastrup
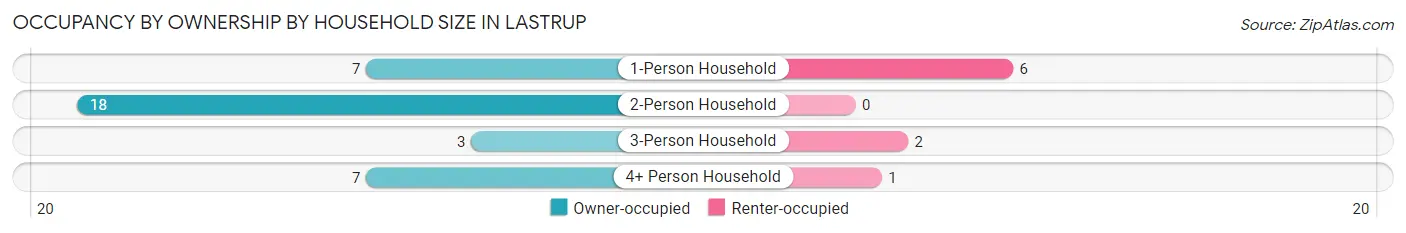
| Household Size | Owner-occupied | Renter-occupied |
| 1-Person Household | 7 (53.8%) | 6 (46.2%) |
| 2-Person Household | 18 (100.0%) | 0 (0.0%) |
| 3-Person Household | 3 (60.0%) | 2 (40.0%) |
| 4+ Person Household | 7 (87.5%) | 1 (12.5%) |
| Total Housing Units | 35 (79.5%) | 9 (20.4%) |
Occupancy by Educational Attainment in Lastrup
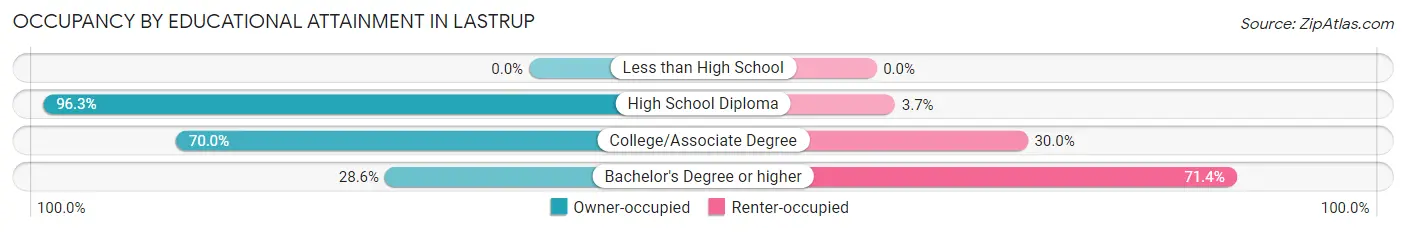
| Household Size | Owner-occupied | Renter-occupied |
| Less than High School | 0 (0.0%) | 0 (0.0%) |
| High School Diploma | 26 (96.3%) | 1 (3.7%) |
| College/Associate Degree | 7 (70.0%) | 3 (30.0%) |
| Bachelor's Degree or higher | 2 (28.6%) | 5 (71.4%) |
Occupancy by Age of Householder in Lastrup
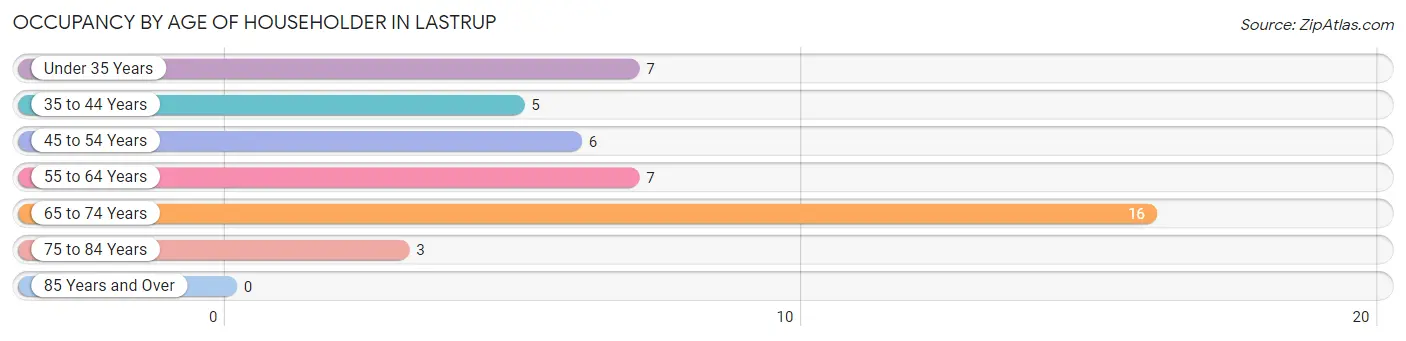
| Age Bracket | # Households | % Households |
| Under 35 Years | 7 | 15.9% |
| 35 to 44 Years | 5 | 11.4% |
| 45 to 54 Years | 6 | 13.6% |
| 55 to 64 Years | 7 | 15.9% |
| 65 to 74 Years | 16 | 36.4% |
| 75 to 84 Years | 3 | 6.8% |
| 85 Years and Over | 0 | 0.0% |
| Total | 44 | 100.0% |
Housing Finances in Lastrup
Median Income by Occupancy in Lastrup
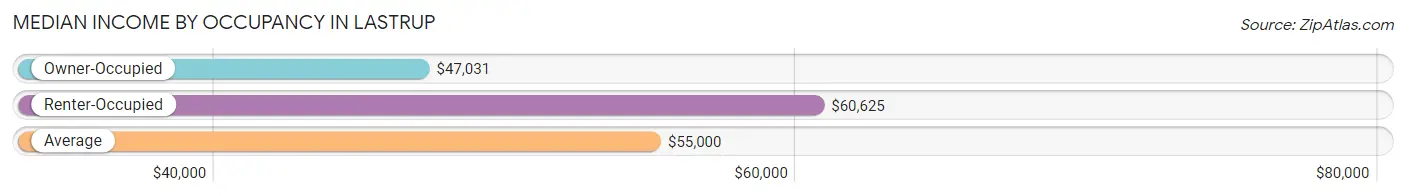
| Occupancy Type | # Households | Median Income |
| Owner-Occupied | 35 (79.5%) | $47,031 |
| Renter-Occupied | 9 (20.4%) | $60,625 |
| Average | 44 (100.0%) | $55,000 |
Occupancy by Householder Income Bracket in Lastrup
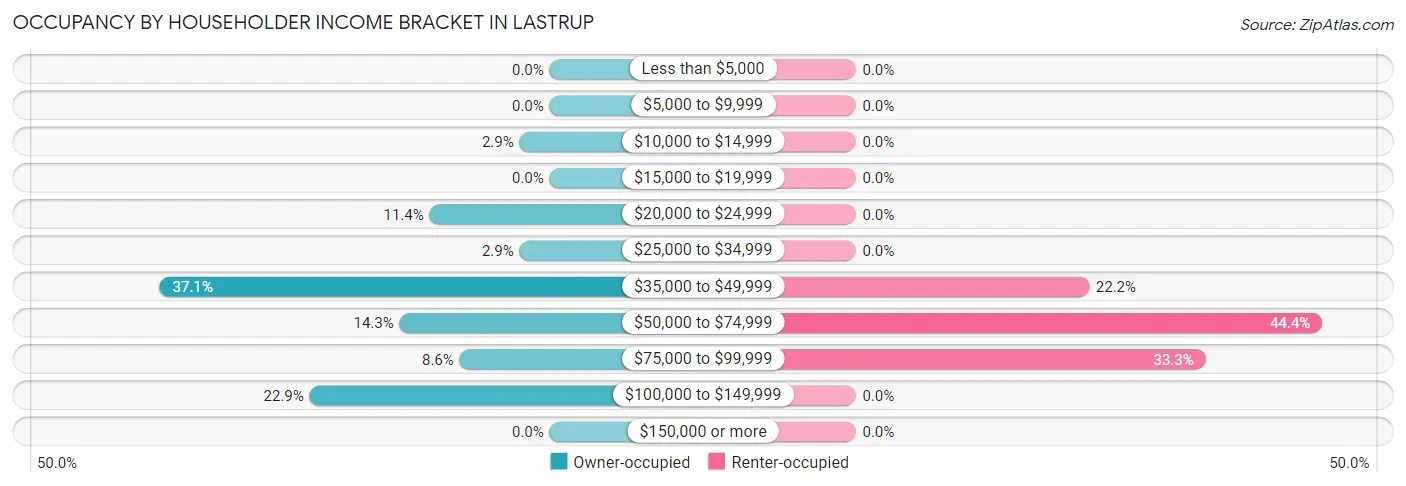
| Income Bracket | Owner-occupied | Renter-occupied |
| Less than $5,000 | 0 (0.0%) | 0 (0.0%) |
| $5,000 to $9,999 | 0 (0.0%) | 0 (0.0%) |
| $10,000 to $14,999 | 1 (2.9%) | 0 (0.0%) |
| $15,000 to $19,999 | 0 (0.0%) | 0 (0.0%) |
| $20,000 to $24,999 | 4 (11.4%) | 0 (0.0%) |
| $25,000 to $34,999 | 1 (2.9%) | 0 (0.0%) |
| $35,000 to $49,999 | 13 (37.1%) | 2 (22.2%) |
| $50,000 to $74,999 | 5 (14.3%) | 4 (44.4%) |
| $75,000 to $99,999 | 3 (8.6%) | 3 (33.3%) |
| $100,000 to $149,999 | 8 (22.9%) | 0 (0.0%) |
| $150,000 or more | 0 (0.0%) | 0 (0.0%) |
| Total | 35 (100.0%) | 9 (100.0%) |
Monthly Housing Cost Tiers in Lastrup
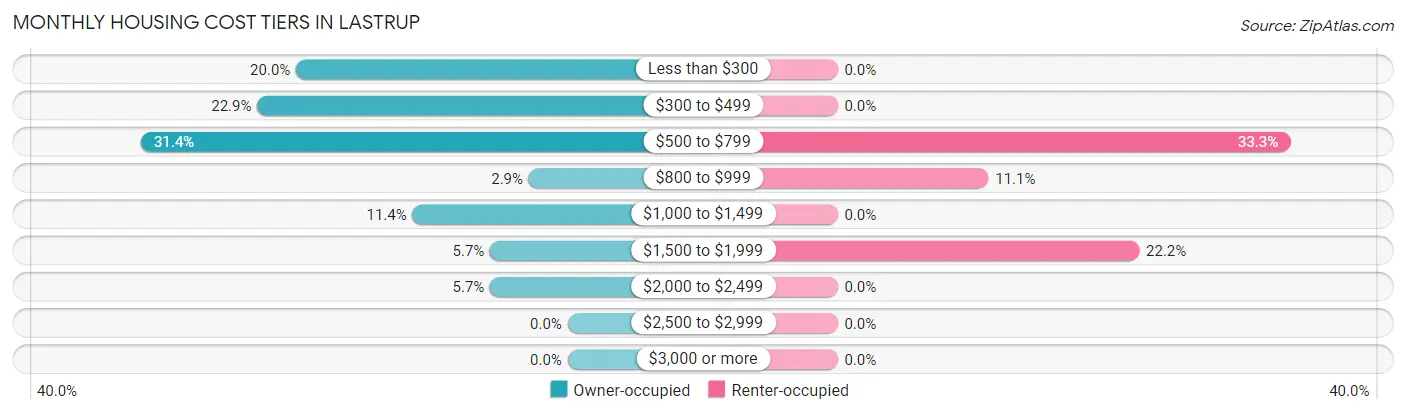
| Monthly Cost | Owner-occupied | Renter-occupied |
| Less than $300 | 7 (20.0%) | 0 (0.0%) |
| $300 to $499 | 8 (22.9%) | 0 (0.0%) |
| $500 to $799 | 11 (31.4%) | 3 (33.3%) |
| $800 to $999 | 1 (2.9%) | 1 (11.1%) |
| $1,000 to $1,499 | 4 (11.4%) | 0 (0.0%) |
| $1,500 to $1,999 | 2 (5.7%) | 2 (22.2%) |
| $2,000 to $2,499 | 2 (5.7%) | 0 (0.0%) |
| $2,500 to $2,999 | 0 (0.0%) | 0 (0.0%) |
| $3,000 or more | 0 (0.0%) | 0 (0.0%) |
| Total | 35 (100.0%) | 9 (100.0%) |
Physical Housing Characteristics in Lastrup
Housing Structures in Lastrup
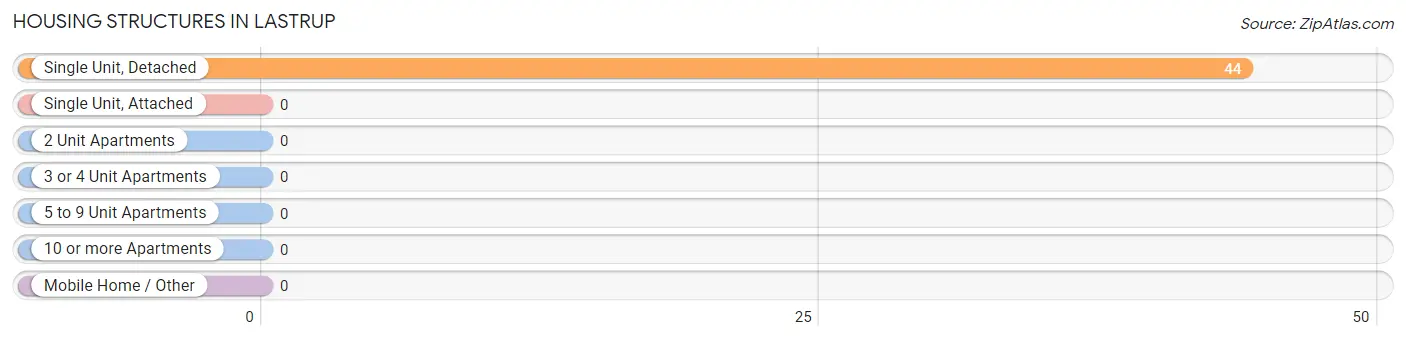
| Structure Type | # Housing Units | % Housing Units |
| Single Unit, Detached | 44 | 100.0% |
| Single Unit, Attached | 0 | 0.0% |
| 2 Unit Apartments | 0 | 0.0% |
| 3 or 4 Unit Apartments | 0 | 0.0% |
| 5 to 9 Unit Apartments | 0 | 0.0% |
| 10 or more Apartments | 0 | 0.0% |
| Mobile Home / Other | 0 | 0.0% |
| Total | 44 | 100.0% |
Housing Structures by Occupancy in Lastrup
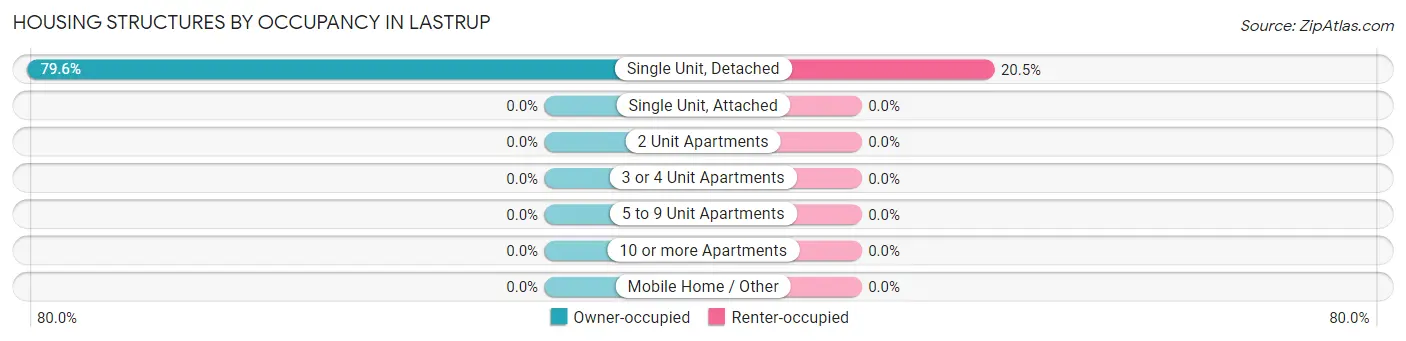
| Structure Type | Owner-occupied | Renter-occupied |
| Single Unit, Detached | 35 (79.5%) | 9 (20.4%) |
| Single Unit, Attached | 0 (0.0%) | 0 (0.0%) |
| 2 Unit Apartments | 0 (0.0%) | 0 (0.0%) |
| 3 or 4 Unit Apartments | 0 (0.0%) | 0 (0.0%) |
| 5 to 9 Unit Apartments | 0 (0.0%) | 0 (0.0%) |
| 10 or more Apartments | 0 (0.0%) | 0 (0.0%) |
| Mobile Home / Other | 0 (0.0%) | 0 (0.0%) |
| Total | 35 (79.5%) | 9 (20.4%) |
Housing Structures by Number of Rooms in Lastrup
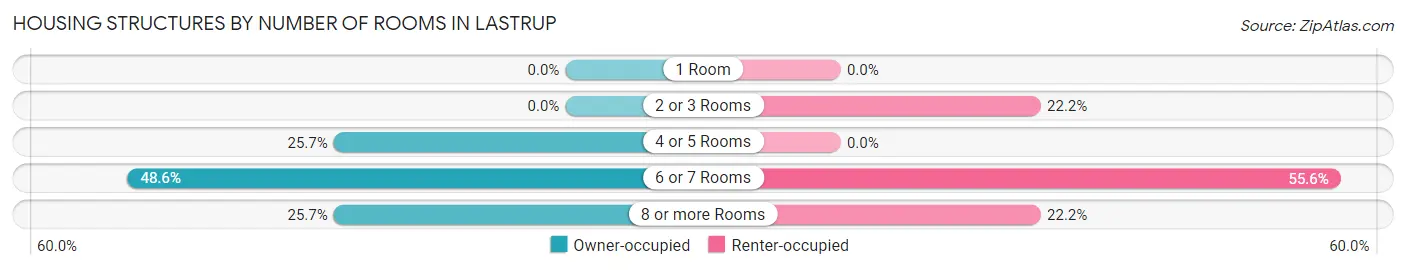
| Number of Rooms | Owner-occupied | Renter-occupied |
| 1 Room | 0 (0.0%) | 0 (0.0%) |
| 2 or 3 Rooms | 0 (0.0%) | 2 (22.2%) |
| 4 or 5 Rooms | 9 (25.7%) | 0 (0.0%) |
| 6 or 7 Rooms | 17 (48.6%) | 5 (55.6%) |
| 8 or more Rooms | 9 (25.7%) | 2 (22.2%) |
| Total | 35 (100.0%) | 9 (100.0%) |
Housing Structure by Heating Type in Lastrup
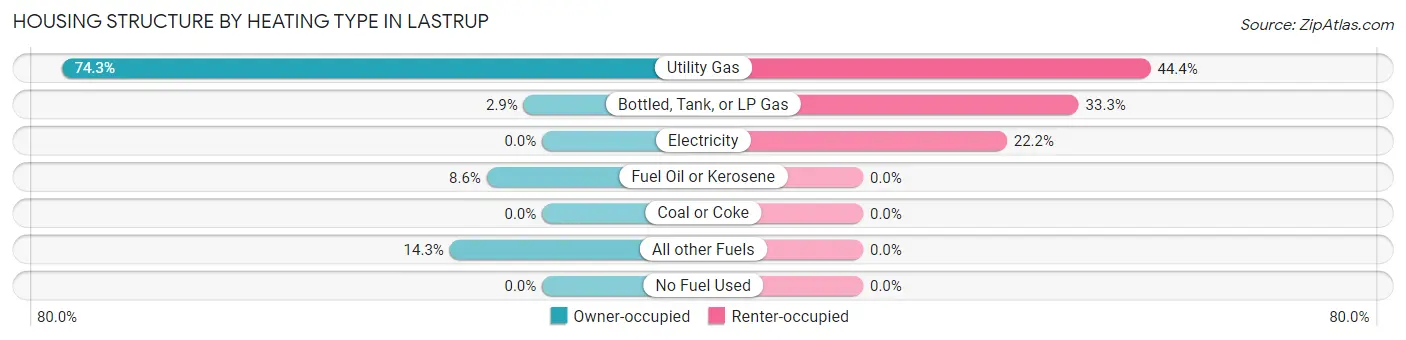
| Heating Type | Owner-occupied | Renter-occupied |
| Utility Gas | 26 (74.3%) | 4 (44.4%) |
| Bottled, Tank, or LP Gas | 1 (2.9%) | 3 (33.3%) |
| Electricity | 0 (0.0%) | 2 (22.2%) |
| Fuel Oil or Kerosene | 3 (8.6%) | 0 (0.0%) |
| Coal or Coke | 0 (0.0%) | 0 (0.0%) |
| All other Fuels | 5 (14.3%) | 0 (0.0%) |
| No Fuel Used | 0 (0.0%) | 0 (0.0%) |
| Total | 35 (100.0%) | 9 (100.0%) |
Household Vehicle Usage in Lastrup
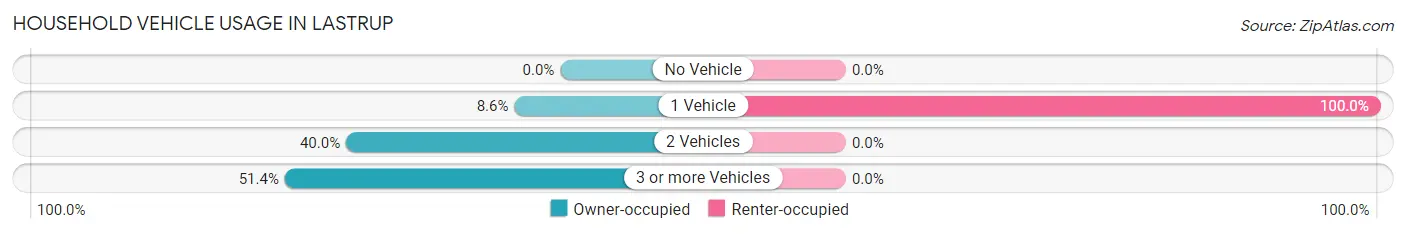
| Vehicles per Household | Owner-occupied | Renter-occupied |
| No Vehicle | 0 (0.0%) | 0 (0.0%) |
| 1 Vehicle | 3 (8.6%) | 9 (100.0%) |
| 2 Vehicles | 14 (40.0%) | 0 (0.0%) |
| 3 or more Vehicles | 18 (51.4%) | 0 (0.0%) |
| Total | 35 (100.0%) | 9 (100.0%) |
Real Estate & Mortgages in Lastrup
Real Estate and Mortgage Overview in Lastrup
| Characteristic | Without Mortgage | With Mortgage |
| Housing Units | 21 | 14 |
| Median Property Value | $106,300 | $85,000 |
| Median Household Income | $45,208 | $0 |
| Monthly Housing Costs | $436 | $0 |
| Real Estate Taxes | $1,350 | $0 |
Property Value by Mortgage Status in Lastrup
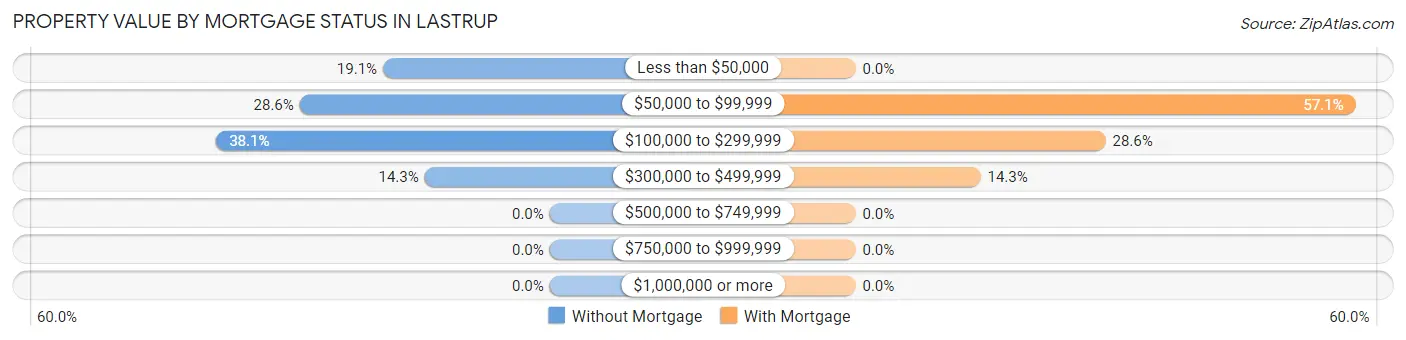
| Property Value | Without Mortgage | With Mortgage |
| Less than $50,000 | 4 (19.1%) | 0 (0.0%) |
| $50,000 to $99,999 | 6 (28.6%) | 8 (57.1%) |
| $100,000 to $299,999 | 8 (38.1%) | 4 (28.6%) |
| $300,000 to $499,999 | 3 (14.3%) | 2 (14.3%) |
| $500,000 to $749,999 | 0 (0.0%) | 0 (0.0%) |
| $750,000 to $999,999 | 0 (0.0%) | 0 (0.0%) |
| $1,000,000 or more | 0 (0.0%) | 0 (0.0%) |
| Total | 21 (100.0%) | 14 (100.0%) |
Household Income by Mortgage Status in Lastrup
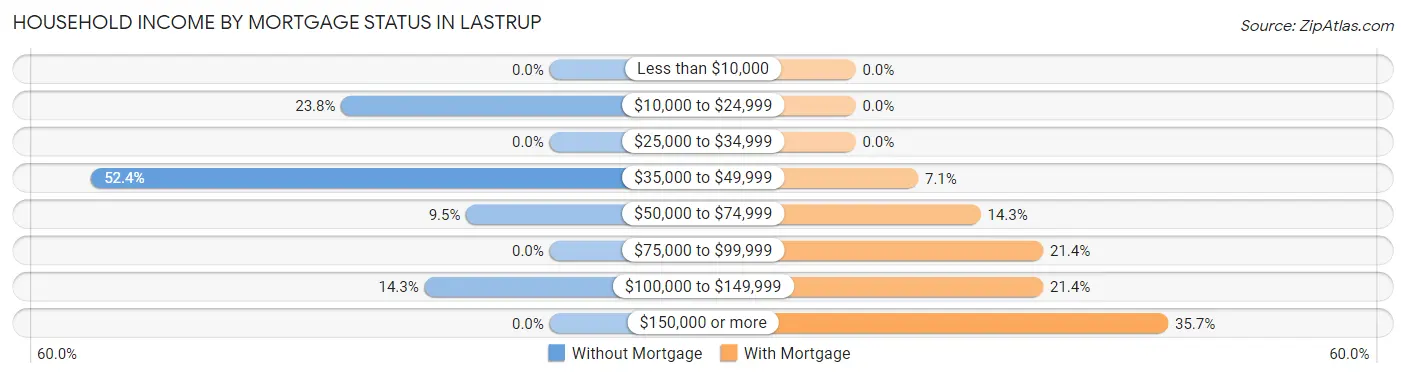
| Household Income | Without Mortgage | With Mortgage |
| Less than $10,000 | 0 (0.0%) | 0 (0.0%) |
| $10,000 to $24,999 | 5 (23.8%) | 0 (0.0%) |
| $25,000 to $34,999 | 0 (0.0%) | 0 (0.0%) |
| $35,000 to $49,999 | 11 (52.4%) | 1 (7.1%) |
| $50,000 to $74,999 | 2 (9.5%) | 2 (14.3%) |
| $75,000 to $99,999 | 0 (0.0%) | 3 (21.4%) |
| $100,000 to $149,999 | 3 (14.3%) | 3 (21.4%) |
| $150,000 or more | 0 (0.0%) | 5 (35.7%) |
| Total | 21 (100.0%) | 14 (100.0%) |
Property Value to Household Income Ratio in Lastrup
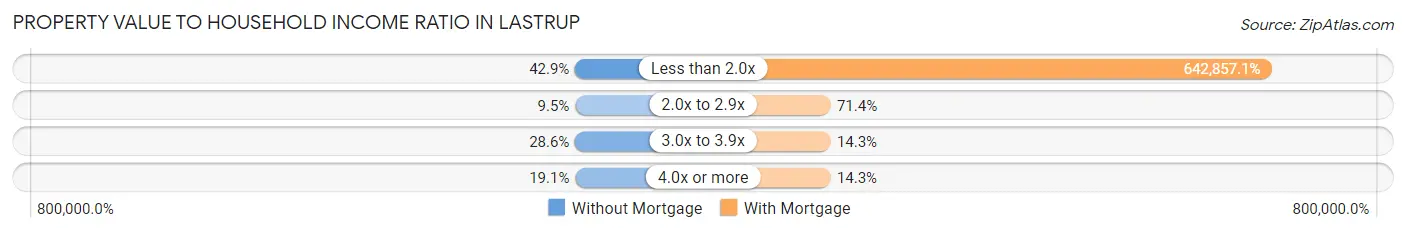
| Value-to-Income Ratio | Without Mortgage | With Mortgage |
| Less than 2.0x | 9 (42.9%) | 90,000 (642,857.1%) |
| 2.0x to 2.9x | 2 (9.5%) | 10 (71.4%) |
| 3.0x to 3.9x | 6 (28.6%) | 2 (14.3%) |
| 4.0x or more | 4 (19.1%) | 2 (14.3%) |
| Total | 21 (100.0%) | 14 (100.0%) |
Real Estate Taxes by Mortgage Status in Lastrup
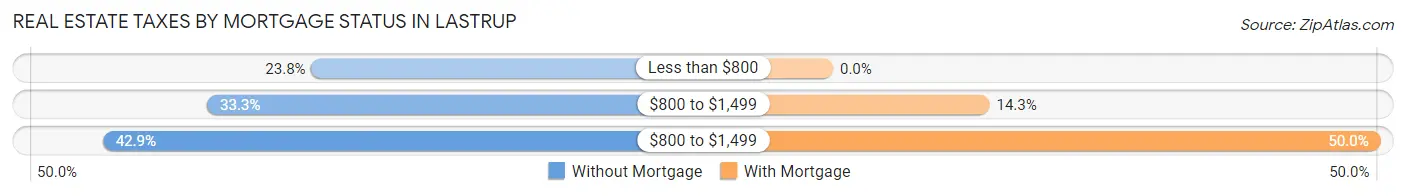
| Property Taxes | Without Mortgage | With Mortgage |
| Less than $800 | 5 (23.8%) | 0 (0.0%) |
| $800 to $1,499 | 7 (33.3%) | 2 (14.3%) |
| $800 to $1,499 | 9 (42.9%) | 7 (50.0%) |
| Total | 21 (100.0%) | 14 (100.0%) |
Health & Disability in Lastrup
Health Insurance Coverage by Age in Lastrup
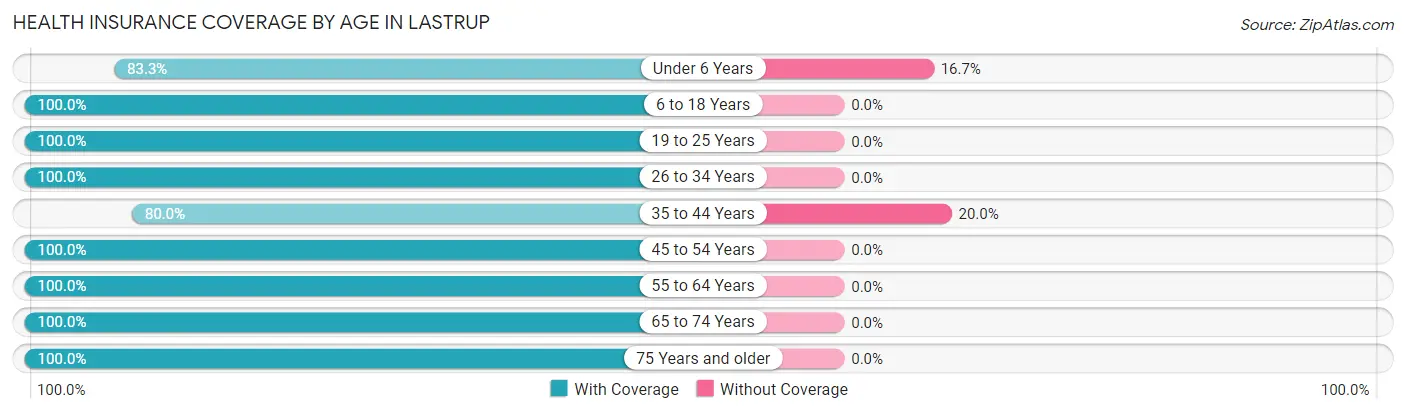
| Age Bracket | With Coverage | Without Coverage |
| Under 6 Years | 5 (83.3%) | 1 (16.7%) |
| 6 to 18 Years | 10 (100.0%) | 0 (0.0%) |
| 19 to 25 Years | 5 (100.0%) | 0 (0.0%) |
| 26 to 34 Years | 9 (100.0%) | 0 (0.0%) |
| 35 to 44 Years | 8 (80.0%) | 2 (20.0%) |
| 45 to 54 Years | 12 (100.0%) | 0 (0.0%) |
| 55 to 64 Years | 15 (100.0%) | 0 (0.0%) |
| 65 to 74 Years | 24 (100.0%) | 0 (0.0%) |
| 75 Years and older | 7 (100.0%) | 0 (0.0%) |
| Total | 95 (96.9%) | 3 (3.1%) |
Health Insurance Coverage by Citizenship Status in Lastrup
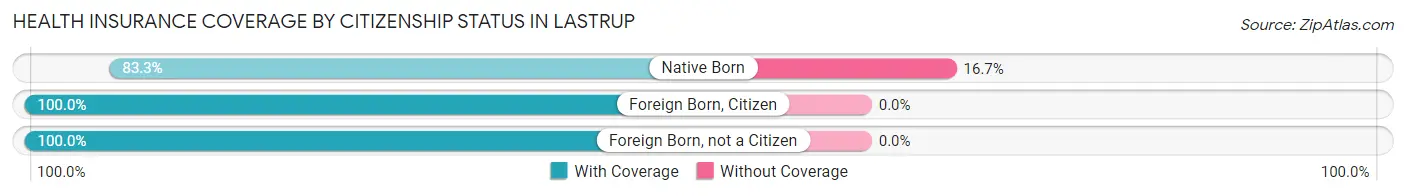
| Citizenship Status | With Coverage | Without Coverage |
| Native Born | 5 (83.3%) | 1 (16.7%) |
| Foreign Born, Citizen | 10 (100.0%) | 0 (0.0%) |
| Foreign Born, not a Citizen | 5 (100.0%) | 0 (0.0%) |
Health Insurance Coverage by Household Income in Lastrup
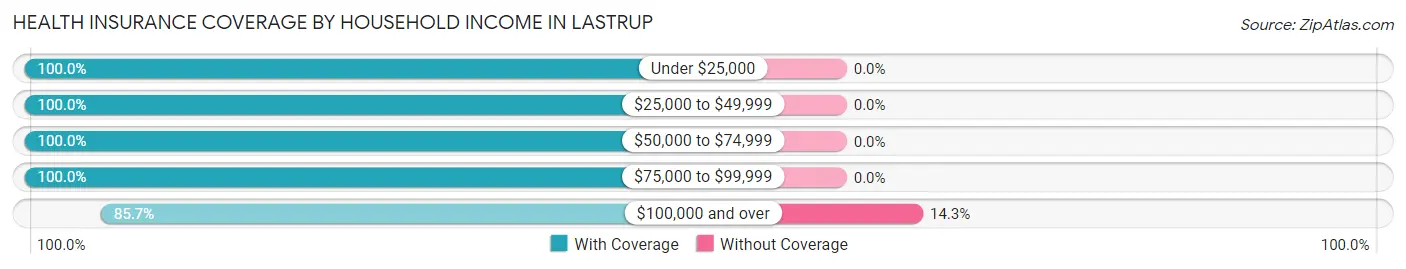
| Household Income | With Coverage | Without Coverage |
| Under $25,000 | 12 (100.0%) | 0 (0.0%) |
| $25,000 to $49,999 | 32 (100.0%) | 0 (0.0%) |
| $50,000 to $74,999 | 23 (100.0%) | 0 (0.0%) |
| $75,000 to $99,999 | 10 (100.0%) | 0 (0.0%) |
| $100,000 and over | 18 (85.7%) | 3 (14.3%) |
Public vs Private Health Insurance Coverage by Age in Lastrup
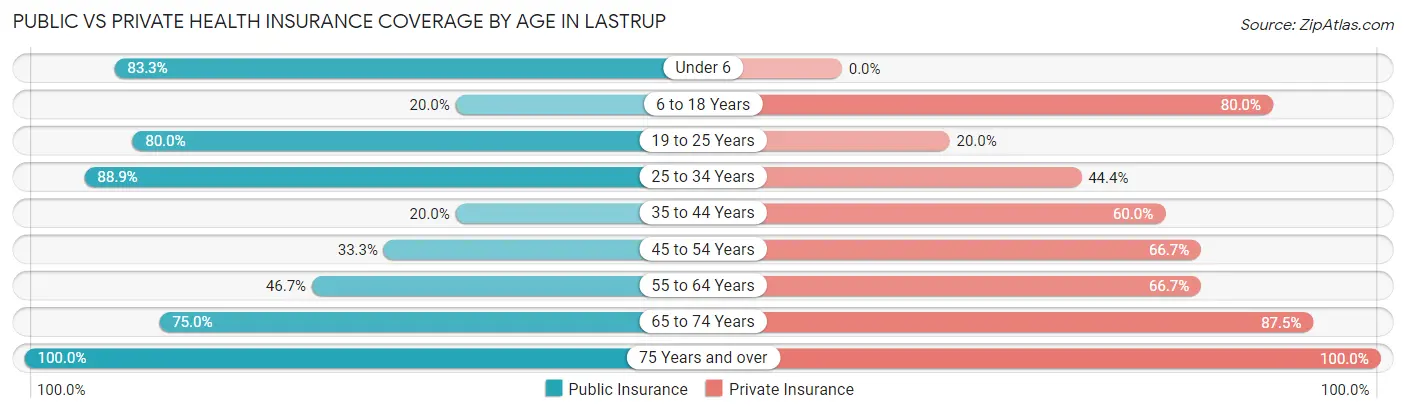
| Age Bracket | Public Insurance | Private Insurance |
| Under 6 | 5 (83.3%) | 0 (0.0%) |
| 6 to 18 Years | 2 (20.0%) | 8 (80.0%) |
| 19 to 25 Years | 4 (80.0%) | 1 (20.0%) |
| 25 to 34 Years | 8 (88.9%) | 4 (44.4%) |
| 35 to 44 Years | 2 (20.0%) | 6 (60.0%) |
| 45 to 54 Years | 4 (33.3%) | 8 (66.7%) |
| 55 to 64 Years | 7 (46.7%) | 10 (66.7%) |
| 65 to 74 Years | 18 (75.0%) | 21 (87.5%) |
| 75 Years and over | 7 (100.0%) | 7 (100.0%) |
| Total | 57 (58.2%) | 65 (66.3%) |
Disability Status by Sex by Age in Lastrup
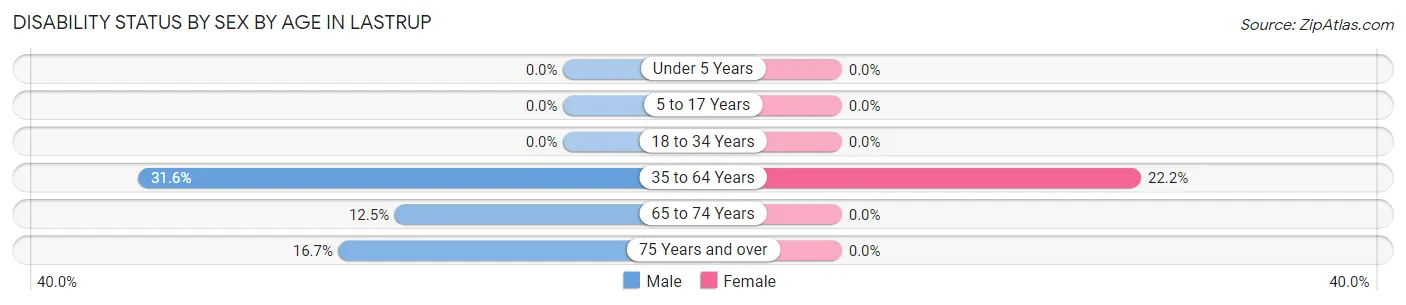
| Age Bracket | Male | Female |
| Under 5 Years | 0 (0.0%) | 0 (0.0%) |
| 5 to 17 Years | 0 (0.0%) | 0 (0.0%) |
| 18 to 34 Years | 0 (0.0%) | 0 (0.0%) |
| 35 to 64 Years | 6 (31.6%) | 4 (22.2%) |
| 65 to 74 Years | 2 (12.5%) | 0 (0.0%) |
| 75 Years and over | 1 (16.7%) | 0 (0.0%) |
Disability Class by Sex by Age in Lastrup
Disability Class: Hearing Difficulty
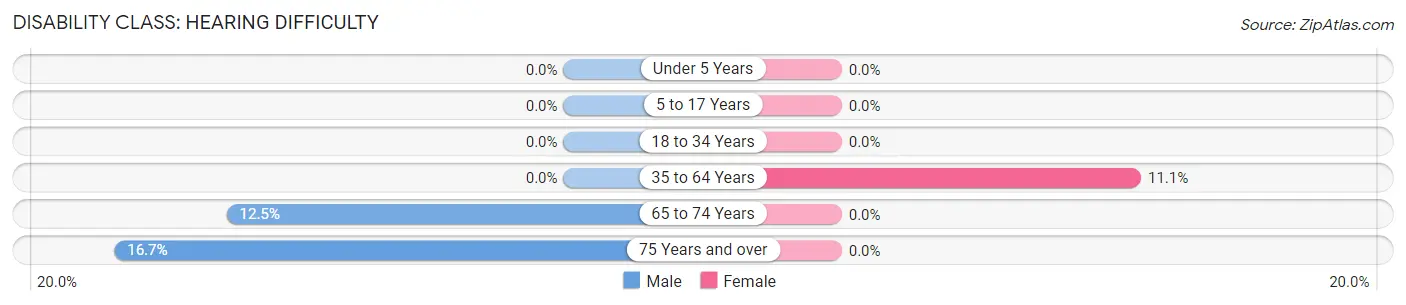
| Age Bracket | Male | Female |
| Under 5 Years | 0 (0.0%) | 0 (0.0%) |
| 5 to 17 Years | 0 (0.0%) | 0 (0.0%) |
| 18 to 34 Years | 0 (0.0%) | 0 (0.0%) |
| 35 to 64 Years | 0 (0.0%) | 2 (11.1%) |
| 65 to 74 Years | 2 (12.5%) | 0 (0.0%) |
| 75 Years and over | 1 (16.7%) | 0 (0.0%) |
Disability Class: Vision Difficulty
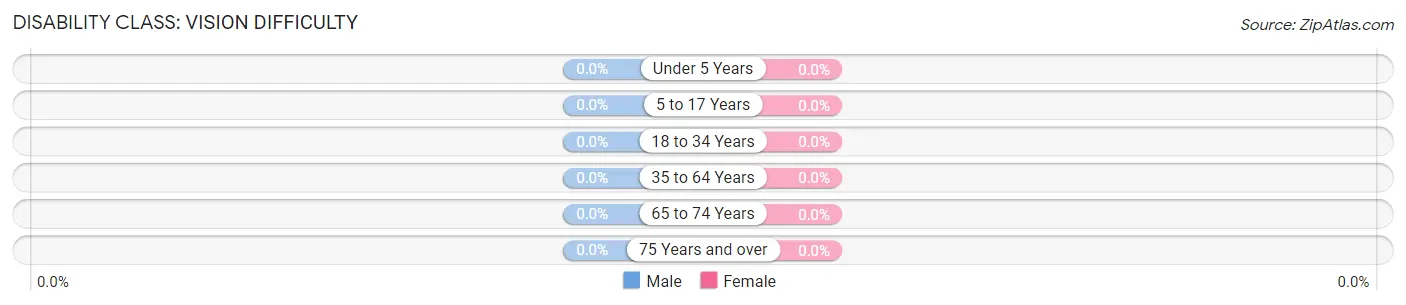
| Age Bracket | Male | Female |
| Under 5 Years | 0 (0.0%) | 0 (0.0%) |
| 5 to 17 Years | 0 (0.0%) | 0 (0.0%) |
| 18 to 34 Years | 0 (0.0%) | 0 (0.0%) |
| 35 to 64 Years | 0 (0.0%) | 0 (0.0%) |
| 65 to 74 Years | 0 (0.0%) | 0 (0.0%) |
| 75 Years and over | 0 (0.0%) | 0 (0.0%) |
Disability Class: Cognitive Difficulty
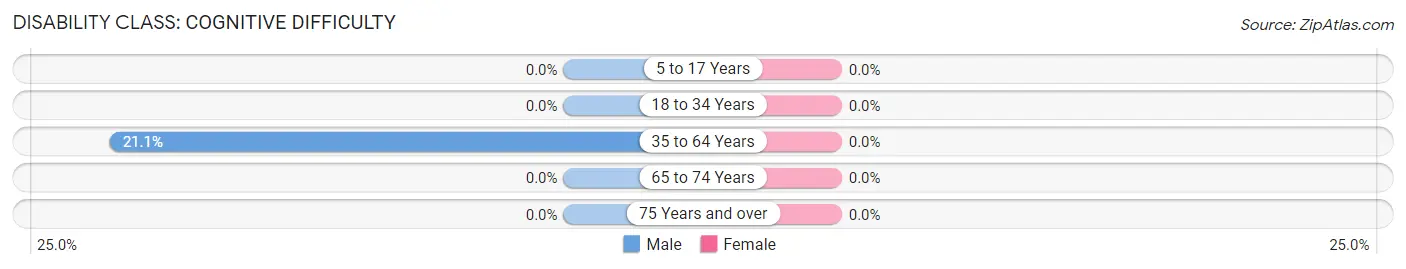
| Age Bracket | Male | Female |
| 5 to 17 Years | 0 (0.0%) | 0 (0.0%) |
| 18 to 34 Years | 0 (0.0%) | 0 (0.0%) |
| 35 to 64 Years | 4 (21.0%) | 0 (0.0%) |
| 65 to 74 Years | 0 (0.0%) | 0 (0.0%) |
| 75 Years and over | 0 (0.0%) | 0 (0.0%) |
Disability Class: Ambulatory Difficulty
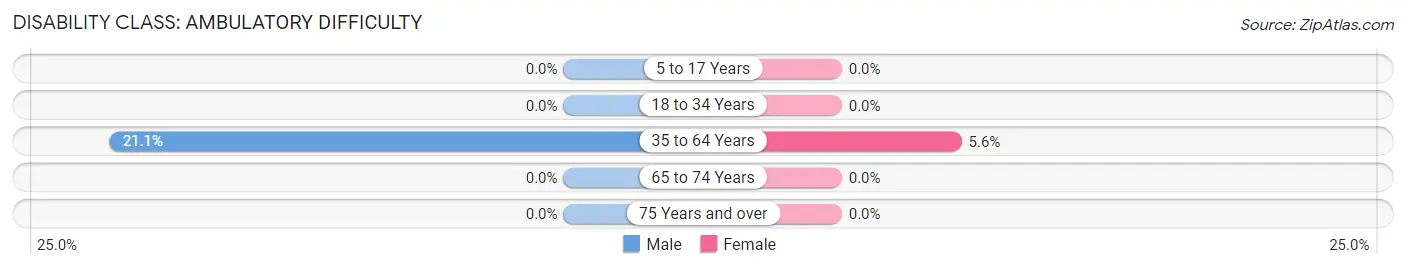
| Age Bracket | Male | Female |
| 5 to 17 Years | 0 (0.0%) | 0 (0.0%) |
| 18 to 34 Years | 0 (0.0%) | 0 (0.0%) |
| 35 to 64 Years | 4 (21.0%) | 1 (5.6%) |
| 65 to 74 Years | 0 (0.0%) | 0 (0.0%) |
| 75 Years and over | 0 (0.0%) | 0 (0.0%) |
Disability Class: Self-Care Difficulty
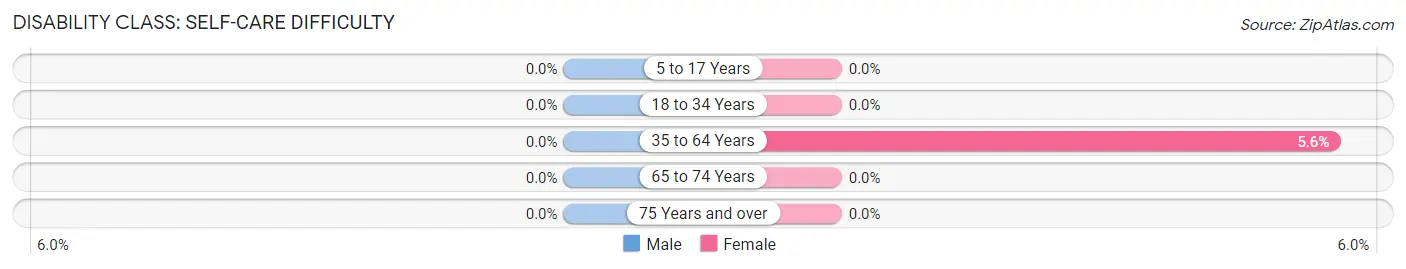
| Age Bracket | Male | Female |
| 5 to 17 Years | 0 (0.0%) | 0 (0.0%) |
| 18 to 34 Years | 0 (0.0%) | 0 (0.0%) |
| 35 to 64 Years | 0 (0.0%) | 1 (5.6%) |
| 65 to 74 Years | 0 (0.0%) | 0 (0.0%) |
| 75 Years and over | 0 (0.0%) | 0 (0.0%) |
Technology Access in Lastrup
Computing Device Access in Lastrup
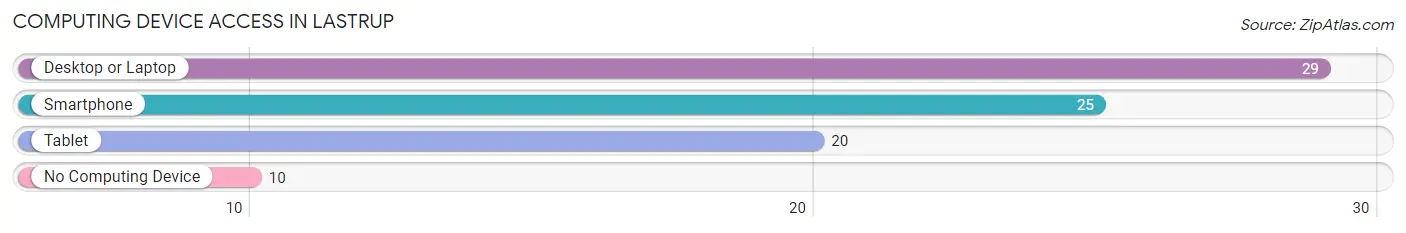
| Device Type | # Households | % Households |
| Desktop or Laptop | 29 | 65.9% |
| Smartphone | 25 | 56.8% |
| Tablet | 20 | 45.5% |
| No Computing Device | 10 | 22.7% |
| Total | 44 | 100.0% |
Internet Access in Lastrup
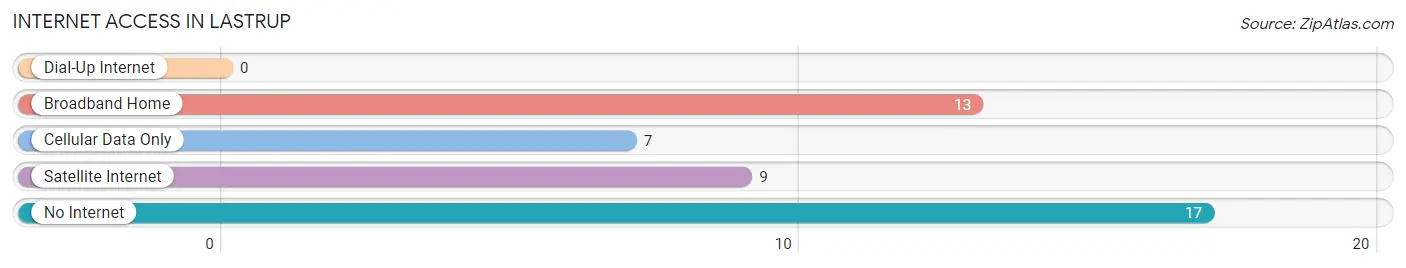
| Internet Type | # Households | % Households |
| Dial-Up Internet | 0 | 0.0% |
| Broadband Home | 13 | 29.5% |
| Cellular Data Only | 7 | 15.9% |
| Satellite Internet | 9 | 20.4% |
| No Internet | 17 | 38.6% |
| Total | 44 | 100.0% |
Lastrup Summary
Lastrup is a small unincorporated community located in Morrison County, Minnesota, United States. It is situated along the Platte River, approximately 10 miles northwest of Little Falls. The population of Lastrup was estimated to be around 200 in 2000.
History
The area around Lastrup was first settled in the late 1800s by German and Bohemian immigrants. The town was originally known as “Platte”, but was later changed to Lastrup in honor of the Lastrup family, who were among the first settlers. The Lastrup family owned a large amount of land in the area and were instrumental in the development of the town.
The first post office in Lastrup was established in 1892. The town was officially incorporated in 1895. In the early 1900s, Lastrup was a thriving community with a variety of businesses, including a general store, a blacksmith shop, a hotel, a saloon, and a sawmill.
Geography
Lastrup is located in central Minnesota, approximately 10 miles northwest of Little Falls. The Platte River runs through the town, and the surrounding area is mostly flat and heavily forested. The town is located in the Central Lakes region of Minnesota, and is part of the Little Falls Micropolitan Statistical Area.
Economy
The economy of Lastrup is largely based on agriculture and tourism. The town is home to several small farms, and the surrounding area is known for its production of potatoes, corn, and other crops. The town also has a few small businesses, including a gas station, a restaurant, and a grocery store.
Tourism is an important part of the local economy, as the town is located near several popular recreational areas, including the Platte River State Park and the Charles A. Lindbergh State Park. The town also hosts several annual events, such as the Lastrup Potato Festival and the Lastrup Summer Festival.
Demographics
As of the 2000 census, the population of Lastrup was estimated to be around 200. The racial makeup of the town was 97.5% White, 0.5% African American, 0.5% Native American, and 1.5% from other races. The median household income was $37,500, and the median family income was $41,250.
Conclusion
Lastrup is a small unincorporated community located in Morrison County, Minnesota. It was first settled in the late 1800s by German and Bohemian immigrants, and was officially incorporated in 1895. The town is largely based on agriculture and tourism, and the population was estimated to be around 200 in 2000. Lastrup is located near several popular recreational areas, and hosts several annual events, making it a popular destination for tourists.
Common Questions
What is Per Capita Income in Lastrup?
Per Capita income in Lastrup is $29,242.
What is the Median Family Income in Lastrup?
Median Family Income in Lastrup is $59,375.
What is the Median Household income in Lastrup?
Median Household Income in Lastrup is $55,000.
What is Inequality or Gini Index in Lastrup?
Inequality or Gini Index in Lastrup is 0.27.
What is the Total Population of Lastrup?
Total Population of Lastrup is 98.
What is the Total Male Population of Lastrup?
Total Male Population of Lastrup is 58.
What is the Total Female Population of Lastrup?
Total Female Population of Lastrup is 40.
What is the Ratio of Males per 100 Females in Lastrup?
There are 145.00 Males per 100 Females in Lastrup.
What is the Ratio of Females per 100 Males in Lastrup?
There are 68.97 Females per 100 Males in Lastrup.
What is the Median Population Age in Lastrup?
Median Population Age in Lastrup is 51.8 Years.
What is the Average Family Size in Lastrup
Average Family Size in Lastrup is 2.6 People.
What is the Average Household Size in Lastrup
Average Household Size in Lastrup is 2.2 People.
How Large is the Labor Force in Lastrup?
There are 57 People in the Labor Forcein in Lastrup.
What is the Percentage of People in the Labor Force in Lastrup?
65.5% of People are in the Labor Force in Lastrup.
What is the Unemployment Rate in Lastrup?
Unemployment Rate in Lastrup is 7.0%.