Le Sueur, MN Map & Demographics
Le Sueur Map
Le Sueur Overview
$35,484
PER CAPITA INCOME
$101,875
AVG FAMILY INCOME
$68,750
AVG HOUSEHOLD INCOME
52.9%
WAGE / INCOME GAP [ % ]
47.1¢/ $1
WAGE / INCOME GAP [ $ ]
0.38
INEQUALITY / GINI INDEX
4,210
TOTAL POPULATION
2,009
MALE POPULATION
2,201
FEMALE POPULATION
91.28
MALES / 100 FEMALES
109.56
FEMALES / 100 MALES
38.4
MEDIAN AGE
2.9
AVG FAMILY SIZE
2.3
AVG HOUSEHOLD SIZE
2,294
LABOR FORCE [ PEOPLE ]
70.1%
PERCENT IN LABOR FORCE
0.3%
UNEMPLOYMENT RATE
Le Sueur Zip Codes
Le Sueur Area Codes
Income in Le Sueur
Income Overview in Le Sueur
Per Capita Income in Le Sueur is $35,484, while median incomes of families and households are $101,875 and $68,750 respectively.
| Characteristic | Number | Measure |
| Per Capita Income | 4,210 | $35,484 |
| Median Family Income | 1,148 | $101,875 |
| Mean Family Income | 1,148 | $98,736 |
| Median Household Income | 1,812 | $68,750 |
| Mean Household Income | 1,812 | $78,907 |
| Income Deficit | 1,148 | $0 |
| Wage / Income Gap (%) | 4,210 | 52.93% |
| Wage / Income Gap ($) | 4,210 | 47.07¢ per $1 |
| Gini / Inequality Index | 4,210 | 0.38 |
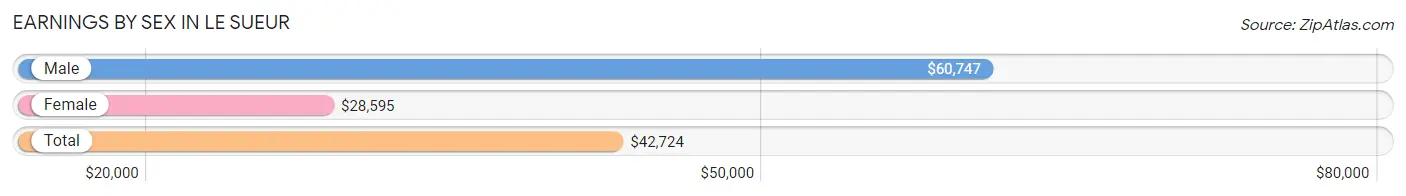
Earnings by Sex in Le Sueur
Average Earnings in Le Sueur are $42,724, $60,747 for men and $28,595 for women, a difference of 52.9%.
| Sex | Number | Average Earnings |
| Male | 1,160 (46.9%) | $60,747 |
| Female | 1,315 (53.1%) | $28,595 |
| Total | 2,475 (100.0%) | $42,724 |
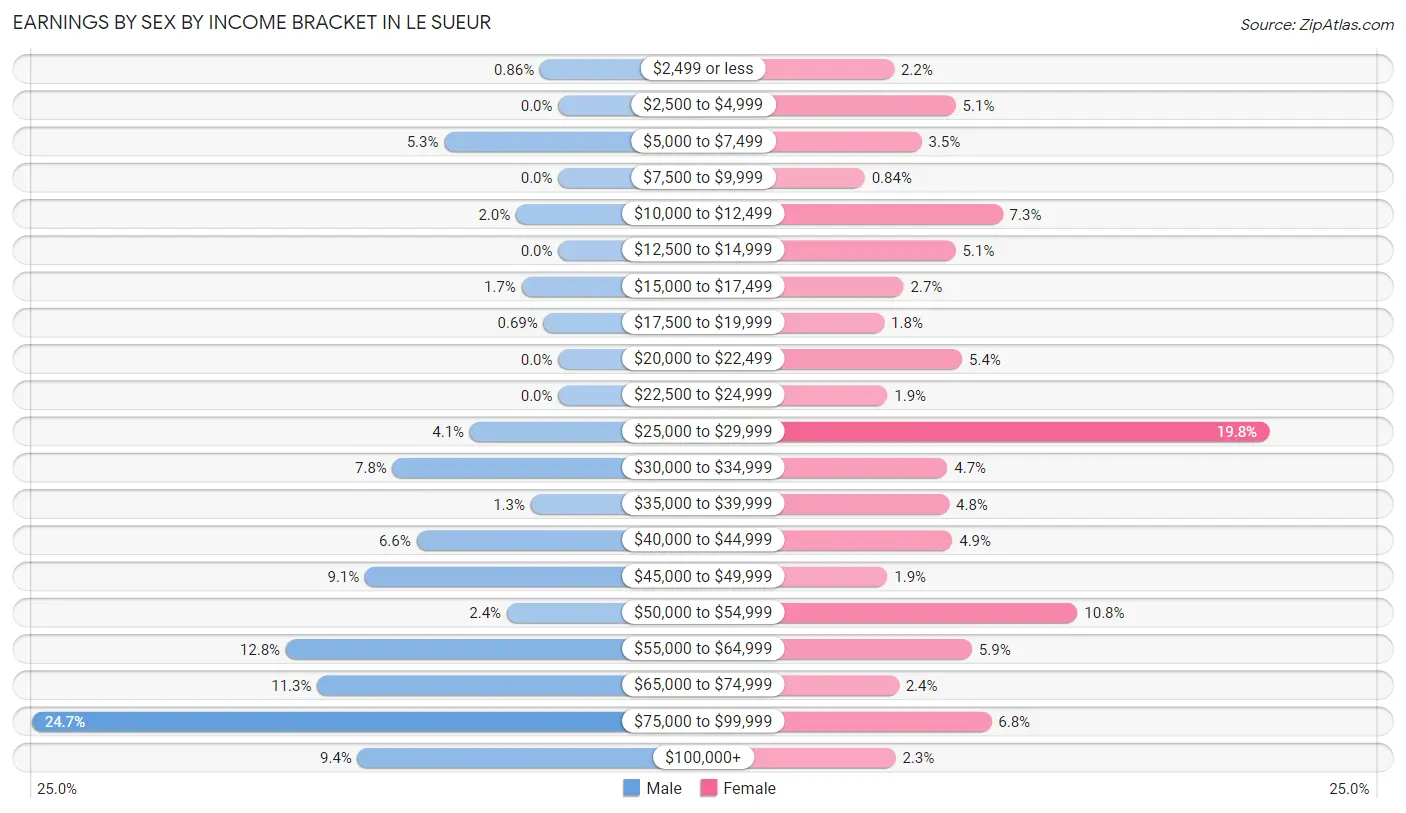
Earnings by Sex by Income Bracket in Le Sueur
The most common earnings brackets in Le Sueur are $75,000 to $99,999 for men (286 | 24.7%) and $25,000 to $29,999 for women (260 | 19.8%).
| Income | Male | Female |
| $2,499 or less | 10 (0.9%) | 29 (2.2%) |
| $2,500 to $4,999 | 0 (0.0%) | 67 (5.1%) |
| $5,000 to $7,499 | 62 (5.3%) | 46 (3.5%) |
| $7,500 to $9,999 | 0 (0.0%) | 11 (0.8%) |
| $10,000 to $12,499 | 23 (2.0%) | 96 (7.3%) |
| $12,500 to $14,999 | 0 (0.0%) | 67 (5.1%) |
| $15,000 to $17,499 | 20 (1.7%) | 35 (2.7%) |
| $17,500 to $19,999 | 8 (0.7%) | 23 (1.8%) |
| $20,000 to $22,499 | 0 (0.0%) | 71 (5.4%) |
| $22,500 to $24,999 | 0 (0.0%) | 25 (1.9%) |
| $25,000 to $29,999 | 48 (4.1%) | 260 (19.8%) |
| $30,000 to $34,999 | 90 (7.8%) | 62 (4.7%) |
| $35,000 to $39,999 | 15 (1.3%) | 63 (4.8%) |
| $40,000 to $44,999 | 77 (6.6%) | 65 (4.9%) |
| $45,000 to $49,999 | 105 (9.0%) | 25 (1.9%) |
| $50,000 to $54,999 | 28 (2.4%) | 142 (10.8%) |
| $55,000 to $64,999 | 148 (12.8%) | 77 (5.9%) |
| $65,000 to $74,999 | 131 (11.3%) | 32 (2.4%) |
| $75,000 to $99,999 | 286 (24.7%) | 89 (6.8%) |
| $100,000+ | 109 (9.4%) | 30 (2.3%) |
| Total | 1,160 (100.0%) | 1,315 (100.0%) |
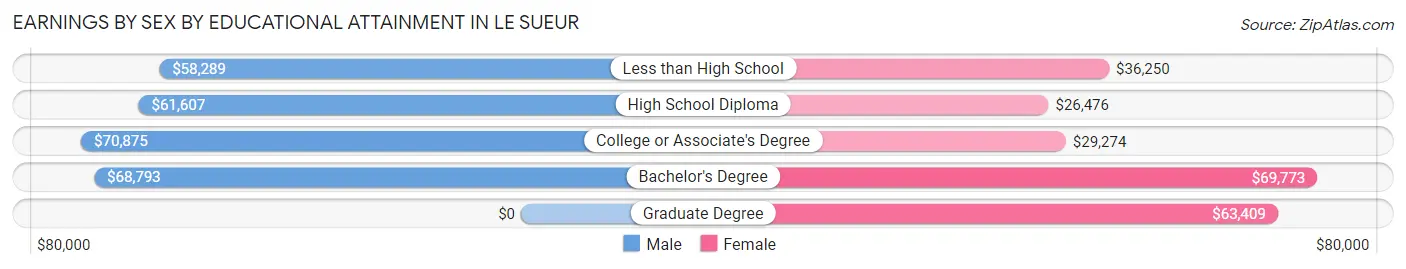
Earnings by Sex by Educational Attainment in Le Sueur
Average earnings in Le Sueur are $62,354 for men and $33,438 for women, a difference of 46.4%. Men with an educational attainment of college or associate's degree enjoy the highest average annual earnings of $70,875, while those with less than high school education earn the least with $58,289. Women with an educational attainment of bachelor's degree earn the most with the average annual earnings of $69,773, while those with high school diploma education have the smallest earnings of $26,476.
| Educational Attainment | Male Income | Female Income |
| Less than High School | $58,289 | $36,250 |
| High School Diploma | $61,607 | $26,476 |
| College or Associate's Degree | $70,875 | $29,274 |
| Bachelor's Degree | $68,793 | $69,773 |
| Graduate Degree | - | - |
| Total | $62,354 | $33,438 |
Family Income in Le Sueur
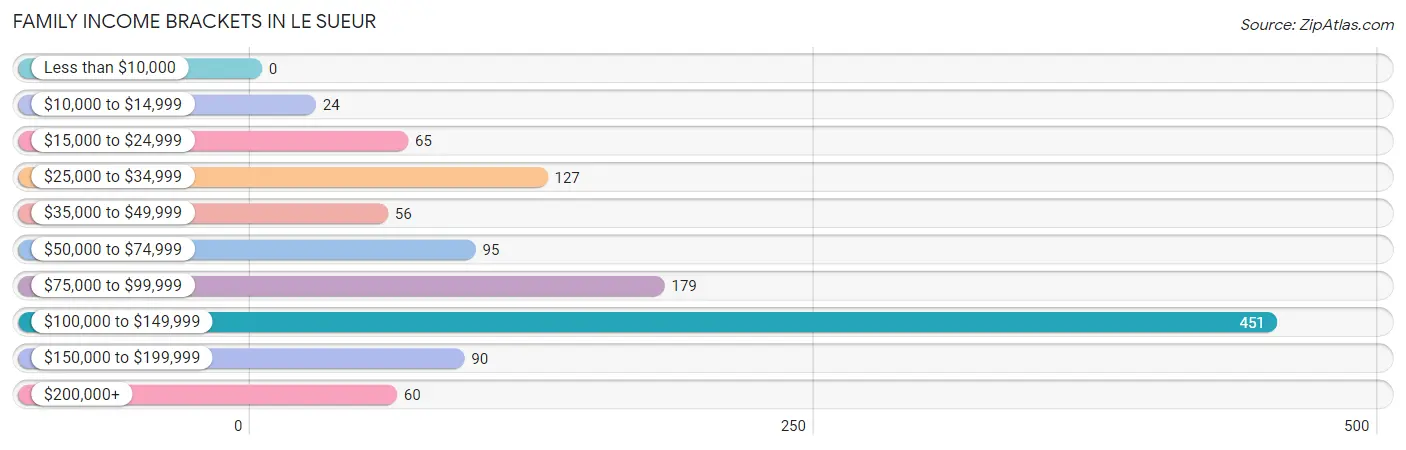
Family Income Brackets in Le Sueur
According to the Le Sueur family income data, there are 451 families falling into the $100,000 to $149,999 income range, which is the most common income bracket and makes up 39.3% of all families.
| Income Bracket | # Families | % Families |
| Less than $10,000 | 0 | 0.0% |
| $10,000 to $14,999 | 24 | 2.1% |
| $15,000 to $24,999 | 65 | 5.7% |
| $25,000 to $34,999 | 127 | 11.1% |
| $35,000 to $49,999 | 56 | 4.9% |
| $50,000 to $74,999 | 95 | 8.3% |
| $75,000 to $99,999 | 179 | 15.6% |
| $100,000 to $149,999 | 451 | 39.3% |
| $150,000 to $199,999 | 90 | 7.8% |
| $200,000+ | 60 | 5.2% |
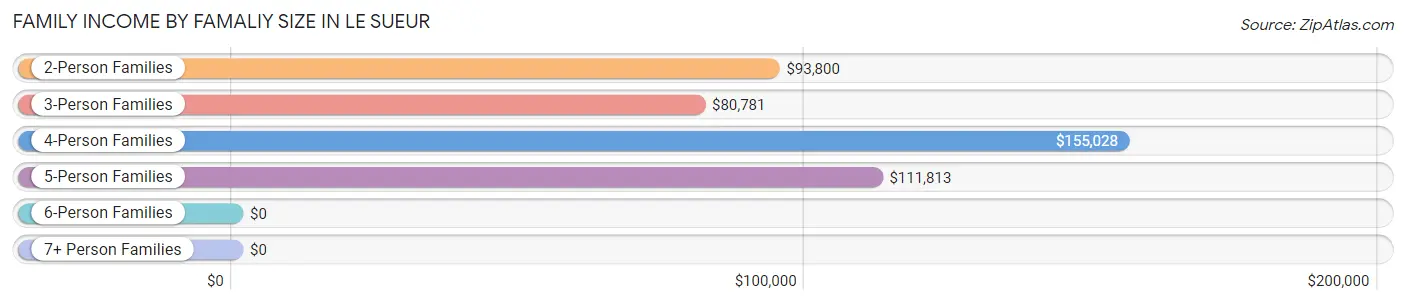
Family Income by Famaliy Size in Le Sueur
4-person families (199 | 17.3%) account for the highest median family income in Le Sueur with $155,028 per family, while 2-person families (574 | 50.0%) have the highest median income of $46,900 per family member.
| Income Bracket | # Families | Median Income |
| 2-Person Families | 574 (50.0%) | $93,800 |
| 3-Person Families | 201 (17.5%) | $80,781 |
| 4-Person Families | 199 (17.3%) | $155,028 |
| 5-Person Families | 174 (15.2%) | $111,813 |
| 6-Person Families | 0 (0.0%) | $0 |
| 7+ Person Families | 0 (0.0%) | $0 |
| Total | 1,148 (100.0%) | $101,875 |
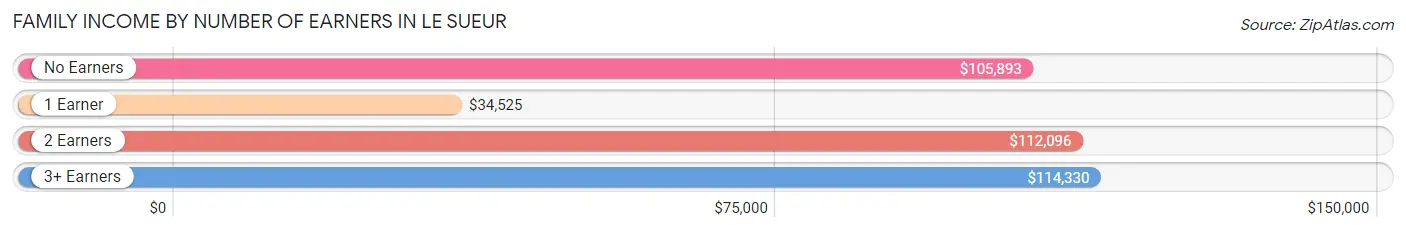
Family Income by Number of Earners in Le Sueur
The median family income in Le Sueur is $101,875, with families comprising 3+ earners (144) having the highest median family income of $114,330, while families with 1 earner (349) have the lowest median family income of $34,525, accounting for 12.5% and 30.4% of families, respectively.
| Number of Earners | # Families | Median Income |
| No Earners | 143 (12.5%) | $105,893 |
| 1 Earner | 349 (30.4%) | $34,525 |
| 2 Earners | 512 (44.6%) | $112,096 |
| 3+ Earners | 144 (12.5%) | $114,330 |
| Total | 1,148 (100.0%) | $101,875 |
Household Income in Le Sueur
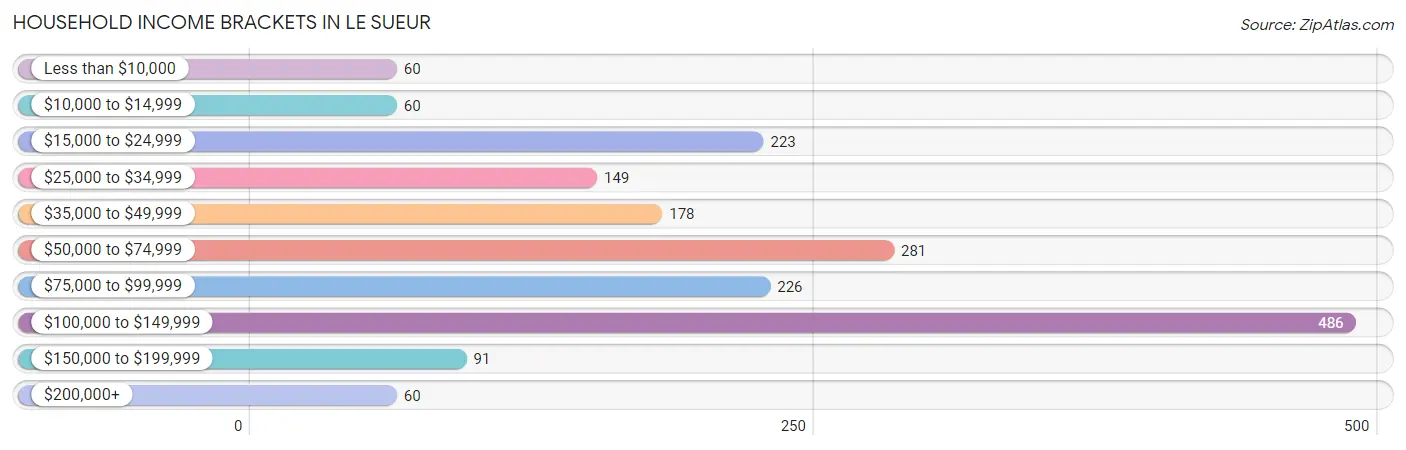
Household Income Brackets in Le Sueur
With 486 households falling in the category, the $100,000 to $149,999 income range is the most frequent in Le Sueur, accounting for 26.8% of all households. In contrast, only 60 households (3.3%) fall into the less than $10,000 income bracket, making it the least populous group.
| Income Bracket | # Households | % Households |
| Less than $10,000 | 60 | 3.3% |
| $10,000 to $14,999 | 60 | 3.3% |
| $15,000 to $24,999 | 223 | 12.3% |
| $25,000 to $34,999 | 149 | 8.2% |
| $35,000 to $49,999 | 178 | 9.8% |
| $50,000 to $74,999 | 281 | 15.5% |
| $75,000 to $99,999 | 226 | 12.5% |
| $100,000 to $149,999 | 486 | 26.8% |
| $150,000 to $199,999 | 91 | 5.0% |
| $200,000+ | 60 | 3.3% |
Household Income by Householder Age in Le Sueur
The median household income in Le Sueur is $68,750, with the highest median household income of $90,391 found in the 45 to 64 years age bracket for the primary householder. A total of 549 households (30.3%) fall into this category. Meanwhile, the 15 to 24 years age bracket for the primary householder has the lowest median household income of $0, with 86 households (4.8%) in this group.
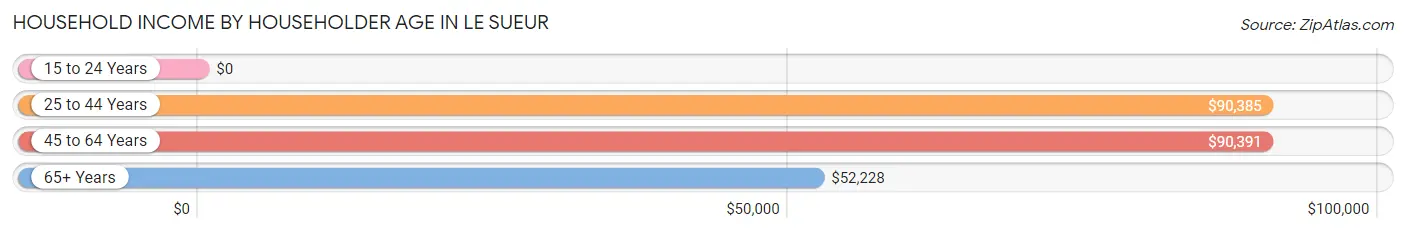
| Income Bracket | # Households | Median Income |
| 15 to 24 Years | 86 (4.8%) | $0 |
| 25 to 44 Years | 656 (36.2%) | $90,385 |
| 45 to 64 Years | 549 (30.3%) | $90,391 |
| 65+ Years | 521 (28.7%) | $52,228 |
| Total | 1,812 (100.0%) | $68,750 |
Poverty in Le Sueur
Income Below Poverty by Sex and Age in Le Sueur
With 10.0% poverty level for males and 17.5% for females among the residents of Le Sueur, 12 to 14 year old males and under 5 year old females are the most vulnerable to poverty, with 83 males (65.9%) and 68 females (54.4%) in their respective age groups living below the poverty level.
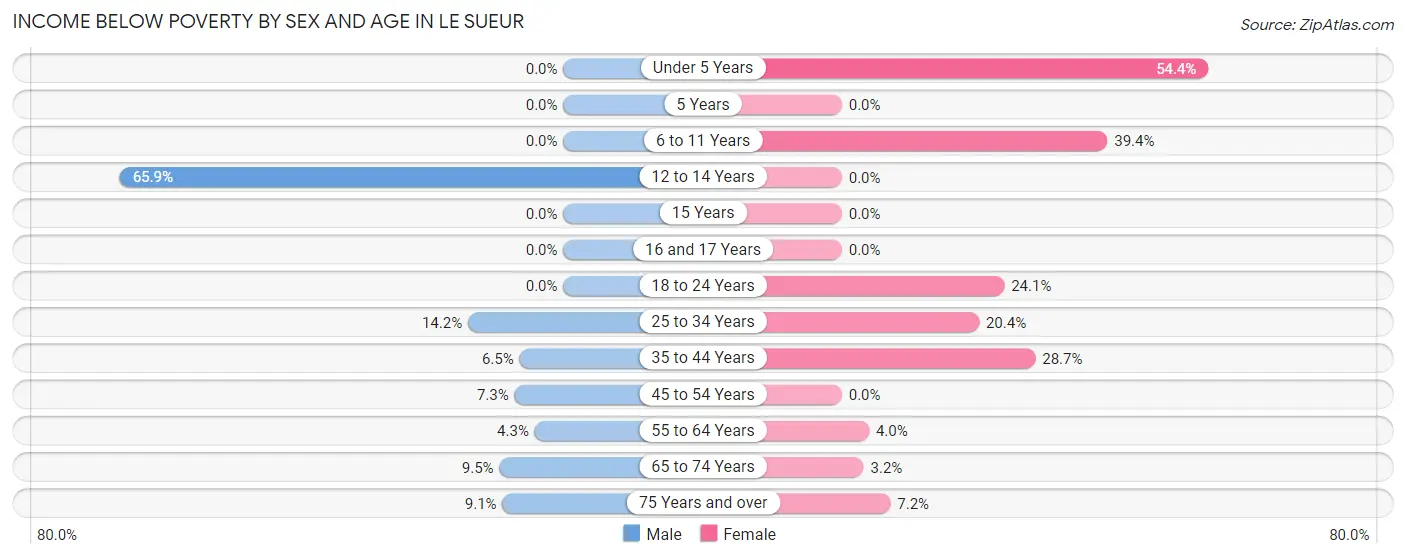
| Age Bracket | Male | Female |
| Under 5 Years | 0 (0.0%) | 68 (54.4%) |
| 5 Years | 0 (0.0%) | 0 (0.0%) |
| 6 to 11 Years | 0 (0.0%) | 82 (39.4%) |
| 12 to 14 Years | 83 (65.9%) | 0 (0.0%) |
| 15 Years | 0 (0.0%) | 0 (0.0%) |
| 16 and 17 Years | 0 (0.0%) | 0 (0.0%) |
| 18 to 24 Years | 0 (0.0%) | 48 (24.1%) |
| 25 to 34 Years | 33 (14.2%) | 66 (20.4%) |
| 35 to 44 Years | 17 (6.5%) | 79 (28.7%) |
| 45 to 54 Years | 19 (7.2%) | 0 (0.0%) |
| 55 to 64 Years | 11 (4.3%) | 10 (4.0%) |
| 65 to 74 Years | 15 (9.5%) | 6 (3.2%) |
| 75 Years and over | 20 (9.0%) | 15 (7.2%) |
| Total | 198 (10.0%) | 374 (17.5%) |
Income Above Poverty by Sex and Age in Le Sueur
According to the poverty statistics in Le Sueur, males aged under 5 years and females aged 5 years are the age groups that are most secure financially, with 100.0% of males and 100.0% of females in these age groups living above the poverty line.
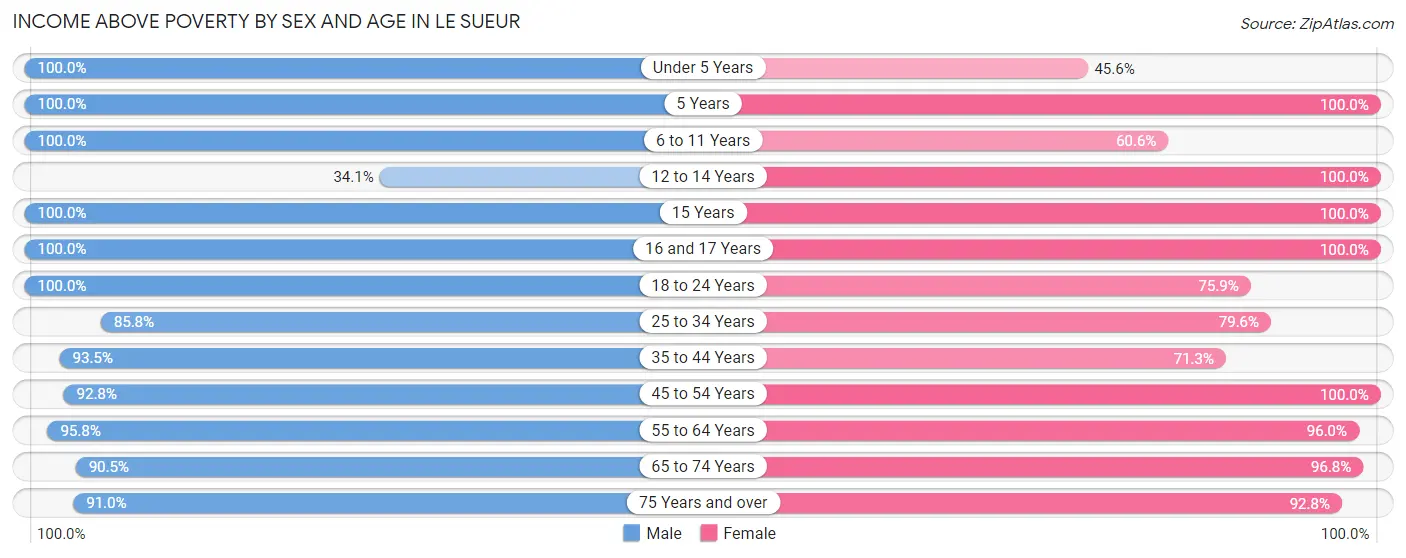
| Age Bracket | Male | Female |
| Under 5 Years | 181 (100.0%) | 57 (45.6%) |
| 5 Years | 38 (100.0%) | 38 (100.0%) |
| 6 to 11 Years | 85 (100.0%) | 126 (60.6%) |
| 12 to 14 Years | 43 (34.1%) | 51 (100.0%) |
| 15 Years | 35 (100.0%) | 44 (100.0%) |
| 16 and 17 Years | 25 (100.0%) | 25 (100.0%) |
| 18 to 24 Years | 99 (100.0%) | 151 (75.9%) |
| 25 to 34 Years | 200 (85.8%) | 258 (79.6%) |
| 35 to 44 Years | 244 (93.5%) | 196 (71.3%) |
| 45 to 54 Years | 243 (92.7%) | 203 (100.0%) |
| 55 to 64 Years | 248 (95.8%) | 238 (96.0%) |
| 65 to 74 Years | 143 (90.5%) | 179 (96.8%) |
| 75 Years and over | 201 (90.9%) | 193 (92.8%) |
| Total | 1,785 (90.0%) | 1,759 (82.5%) |
Income Below Poverty Among Married-Couple Families in Le Sueur
The poverty statistics for married-couple families in Le Sueur show that 1.4% or 12 of the total 852 families live below the poverty line. Families with no children have the highest poverty rate of 2.3%, comprising of 12 families. On the other hand, families with 1 or 2 children have the lowest poverty rate of 0.0%, which includes 0 families.
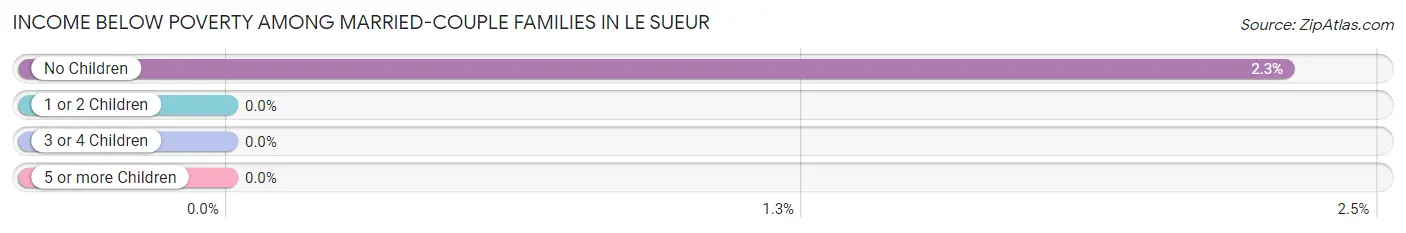
| Children | Above Poverty | Below Poverty |
| No Children | 510 (97.7%) | 12 (2.3%) |
| 1 or 2 Children | 230 (100.0%) | 0 (0.0%) |
| 3 or 4 Children | 100 (100.0%) | 0 (0.0%) |
| 5 or more Children | 0 (0.0%) | 0 (0.0%) |
| Total | 840 (98.6%) | 12 (1.4%) |
Income Below Poverty Among Single-Parent Households in Le Sueur
According to the poverty data in Le Sueur, 23.1% or 12 single-father households and 47.5% or 116 single-mother households are living below the poverty line. Among single-father households, those with 1 or 2 children have the highest poverty rate, with 12 households (100.0%) experiencing poverty. Likewise, among single-mother households, those with 3 or 4 children have the highest poverty rate, with 59 households (76.6%) falling below the poverty line.
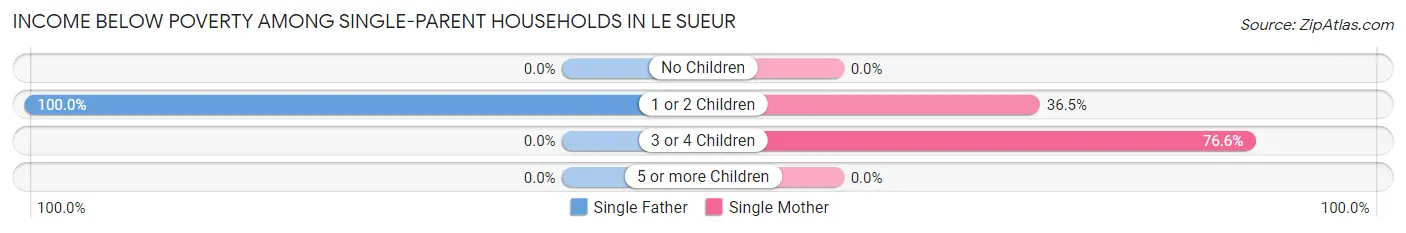
| Children | Single Father | Single Mother |
| No Children | 0 (0.0%) | 0 (0.0%) |
| 1 or 2 Children | 12 (100.0%) | 57 (36.5%) |
| 3 or 4 Children | 0 (0.0%) | 59 (76.6%) |
| 5 or more Children | 0 (0.0%) | 0 (0.0%) |
| Total | 12 (23.1%) | 116 (47.5%) |
Income Below Poverty Among Married-Couple vs Single-Parent Households in Le Sueur
The poverty data for Le Sueur shows that 12 of the married-couple family households (1.4%) and 128 of the single-parent households (43.2%) are living below the poverty level. Within the married-couple family households, those with no children have the highest poverty rate, with 12 households (2.3%) falling below the poverty line. Among the single-parent households, those with 3 or 4 children have the highest poverty rate, with 59 household (76.6%) living below poverty.
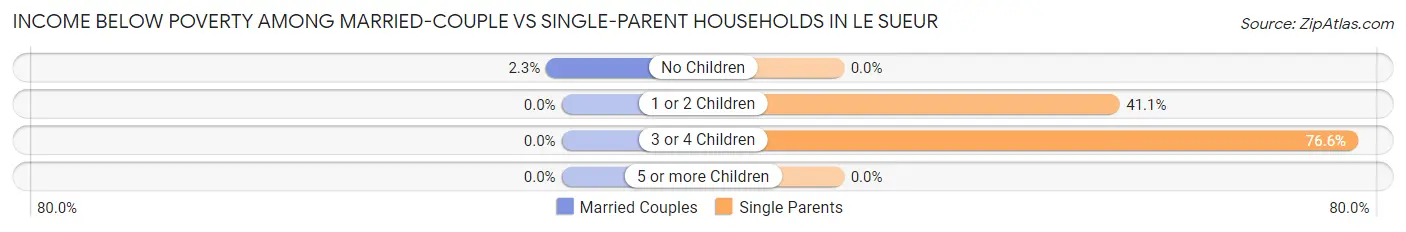
| Children | Married-Couple Families | Single-Parent Households |
| No Children | 12 (2.3%) | 0 (0.0%) |
| 1 or 2 Children | 0 (0.0%) | 69 (41.1%) |
| 3 or 4 Children | 0 (0.0%) | 59 (76.6%) |
| 5 or more Children | 0 (0.0%) | 0 (0.0%) |
| Total | 12 (1.4%) | 128 (43.2%) |
Race in Le Sueur
The most populous races in Le Sueur are White / Caucasian (3,458 | 82.1%), Hispanic or Latino (743 | 17.6%), and Some other Race (489 | 11.6%).
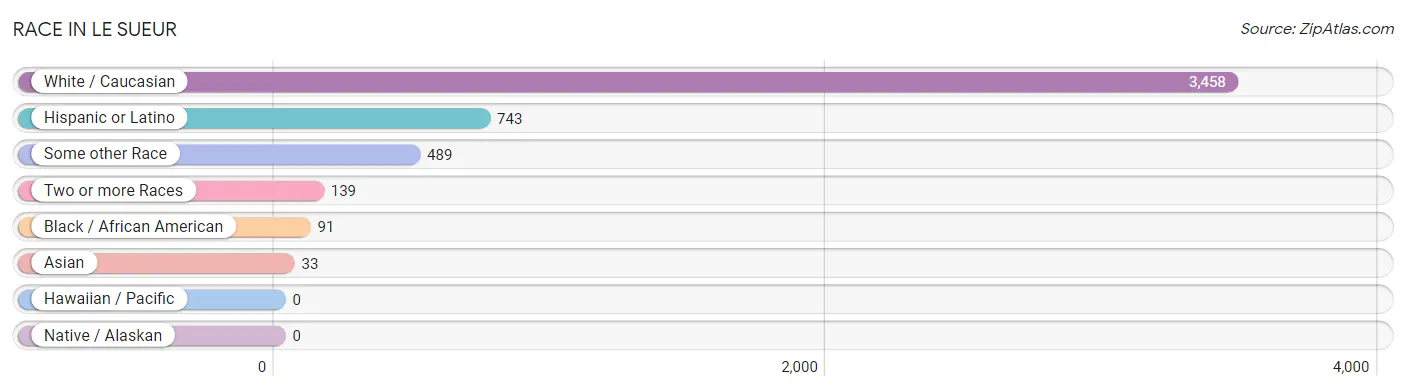
| Race | # Population | % Population |
| Asian | 33 | 0.8% |
| Black / African American | 91 | 2.2% |
| Hawaiian / Pacific | 0 | 0.0% |
| Hispanic or Latino | 743 | 17.6% |
| Native / Alaskan | 0 | 0.0% |
| White / Caucasian | 3,458 | 82.1% |
| Two or more Races | 139 | 3.3% |
| Some other Race | 489 | 11.6% |
| Total | 4,210 | 100.0% |
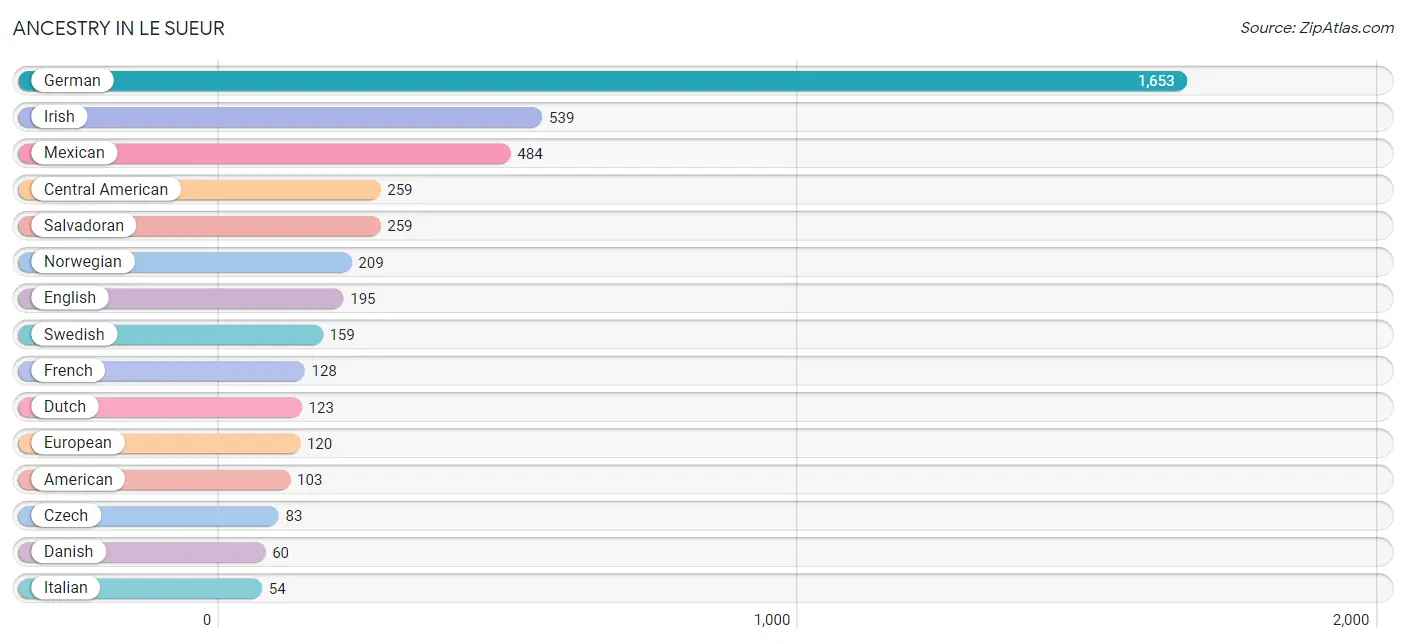
Ancestry in Le Sueur
The most populous ancestries reported in Le Sueur are German (1,653 | 39.3%), Irish (539 | 12.8%), Mexican (484 | 11.5%), Central American (259 | 6.1%), and Salvadoran (259 | 6.1%), together accounting for 75.9% of all Le Sueur residents.
| Ancestry | # Population | % Population |
| American | 103 | 2.5% |
| Arab | 9 | 0.2% |
| Austrian | 22 | 0.5% |
| Blackfeet | 15 | 0.4% |
| Burmese | 12 | 0.3% |
| Celtic | 14 | 0.3% |
| Central American | 259 | 6.1% |
| Chippewa | 4 | 0.1% |
| Czech | 83 | 2.0% |
| Danish | 60 | 1.4% |
| Dutch | 123 | 2.9% |
| English | 195 | 4.6% |
| European | 120 | 2.9% |
| Finnish | 23 | 0.5% |
| French | 128 | 3.0% |
| French Canadian | 32 | 0.8% |
| German | 1,653 | 39.3% |
| Irish | 539 | 12.8% |
| Italian | 54 | 1.3% |
| Korean | 21 | 0.5% |
| Lebanese | 9 | 0.2% |
| Mexican | 484 | 11.5% |
| Norwegian | 209 | 5.0% |
| Polish | 40 | 0.9% |
| Russian | 12 | 0.3% |
| Salvadoran | 259 | 6.1% |
| Scandinavian | 33 | 0.8% |
| Scotch-Irish | 10 | 0.2% |
| Scottish | 43 | 1.0% |
| Slovene | 22 | 0.5% |
| Swedish | 159 | 3.8% |
| Swiss | 9 | 0.2% |
| Welsh | 11 | 0.3% | View All 33 Rows |
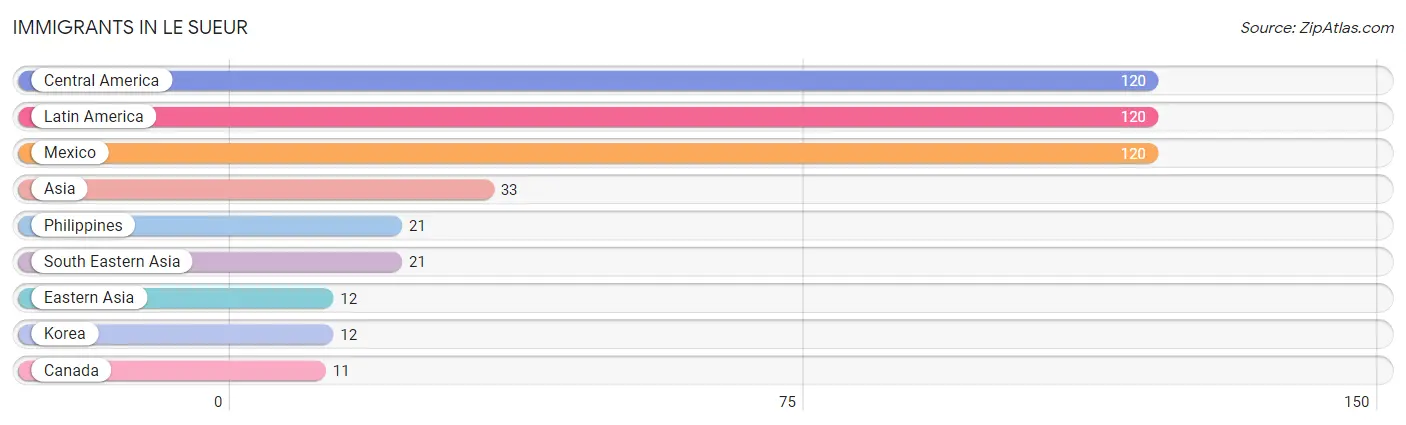
Immigrants in Le Sueur
The most numerous immigrant groups reported in Le Sueur came from Central America (120 | 2.9%), Latin America (120 | 2.9%), Mexico (120 | 2.9%), Asia (33 | 0.8%), and Philippines (21 | 0.5%), together accounting for 9.8% of all Le Sueur residents.
| Immigration Origin | # Population | % Population |
| Asia | 33 | 0.8% |
| Canada | 11 | 0.3% |
| Central America | 120 | 2.9% |
| Eastern Asia | 12 | 0.3% |
| Korea | 12 | 0.3% |
| Latin America | 120 | 2.9% |
| Mexico | 120 | 2.9% |
| Philippines | 21 | 0.5% |
| South Eastern Asia | 21 | 0.5% | View All 9 Rows |
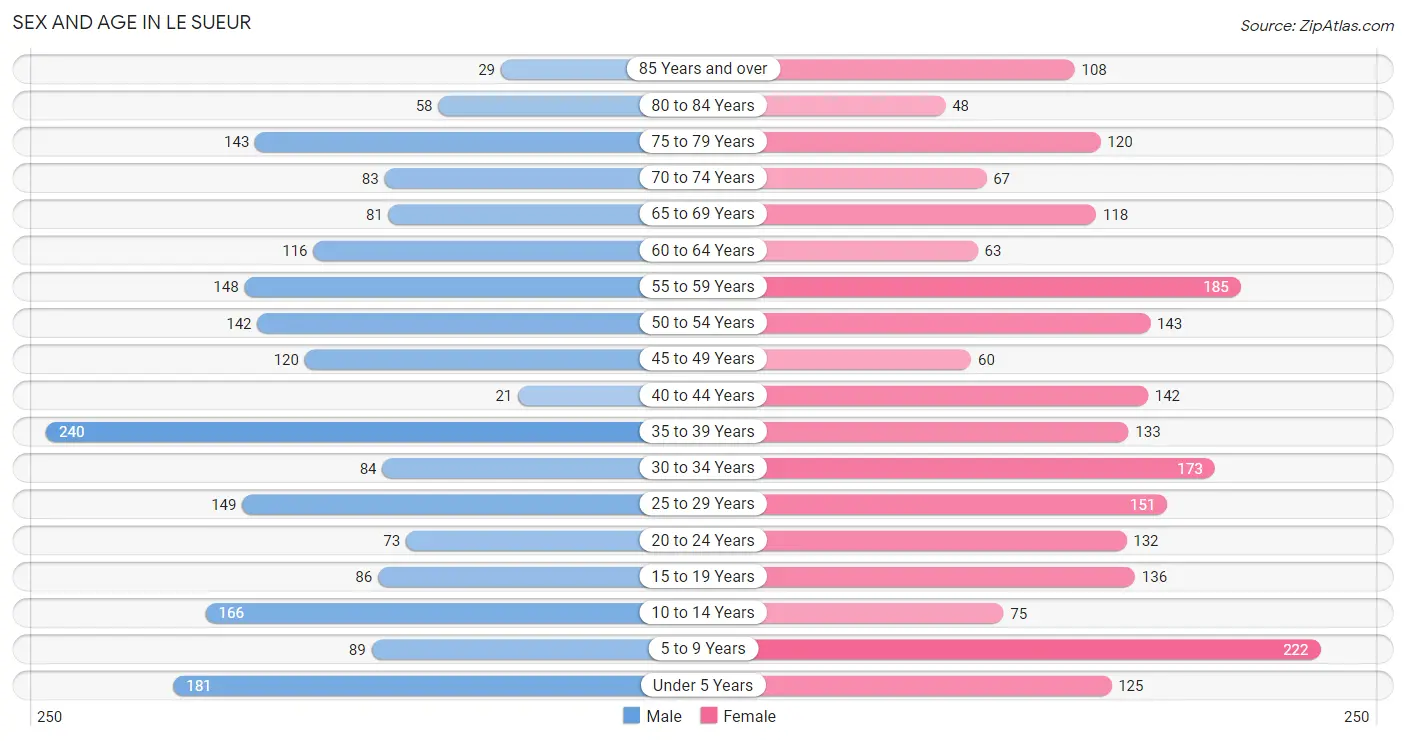
Sex and Age in Le Sueur
Sex and Age in Le Sueur
The most populous age groups in Le Sueur are 35 to 39 Years (240 | 11.9%) for men and 5 to 9 Years (222 | 10.1%) for women.
| Age Bracket | Male | Female |
| Under 5 Years | 181 (9.0%) | 125 (5.7%) |
| 5 to 9 Years | 89 (4.4%) | 222 (10.1%) |
| 10 to 14 Years | 166 (8.3%) | 75 (3.4%) |
| 15 to 19 Years | 86 (4.3%) | 136 (6.2%) |
| 20 to 24 Years | 73 (3.6%) | 132 (6.0%) |
| 25 to 29 Years | 149 (7.4%) | 151 (6.9%) |
| 30 to 34 Years | 84 (4.2%) | 173 (7.9%) |
| 35 to 39 Years | 240 (11.9%) | 133 (6.0%) |
| 40 to 44 Years | 21 (1.1%) | 142 (6.5%) |
| 45 to 49 Years | 120 (6.0%) | 60 (2.7%) |
| 50 to 54 Years | 142 (7.1%) | 143 (6.5%) |
| 55 to 59 Years | 148 (7.4%) | 185 (8.4%) |
| 60 to 64 Years | 116 (5.8%) | 63 (2.9%) |
| 65 to 69 Years | 81 (4.0%) | 118 (5.4%) |
| 70 to 74 Years | 83 (4.1%) | 67 (3.0%) |
| 75 to 79 Years | 143 (7.1%) | 120 (5.4%) |
| 80 to 84 Years | 58 (2.9%) | 48 (2.2%) |
| 85 Years and over | 29 (1.4%) | 108 (4.9%) |
| Total | 2,009 (100.0%) | 2,201 (100.0%) |
Families and Households in Le Sueur
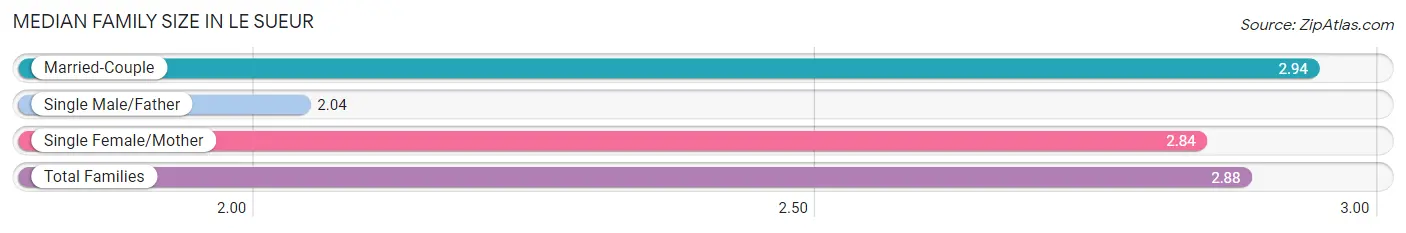
Median Family Size in Le Sueur
The median family size in Le Sueur is 2.88 persons per family, with married-couple families (852 | 74.2%) accounting for the largest median family size of 2.94 persons per family. On the other hand, single male/father families (52 | 4.5%) represent the smallest median family size with 2.04 persons per family.
| Family Type | # Families | Family Size |
| Married-Couple | 852 (74.2%) | 2.94 |
| Single Male/Father | 52 (4.5%) | 2.04 |
| Single Female/Mother | 244 (21.2%) | 2.84 |
| Total Families | 1,148 (100.0%) | 2.88 |
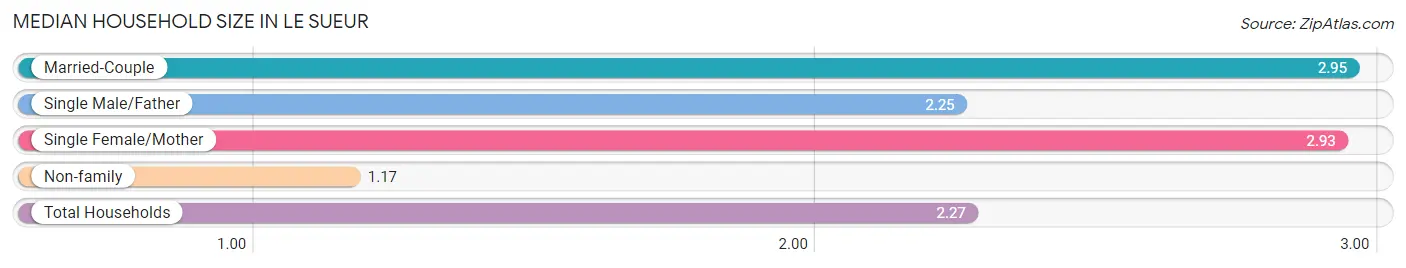
Median Household Size in Le Sueur
The median household size in Le Sueur is 2.27 persons per household, with married-couple households (852 | 47.0%) accounting for the largest median household size of 2.95 persons per household. non-family households (664 | 36.6%) represent the smallest median household size with 1.17 persons per household.
| Household Type | # Households | Household Size |
| Married-Couple | 852 (47.0%) | 2.95 |
| Single Male/Father | 52 (2.9%) | 2.25 |
| Single Female/Mother | 244 (13.5%) | 2.93 |
| Non-family | 664 (36.6%) | 1.17 |
| Total Households | 1,812 (100.0%) | 2.27 |
Household Size by Marriage Status in Le Sueur
Out of a total of 1,812 households in Le Sueur, 1,148 (63.4%) are family households, while 664 (36.6%) are nonfamily households. The most numerous type of family households are 2-person households, comprising 554, and the most common type of nonfamily households are 1-person households, comprising 574.
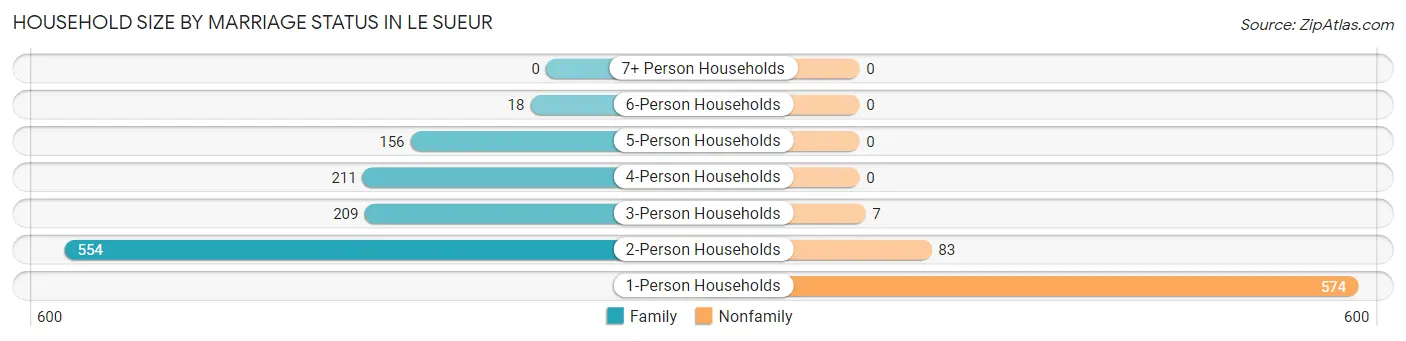
| Household Size | Family Households | Nonfamily Households |
| 1-Person Households | - | 574 (31.7%) |
| 2-Person Households | 554 (30.6%) | 83 (4.6%) |
| 3-Person Households | 209 (11.5%) | 7 (0.4%) |
| 4-Person Households | 211 (11.6%) | 0 (0.0%) |
| 5-Person Households | 156 (8.6%) | 0 (0.0%) |
| 6-Person Households | 18 (1.0%) | 0 (0.0%) |
| 7+ Person Households | 0 (0.0%) | 0 (0.0%) |
| Total | 1,148 (63.4%) | 664 (36.6%) |
Female Fertility in Le Sueur
Fertility by Age in Le Sueur
Average fertility rate in Le Sueur is 148.0 births per 1,000 women. Women in the age bracket of 35 to 50 years have the highest fertility rate with 245.0 births per 1,000 women. Women in the age bracket of 35 to 50 years acount for 59.9% of all women with births.
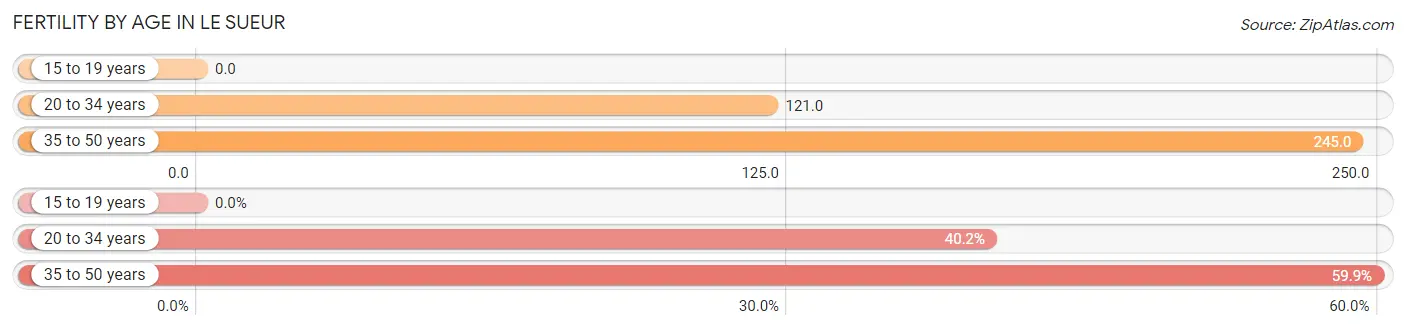
| Age Bracket | Women with Births | Births / 1,000 Women |
| 15 to 19 years | 0 (0.0%) | 0.0 |
| 20 to 34 years | 55 (40.2%) | 121.0 |
| 35 to 50 years | 82 (59.9%) | 245.0 |
| Total | 137 (100.0%) | 148.0 |
Fertility by Age by Marriage Status in Le Sueur
45.3% of women with births (137) in Le Sueur are married. The highest percentage of unmarried women with births falls into 35 to 50 years age bracket with 69.5% of them unmarried at the time of birth, while the lowest percentage of unmarried women with births belong to 20 to 34 years age bracket with 32.7% of them unmarried.
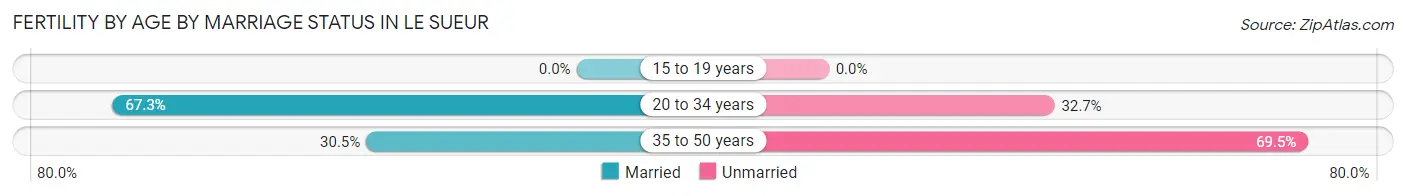
| Age Bracket | Married | Unmarried |
| 15 to 19 years | 0 (0.0%) | 0 (0.0%) |
| 20 to 34 years | 37 (67.3%) | 18 (32.7%) |
| 35 to 50 years | 25 (30.5%) | 57 (69.5%) |
| Total | 62 (45.3%) | 75 (54.7%) |
Fertility by Education in Le Sueur
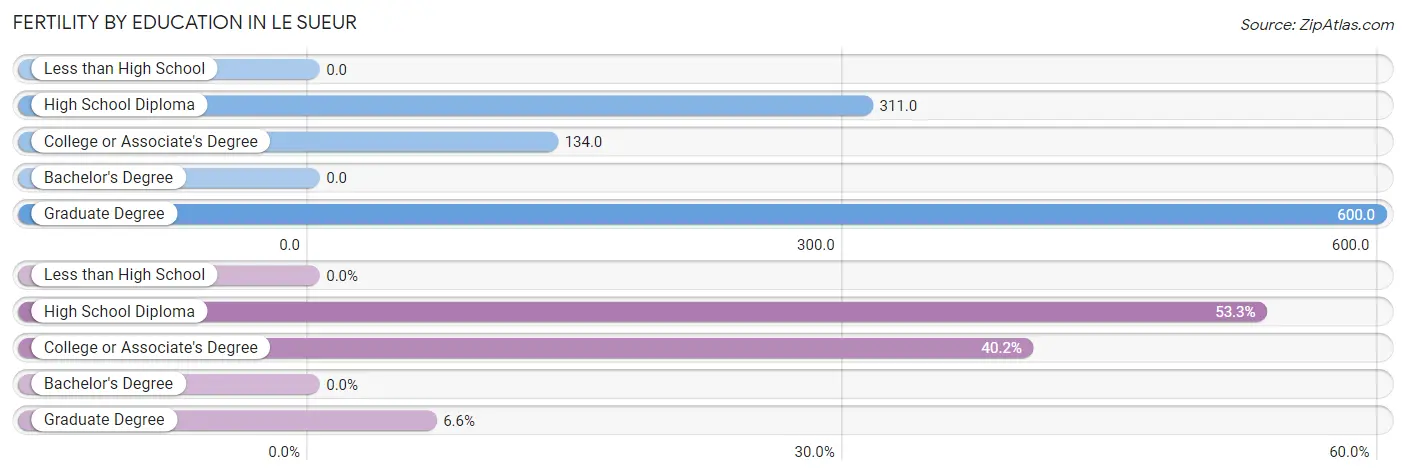
| Educational Attainment | Women with Births | Births / 1,000 Women |
| Less than High School | 0 (0.0%) | 0.0 |
| High School Diploma | 73 (53.3%) | 311.0 |
| College or Associate's Degree | 55 (40.2%) | 134.0 |
| Bachelor's Degree | 0 (0.0%) | 0.0 |
| Graduate Degree | 9 (6.6%) | 600.0 |
| Total | 137 (100.0%) | 148.0 |
Fertility by Education by Marriage Status in Le Sueur
54.7% of women with births in Le Sueur are unmarried. Women with the educational attainment of graduate degree are most likely to be married with 100.0% of them married at childbirth, while women with the educational attainment of high school diploma are least likely to be married with 78.1% of them unmarried at childbirth.
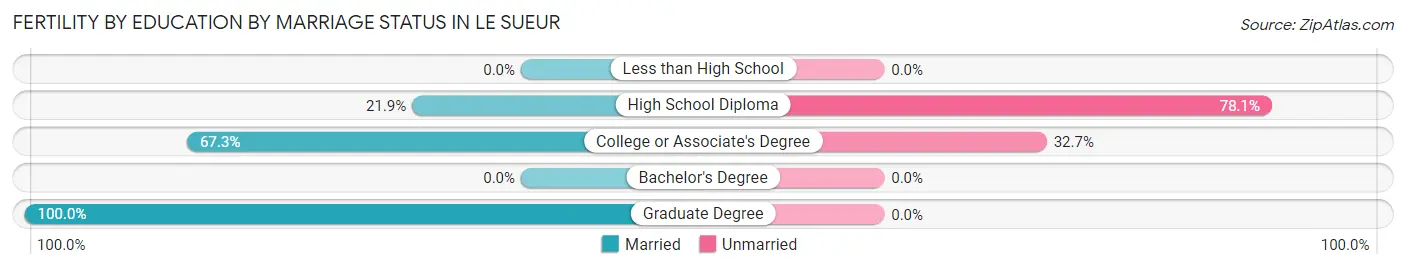
| Educational Attainment | Married | Unmarried |
| Less than High School | 0 (0.0%) | 0 (0.0%) |
| High School Diploma | 16 (21.9%) | 57 (78.1%) |
| College or Associate's Degree | 37 (67.3%) | 18 (32.7%) |
| Bachelor's Degree | 0 (0.0%) | 0 (0.0%) |
| Graduate Degree | 9 (100.0%) | 0 (0.0%) |
| Total | 62 (45.3%) | 75 (54.7%) |
Employment Characteristics in Le Sueur
Employment by Class of Employer in Le Sueur
Among the 2,279 employed individuals in Le Sueur, private company employees (1,583 | 69.5%), self-employed (not incorporated) (185 | 8.1%), and not-for-profit organizations (178 | 7.8%) make up the most common classes of employment.
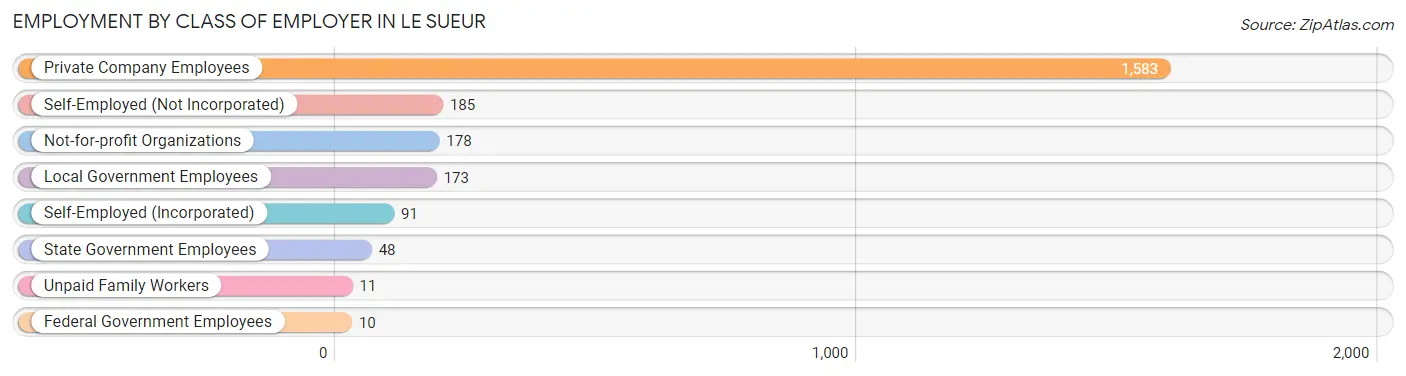
| Employer Class | # Employees | % Employees |
| Private Company Employees | 1,583 | 69.5% |
| Self-Employed (Incorporated) | 91 | 4.0% |
| Self-Employed (Not Incorporated) | 185 | 8.1% |
| Not-for-profit Organizations | 178 | 7.8% |
| Local Government Employees | 173 | 7.6% |
| State Government Employees | 48 | 2.1% |
| Federal Government Employees | 10 | 0.4% |
| Unpaid Family Workers | 11 | 0.5% |
| Total | 2,279 | 100.0% |
Employment Status by Age in Le Sueur
According to the labor force statistics for Le Sueur, out of the total population over 16 years of age (3,273), 70.1% or 2,294 individuals are in the labor force, with 0.3% or 7 of them unemployed. The age group with the highest labor force participation rate is 30 to 34 years, with 100.0% or 257 individuals in the labor force. Within the labor force, the 65 to 74 years age range has the highest percentage of unemployed individuals, with 6.0% or 7 of them being unemployed.
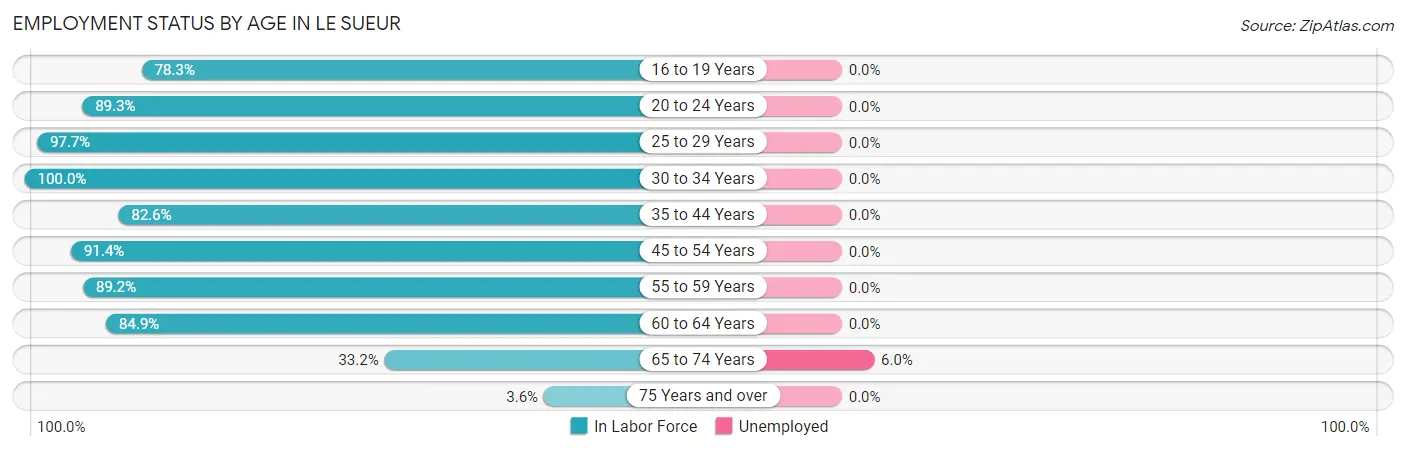
| Age Bracket | In Labor Force | Unemployed |
| 16 to 19 Years | 112 (78.3%) | 0 (0.0%) |
| 20 to 24 Years | 183 (89.3%) | 0 (0.0%) |
| 25 to 29 Years | 293 (97.7%) | 0 (0.0%) |
| 30 to 34 Years | 257 (100.0%) | 0 (0.0%) |
| 35 to 44 Years | 443 (82.6%) | 0 (0.0%) |
| 45 to 54 Years | 425 (91.4%) | 0 (0.0%) |
| 55 to 59 Years | 297 (89.2%) | 0 (0.0%) |
| 60 to 64 Years | 152 (84.9%) | 0 (0.0%) |
| 65 to 74 Years | 116 (33.2%) | 7 (6.0%) |
| 75 Years and over | 18 (3.6%) | 0 (0.0%) |
| Total | 2,294 (70.1%) | 7 (0.3%) |
Employment Status by Educational Attainment in Le Sueur
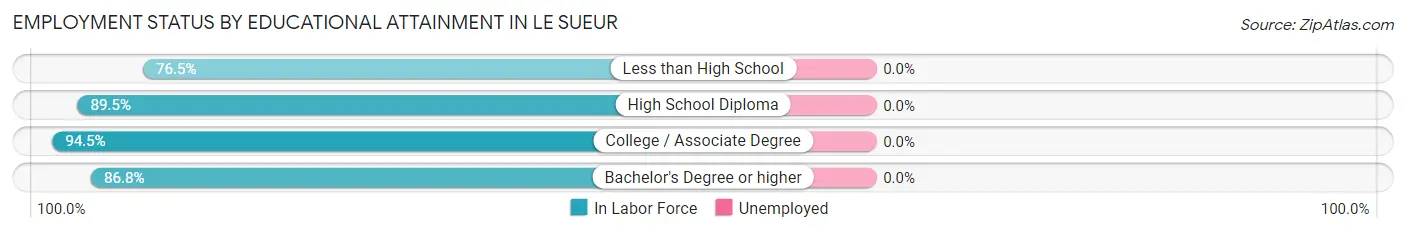
| Educational Attainment | In Labor Force | Unemployed |
| Less than High School | 88 (76.5%) | 0 (0.0%) |
| High School Diploma | 696 (89.5%) | 0 (0.0%) |
| College / Associate Degree | 755 (94.5%) | 0 (0.0%) |
| Bachelor's Degree or higher | 328 (86.8%) | 0 (0.0%) |
| Total | 1,867 (90.2%) | 0 (0.0%) |
Employment Occupations by Sex in Le Sueur
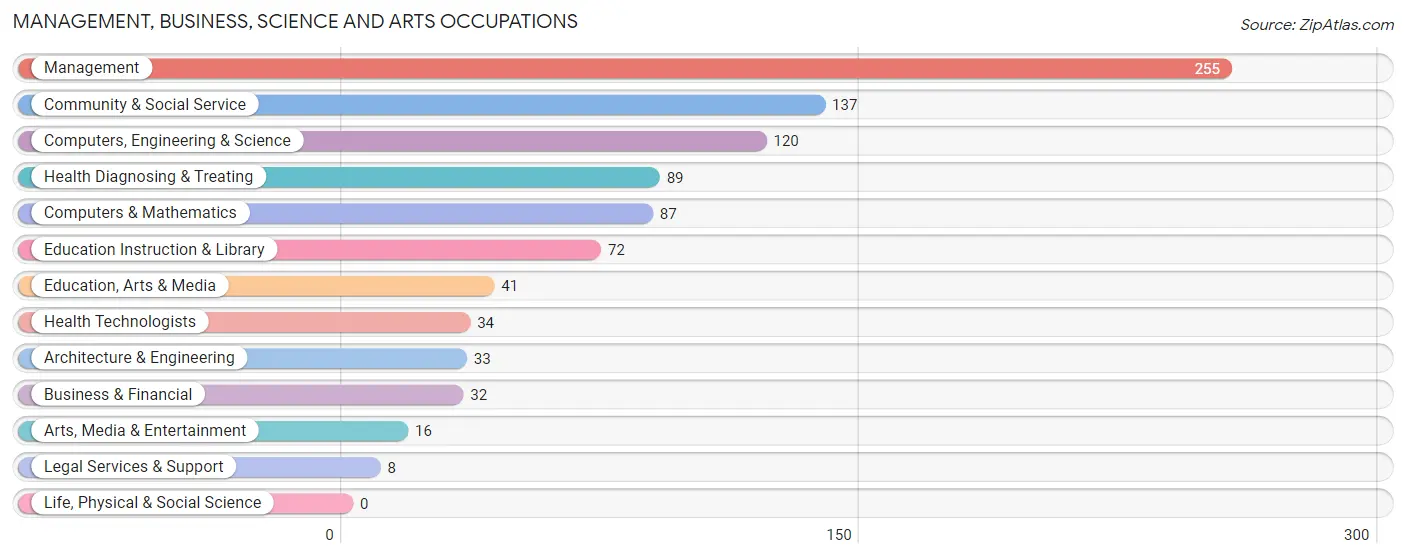
Management, Business, Science and Arts Occupations
The most common Management, Business, Science and Arts occupations in Le Sueur are Management (255 | 11.1%), Community & Social Service (137 | 6.0%), Computers, Engineering & Science (120 | 5.2%), Health Diagnosing & Treating (89 | 3.9%), and Computers & Mathematics (87 | 3.8%).
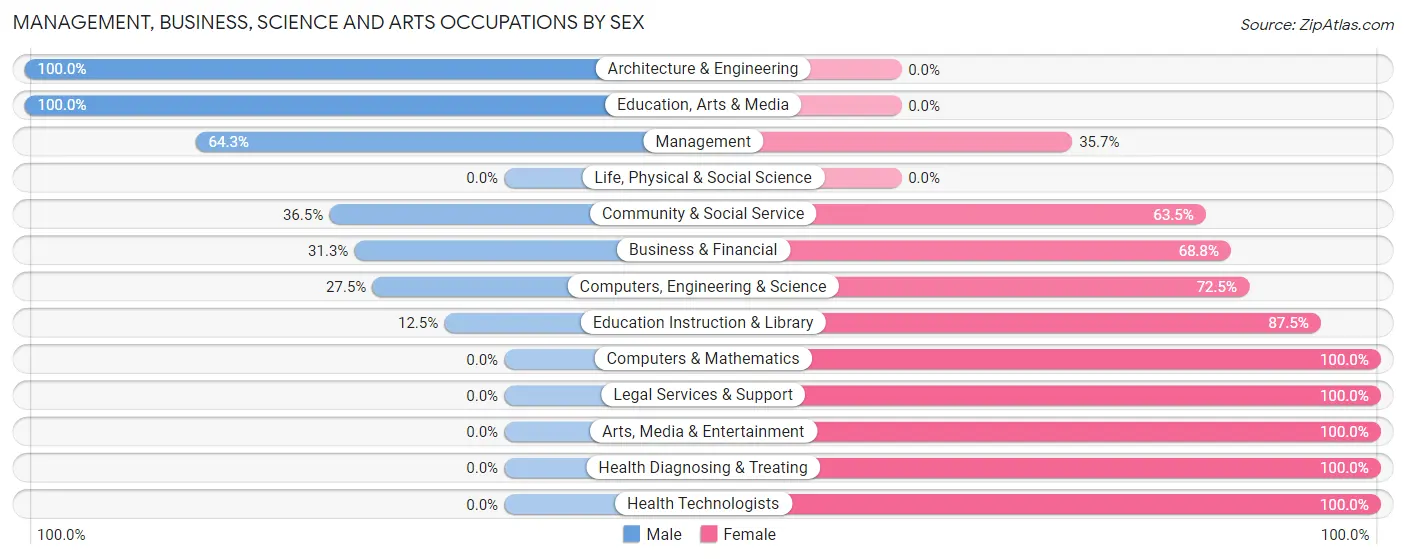
Management, Business, Science and Arts Occupations by Sex
Within the Management, Business, Science and Arts occupations in Le Sueur, the most male-oriented occupations are Architecture & Engineering (100.0%), Education, Arts & Media (100.0%), and Management (64.3%), while the most female-oriented occupations are Computers & Mathematics (100.0%), Legal Services & Support (100.0%), and Arts, Media & Entertainment (100.0%).
| Occupation | Male | Female |
| Management | 164 (64.3%) | 91 (35.7%) |
| Business & Financial | 10 (31.2%) | 22 (68.8%) |
| Computers, Engineering & Science | 33 (27.5%) | 87 (72.5%) |
| Computers & Mathematics | 0 (0.0%) | 87 (100.0%) |
| Architecture & Engineering | 33 (100.0%) | 0 (0.0%) |
| Life, Physical & Social Science | 0 (0.0%) | 0 (0.0%) |
| Community & Social Service | 50 (36.5%) | 87 (63.5%) |
| Education, Arts & Media | 41 (100.0%) | 0 (0.0%) |
| Legal Services & Support | 0 (0.0%) | 8 (100.0%) |
| Education Instruction & Library | 9 (12.5%) | 63 (87.5%) |
| Arts, Media & Entertainment | 0 (0.0%) | 16 (100.0%) |
| Health Diagnosing & Treating | 0 (0.0%) | 89 (100.0%) |
| Health Technologists | 0 (0.0%) | 34 (100.0%) |
| Total (Category) | 257 (40.6%) | 376 (59.4%) |
| Total (Overall) | 1,088 (47.5%) | 1,201 (52.5%) |
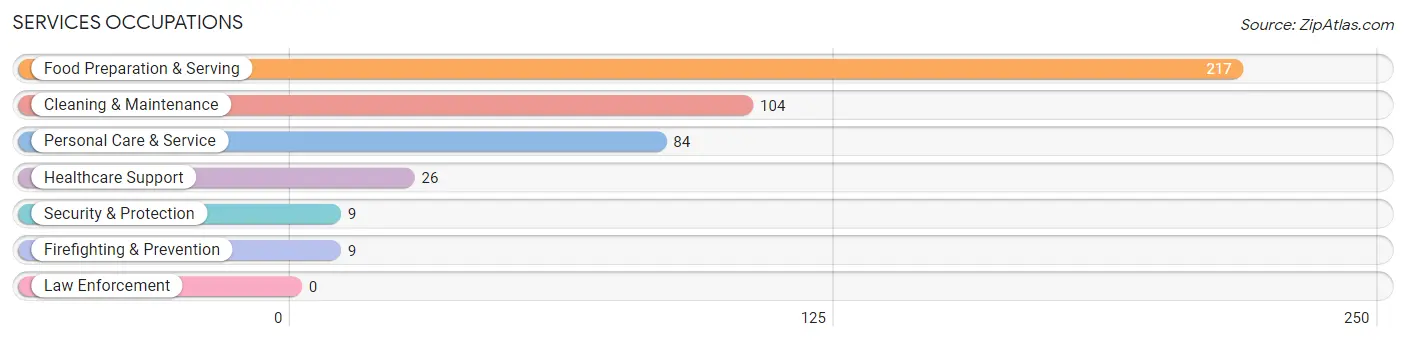
Services Occupations
The most common Services occupations in Le Sueur are Food Preparation & Serving (217 | 9.5%), Cleaning & Maintenance (104 | 4.5%), Personal Care & Service (84 | 3.7%), Healthcare Support (26 | 1.1%), and Security & Protection (9 | 0.4%).
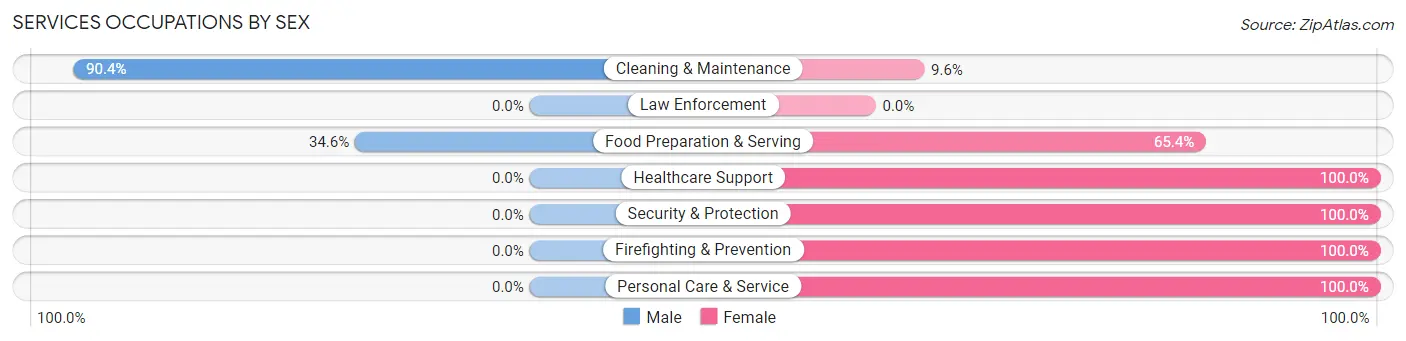
Services Occupations by Sex
Within the Services occupations in Le Sueur, the most male-oriented occupations are Cleaning & Maintenance (90.4%), and Food Preparation & Serving (34.6%), while the most female-oriented occupations are Healthcare Support (100.0%), Security & Protection (100.0%), and Firefighting & Prevention (100.0%).
| Occupation | Male | Female |
| Healthcare Support | 0 (0.0%) | 26 (100.0%) |
| Security & Protection | 0 (0.0%) | 9 (100.0%) |
| Firefighting & Prevention | 0 (0.0%) | 9 (100.0%) |
| Law Enforcement | 0 (0.0%) | 0 (0.0%) |
| Food Preparation & Serving | 75 (34.6%) | 142 (65.4%) |
| Cleaning & Maintenance | 94 (90.4%) | 10 (9.6%) |
| Personal Care & Service | 0 (0.0%) | 84 (100.0%) |
| Total (Category) | 169 (38.4%) | 271 (61.6%) |
| Total (Overall) | 1,088 (47.5%) | 1,201 (52.5%) |
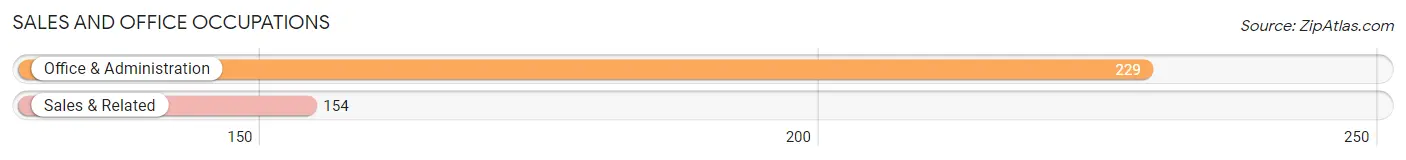
Sales and Office Occupations
The most common Sales and Office occupations in Le Sueur are Office & Administration (229 | 10.0%), and Sales & Related (154 | 6.7%).
Sales and Office Occupations by Sex
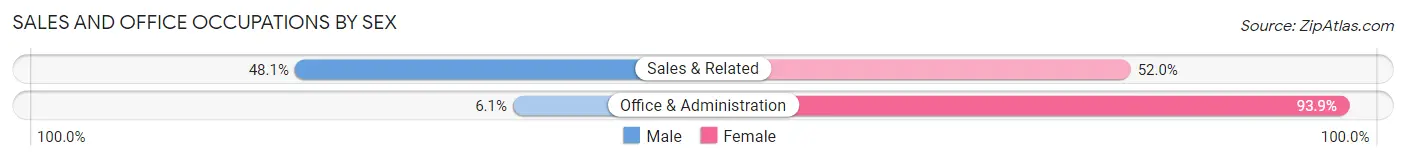
| Occupation | Male | Female |
| Sales & Related | 74 (48.0%) | 80 (51.9%) |
| Office & Administration | 14 (6.1%) | 215 (93.9%) |
| Total (Category) | 88 (23.0%) | 295 (77.0%) |
| Total (Overall) | 1,088 (47.5%) | 1,201 (52.5%) |
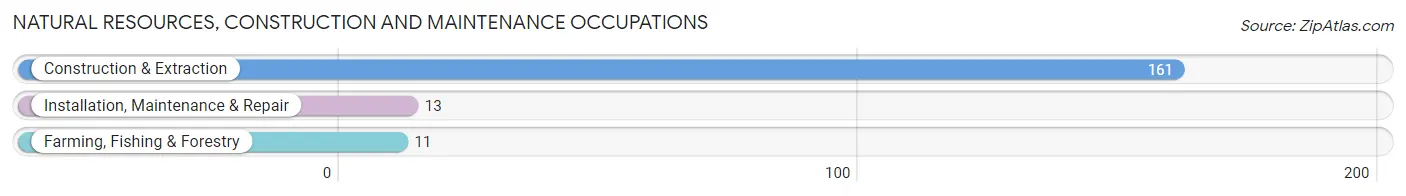
Natural Resources, Construction and Maintenance Occupations
The most common Natural Resources, Construction and Maintenance occupations in Le Sueur are Construction & Extraction (161 | 7.0%), Installation, Maintenance & Repair (13 | 0.6%), and Farming, Fishing & Forestry (11 | 0.5%).
Natural Resources, Construction and Maintenance Occupations by Sex
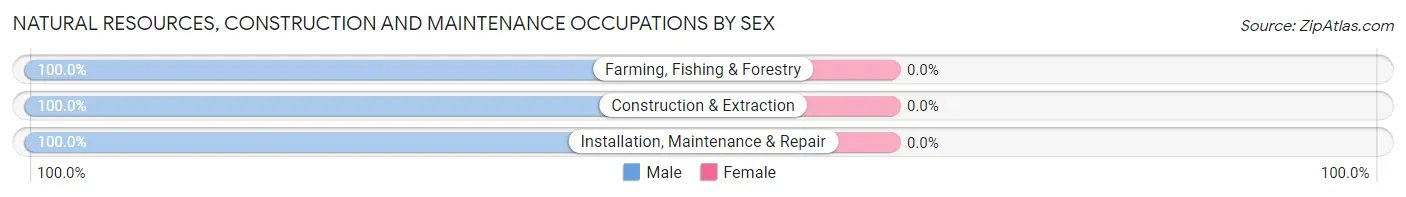
| Occupation | Male | Female |
| Farming, Fishing & Forestry | 11 (100.0%) | 0 (0.0%) |
| Construction & Extraction | 161 (100.0%) | 0 (0.0%) |
| Installation, Maintenance & Repair | 13 (100.0%) | 0 (0.0%) |
| Total (Category) | 185 (100.0%) | 0 (0.0%) |
| Total (Overall) | 1,088 (47.5%) | 1,201 (52.5%) |
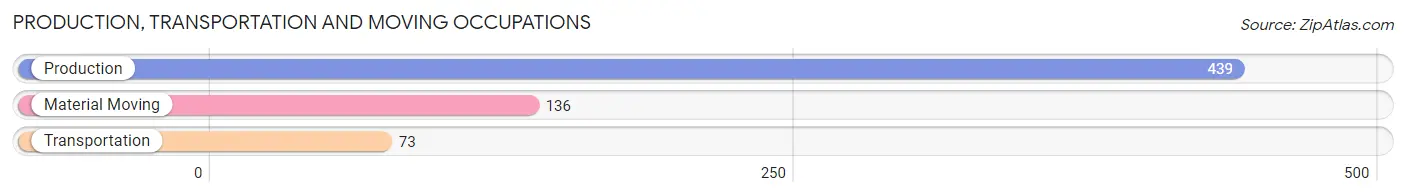
Production, Transportation and Moving Occupations
The most common Production, Transportation and Moving occupations in Le Sueur are Production (439 | 19.2%), Material Moving (136 | 5.9%), and Transportation (73 | 3.2%).
Production, Transportation and Moving Occupations by Sex
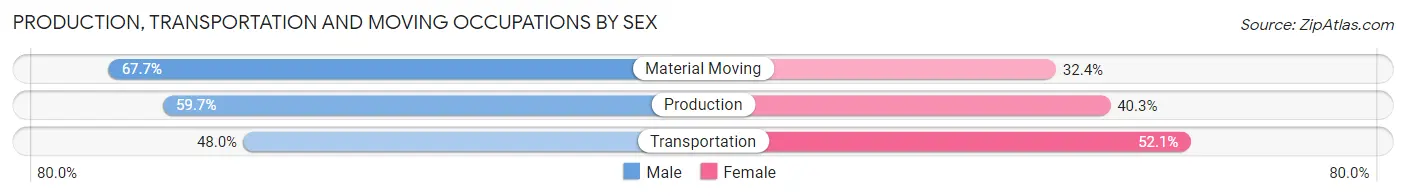
| Occupation | Male | Female |
| Production | 262 (59.7%) | 177 (40.3%) |
| Transportation | 35 (47.9%) | 38 (52.0%) |
| Material Moving | 92 (67.6%) | 44 (32.4%) |
| Total (Category) | 389 (60.0%) | 259 (40.0%) |
| Total (Overall) | 1,088 (47.5%) | 1,201 (52.5%) |
Employment Industries by Sex in Le Sueur
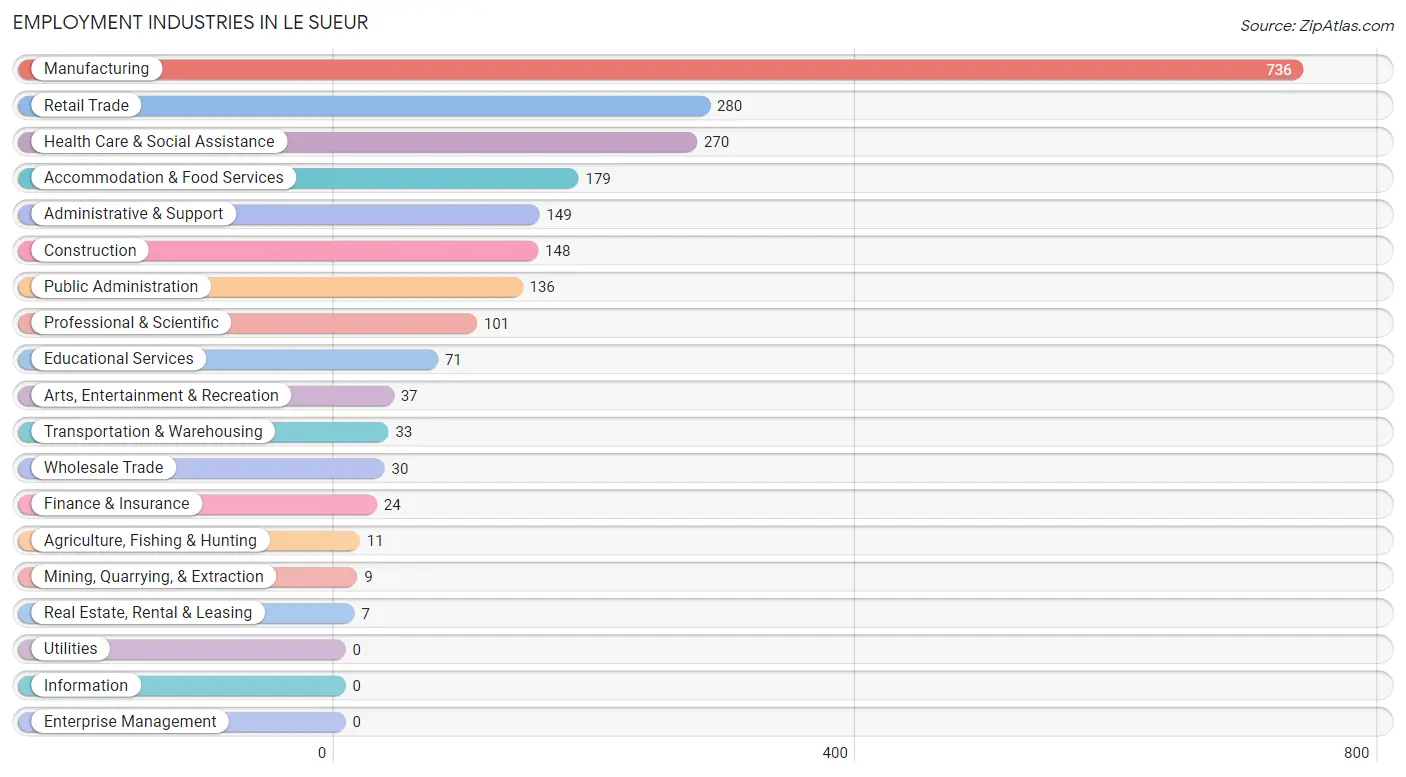
Employment Industries in Le Sueur
The major employment industries in Le Sueur include Manufacturing (736 | 32.2%), Retail Trade (280 | 12.2%), Health Care & Social Assistance (270 | 11.8%), Accommodation & Food Services (179 | 7.8%), and Administrative & Support (149 | 6.5%).
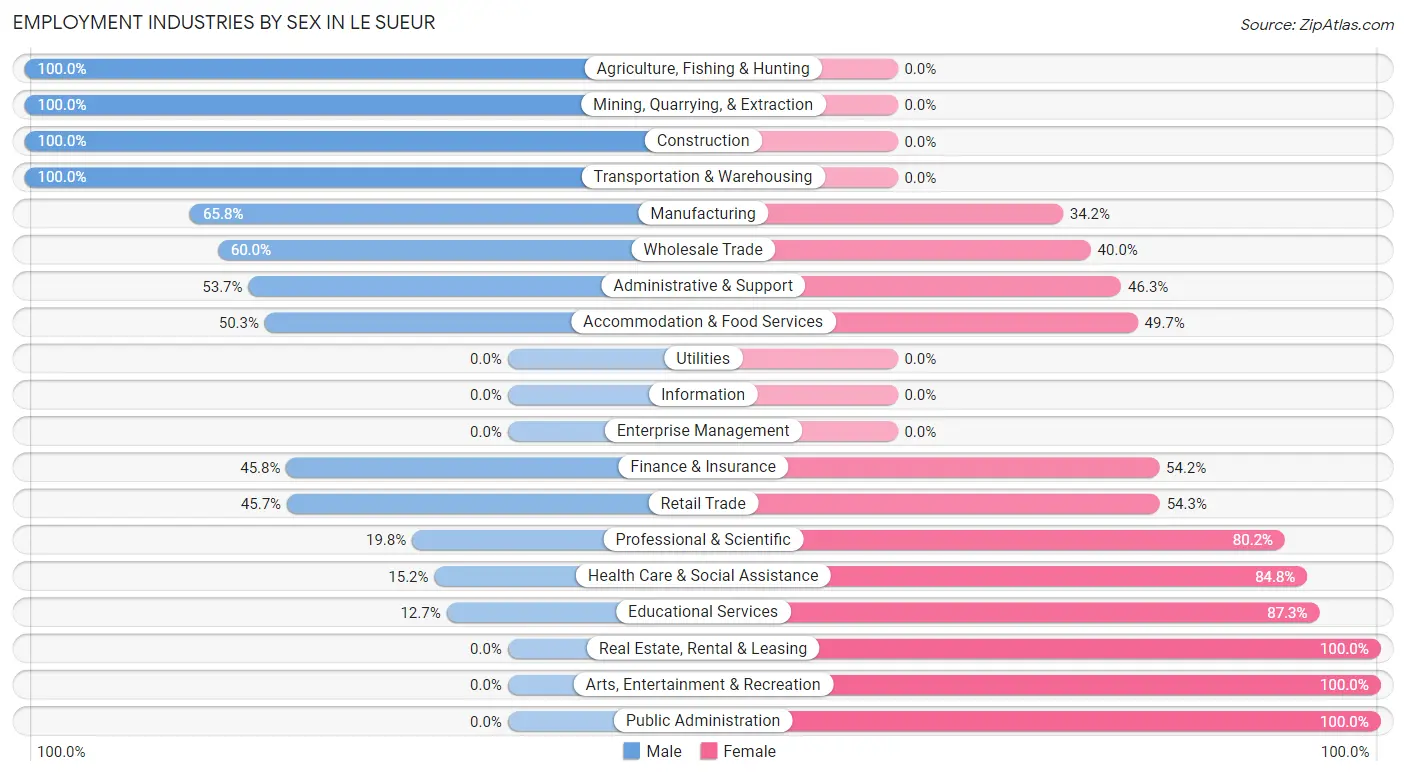
Employment Industries by Sex in Le Sueur
The Le Sueur industries that see more men than women are Agriculture, Fishing & Hunting (100.0%), Mining, Quarrying, & Extraction (100.0%), and Construction (100.0%), whereas the industries that tend to have a higher number of women are Real Estate, Rental & Leasing (100.0%), Arts, Entertainment & Recreation (100.0%), and Public Administration (100.0%).
| Industry | Male | Female |
| Agriculture, Fishing & Hunting | 11 (100.0%) | 0 (0.0%) |
| Mining, Quarrying, & Extraction | 9 (100.0%) | 0 (0.0%) |
| Construction | 148 (100.0%) | 0 (0.0%) |
| Manufacturing | 484 (65.8%) | 252 (34.2%) |
| Wholesale Trade | 18 (60.0%) | 12 (40.0%) |
| Retail Trade | 128 (45.7%) | 152 (54.3%) |
| Transportation & Warehousing | 33 (100.0%) | 0 (0.0%) |
| Utilities | 0 (0.0%) | 0 (0.0%) |
| Information | 0 (0.0%) | 0 (0.0%) |
| Finance & Insurance | 11 (45.8%) | 13 (54.2%) |
| Real Estate, Rental & Leasing | 0 (0.0%) | 7 (100.0%) |
| Professional & Scientific | 20 (19.8%) | 81 (80.2%) |
| Enterprise Management | 0 (0.0%) | 0 (0.0%) |
| Administrative & Support | 80 (53.7%) | 69 (46.3%) |
| Educational Services | 9 (12.7%) | 62 (87.3%) |
| Health Care & Social Assistance | 41 (15.2%) | 229 (84.8%) |
| Arts, Entertainment & Recreation | 0 (0.0%) | 37 (100.0%) |
| Accommodation & Food Services | 90 (50.3%) | 89 (49.7%) |
| Public Administration | 0 (0.0%) | 136 (100.0%) |
| Total | 1,088 (47.5%) | 1,201 (52.5%) |
Education in Le Sueur
School Enrollment in Le Sueur
The most common levels of schooling among the 934 students in Le Sueur are middle school (228 | 24.4%), elementary school (213 | 22.8%), and college / undergraduate (179 | 19.2%).
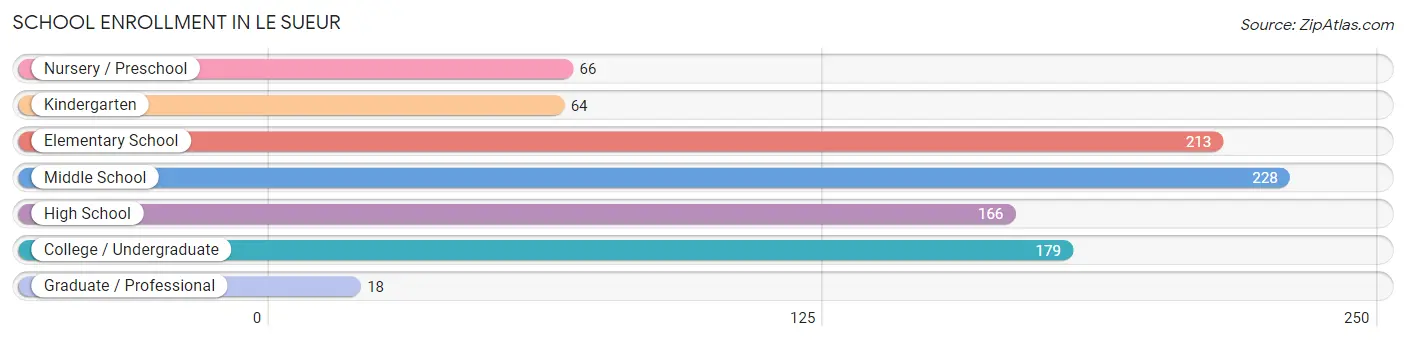
| School Level | # Students | % Students |
| Nursery / Preschool | 66 | 7.1% |
| Kindergarten | 64 | 6.9% |
| Elementary School | 213 | 22.8% |
| Middle School | 228 | 24.4% |
| High School | 166 | 17.8% |
| College / Undergraduate | 179 | 19.2% |
| Graduate / Professional | 18 | 1.9% |
| Total | 934 | 100.0% |
School Enrollment by Age by Funding Source in Le Sueur
Out of a total of 934 students who are enrolled in schools in Le Sueur, 124 (13.3%) attend a private institution, while the remaining 810 (86.7%) are enrolled in public schools. The age group of 3 to 4 year olds has the highest likelihood of being enrolled in private schools, with 12 (63.2% in the age bracket) enrolled. Conversely, the age group of 18 to 19 year olds has the lowest likelihood of being enrolled in a private school, with 93 (100.0% in the age bracket) attending a public institution.
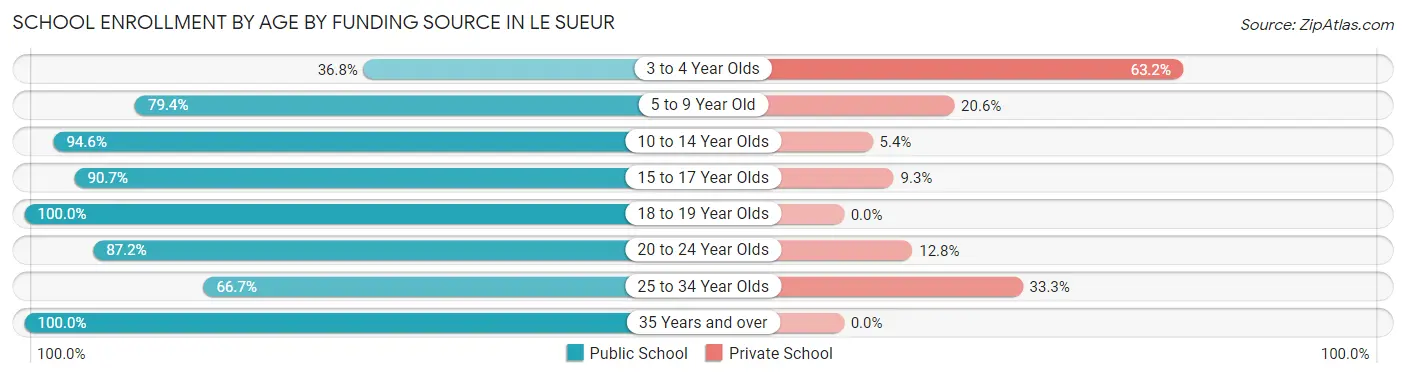
| Age Bracket | Public School | Private School |
| 3 to 4 Year Olds | 7 (36.8%) | 12 (63.2%) |
| 5 to 9 Year Old | 247 (79.4%) | 64 (20.6%) |
| 10 to 14 Year Olds | 228 (94.6%) | 13 (5.4%) |
| 15 to 17 Year Olds | 117 (90.7%) | 12 (9.3%) |
| 18 to 19 Year Olds | 93 (100.0%) | 0 (0.0%) |
| 20 to 24 Year Olds | 75 (87.2%) | 11 (12.8%) |
| 25 to 34 Year Olds | 24 (66.7%) | 12 (33.3%) |
| 35 Years and over | 19 (100.0%) | 0 (0.0%) |
| Total | 810 (86.7%) | 124 (13.3%) |
Educational Attainment by Field of Study in Le Sueur
Business (161 | 23.8%), science & technology (121 | 17.9%), bio, nature & agricultural (86 | 12.7%), education (80 | 11.8%), and social sciences (52 | 7.7%) are the most common fields of study among 677 individuals in Le Sueur who have obtained a bachelor's degree or higher.
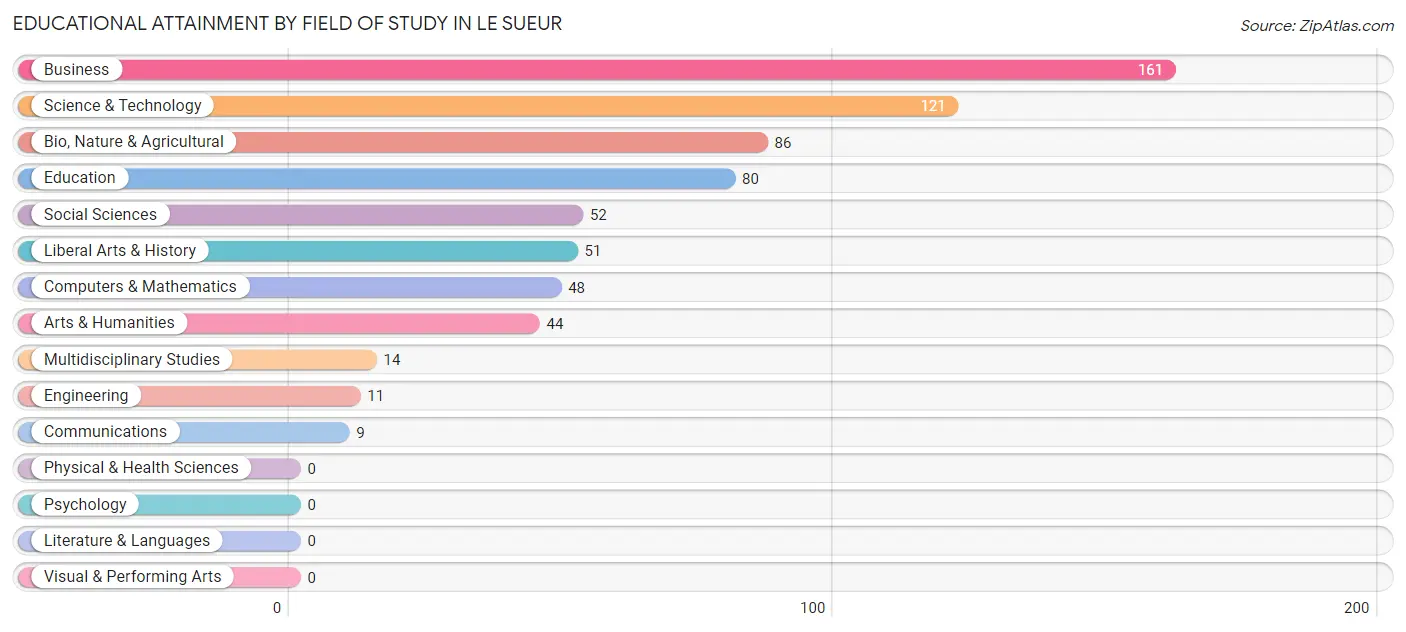
| Field of Study | # Graduates | % Graduates |
| Computers & Mathematics | 48 | 7.1% |
| Bio, Nature & Agricultural | 86 | 12.7% |
| Physical & Health Sciences | 0 | 0.0% |
| Psychology | 0 | 0.0% |
| Social Sciences | 52 | 7.7% |
| Engineering | 11 | 1.6% |
| Multidisciplinary Studies | 14 | 2.1% |
| Science & Technology | 121 | 17.9% |
| Business | 161 | 23.8% |
| Education | 80 | 11.8% |
| Literature & Languages | 0 | 0.0% |
| Liberal Arts & History | 51 | 7.5% |
| Visual & Performing Arts | 0 | 0.0% |
| Communications | 9 | 1.3% |
| Arts & Humanities | 44 | 6.5% |
| Total | 677 | 100.0% |
Transportation & Commute in Le Sueur
Vehicle Availability by Sex in Le Sueur
The most prevalent vehicle ownership categories in Le Sueur are males with 3 vehicles (341, accounting for 31.6%) and females with 3 vehicles (273, making up 28.4%).
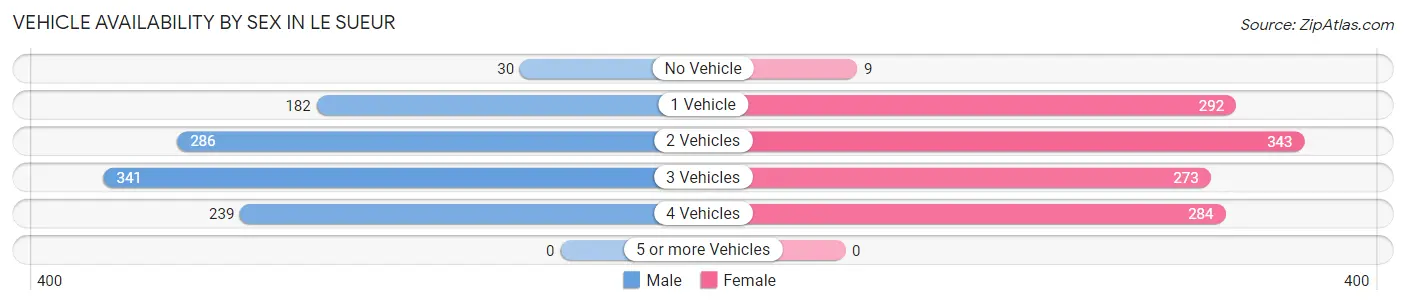
| Vehicles Available | Male | Female |
| No Vehicle | 30 (2.8%) | 9 (0.7%) |
| 1 Vehicle | 182 (16.9%) | 292 (24.3%) |
| 2 Vehicles | 286 (26.5%) | 343 (28.6%) |
| 3 Vehicles | 341 (31.6%) | 273 (22.7%) |
| 4 Vehicles | 239 (22.2%) | 284 (23.6%) |
| 5 or more Vehicles | 0 (0.0%) | 0 (0.0%) |
| Total | 1,078 (100.0%) | 1,201 (100.0%) |
Commute Time in Le Sueur
The most frequently occuring commute durations in Le Sueur are 20 to 24 minutes (498 commuters, 23.2%), 5 to 9 minutes (308 commuters, 14.3%), and 10 to 14 minutes (287 commuters, 13.4%).
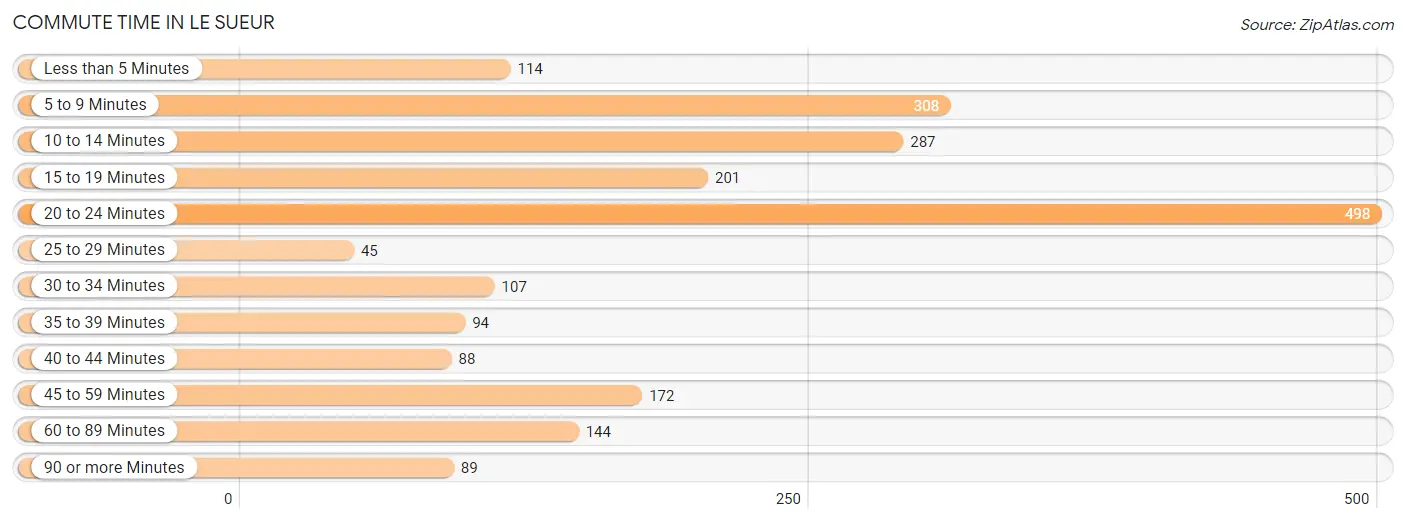
| Commute Time | # Commuters | % Commuters |
| Less than 5 Minutes | 114 | 5.3% |
| 5 to 9 Minutes | 308 | 14.3% |
| 10 to 14 Minutes | 287 | 13.4% |
| 15 to 19 Minutes | 201 | 9.4% |
| 20 to 24 Minutes | 498 | 23.2% |
| 25 to 29 Minutes | 45 | 2.1% |
| 30 to 34 Minutes | 107 | 5.0% |
| 35 to 39 Minutes | 94 | 4.4% |
| 40 to 44 Minutes | 88 | 4.1% |
| 45 to 59 Minutes | 172 | 8.0% |
| 60 to 89 Minutes | 144 | 6.7% |
| 90 or more Minutes | 89 | 4.2% |
Commute Time by Sex in Le Sueur
The most common commute times in Le Sueur are 5 to 9 minutes (180 commuters, 17.6%) for males and 20 to 24 minutes (325 commuters, 28.9%) for females.
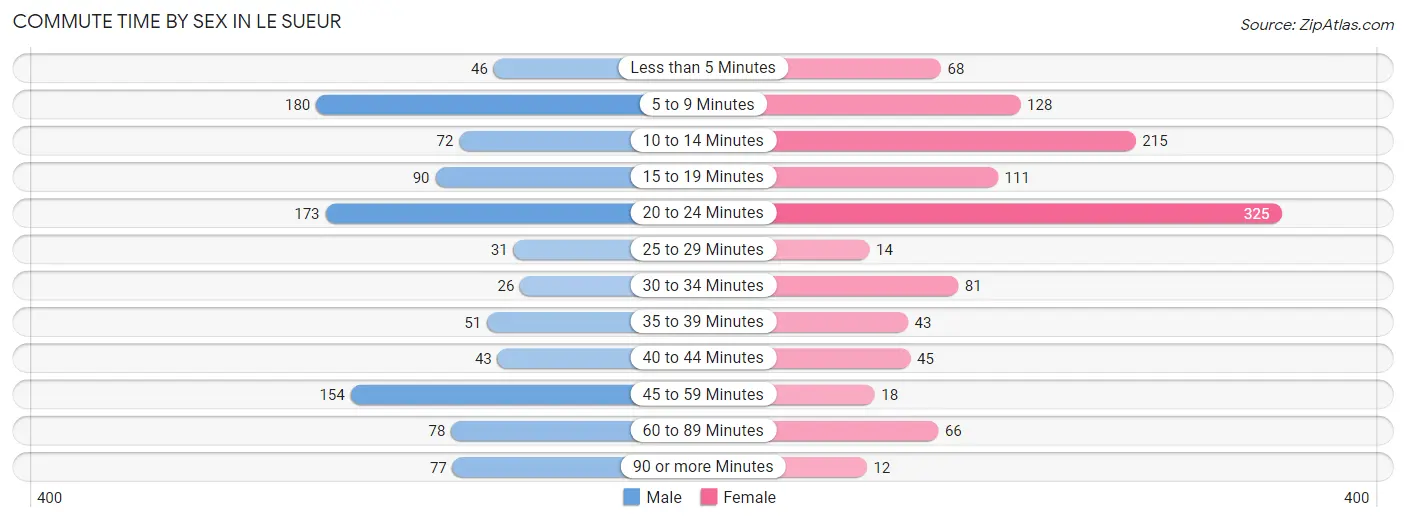
| Commute Time | Male | Female |
| Less than 5 Minutes | 46 (4.5%) | 68 (6.0%) |
| 5 to 9 Minutes | 180 (17.6%) | 128 (11.4%) |
| 10 to 14 Minutes | 72 (7.0%) | 215 (19.1%) |
| 15 to 19 Minutes | 90 (8.8%) | 111 (9.9%) |
| 20 to 24 Minutes | 173 (16.9%) | 325 (28.9%) |
| 25 to 29 Minutes | 31 (3.0%) | 14 (1.2%) |
| 30 to 34 Minutes | 26 (2.5%) | 81 (7.2%) |
| 35 to 39 Minutes | 51 (5.0%) | 43 (3.8%) |
| 40 to 44 Minutes | 43 (4.2%) | 45 (4.0%) |
| 45 to 59 Minutes | 154 (15.1%) | 18 (1.6%) |
| 60 to 89 Minutes | 78 (7.6%) | 66 (5.9%) |
| 90 or more Minutes | 77 (7.5%) | 12 (1.1%) |
Time of Departure to Work by Sex in Le Sueur
The most frequent times of departure to work in Le Sueur are 12:00 PM to 3:59 PM (178, 17.4%) for males and 7:30 AM to 7:59 AM (238, 21.1%) for females.
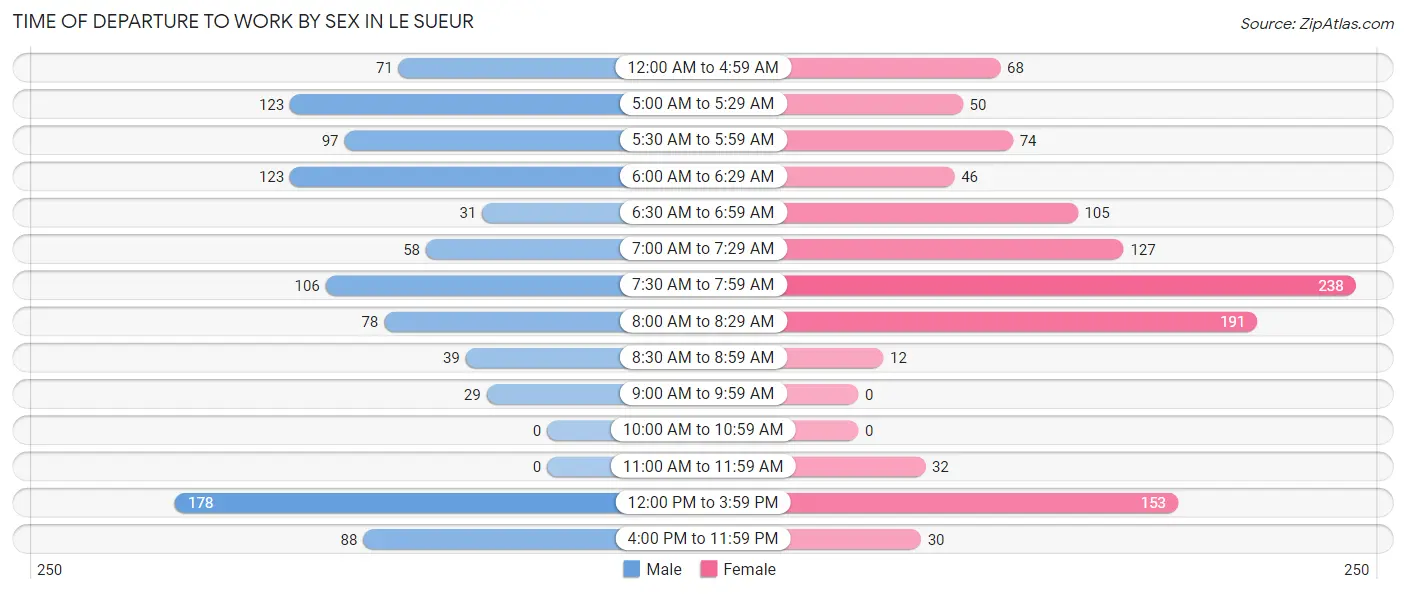
| Time of Departure | Male | Female |
| 12:00 AM to 4:59 AM | 71 (7.0%) | 68 (6.0%) |
| 5:00 AM to 5:29 AM | 123 (12.0%) | 50 (4.4%) |
| 5:30 AM to 5:59 AM | 97 (9.5%) | 74 (6.6%) |
| 6:00 AM to 6:29 AM | 123 (12.0%) | 46 (4.1%) |
| 6:30 AM to 6:59 AM | 31 (3.0%) | 105 (9.3%) |
| 7:00 AM to 7:29 AM | 58 (5.7%) | 127 (11.3%) |
| 7:30 AM to 7:59 AM | 106 (10.4%) | 238 (21.1%) |
| 8:00 AM to 8:29 AM | 78 (7.6%) | 191 (17.0%) |
| 8:30 AM to 8:59 AM | 39 (3.8%) | 12 (1.1%) |
| 9:00 AM to 9:59 AM | 29 (2.8%) | 0 (0.0%) |
| 10:00 AM to 10:59 AM | 0 (0.0%) | 0 (0.0%) |
| 11:00 AM to 11:59 AM | 0 (0.0%) | 32 (2.8%) |
| 12:00 PM to 3:59 PM | 178 (17.4%) | 153 (13.6%) |
| 4:00 PM to 11:59 PM | 88 (8.6%) | 30 (2.7%) |
| Total | 1,021 (100.0%) | 1,126 (100.0%) |
Housing Occupancy in Le Sueur
Occupancy by Ownership in Le Sueur
Of the total 1,812 dwellings in Le Sueur, owner-occupied units account for 1,198 (66.1%), while renter-occupied units make up 614 (33.9%).
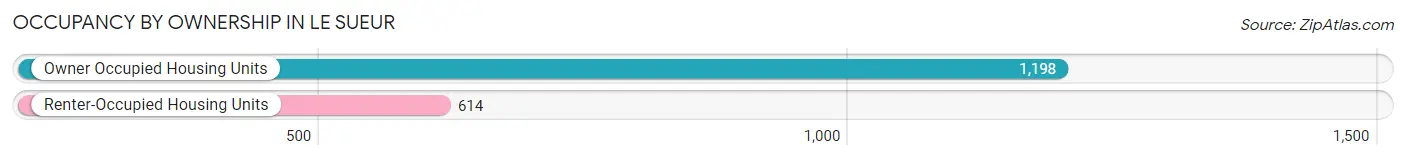
| Occupancy | # Housing Units | % Housing Units |
| Owner Occupied Housing Units | 1,198 | 66.1% |
| Renter-Occupied Housing Units | 614 | 33.9% |
| Total Occupied Housing Units | 1,812 | 100.0% |
Occupancy by Household Size in Le Sueur
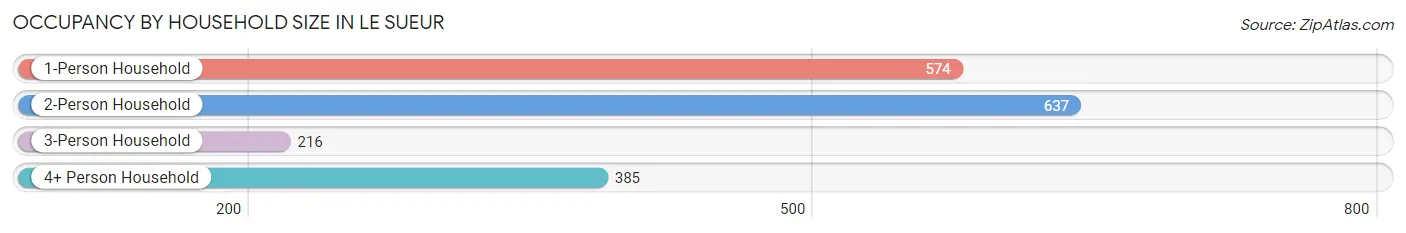
| Household Size | # Housing Units | % Housing Units |
| 1-Person Household | 574 | 31.7% |
| 2-Person Household | 637 | 35.1% |
| 3-Person Household | 216 | 11.9% |
| 4+ Person Household | 385 | 21.2% |
| Total Housing Units | 1,812 | 100.0% |
Occupancy by Ownership by Household Size in Le Sueur
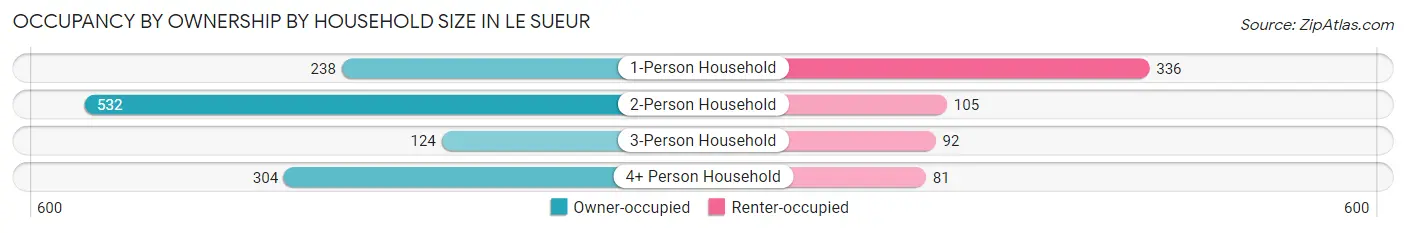
| Household Size | Owner-occupied | Renter-occupied |
| 1-Person Household | 238 (41.5%) | 336 (58.5%) |
| 2-Person Household | 532 (83.5%) | 105 (16.5%) |
| 3-Person Household | 124 (57.4%) | 92 (42.6%) |
| 4+ Person Household | 304 (79.0%) | 81 (21.0%) |
| Total Housing Units | 1,198 (66.1%) | 614 (33.9%) |
Occupancy by Educational Attainment in Le Sueur
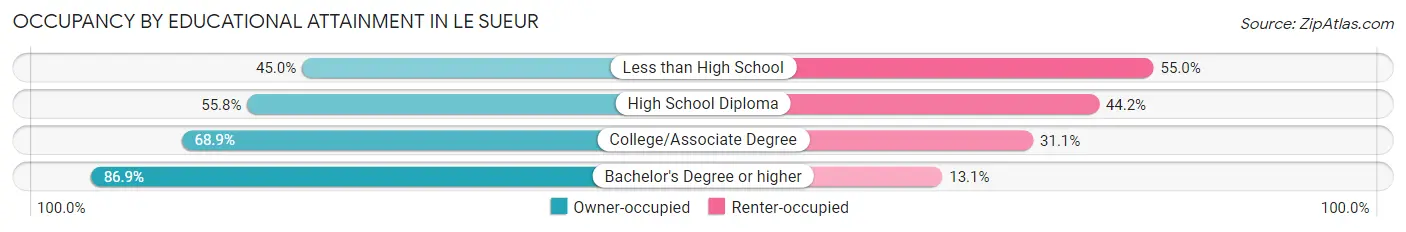
| Household Size | Owner-occupied | Renter-occupied |
| Less than High School | 36 (45.0%) | 44 (55.0%) |
| High School Diploma | 368 (55.8%) | 291 (44.2%) |
| College/Associate Degree | 529 (68.9%) | 239 (31.1%) |
| Bachelor's Degree or higher | 265 (86.9%) | 40 (13.1%) |
Occupancy by Age of Householder in Le Sueur
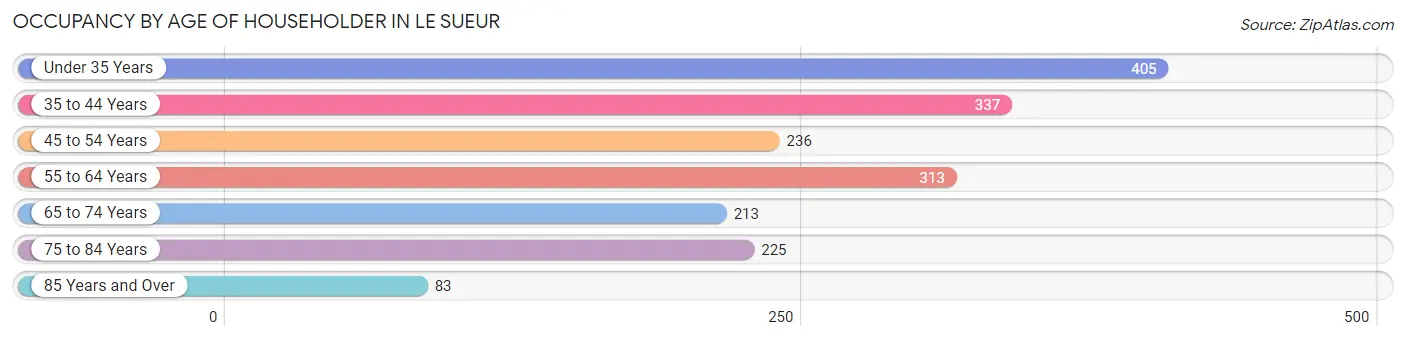
| Age Bracket | # Households | % Households |
| Under 35 Years | 405 | 22.4% |
| 35 to 44 Years | 337 | 18.6% |
| 45 to 54 Years | 236 | 13.0% |
| 55 to 64 Years | 313 | 17.3% |
| 65 to 74 Years | 213 | 11.7% |
| 75 to 84 Years | 225 | 12.4% |
| 85 Years and Over | 83 | 4.6% |
| Total | 1,812 | 100.0% |
Housing Finances in Le Sueur
Median Income by Occupancy in Le Sueur
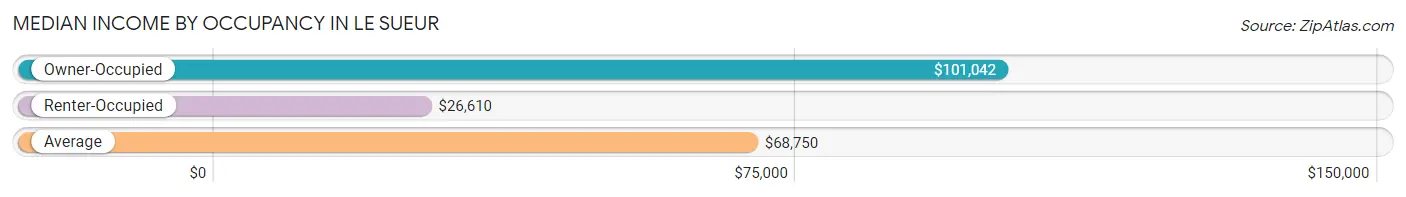
| Occupancy Type | # Households | Median Income |
| Owner-Occupied | 1,198 (66.1%) | $101,042 |
| Renter-Occupied | 614 (33.9%) | $26,610 |
| Average | 1,812 (100.0%) | $68,750 |
Occupancy by Householder Income Bracket in Le Sueur
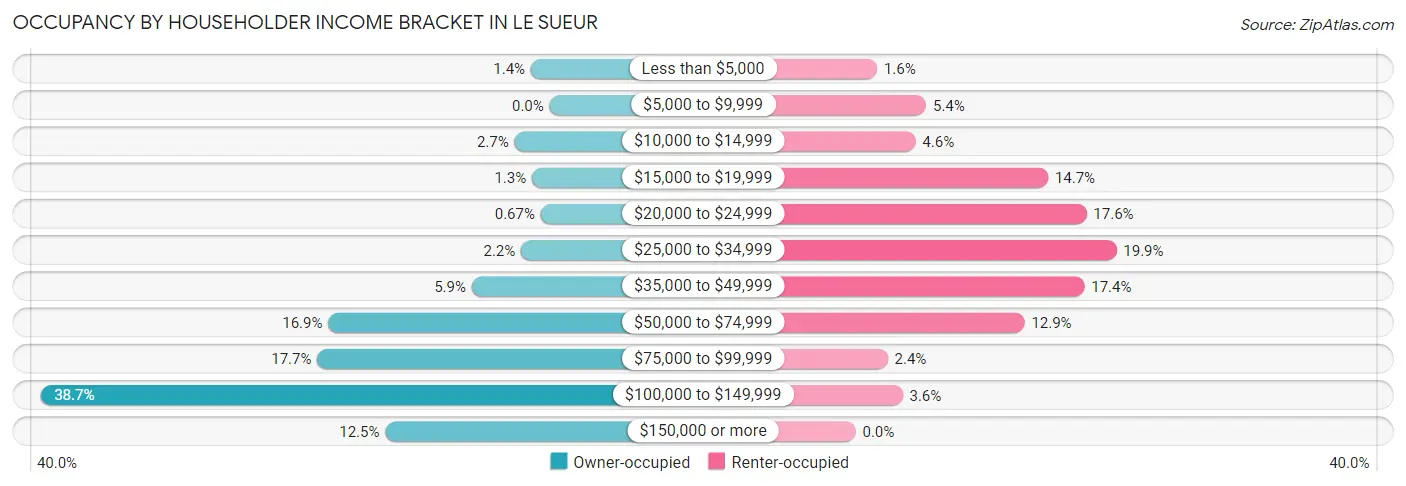
| Income Bracket | Owner-occupied | Renter-occupied |
| Less than $5,000 | 17 (1.4%) | 10 (1.6%) |
| $5,000 to $9,999 | 0 (0.0%) | 33 (5.4%) |
| $10,000 to $14,999 | 32 (2.7%) | 28 (4.6%) |
| $15,000 to $19,999 | 16 (1.3%) | 90 (14.7%) |
| $20,000 to $24,999 | 8 (0.7%) | 108 (17.6%) |
| $25,000 to $34,999 | 26 (2.2%) | 122 (19.9%) |
| $35,000 to $49,999 | 71 (5.9%) | 107 (17.4%) |
| $50,000 to $74,999 | 202 (16.9%) | 79 (12.9%) |
| $75,000 to $99,999 | 212 (17.7%) | 15 (2.4%) |
| $100,000 to $149,999 | 464 (38.7%) | 22 (3.6%) |
| $150,000 or more | 150 (12.5%) | 0 (0.0%) |
| Total | 1,198 (100.0%) | 614 (100.0%) |
Monthly Housing Cost Tiers in Le Sueur
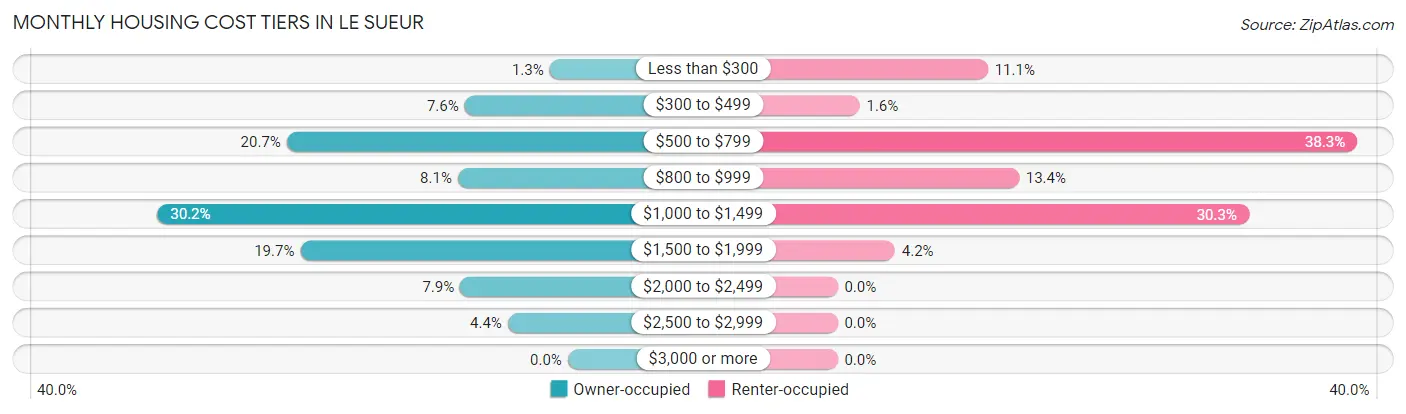
| Monthly Cost | Owner-occupied | Renter-occupied |
| Less than $300 | 16 (1.3%) | 68 (11.1%) |
| $300 to $499 | 91 (7.6%) | 10 (1.6%) |
| $500 to $799 | 248 (20.7%) | 235 (38.3%) |
| $800 to $999 | 97 (8.1%) | 82 (13.4%) |
| $1,000 to $1,499 | 362 (30.2%) | 186 (30.3%) |
| $1,500 to $1,999 | 236 (19.7%) | 26 (4.2%) |
| $2,000 to $2,499 | 95 (7.9%) | 0 (0.0%) |
| $2,500 to $2,999 | 53 (4.4%) | 0 (0.0%) |
| $3,000 or more | 0 (0.0%) | 0 (0.0%) |
| Total | 1,198 (100.0%) | 614 (100.0%) |
Physical Housing Characteristics in Le Sueur
Housing Structures in Le Sueur
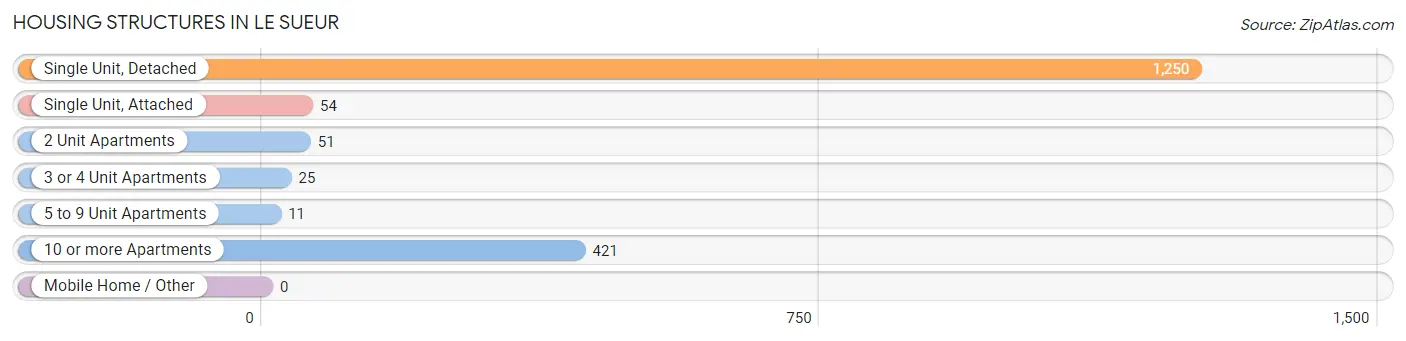
| Structure Type | # Housing Units | % Housing Units |
| Single Unit, Detached | 1,250 | 69.0% |
| Single Unit, Attached | 54 | 3.0% |
| 2 Unit Apartments | 51 | 2.8% |
| 3 or 4 Unit Apartments | 25 | 1.4% |
| 5 to 9 Unit Apartments | 11 | 0.6% |
| 10 or more Apartments | 421 | 23.2% |
| Mobile Home / Other | 0 | 0.0% |
| Total | 1,812 | 100.0% |
Housing Structures by Occupancy in Le Sueur
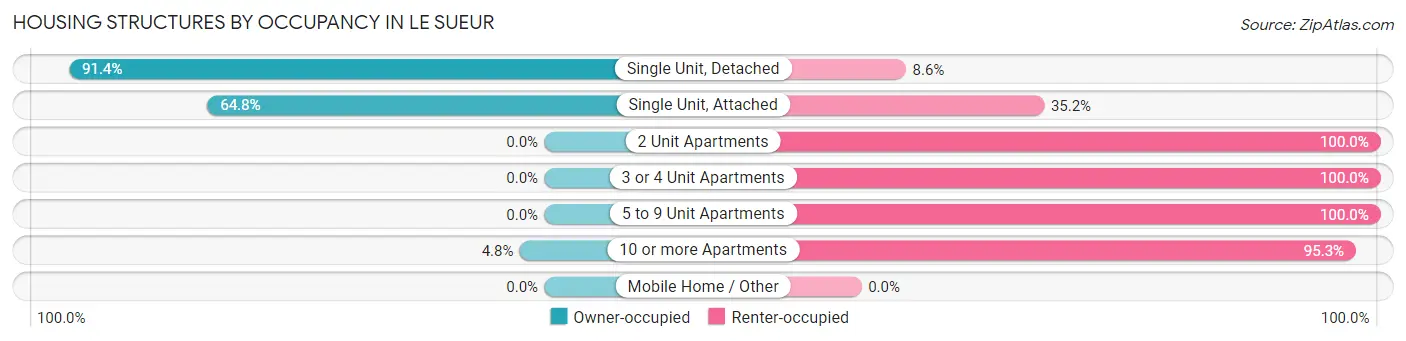
| Structure Type | Owner-occupied | Renter-occupied |
| Single Unit, Detached | 1,143 (91.4%) | 107 (8.6%) |
| Single Unit, Attached | 35 (64.8%) | 19 (35.2%) |
| 2 Unit Apartments | 0 (0.0%) | 51 (100.0%) |
| 3 or 4 Unit Apartments | 0 (0.0%) | 25 (100.0%) |
| 5 to 9 Unit Apartments | 0 (0.0%) | 11 (100.0%) |
| 10 or more Apartments | 20 (4.8%) | 401 (95.3%) |
| Mobile Home / Other | 0 (0.0%) | 0 (0.0%) |
| Total | 1,198 (66.1%) | 614 (33.9%) |
Housing Structures by Number of Rooms in Le Sueur
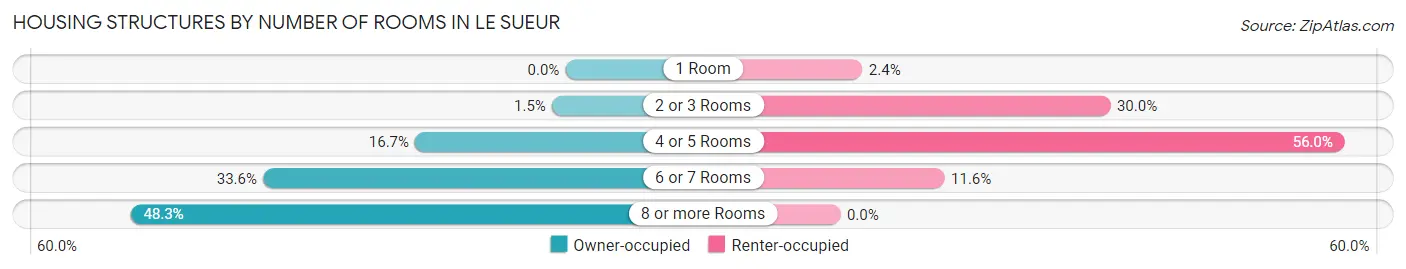
| Number of Rooms | Owner-occupied | Renter-occupied |
| 1 Room | 0 (0.0%) | 15 (2.4%) |
| 2 or 3 Rooms | 18 (1.5%) | 184 (30.0%) |
| 4 or 5 Rooms | 200 (16.7%) | 344 (56.0%) |
| 6 or 7 Rooms | 402 (33.6%) | 71 (11.6%) |
| 8 or more Rooms | 578 (48.2%) | 0 (0.0%) |
| Total | 1,198 (100.0%) | 614 (100.0%) |
Housing Structure by Heating Type in Le Sueur
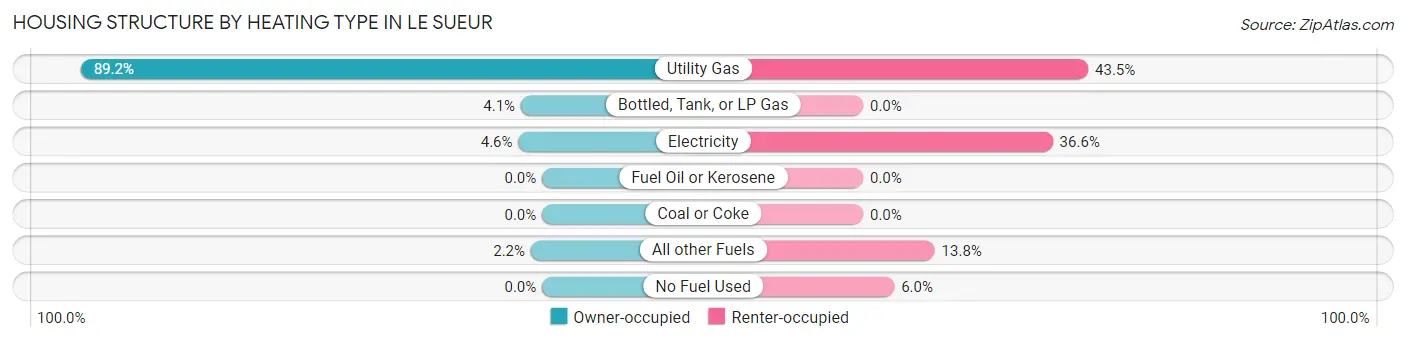
| Heating Type | Owner-occupied | Renter-occupied |
| Utility Gas | 1,068 (89.1%) | 267 (43.5%) |
| Bottled, Tank, or LP Gas | 49 (4.1%) | 0 (0.0%) |
| Electricity | 55 (4.6%) | 225 (36.6%) |
| Fuel Oil or Kerosene | 0 (0.0%) | 0 (0.0%) |
| Coal or Coke | 0 (0.0%) | 0 (0.0%) |
| All other Fuels | 26 (2.2%) | 85 (13.8%) |
| No Fuel Used | 0 (0.0%) | 37 (6.0%) |
| Total | 1,198 (100.0%) | 614 (100.0%) |
Household Vehicle Usage in Le Sueur
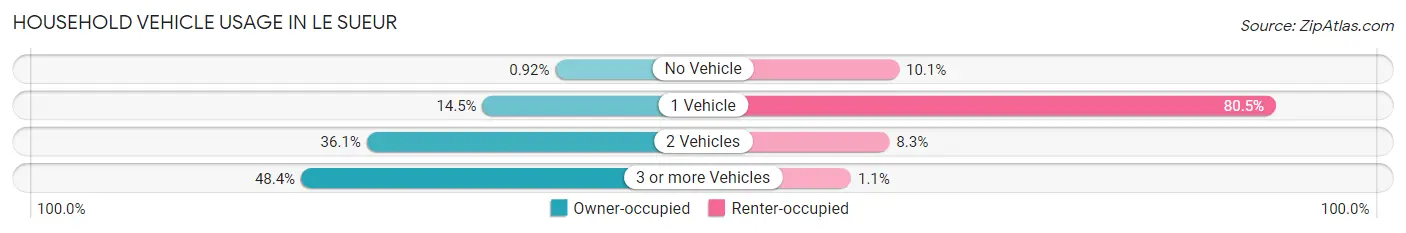
| Vehicles per Household | Owner-occupied | Renter-occupied |
| No Vehicle | 11 (0.9%) | 62 (10.1%) |
| 1 Vehicle | 174 (14.5%) | 494 (80.5%) |
| 2 Vehicles | 433 (36.1%) | 51 (8.3%) |
| 3 or more Vehicles | 580 (48.4%) | 7 (1.1%) |
| Total | 1,198 (100.0%) | 614 (100.0%) |
Real Estate & Mortgages in Le Sueur
Real Estate and Mortgage Overview in Le Sueur
| Characteristic | Without Mortgage | With Mortgage |
| Housing Units | 425 | 773 |
| Median Property Value | $259,000 | $191,800 |
| Median Household Income | $91,107 | $109 |
| Monthly Housing Costs | $700 | $0 |
| Real Estate Taxes | $2,791 | $26 |
Property Value by Mortgage Status in Le Sueur
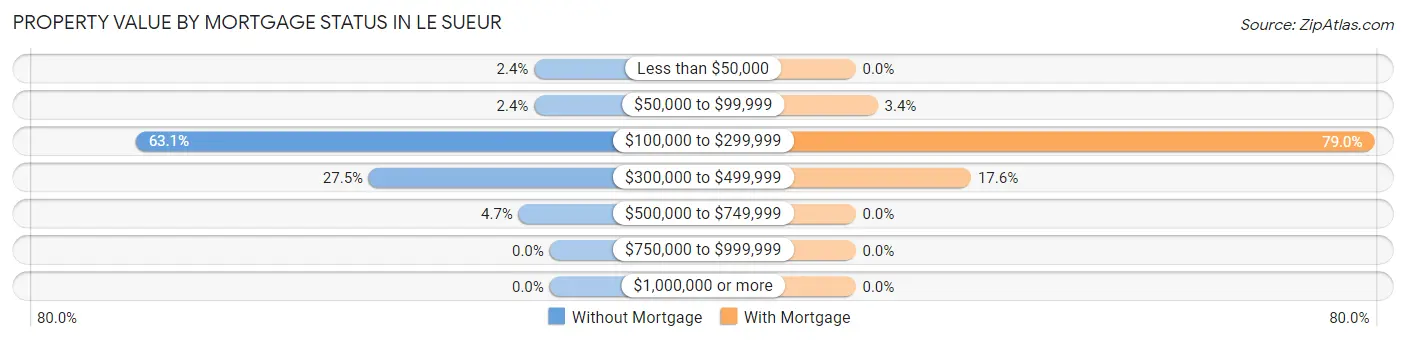
| Property Value | Without Mortgage | With Mortgage |
| Less than $50,000 | 10 (2.4%) | 0 (0.0%) |
| $50,000 to $99,999 | 10 (2.4%) | 26 (3.4%) |
| $100,000 to $299,999 | 268 (63.1%) | 611 (79.0%) |
| $300,000 to $499,999 | 117 (27.5%) | 136 (17.6%) |
| $500,000 to $749,999 | 20 (4.7%) | 0 (0.0%) |
| $750,000 to $999,999 | 0 (0.0%) | 0 (0.0%) |
| $1,000,000 or more | 0 (0.0%) | 0 (0.0%) |
| Total | 425 (100.0%) | 773 (100.0%) |
Household Income by Mortgage Status in Le Sueur
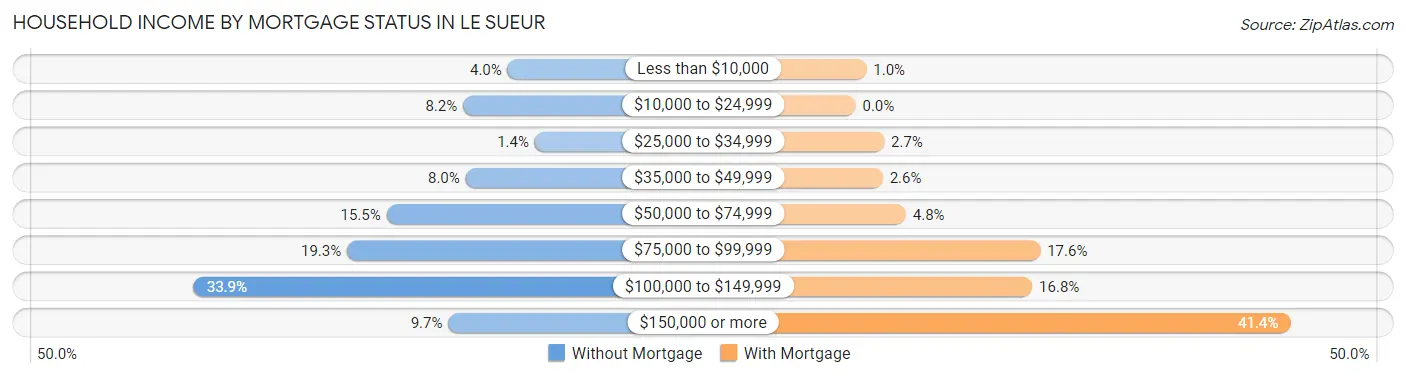
| Household Income | Without Mortgage | With Mortgage |
| Less than $10,000 | 17 (4.0%) | 8 (1.0%) |
| $10,000 to $24,999 | 35 (8.2%) | 0 (0.0%) |
| $25,000 to $34,999 | 6 (1.4%) | 21 (2.7%) |
| $35,000 to $49,999 | 34 (8.0%) | 20 (2.6%) |
| $50,000 to $74,999 | 66 (15.5%) | 37 (4.8%) |
| $75,000 to $99,999 | 82 (19.3%) | 136 (17.6%) |
| $100,000 to $149,999 | 144 (33.9%) | 130 (16.8%) |
| $150,000 or more | 41 (9.7%) | 320 (41.4%) |
| Total | 425 (100.0%) | 773 (100.0%) |
Property Value to Household Income Ratio in Le Sueur
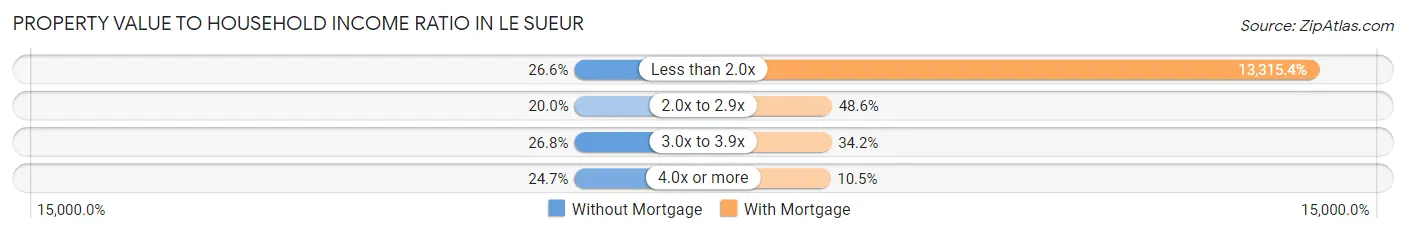
| Value-to-Income Ratio | Without Mortgage | With Mortgage |
| Less than 2.0x | 113 (26.6%) | 102,928 (13,315.4%) |
| 2.0x to 2.9x | 85 (20.0%) | 376 (48.6%) |
| 3.0x to 3.9x | 114 (26.8%) | 264 (34.2%) |
| 4.0x or more | 105 (24.7%) | 81 (10.5%) |
| Total | 425 (100.0%) | 773 (100.0%) |
Real Estate Taxes by Mortgage Status in Le Sueur
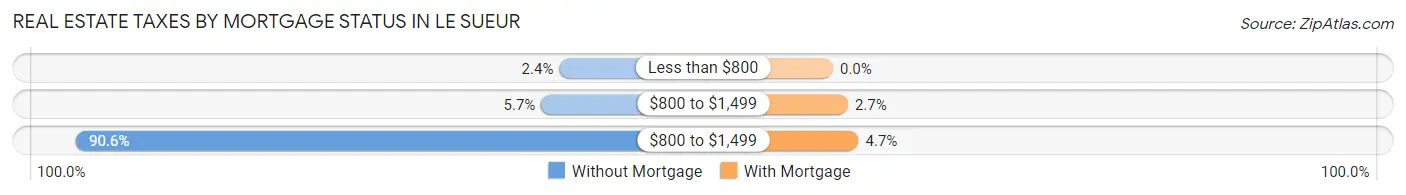
| Property Taxes | Without Mortgage | With Mortgage |
| Less than $800 | 10 (2.4%) | 0 (0.0%) |
| $800 to $1,499 | 24 (5.7%) | 21 (2.7%) |
| $800 to $1,499 | 385 (90.6%) | 36 (4.7%) |
| Total | 425 (100.0%) | 773 (100.0%) |
Health & Disability in Le Sueur
Health Insurance Coverage by Age in Le Sueur
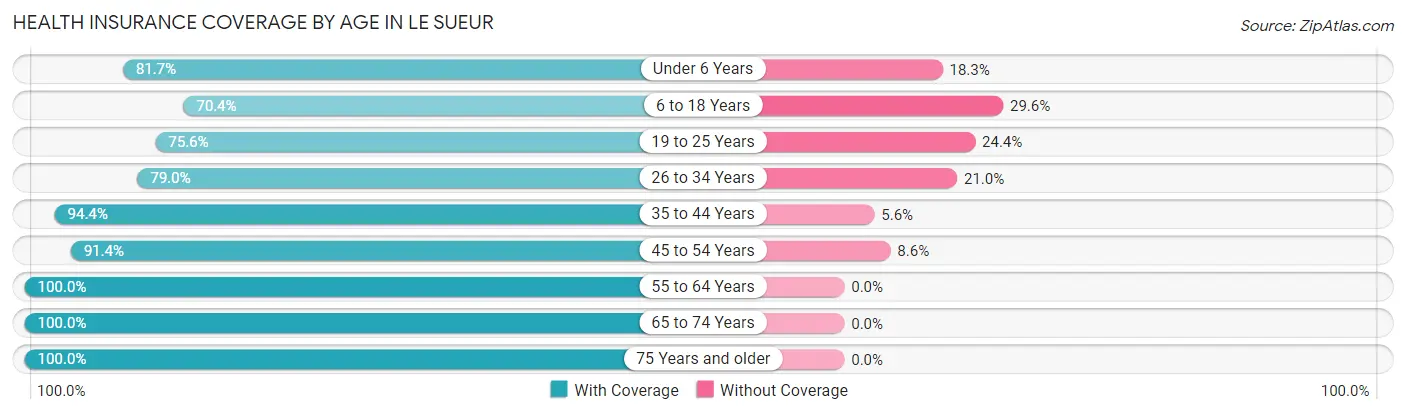
| Age Bracket | With Coverage | Without Coverage |
| Under 6 Years | 312 (81.7%) | 70 (18.3%) |
| 6 to 18 Years | 473 (70.4%) | 199 (29.6%) |
| 19 to 25 Years | 186 (75.6%) | 60 (24.4%) |
| 26 to 34 Years | 428 (79.0%) | 114 (21.0%) |
| 35 to 44 Years | 506 (94.4%) | 30 (5.6%) |
| 45 to 54 Years | 425 (91.4%) | 40 (8.6%) |
| 55 to 64 Years | 507 (100.0%) | 0 (0.0%) |
| 65 to 74 Years | 343 (100.0%) | 0 (0.0%) |
| 75 Years and older | 429 (100.0%) | 0 (0.0%) |
| Total | 3,609 (87.5%) | 513 (12.4%) |
Health Insurance Coverage by Citizenship Status in Le Sueur
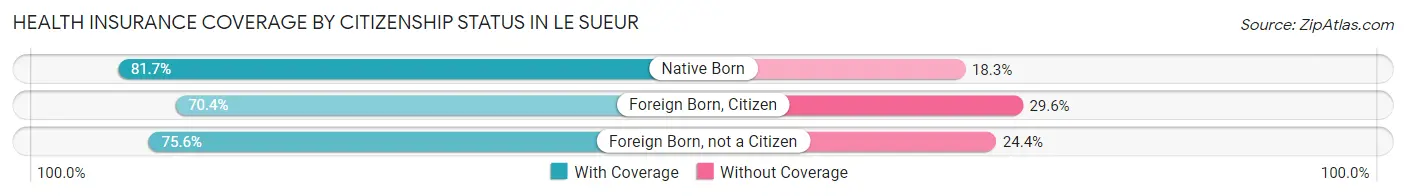
| Citizenship Status | With Coverage | Without Coverage |
| Native Born | 312 (81.7%) | 70 (18.3%) |
| Foreign Born, Citizen | 473 (70.4%) | 199 (29.6%) |
| Foreign Born, not a Citizen | 186 (75.6%) | 60 (24.4%) |
Health Insurance Coverage by Household Income in Le Sueur
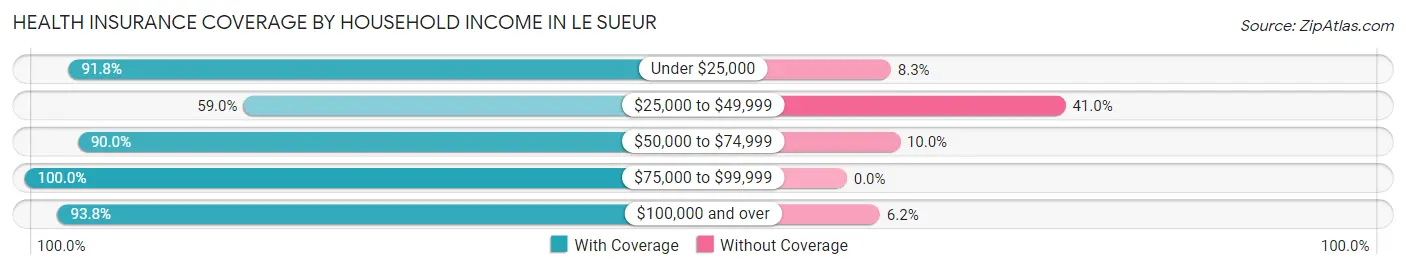
| Household Income | With Coverage | Without Coverage |
| Under $25,000 | 367 (91.7%) | 33 (8.3%) |
| $25,000 to $49,999 | 448 (59.0%) | 311 (41.0%) |
| $50,000 to $74,999 | 434 (90.0%) | 48 (10.0%) |
| $75,000 to $99,999 | 530 (100.0%) | 0 (0.0%) |
| $100,000 and over | 1,830 (93.8%) | 121 (6.2%) |
Public vs Private Health Insurance Coverage by Age in Le Sueur
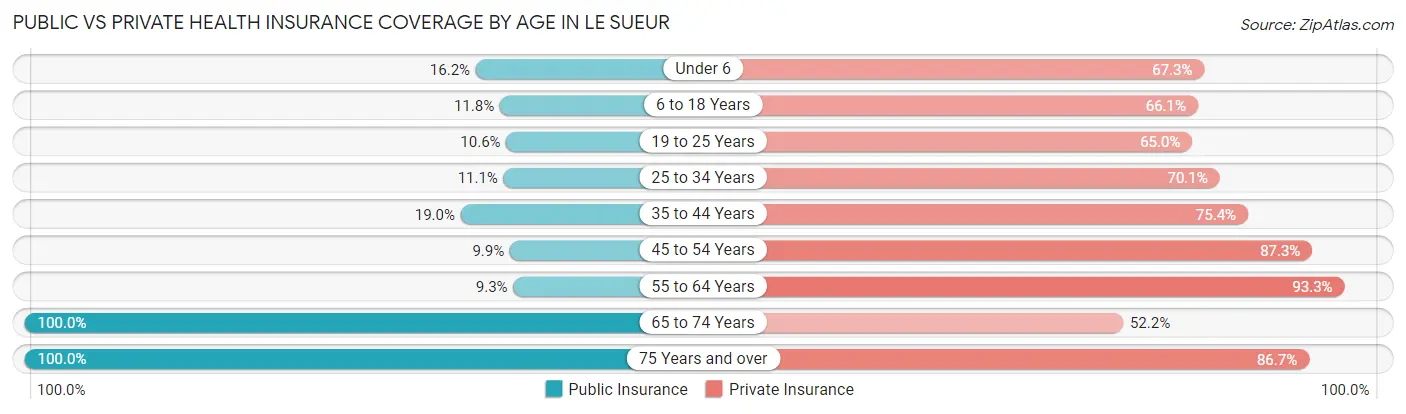
| Age Bracket | Public Insurance | Private Insurance |
| Under 6 | 62 (16.2%) | 257 (67.3%) |
| 6 to 18 Years | 79 (11.8%) | 444 (66.1%) |
| 19 to 25 Years | 26 (10.6%) | 160 (65.0%) |
| 25 to 34 Years | 60 (11.1%) | 380 (70.1%) |
| 35 to 44 Years | 102 (19.0%) | 404 (75.4%) |
| 45 to 54 Years | 46 (9.9%) | 406 (87.3%) |
| 55 to 64 Years | 47 (9.3%) | 473 (93.3%) |
| 65 to 74 Years | 343 (100.0%) | 179 (52.2%) |
| 75 Years and over | 429 (100.0%) | 372 (86.7%) |
| Total | 1,194 (29.0%) | 3,075 (74.6%) |
Disability Status by Sex by Age in Le Sueur
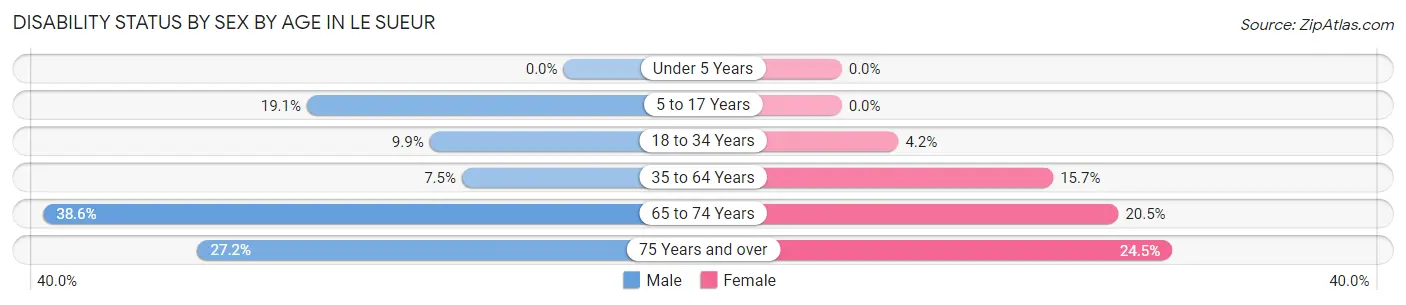
| Age Bracket | Male | Female |
| Under 5 Years | 0 (0.0%) | 0 (0.0%) |
| 5 to 17 Years | 60 (19.1%) | 0 (0.0%) |
| 18 to 34 Years | 33 (9.9%) | 22 (4.2%) |
| 35 to 64 Years | 59 (7.5%) | 114 (15.7%) |
| 65 to 74 Years | 61 (38.6%) | 38 (20.5%) |
| 75 Years and over | 60 (27.2%) | 51 (24.5%) |
Disability Class by Sex by Age in Le Sueur
Disability Class: Hearing Difficulty
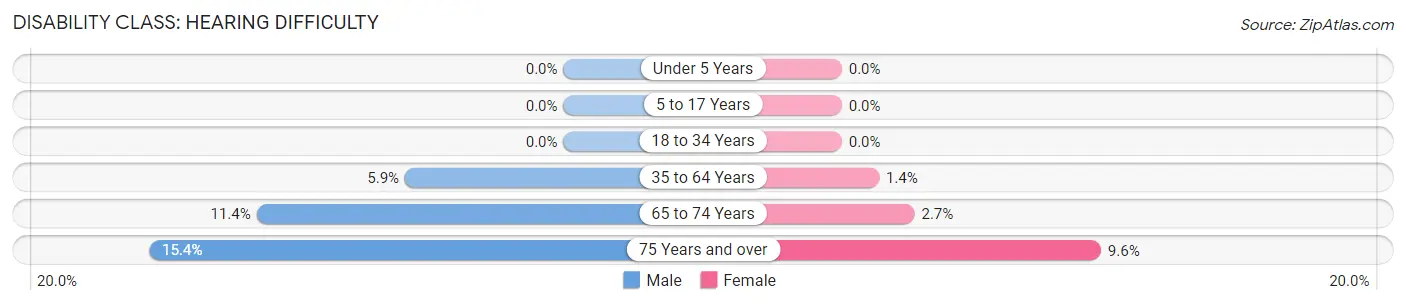
| Age Bracket | Male | Female |
| Under 5 Years | 0 (0.0%) | 0 (0.0%) |
| 5 to 17 Years | 0 (0.0%) | 0 (0.0%) |
| 18 to 34 Years | 0 (0.0%) | 0 (0.0%) |
| 35 to 64 Years | 46 (5.9%) | 10 (1.4%) |
| 65 to 74 Years | 18 (11.4%) | 5 (2.7%) |
| 75 Years and over | 34 (15.4%) | 20 (9.6%) |
Disability Class: Vision Difficulty
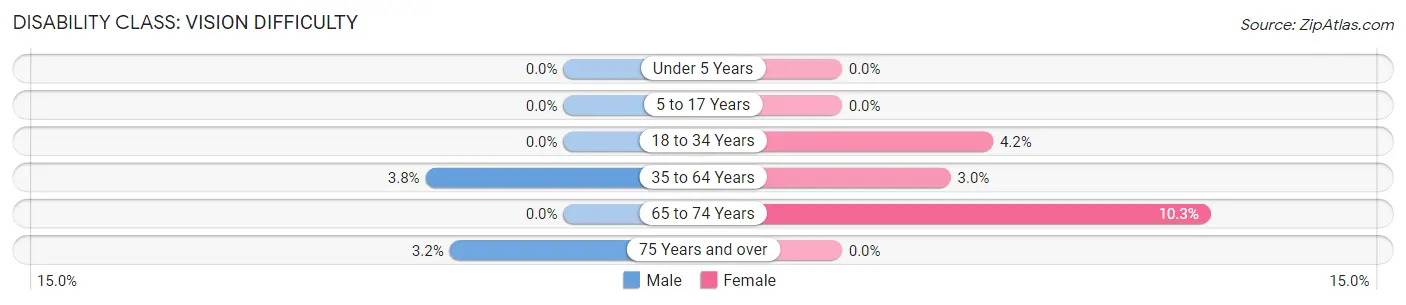
| Age Bracket | Male | Female |
| Under 5 Years | 0 (0.0%) | 0 (0.0%) |
| 5 to 17 Years | 0 (0.0%) | 0 (0.0%) |
| 18 to 34 Years | 0 (0.0%) | 22 (4.2%) |
| 35 to 64 Years | 30 (3.8%) | 22 (3.0%) |
| 65 to 74 Years | 0 (0.0%) | 19 (10.3%) |
| 75 Years and over | 7 (3.2%) | 0 (0.0%) |
Disability Class: Cognitive Difficulty
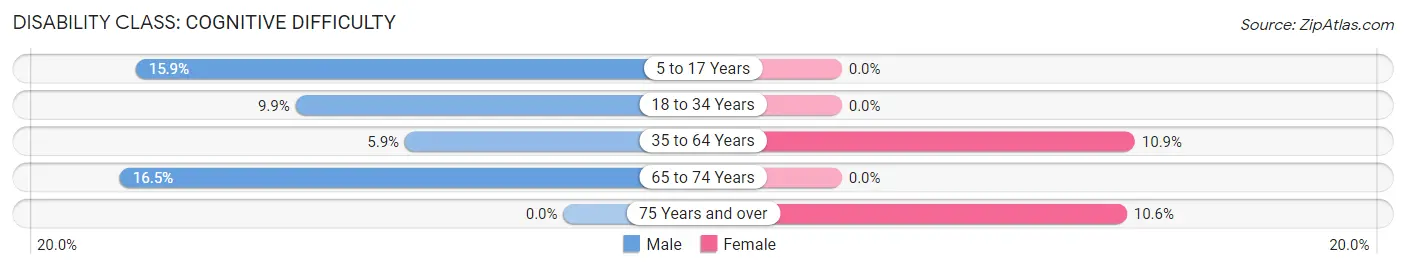
| Age Bracket | Male | Female |
| 5 to 17 Years | 50 (15.9%) | 0 (0.0%) |
| 18 to 34 Years | 33 (9.9%) | 0 (0.0%) |
| 35 to 64 Years | 46 (5.9%) | 79 (10.9%) |
| 65 to 74 Years | 26 (16.5%) | 0 (0.0%) |
| 75 Years and over | 0 (0.0%) | 22 (10.6%) |
Disability Class: Ambulatory Difficulty
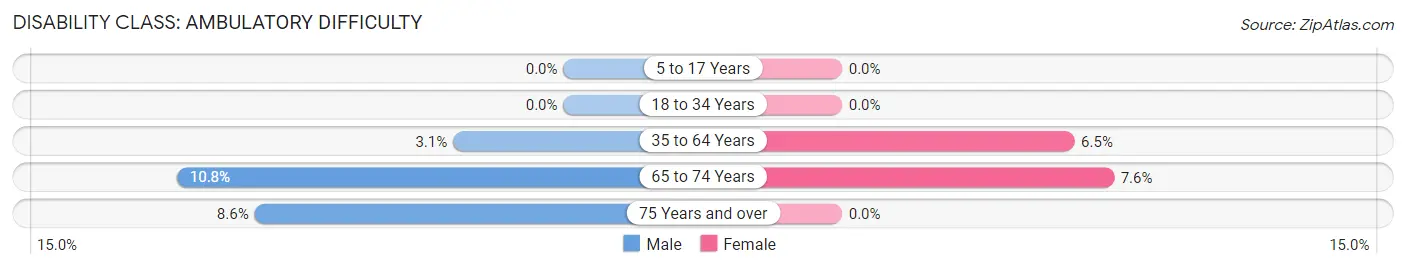
| Age Bracket | Male | Female |
| 5 to 17 Years | 0 (0.0%) | 0 (0.0%) |
| 18 to 34 Years | 0 (0.0%) | 0 (0.0%) |
| 35 to 64 Years | 24 (3.1%) | 47 (6.5%) |
| 65 to 74 Years | 17 (10.8%) | 14 (7.6%) |
| 75 Years and over | 19 (8.6%) | 0 (0.0%) |
Disability Class: Self-Care Difficulty
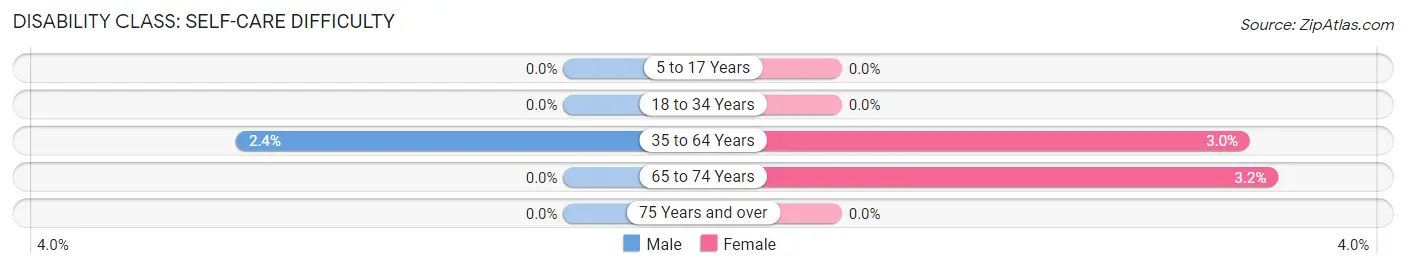
| Age Bracket | Male | Female |
| 5 to 17 Years | 0 (0.0%) | 0 (0.0%) |
| 18 to 34 Years | 0 (0.0%) | 0 (0.0%) |
| 35 to 64 Years | 19 (2.4%) | 22 (3.0%) |
| 65 to 74 Years | 0 (0.0%) | 6 (3.2%) |
| 75 Years and over | 0 (0.0%) | 0 (0.0%) |
Technology Access in Le Sueur
Computing Device Access in Le Sueur
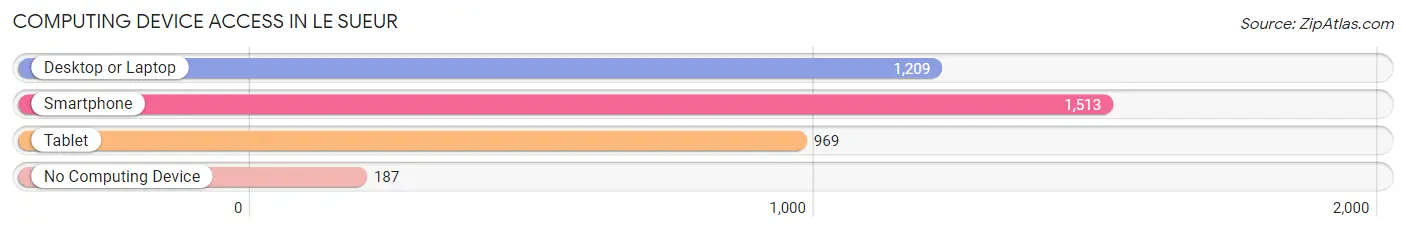
| Device Type | # Households | % Households |
| Desktop or Laptop | 1,209 | 66.7% |
| Smartphone | 1,513 | 83.5% |
| Tablet | 969 | 53.5% |
| No Computing Device | 187 | 10.3% |
| Total | 1,812 | 100.0% |
Internet Access in Le Sueur
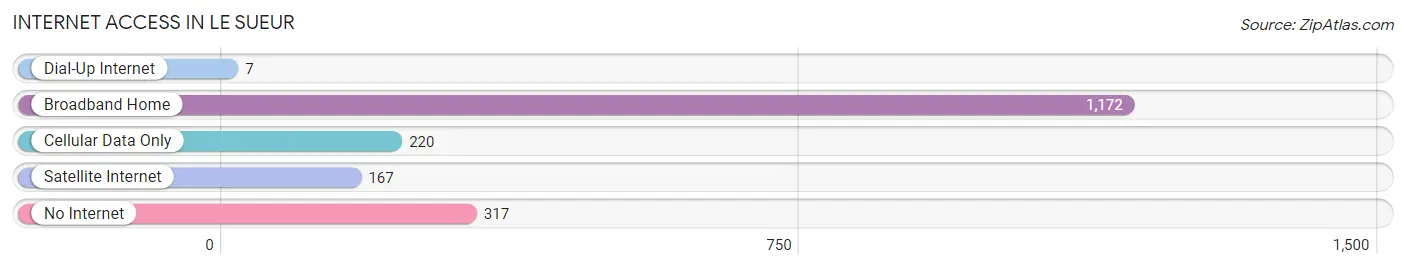
| Internet Type | # Households | % Households |
| Dial-Up Internet | 7 | 0.4% |
| Broadband Home | 1,172 | 64.7% |
| Cellular Data Only | 220 | 12.1% |
| Satellite Internet | 167 | 9.2% |
| No Internet | 317 | 17.5% |
| Total | 1,812 | 100.0% |
Le Sueur Summary
Sueur County, Minnesota is located in the south central part of the state, and is bordered by Rice County to the north, Blue Earth County to the east, Waseca County to the south, and Scott County to the west. The county seat is Le Sueur, which is located on the banks of the Minnesota River. The county was established in 1853 and named after Pierre-Charles Le Sueur, a French explorer who explored the area in the late 1600s.
Geography
Sueur County is located in the south central part of Minnesota, and is bordered by Rice County to the north, Blue Earth County to the east, Waseca County to the south, and Scott County to the west. The county has a total area of 576 square miles, of which 571 square miles is land and 5 square miles is water. The county is mostly flat, with rolling hills in the northern and western parts. The Minnesota River flows through the county, and there are several small lakes and streams. The highest point in the county is located in the northwest corner, at an elevation of 1,092 feet.
The county is divided into two distinct regions: the Minnesota River Valley and the Prairie. The Minnesota River Valley is located in the eastern part of the county, and is characterized by rolling hills and wooded areas. The Prairie is located in the western part of the county, and is characterized by flat, open land.
History
Sueur County was established in 1853 and named after Pierre-Charles Le Sueur, a French explorer who explored the area in the late 1600s. The county was originally inhabited by the Dakota and Ojibwe Native American tribes. The first settlers arrived in the area in the early 1800s, and the county was organized in 1853.
The county was initially an agricultural area, with the main crops being wheat, corn, and oats. In the late 1800s, the county began to industrialize, with the establishment of several factories and mills. The county also became a popular tourist destination, with several resorts and hotels being built in the area.
Economy
Sueur County’s economy is largely based on agriculture and manufacturing. The county is home to several large agricultural operations, including dairy farms, beef farms, and grain farms. The county is also home to several large manufacturing companies, including a steel mill, a paper mill, and a plastics factory.
The county also has a thriving tourism industry, with several resorts and hotels located in the area. The county is also home to several state parks, including the Minnesota Valley State Recreation Area and the Sakatah Lake State Park.
Demographics
As of the 2010 census, Sueur County had a population of 26,898. The population was spread out, with 24.3% under the age of 18, 8.2% from 18 to 24, 28.2% from 25 to 44, 24.3% from 45 to 64, and 14.0% who were 65 years of age or older. The median age was 38.4 years.
The median income for a household in the county was $50,945, and the median income for a family was $60,945. The per capita income for the county was $25,945. About 8.2% of families and 10.3% of the population were below the poverty line, including 14.2% of those under age 18 and 6.2% of those age 65 or over.
The racial makeup of the county was 95.2% White, 0.7% African American, 0.3% Native American, 0.7% Asian, 0.1% Pacific Islander, 1.7% from other races, and 1.2% from two or more races. Hispanic or Latino of any race were 3.2% of the population.
Common Questions
What is Per Capita Income in Le Sueur?
Per Capita income in Le Sueur is $35,484.
What is the Median Family Income in Le Sueur?
Median Family Income in Le Sueur is $101,875.
What is the Median Household income in Le Sueur?
Median Household Income in Le Sueur is $68,750.
What is Income or Wage Gap in Le Sueur?
Income or Wage Gap in Le Sueur is 52.9%.
Women in Le Sueur earn 47.1 cents for every dollar earned by a man.
What is Inequality or Gini Index in Le Sueur?
Inequality or Gini Index in Le Sueur is 0.38.
What is the Total Population of Le Sueur?
Total Population of Le Sueur is 4,210.
What is the Total Male Population of Le Sueur?
Total Male Population of Le Sueur is 2,009.
What is the Total Female Population of Le Sueur?
Total Female Population of Le Sueur is 2,201.
What is the Ratio of Males per 100 Females in Le Sueur?
There are 91.28 Males per 100 Females in Le Sueur.
What is the Ratio of Females per 100 Males in Le Sueur?
There are 109.56 Females per 100 Males in Le Sueur.
What is the Median Population Age in Le Sueur?
Median Population Age in Le Sueur is 38.4 Years.
What is the Average Family Size in Le Sueur
Average Family Size in Le Sueur is 2.9 People.
What is the Average Household Size in Le Sueur
Average Household Size in Le Sueur is 2.3 People.
How Large is the Labor Force in Le Sueur?
There are 2,294 People in the Labor Forcein in Le Sueur.
What is the Percentage of People in the Labor Force in Le Sueur?
70.1% of People are in the Labor Force in Le Sueur.
What is the Unemployment Rate in Le Sueur?
Unemployment Rate in Le Sueur is 0.3%.