Scanlon, MN Map & Demographics
Scanlon Map
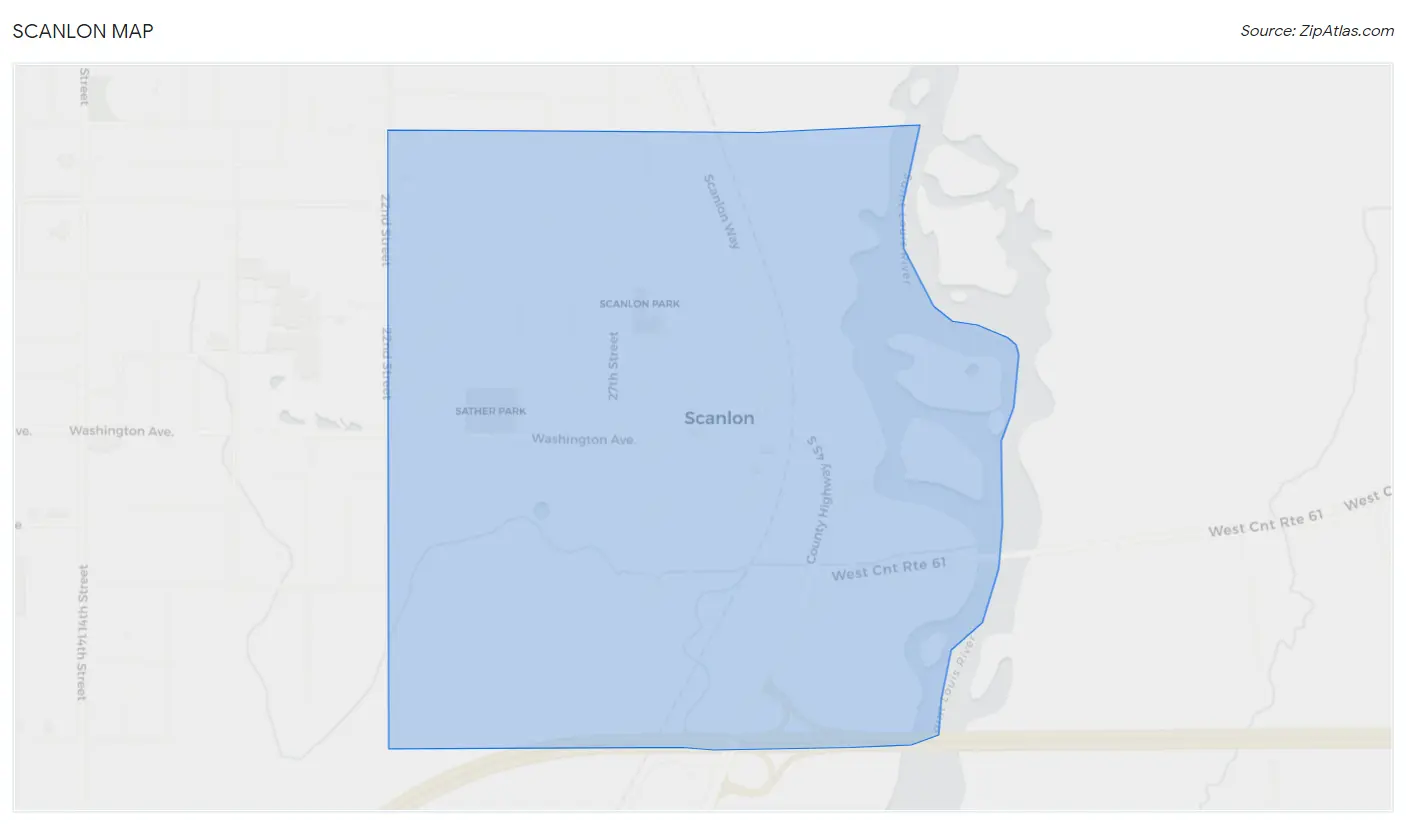
Scanlon Overview
$36,720
PER CAPITA INCOME
$94,063
AVG FAMILY INCOME
$73,125
AVG HOUSEHOLD INCOME
24.7%
WAGE / INCOME GAP [ % ]
75.3¢/ $1
WAGE / INCOME GAP [ $ ]
0.34
INEQUALITY / GINI INDEX
1,047
TOTAL POPULATION
500
MALE POPULATION
547
FEMALE POPULATION
91.41
MALES / 100 FEMALES
109.40
FEMALES / 100 MALES
41.9
MEDIAN AGE
2.9
AVG FAMILY SIZE
2.2
AVG HOUSEHOLD SIZE
572
LABOR FORCE [ PEOPLE ]
66.8%
PERCENT IN LABOR FORCE
8.4%
UNEMPLOYMENT RATE
Income in Scanlon
Income Overview in Scanlon
Per Capita Income in Scanlon is $36,720, while median incomes of families and households are $94,063 and $73,125 respectively.
| Characteristic | Number | Measure |
| Per Capita Income | 1,047 | $36,720 |
| Median Family Income | 264 | $94,063 |
| Mean Family Income | 264 | $103,109 |
| Median Household Income | 461 | $73,125 |
| Mean Household Income | 461 | $82,055 |
| Income Deficit | 264 | $0 |
| Wage / Income Gap (%) | 1,047 | 24.69% |
| Wage / Income Gap ($) | 1,047 | 75.31¢ per $1 |
| Gini / Inequality Index | 1,047 | 0.34 |
Earnings by Sex in Scanlon
Average Earnings in Scanlon are $43,938, $54,688 for men and $41,188 for women, a difference of 24.7%.
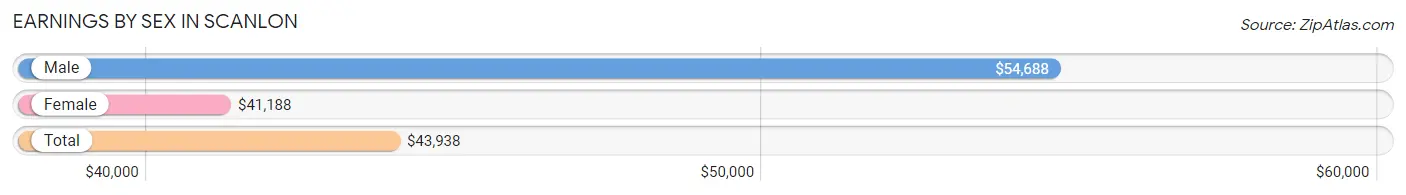
| Sex | Number | Average Earnings |
| Male | 286 (51.9%) | $54,688 |
| Female | 265 (48.1%) | $41,188 |
| Total | 551 (100.0%) | $43,938 |
Earnings by Sex by Income Bracket in Scanlon
The most common earnings brackets in Scanlon are $75,000 to $99,999 for men (59 | 20.6%) and $55,000 to $64,999 for women (38 | 14.3%).
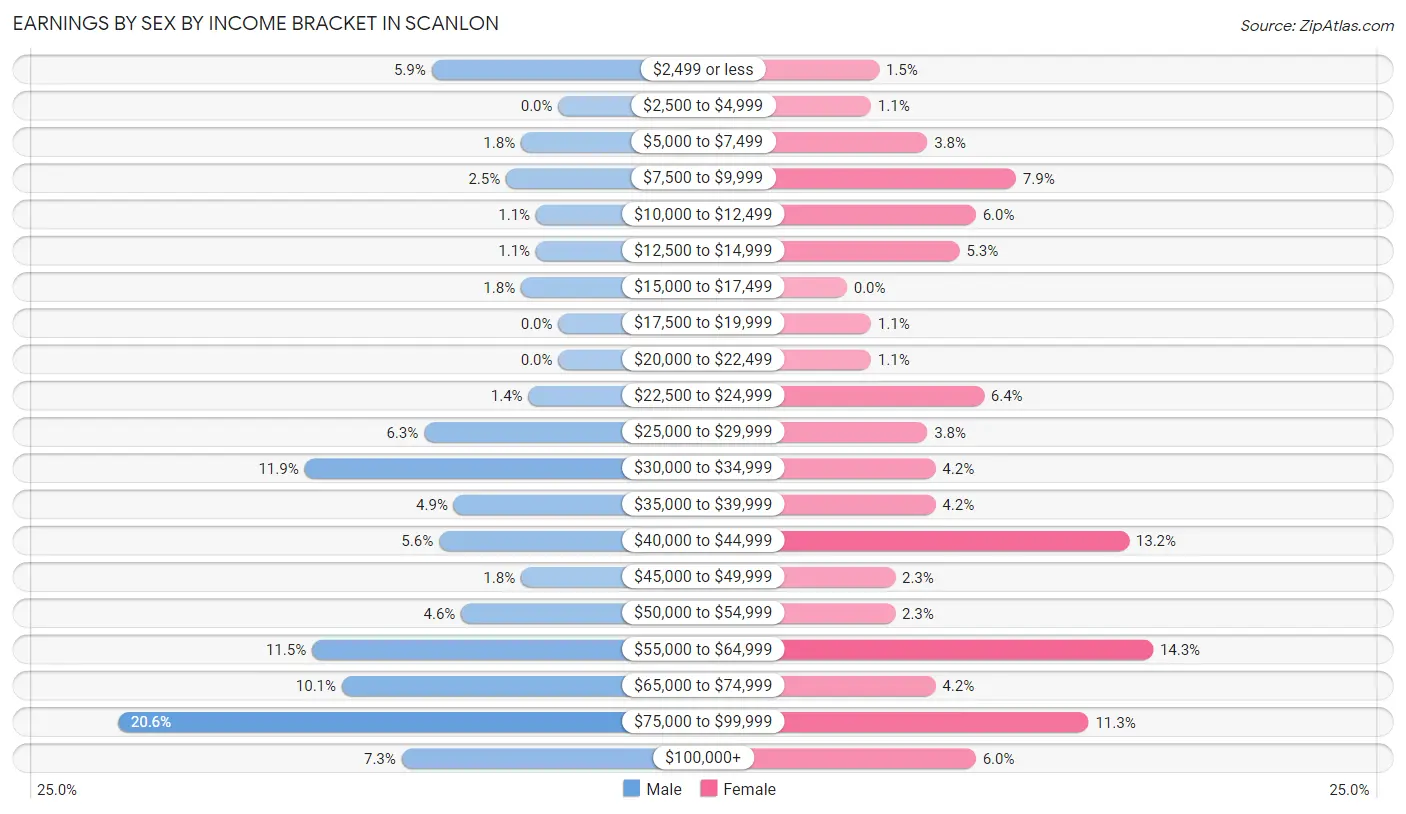
| Income | Male | Female |
| $2,499 or less | 17 (5.9%) | 4 (1.5%) |
| $2,500 to $4,999 | 0 (0.0%) | 3 (1.1%) |
| $5,000 to $7,499 | 5 (1.8%) | 10 (3.8%) |
| $7,500 to $9,999 | 7 (2.5%) | 21 (7.9%) |
| $10,000 to $12,499 | 3 (1.1%) | 16 (6.0%) |
| $12,500 to $14,999 | 3 (1.1%) | 14 (5.3%) |
| $15,000 to $17,499 | 5 (1.8%) | 0 (0.0%) |
| $17,500 to $19,999 | 0 (0.0%) | 3 (1.1%) |
| $20,000 to $22,499 | 0 (0.0%) | 3 (1.1%) |
| $22,500 to $24,999 | 4 (1.4%) | 17 (6.4%) |
| $25,000 to $29,999 | 18 (6.3%) | 10 (3.8%) |
| $30,000 to $34,999 | 34 (11.9%) | 11 (4.2%) |
| $35,000 to $39,999 | 14 (4.9%) | 11 (4.2%) |
| $40,000 to $44,999 | 16 (5.6%) | 35 (13.2%) |
| $45,000 to $49,999 | 5 (1.8%) | 6 (2.3%) |
| $50,000 to $54,999 | 13 (4.5%) | 6 (2.3%) |
| $55,000 to $64,999 | 33 (11.5%) | 38 (14.3%) |
| $65,000 to $74,999 | 29 (10.1%) | 11 (4.2%) |
| $75,000 to $99,999 | 59 (20.6%) | 30 (11.3%) |
| $100,000+ | 21 (7.3%) | 16 (6.0%) |
| Total | 286 (100.0%) | 265 (100.0%) |
Earnings by Sex by Educational Attainment in Scanlon
Average earnings in Scanlon are $61,875 for men and $43,500 for women, a difference of 29.7%. Men with an educational attainment of bachelor's degree enjoy the highest average annual earnings of $83,438, while those with college or associate's degree education earn the least with $46,500. Women with an educational attainment of graduate degree earn the most with the average annual earnings of $73,125, while those with high school diploma education have the smallest earnings of $23,750.
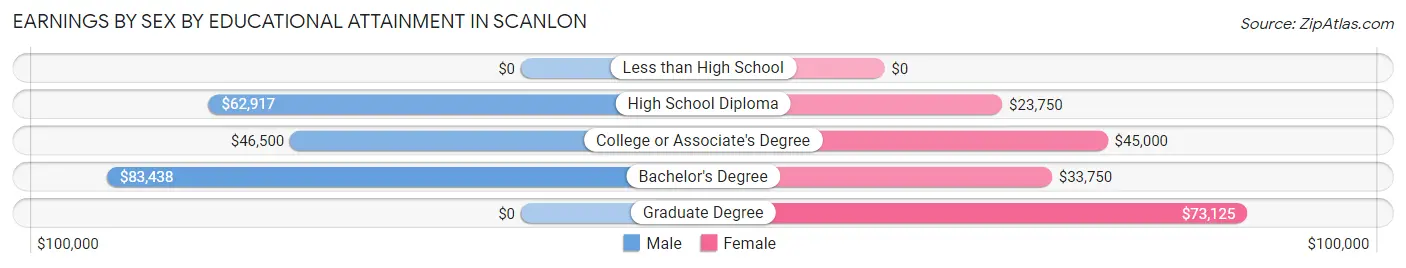
| Educational Attainment | Male Income | Female Income |
| Less than High School | - | - |
| High School Diploma | $62,917 | $23,750 |
| College or Associate's Degree | $46,500 | $45,000 |
| Bachelor's Degree | $83,438 | $33,750 |
| Graduate Degree | - | - |
| Total | $61,875 | $43,500 |
Family Income in Scanlon
Family Income Brackets in Scanlon
According to the Scanlon family income data, there are 85 families falling into the $100,000 to $149,999 income range, which is the most common income bracket and makes up 32.2% of all families.
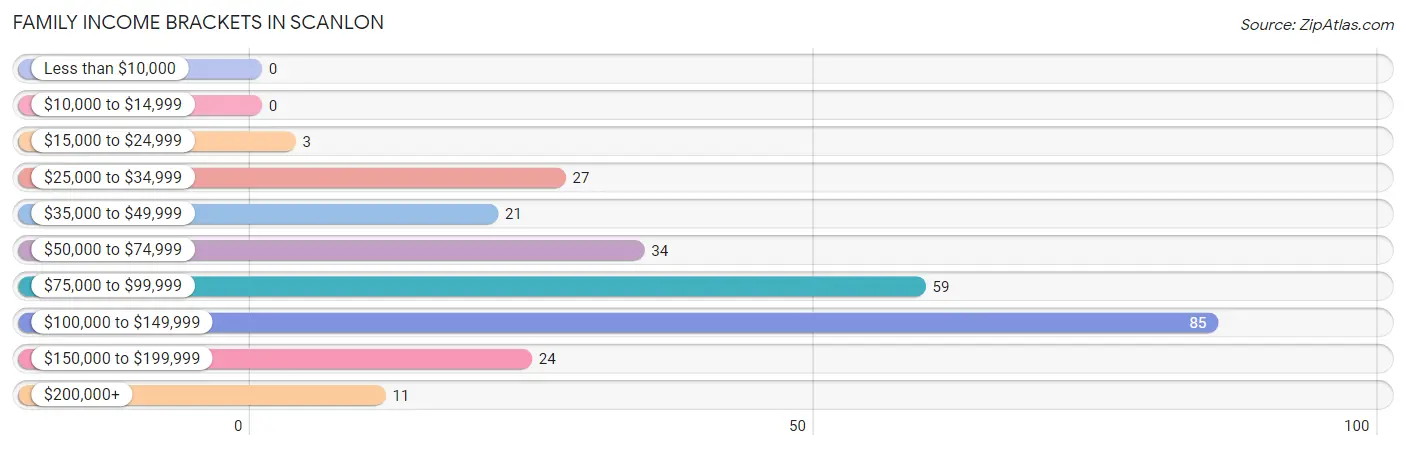
| Income Bracket | # Families | % Families |
| Less than $10,000 | 0 | 0.0% |
| $10,000 to $14,999 | 0 | 0.0% |
| $15,000 to $24,999 | 3 | 1.1% |
| $25,000 to $34,999 | 27 | 10.2% |
| $35,000 to $49,999 | 21 | 8.0% |
| $50,000 to $74,999 | 34 | 12.9% |
| $75,000 to $99,999 | 59 | 22.3% |
| $100,000 to $149,999 | 85 | 32.2% |
| $150,000 to $199,999 | 24 | 9.1% |
| $200,000+ | 11 | 4.2% |
Family Income by Famaliy Size in Scanlon
4-person families (24 | 9.1%) account for the highest median family income in Scanlon with $113,750 per family, while 2-person families (108 | 40.9%) have the highest median income of $49,584 per family member.
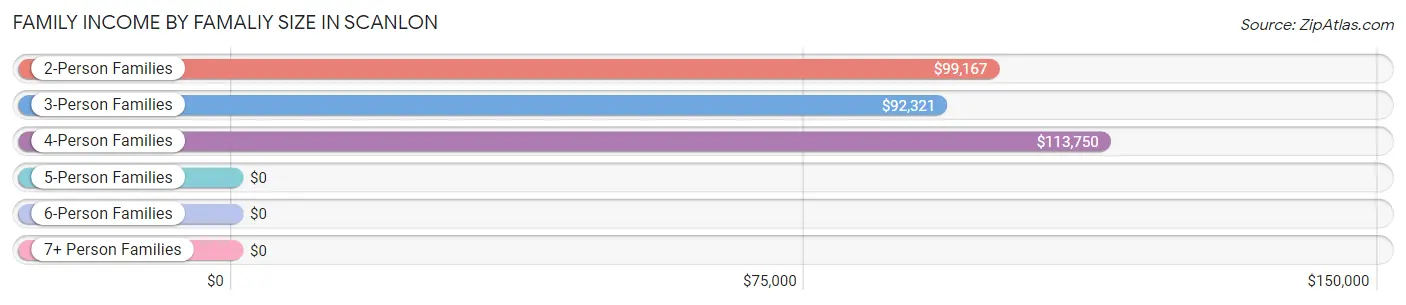
| Income Bracket | # Families | Median Income |
| 2-Person Families | 108 (40.9%) | $99,167 |
| 3-Person Families | 105 (39.8%) | $92,321 |
| 4-Person Families | 24 (9.1%) | $113,750 |
| 5-Person Families | 27 (10.2%) | $0 |
| 6-Person Families | 0 (0.0%) | $0 |
| 7+ Person Families | 0 (0.0%) | $0 |
| Total | 264 (100.0%) | $94,063 |
Family Income by Number of Earners in Scanlon
The median family income in Scanlon is $94,063, with families comprising 3+ earners (37) having the highest median family income of $128,646, while families with 1 earner (88) have the lowest median family income of $56,250, accounting for 14.0% and 33.3% of families, respectively.
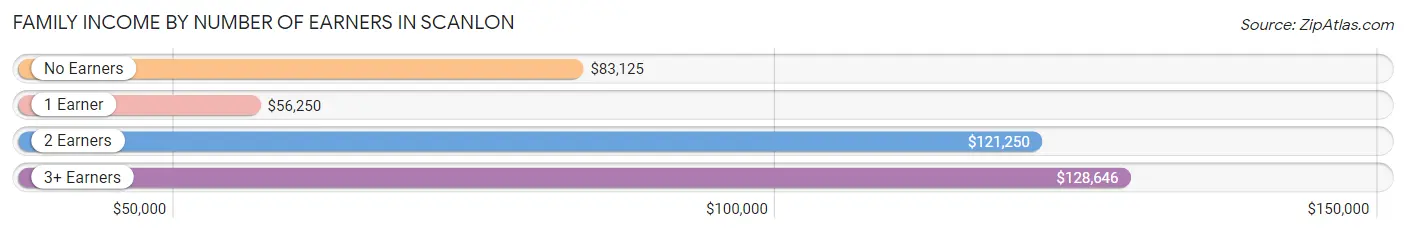
| Number of Earners | # Families | Median Income |
| No Earners | 37 (14.0%) | $83,125 |
| 1 Earner | 88 (33.3%) | $56,250 |
| 2 Earners | 102 (38.6%) | $121,250 |
| 3+ Earners | 37 (14.0%) | $128,646 |
| Total | 264 (100.0%) | $94,063 |
Household Income in Scanlon
Household Income Brackets in Scanlon
With 110 households falling in the category, the $100,000 to $149,999 income range is the most frequent in Scanlon, accounting for 23.9% of all households. In contrast, only 3 households (0.6%) fall into the $10,000 to $14,999 income bracket, making it the least populous group.
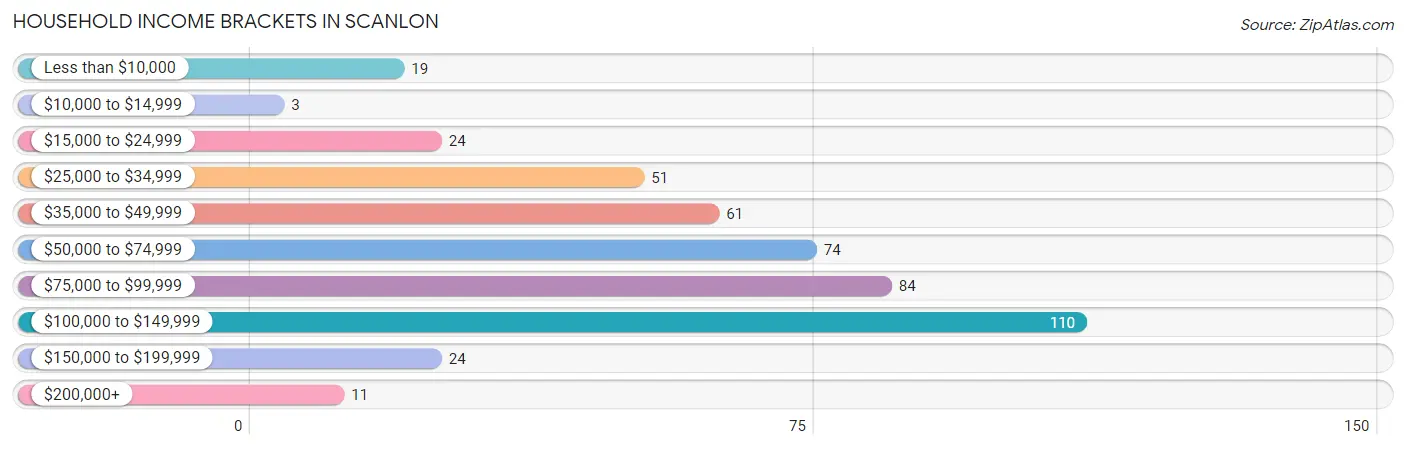
| Income Bracket | # Households | % Households |
| Less than $10,000 | 19 | 4.1% |
| $10,000 to $14,999 | 3 | 0.7% |
| $15,000 to $24,999 | 24 | 5.2% |
| $25,000 to $34,999 | 51 | 11.1% |
| $35,000 to $49,999 | 61 | 13.2% |
| $50,000 to $74,999 | 74 | 16.1% |
| $75,000 to $99,999 | 84 | 18.2% |
| $100,000 to $149,999 | 110 | 23.9% |
| $150,000 to $199,999 | 24 | 5.2% |
| $200,000+ | 11 | 2.4% |
Household Income by Householder Age in Scanlon
The median household income in Scanlon is $73,125, with the highest median household income of $93,125 found in the 45 to 64 years age bracket for the primary householder. A total of 162 households (35.1%) fall into this category. Meanwhile, the 15 to 24 years age bracket for the primary householder has the lowest median household income of $0, with 16 households (3.5%) in this group.
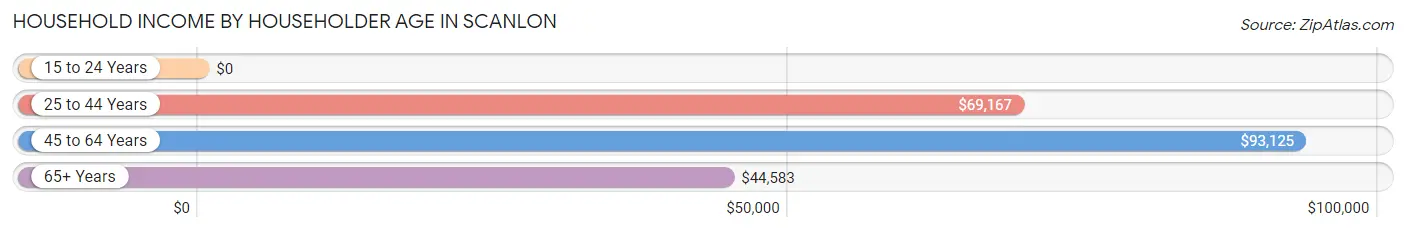
| Income Bracket | # Households | Median Income |
| 15 to 24 Years | 16 (3.5%) | $0 |
| 25 to 44 Years | 140 (30.4%) | $69,167 |
| 45 to 64 Years | 162 (35.1%) | $93,125 |
| 65+ Years | 143 (31.0%) | $44,583 |
| Total | 461 (100.0%) | $73,125 |
Poverty in Scanlon
Income Below Poverty by Sex and Age in Scanlon
With 5.6% poverty level for males and 6.8% for females among the residents of Scanlon, 25 to 34 year old males and 18 to 24 year old females are the most vulnerable to poverty, with 22 males (28.6%) and 13 females (46.4%) in their respective age groups living below the poverty level.
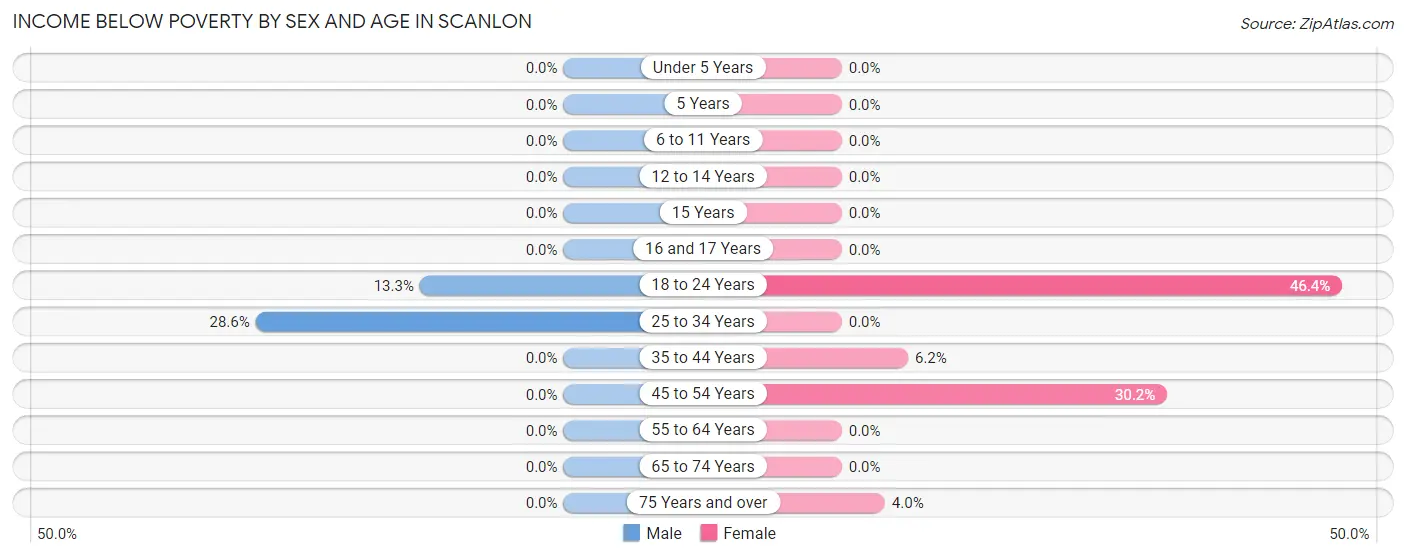
| Age Bracket | Male | Female |
| Under 5 Years | 0 (0.0%) | 0 (0.0%) |
| 5 Years | 0 (0.0%) | 0 (0.0%) |
| 6 to 11 Years | 0 (0.0%) | 0 (0.0%) |
| 12 to 14 Years | 0 (0.0%) | 0 (0.0%) |
| 15 Years | 0 (0.0%) | 0 (0.0%) |
| 16 and 17 Years | 0 (0.0%) | 0 (0.0%) |
| 18 to 24 Years | 6 (13.3%) | 13 (46.4%) |
| 25 to 34 Years | 22 (28.6%) | 0 (0.0%) |
| 35 to 44 Years | 0 (0.0%) | 4 (6.1%) |
| 45 to 54 Years | 0 (0.0%) | 16 (30.2%) |
| 55 to 64 Years | 0 (0.0%) | 0 (0.0%) |
| 65 to 74 Years | 0 (0.0%) | 0 (0.0%) |
| 75 Years and over | 0 (0.0%) | 3 (4.0%) |
| Total | 28 (5.6%) | 36 (6.8%) |
Income Above Poverty by Sex and Age in Scanlon
According to the poverty statistics in Scanlon, males aged under 5 years and females aged under 5 years are the age groups that are most secure financially, with 100.0% of males and 100.0% of females in these age groups living above the poverty line.
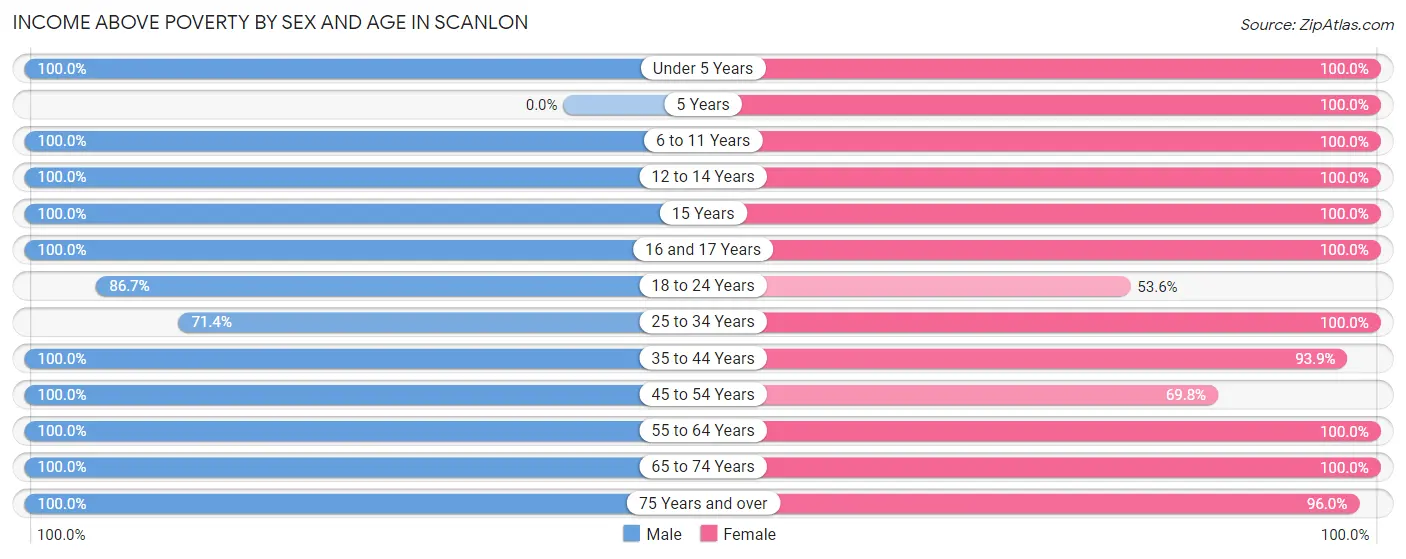
| Age Bracket | Male | Female |
| Under 5 Years | 20 (100.0%) | 39 (100.0%) |
| 5 Years | 0 (0.0%) | 20 (100.0%) |
| 6 to 11 Years | 15 (100.0%) | 45 (100.0%) |
| 12 to 14 Years | 37 (100.0%) | 4 (100.0%) |
| 15 Years | 9 (100.0%) | 2 (100.0%) |
| 16 and 17 Years | 29 (100.0%) | 9 (100.0%) |
| 18 to 24 Years | 39 (86.7%) | 15 (53.6%) |
| 25 to 34 Years | 55 (71.4%) | 61 (100.0%) |
| 35 to 44 Years | 66 (100.0%) | 61 (93.9%) |
| 45 to 54 Years | 60 (100.0%) | 37 (69.8%) |
| 55 to 64 Years | 79 (100.0%) | 88 (100.0%) |
| 65 to 74 Years | 39 (100.0%) | 43 (100.0%) |
| 75 Years and over | 24 (100.0%) | 72 (96.0%) |
| Total | 472 (94.4%) | 496 (93.2%) |
Income Below Poverty Among Married-Couple Families in Scanlon
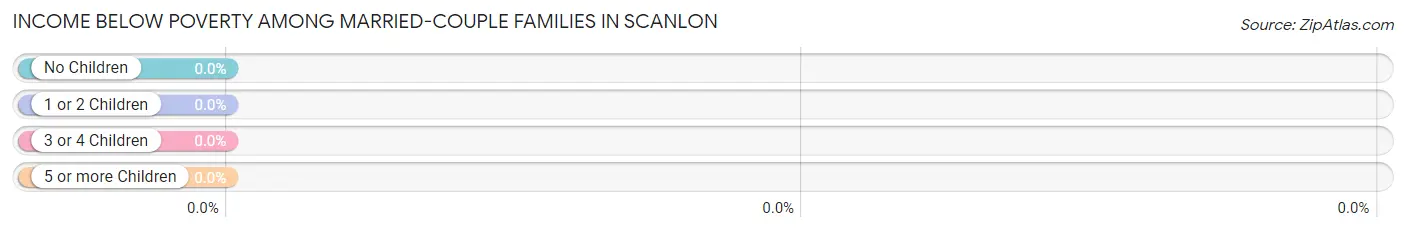
| Children | Above Poverty | Below Poverty |
| No Children | 106 (100.0%) | 0 (0.0%) |
| 1 or 2 Children | 73 (100.0%) | 0 (0.0%) |
| 3 or 4 Children | 23 (100.0%) | 0 (0.0%) |
| 5 or more Children | 0 (0.0%) | 0 (0.0%) |
| Total | 202 (100.0%) | 0 (0.0%) |
Income Below Poverty Among Single-Parent Households in Scanlon
| Children | Single Father | Single Mother |
| No Children | 0 (0.0%) | 0 (0.0%) |
| 1 or 2 Children | 0 (0.0%) | 0 (0.0%) |
| 3 or 4 Children | 0 (0.0%) | 0 (0.0%) |
| 5 or more Children | 0 (0.0%) | 0 (0.0%) |
| Total | 0 (0.0%) | 0 (0.0%) |
Income Below Poverty Among Married-Couple vs Single-Parent Households in Scanlon
| Children | Married-Couple Families | Single-Parent Households |
| No Children | 0 (0.0%) | 0 (0.0%) |
| 1 or 2 Children | 0 (0.0%) | 0 (0.0%) |
| 3 or 4 Children | 0 (0.0%) | 0 (0.0%) |
| 5 or more Children | 0 (0.0%) | 0 (0.0%) |
| Total | 0 (0.0%) | 0 (0.0%) |
Race in Scanlon
The most populous races in Scanlon are White / Caucasian (831 | 79.4%), Two or more Races (186 | 17.8%), and Hispanic or Latino (44 | 4.2%).
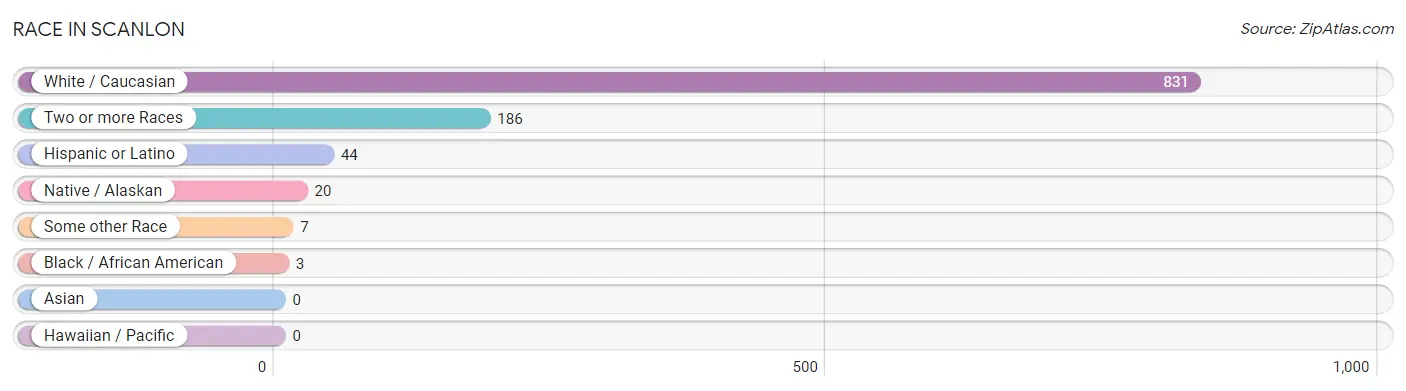
| Race | # Population | % Population |
| Asian | 0 | 0.0% |
| Black / African American | 3 | 0.3% |
| Hawaiian / Pacific | 0 | 0.0% |
| Hispanic or Latino | 44 | 4.2% |
| Native / Alaskan | 20 | 1.9% |
| White / Caucasian | 831 | 79.4% |
| Two or more Races | 186 | 17.8% |
| Some other Race | 7 | 0.7% |
| Total | 1,047 | 100.0% |
Ancestry in Scanlon
The most populous ancestries reported in Scanlon are German (227 | 21.7%), Finnish (205 | 19.6%), Norwegian (170 | 16.2%), Irish (104 | 9.9%), and Swedish (80 | 7.6%), together accounting for 75.1% of all Scanlon residents.
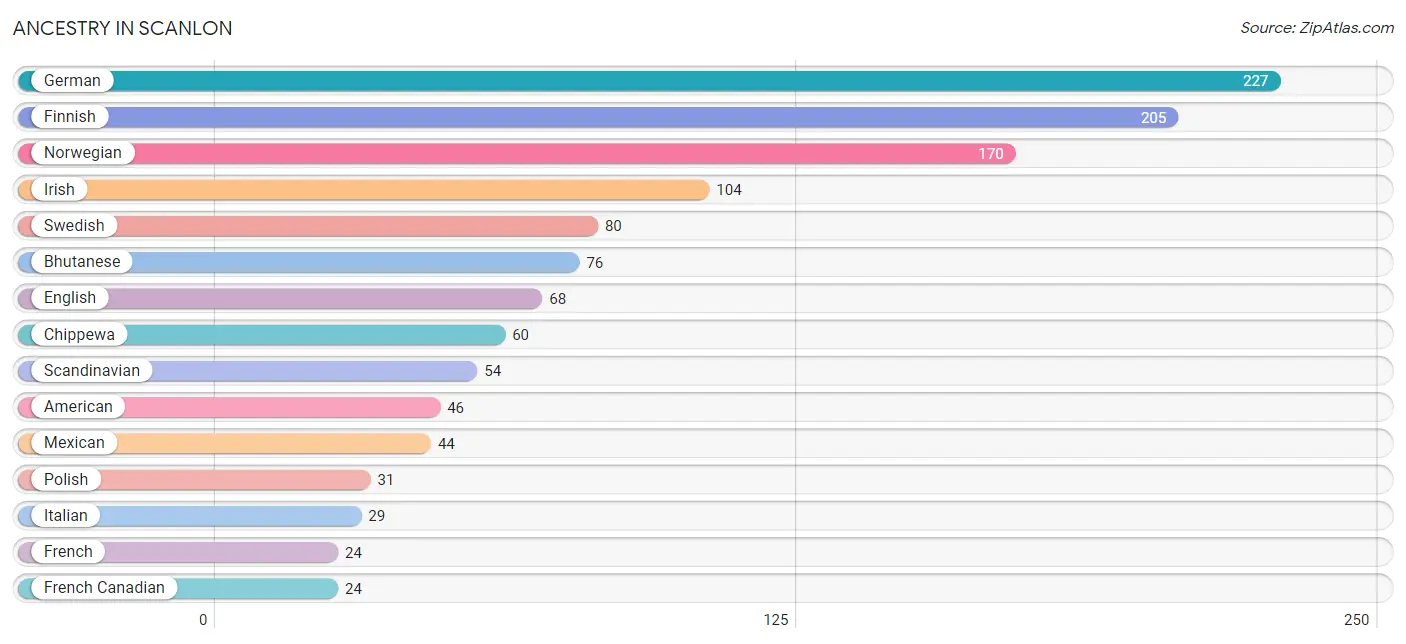
| Ancestry | # Population | % Population |
| American | 46 | 4.4% |
| Arab | 10 | 1.0% |
| Belgian | 2 | 0.2% |
| Bhutanese | 76 | 7.3% |
| British | 21 | 2.0% |
| Cherokee | 4 | 0.4% |
| Chippewa | 60 | 5.7% |
| Croatian | 3 | 0.3% |
| Czech | 15 | 1.4% |
| Danish | 2 | 0.2% |
| Dutch | 6 | 0.6% |
| Eastern European | 4 | 0.4% |
| English | 68 | 6.5% |
| European | 6 | 0.6% |
| Finnish | 205 | 19.6% |
| French | 24 | 2.3% |
| French Canadian | 24 | 2.3% |
| German | 227 | 21.7% |
| Irish | 104 | 9.9% |
| Italian | 29 | 2.8% |
| Lebanese | 10 | 1.0% |
| Mexican | 44 | 4.2% |
| Norwegian | 170 | 16.2% |
| Polish | 31 | 3.0% |
| Scandinavian | 54 | 5.2% |
| Scotch-Irish | 16 | 1.5% |
| Scottish | 5 | 0.5% |
| Slovak | 4 | 0.4% |
| Slovene | 3 | 0.3% |
| Swedish | 80 | 7.6% |
| Swiss | 2 | 0.2% | View All 31 Rows |
Immigrants in Scanlon
The most numerous immigrant groups reported in Scanlon came from Central America (3 | 0.3%), Latin America (3 | 0.3%), and Mexico (3 | 0.3%), together accounting for 0.9% of all Scanlon residents.
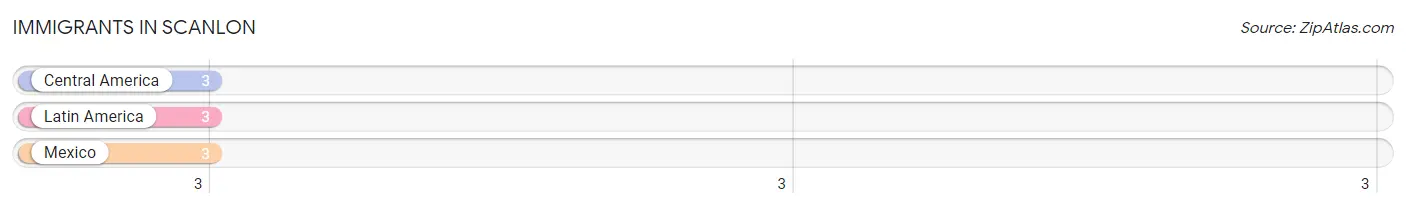
| Immigration Origin | # Population | % Population |
| Central America | 3 | 0.3% |
| Latin America | 3 | 0.3% |
| Mexico | 3 | 0.3% | View All 3 Rows |
Sex and Age in Scanlon
Sex and Age in Scanlon
The most populous age groups in Scanlon are 15 to 19 Years (53 | 10.6%) for men and 85 Years and over (63 | 11.5%) for women.
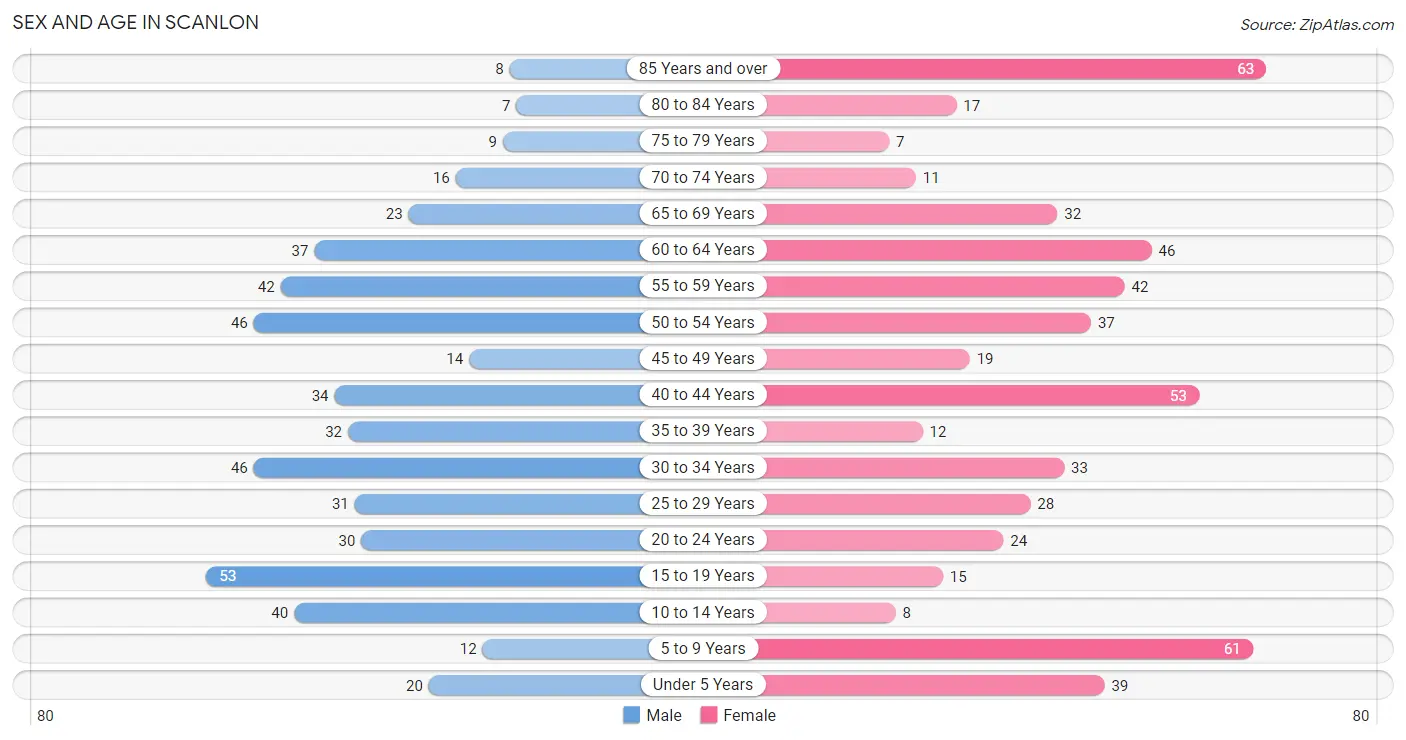
| Age Bracket | Male | Female |
| Under 5 Years | 20 (4.0%) | 39 (7.1%) |
| 5 to 9 Years | 12 (2.4%) | 61 (11.2%) |
| 10 to 14 Years | 40 (8.0%) | 8 (1.5%) |
| 15 to 19 Years | 53 (10.6%) | 15 (2.7%) |
| 20 to 24 Years | 30 (6.0%) | 24 (4.4%) |
| 25 to 29 Years | 31 (6.2%) | 28 (5.1%) |
| 30 to 34 Years | 46 (9.2%) | 33 (6.0%) |
| 35 to 39 Years | 32 (6.4%) | 12 (2.2%) |
| 40 to 44 Years | 34 (6.8%) | 53 (9.7%) |
| 45 to 49 Years | 14 (2.8%) | 19 (3.5%) |
| 50 to 54 Years | 46 (9.2%) | 37 (6.8%) |
| 55 to 59 Years | 42 (8.4%) | 42 (7.7%) |
| 60 to 64 Years | 37 (7.4%) | 46 (8.4%) |
| 65 to 69 Years | 23 (4.6%) | 32 (5.9%) |
| 70 to 74 Years | 16 (3.2%) | 11 (2.0%) |
| 75 to 79 Years | 9 (1.8%) | 7 (1.3%) |
| 80 to 84 Years | 7 (1.4%) | 17 (3.1%) |
| 85 Years and over | 8 (1.6%) | 63 (11.5%) |
| Total | 500 (100.0%) | 547 (100.0%) |
Families and Households in Scanlon
Median Family Size in Scanlon
The median family size in Scanlon is 2.90 persons per family, with married-couple families (202 | 76.5%) accounting for the largest median family size of 2.98 persons per family. On the other hand, single female/mother families (23 | 8.7%) represent the smallest median family size with 2.26 persons per family.
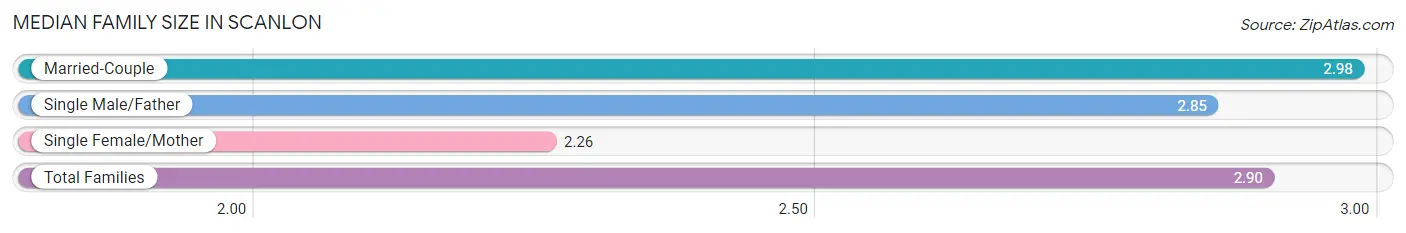
| Family Type | # Families | Family Size |
| Married-Couple | 202 (76.5%) | 2.98 |
| Single Male/Father | 39 (14.8%) | 2.85 |
| Single Female/Mother | 23 (8.7%) | 2.26 |
| Total Families | 264 (100.0%) | 2.90 |
Median Household Size in Scanlon
The median household size in Scanlon is 2.16 persons per household, with single male/father households (39 | 8.5%) accounting for the largest median household size of 3.26 persons per household. non-family households (197 | 42.7%) represent the smallest median household size with 1.08 persons per household.
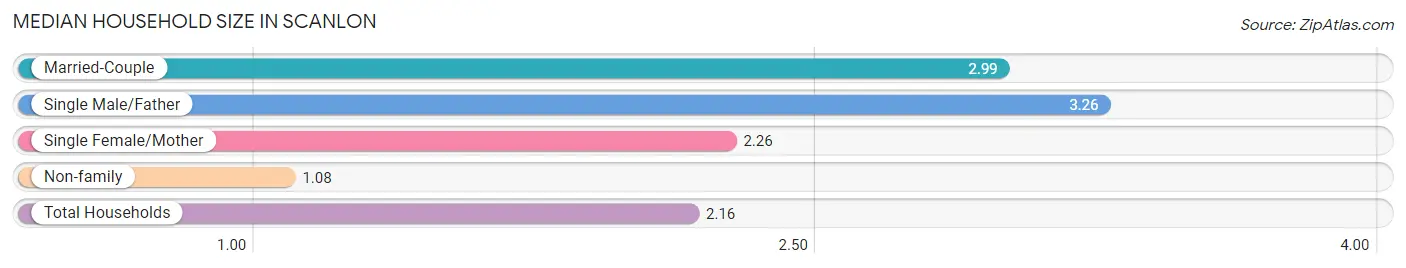
| Household Type | # Households | Household Size |
| Married-Couple | 202 (43.8%) | 2.99 |
| Single Male/Father | 39 (8.5%) | 3.26 |
| Single Female/Mother | 23 (5.0%) | 2.26 |
| Non-family | 197 (42.7%) | 1.08 |
| Total Households | 461 (100.0%) | 2.16 |
Household Size by Marriage Status in Scanlon
Out of a total of 461 households in Scanlon, 264 (57.3%) are family households, while 197 (42.7%) are nonfamily households. The most numerous type of family households are 2-person households, comprising 108, and the most common type of nonfamily households are 1-person households, comprising 181.
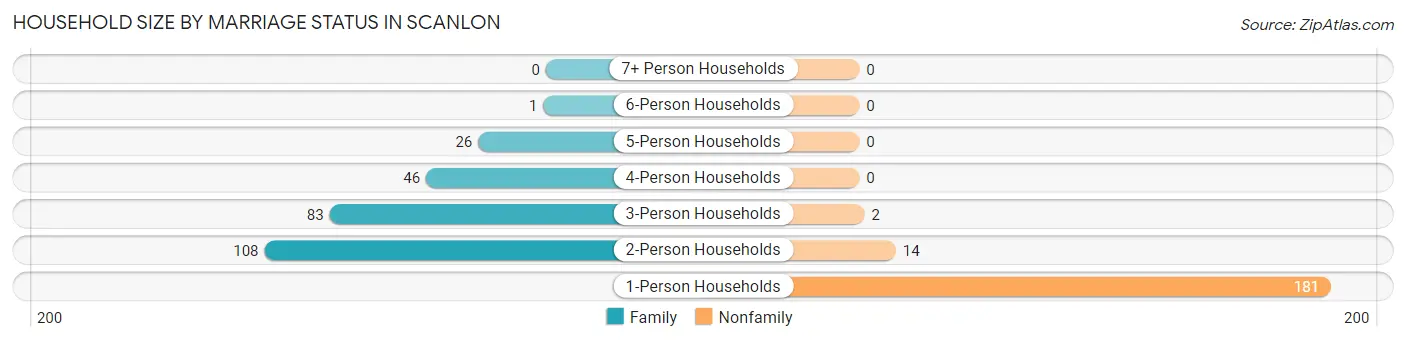
| Household Size | Family Households | Nonfamily Households |
| 1-Person Households | - | 181 (39.3%) |
| 2-Person Households | 108 (23.4%) | 14 (3.0%) |
| 3-Person Households | 83 (18.0%) | 2 (0.4%) |
| 4-Person Households | 46 (10.0%) | 0 (0.0%) |
| 5-Person Households | 26 (5.6%) | 0 (0.0%) |
| 6-Person Households | 1 (0.2%) | 0 (0.0%) |
| 7+ Person Households | 0 (0.0%) | 0 (0.0%) |
| Total | 264 (57.3%) | 197 (42.7%) |
Female Fertility in Scanlon
Fertility by Age in Scanlon
Average fertility rate in Scanlon is 43.0 births per 1,000 women. Women in the age bracket of 20 to 34 years have the highest fertility rate with 94.0 births per 1,000 women. Women in the age bracket of 20 to 34 years acount for 100.0% of all women with births.
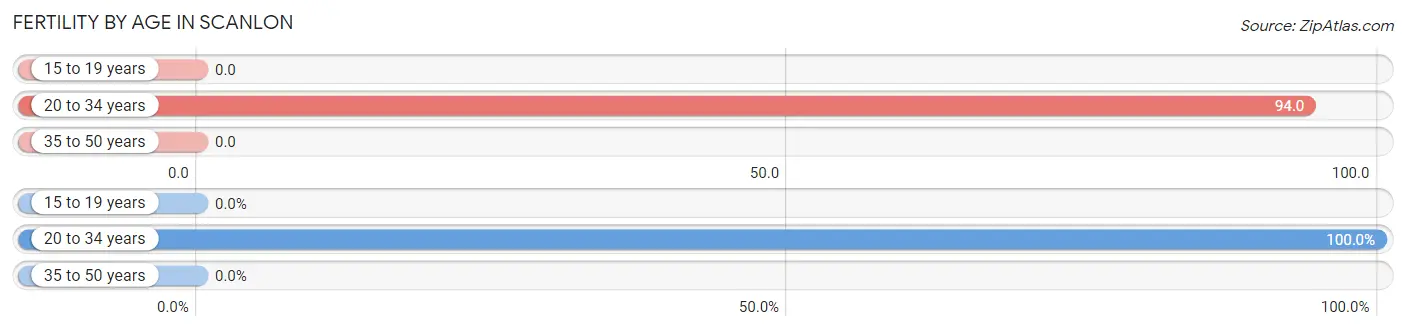
| Age Bracket | Women with Births | Births / 1,000 Women |
| 15 to 19 years | 0 (0.0%) | 0.0 |
| 20 to 34 years | 8 (100.0%) | 94.0 |
| 35 to 50 years | 0 (0.0%) | 0.0 |
| Total | 8 (100.0%) | 43.0 |
Fertility by Age by Marriage Status in Scanlon
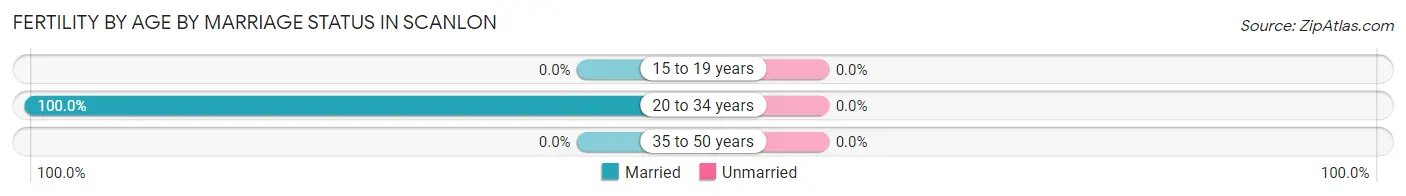
| Age Bracket | Married | Unmarried |
| 15 to 19 years | 0 (0.0%) | 0 (0.0%) |
| 20 to 34 years | 8 (100.0%) | 0 (0.0%) |
| 35 to 50 years | 0 (0.0%) | 0 (0.0%) |
| Total | 8 (100.0%) | 0 (0.0%) |
Fertility by Education in Scanlon
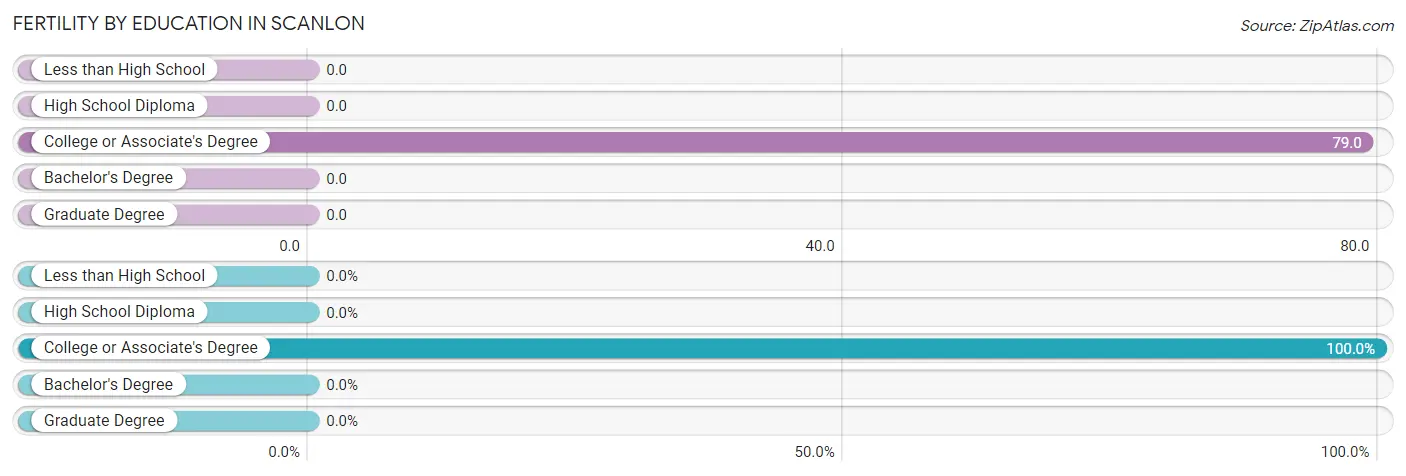
| Educational Attainment | Women with Births | Births / 1,000 Women |
| Less than High School | 0 (0.0%) | 0.0 |
| High School Diploma | 0 (0.0%) | 0.0 |
| College or Associate's Degree | 8 (100.0%) | 79.0 |
| Bachelor's Degree | 0 (0.0%) | 0.0 |
| Graduate Degree | 0 (0.0%) | 0.0 |
| Total | 8 (100.0%) | 43.0 |
Fertility by Education by Marriage Status in Scanlon
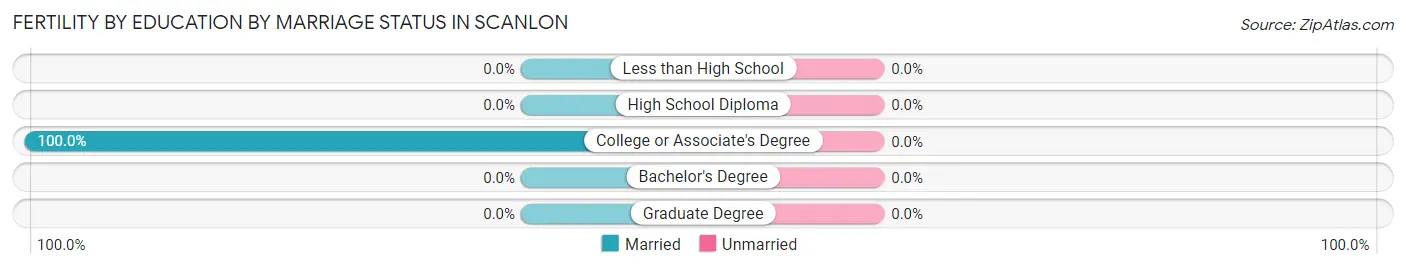
| Educational Attainment | Married | Unmarried |
| Less than High School | 0 (0.0%) | 0 (0.0%) |
| High School Diploma | 0 (0.0%) | 0 (0.0%) |
| College or Associate's Degree | 8 (100.0%) | 0 (0.0%) |
| Bachelor's Degree | 0 (0.0%) | 0 (0.0%) |
| Graduate Degree | 0 (0.0%) | 0 (0.0%) |
| Total | 8 (100.0%) | 0 (0.0%) |
Employment Characteristics in Scanlon
Employment by Class of Employer in Scanlon
Among the 500 employed individuals in Scanlon, private company employees (319 | 63.8%), not-for-profit organizations (58 | 11.6%), and state government employees (33 | 6.6%) make up the most common classes of employment.
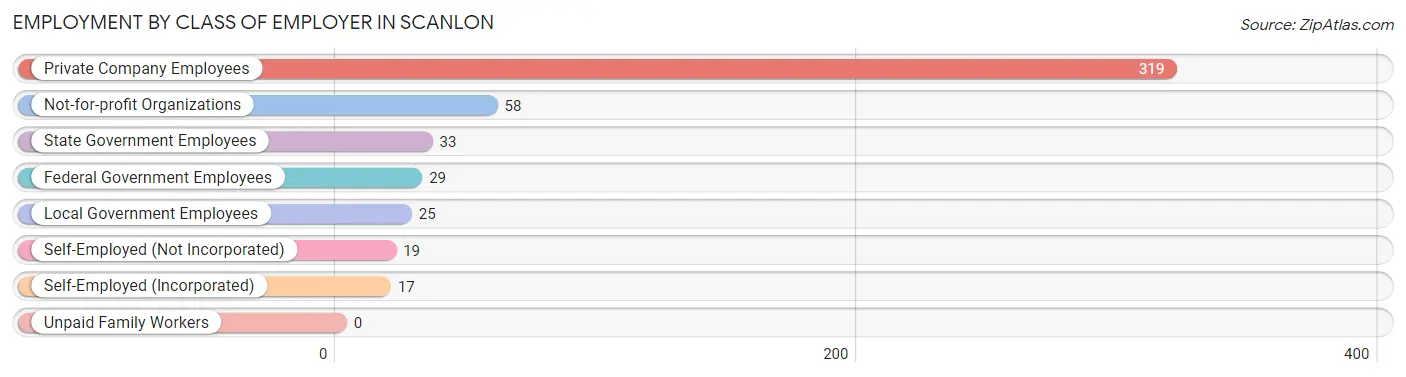
| Employer Class | # Employees | % Employees |
| Private Company Employees | 319 | 63.8% |
| Self-Employed (Incorporated) | 17 | 3.4% |
| Self-Employed (Not Incorporated) | 19 | 3.8% |
| Not-for-profit Organizations | 58 | 11.6% |
| Local Government Employees | 25 | 5.0% |
| State Government Employees | 33 | 6.6% |
| Federal Government Employees | 29 | 5.8% |
| Unpaid Family Workers | 0 | 0.0% |
| Total | 500 | 100.0% |
Employment Status by Age in Scanlon
According to the labor force statistics for Scanlon, out of the total population over 16 years of age (856), 66.8% or 572 individuals are in the labor force, with 8.4% or 48 of them unemployed. The age group with the highest labor force participation rate is 25 to 29 years, with 98.3% or 58 individuals in the labor force. Within the labor force, the 16 to 19 years age range has the highest percentage of unemployed individuals, with 27.9% or 12 of them being unemployed.
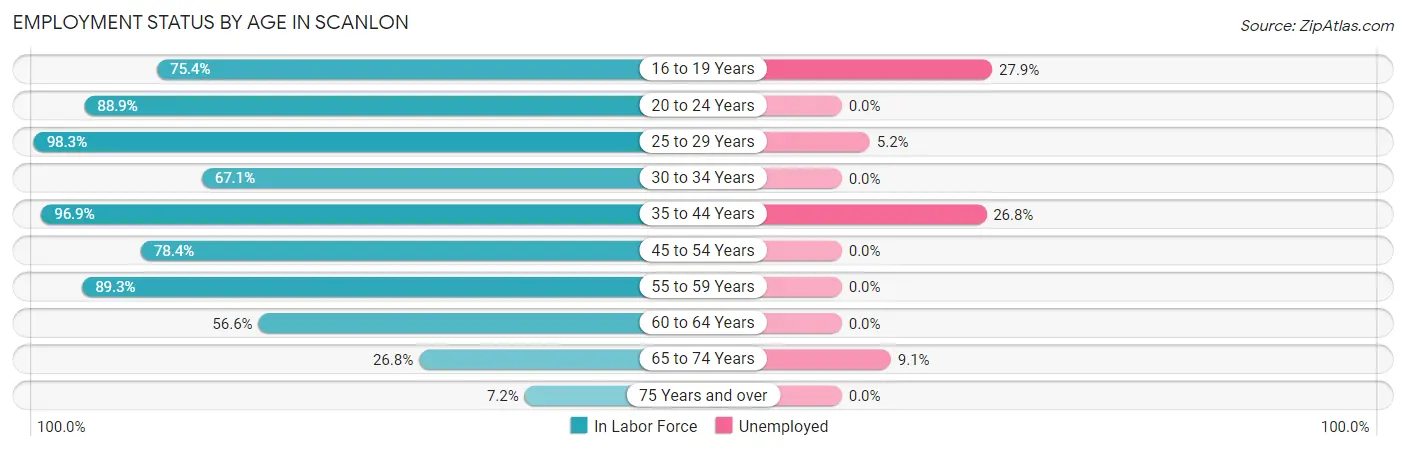
| Age Bracket | In Labor Force | Unemployed |
| 16 to 19 Years | 43 (75.4%) | 12 (27.9%) |
| 20 to 24 Years | 48 (88.9%) | 0 (0.0%) |
| 25 to 29 Years | 58 (98.3%) | 3 (5.2%) |
| 30 to 34 Years | 53 (67.1%) | 0 (0.0%) |
| 35 to 44 Years | 127 (96.9%) | 34 (26.8%) |
| 45 to 54 Years | 91 (78.4%) | 0 (0.0%) |
| 55 to 59 Years | 75 (89.3%) | 0 (0.0%) |
| 60 to 64 Years | 47 (56.6%) | 0 (0.0%) |
| 65 to 74 Years | 22 (26.8%) | 2 (9.1%) |
| 75 Years and over | 8 (7.2%) | 0 (0.0%) |
| Total | 572 (66.8%) | 48 (8.4%) |
Employment Status by Educational Attainment in Scanlon
According to labor force statistics for Scanlon, 81.7% of individuals (451) out of the total population between 25 and 64 years of age (552) are in the labor force, with 7.6% or 34 of them being unemployed. The group with the highest labor force participation rate are those with the educational attainment of college / associate degree, with 92.1% or 244 individuals in the labor force. Within the labor force, individuals with less than high school education have the highest percentage of unemployment, with 100.0% or 6 of them being unemployed.
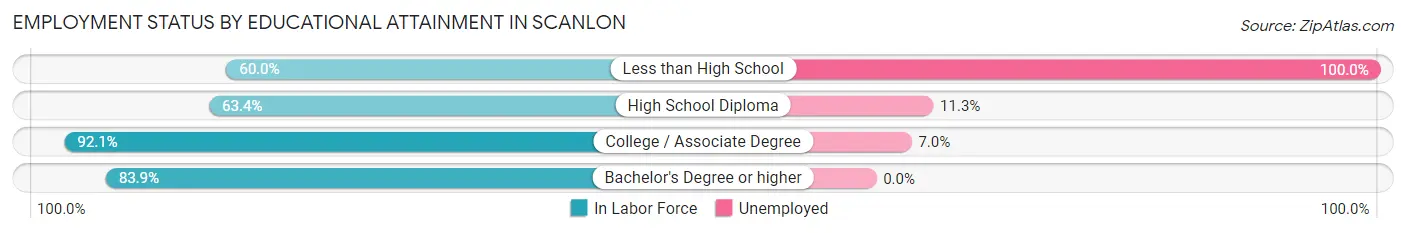
| Educational Attainment | In Labor Force | Unemployed |
| Less than High School | 6 (60.0%) | 10 (100.0%) |
| High School Diploma | 97 (63.4%) | 17 (11.3%) |
| College / Associate Degree | 244 (92.1%) | 19 (7.0%) |
| Bachelor's Degree or higher | 104 (83.9%) | 0 (0.0%) |
| Total | 451 (81.7%) | 42 (7.6%) |
Employment Occupations by Sex in Scanlon
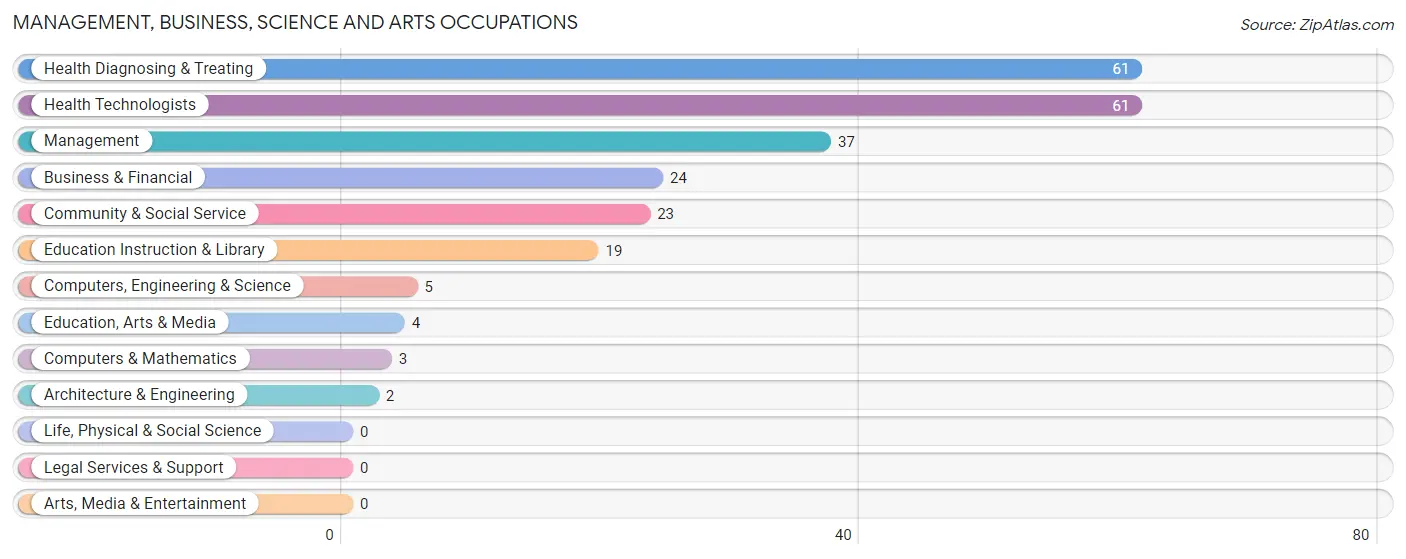
Management, Business, Science and Arts Occupations
The most common Management, Business, Science and Arts occupations in Scanlon are Health Diagnosing & Treating (61 | 12.0%), Health Technologists (61 | 12.0%), Management (37 | 7.2%), Business & Financial (24 | 4.7%), and Community & Social Service (23 | 4.5%).
Management, Business, Science and Arts Occupations by Sex
Within the Management, Business, Science and Arts occupations in Scanlon, the most male-oriented occupations are Architecture & Engineering (100.0%), Management (86.5%), and Business & Financial (54.2%), while the most female-oriented occupations are Computers & Mathematics (100.0%), Education, Arts & Media (100.0%), and Health Diagnosing & Treating (93.4%).
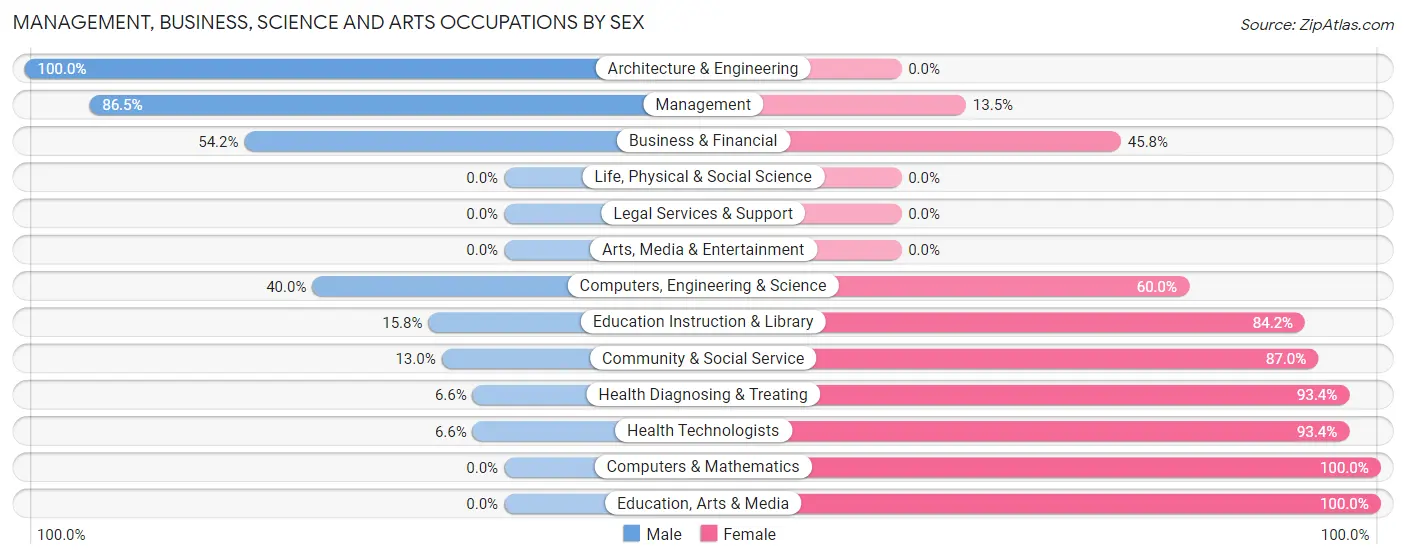
| Occupation | Male | Female |
| Management | 32 (86.5%) | 5 (13.5%) |
| Business & Financial | 13 (54.2%) | 11 (45.8%) |
| Computers, Engineering & Science | 2 (40.0%) | 3 (60.0%) |
| Computers & Mathematics | 0 (0.0%) | 3 (100.0%) |
| Architecture & Engineering | 2 (100.0%) | 0 (0.0%) |
| Life, Physical & Social Science | 0 (0.0%) | 0 (0.0%) |
| Community & Social Service | 3 (13.0%) | 20 (87.0%) |
| Education, Arts & Media | 0 (0.0%) | 4 (100.0%) |
| Legal Services & Support | 0 (0.0%) | 0 (0.0%) |
| Education Instruction & Library | 3 (15.8%) | 16 (84.2%) |
| Arts, Media & Entertainment | 0 (0.0%) | 0 (0.0%) |
| Health Diagnosing & Treating | 4 (6.6%) | 57 (93.4%) |
| Health Technologists | 4 (6.6%) | 57 (93.4%) |
| Total (Category) | 54 (36.0%) | 96 (64.0%) |
| Total (Overall) | 265 (52.0%) | 245 (48.0%) |
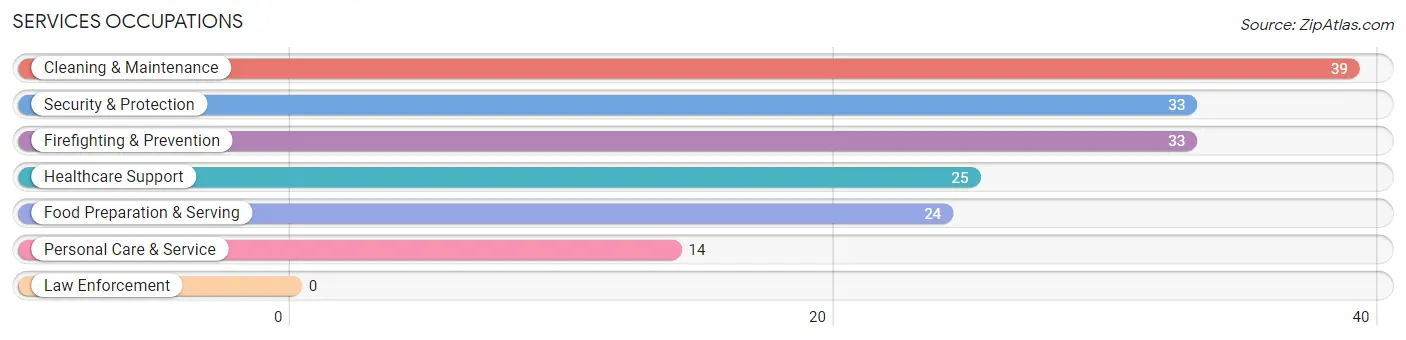
Services Occupations
The most common Services occupations in Scanlon are Cleaning & Maintenance (39 | 7.6%), Security & Protection (33 | 6.5%), Firefighting & Prevention (33 | 6.5%), Healthcare Support (25 | 4.9%), and Food Preparation & Serving (24 | 4.7%).
Services Occupations by Sex
Within the Services occupations in Scanlon, the most male-oriented occupations are Cleaning & Maintenance (92.3%), Security & Protection (69.7%), and Firefighting & Prevention (69.7%), while the most female-oriented occupations are Healthcare Support (100.0%), Personal Care & Service (100.0%), and Food Preparation & Serving (70.8%).
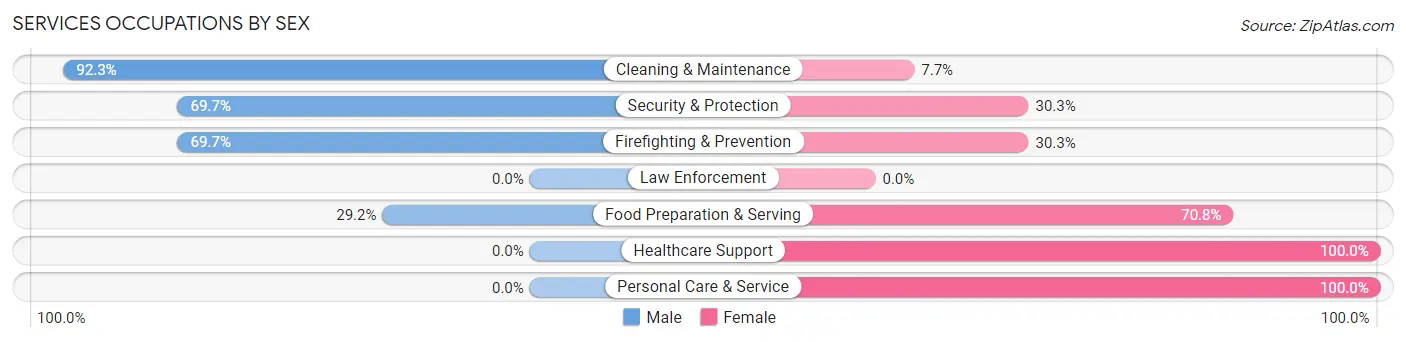
| Occupation | Male | Female |
| Healthcare Support | 0 (0.0%) | 25 (100.0%) |
| Security & Protection | 23 (69.7%) | 10 (30.3%) |
| Firefighting & Prevention | 23 (69.7%) | 10 (30.3%) |
| Law Enforcement | 0 (0.0%) | 0 (0.0%) |
| Food Preparation & Serving | 7 (29.2%) | 17 (70.8%) |
| Cleaning & Maintenance | 36 (92.3%) | 3 (7.7%) |
| Personal Care & Service | 0 (0.0%) | 14 (100.0%) |
| Total (Category) | 66 (48.9%) | 69 (51.1%) |
| Total (Overall) | 265 (52.0%) | 245 (48.0%) |
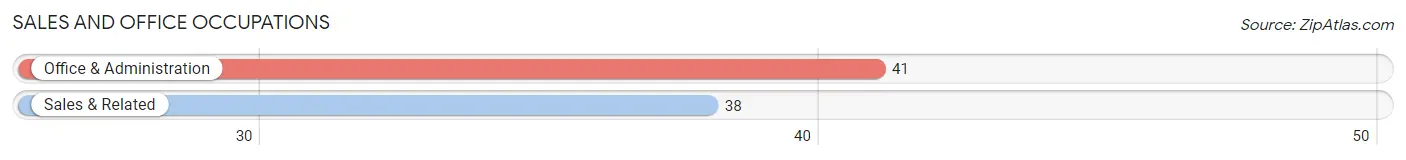
Sales and Office Occupations
The most common Sales and Office occupations in Scanlon are Office & Administration (41 | 8.0%), and Sales & Related (38 | 7.4%).
Sales and Office Occupations by Sex
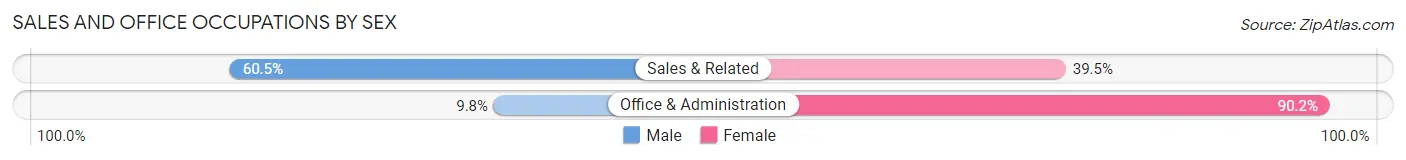
| Occupation | Male | Female |
| Sales & Related | 23 (60.5%) | 15 (39.5%) |
| Office & Administration | 4 (9.8%) | 37 (90.2%) |
| Total (Category) | 27 (34.2%) | 52 (65.8%) |
| Total (Overall) | 265 (52.0%) | 245 (48.0%) |
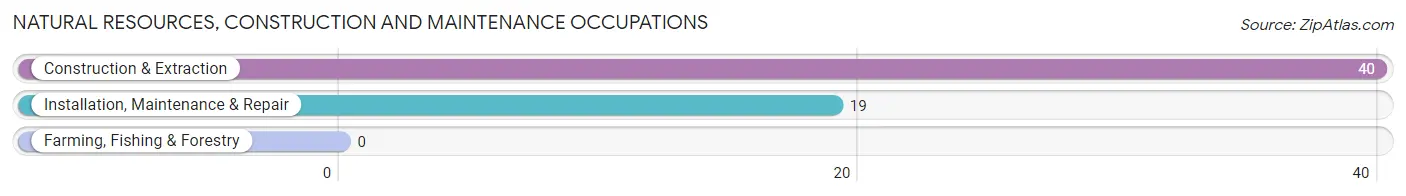
Natural Resources, Construction and Maintenance Occupations
The most common Natural Resources, Construction and Maintenance occupations in Scanlon are Construction & Extraction (40 | 7.8%), and Installation, Maintenance & Repair (19 | 3.7%).
Natural Resources, Construction and Maintenance Occupations by Sex
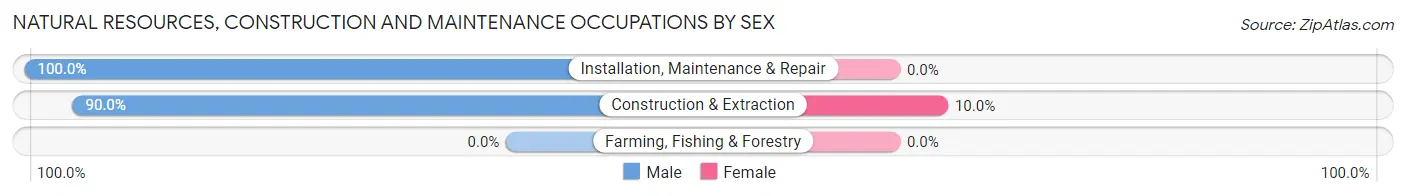
| Occupation | Male | Female |
| Farming, Fishing & Forestry | 0 (0.0%) | 0 (0.0%) |
| Construction & Extraction | 36 (90.0%) | 4 (10.0%) |
| Installation, Maintenance & Repair | 19 (100.0%) | 0 (0.0%) |
| Total (Category) | 55 (93.2%) | 4 (6.8%) |
| Total (Overall) | 265 (52.0%) | 245 (48.0%) |
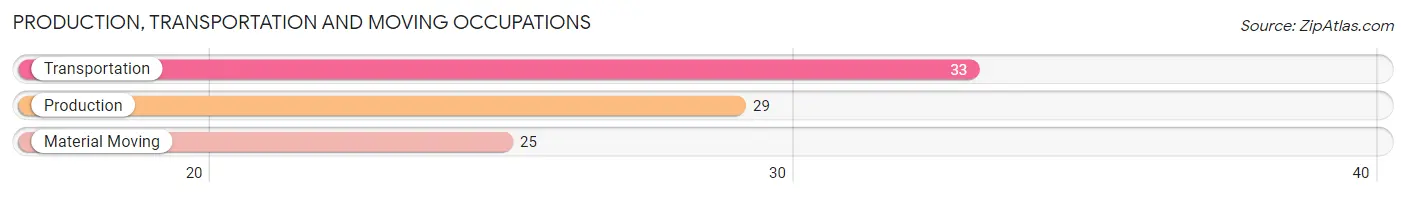
Production, Transportation and Moving Occupations
The most common Production, Transportation and Moving occupations in Scanlon are Transportation (33 | 6.5%), Production (29 | 5.7%), and Material Moving (25 | 4.9%).
Production, Transportation and Moving Occupations by Sex
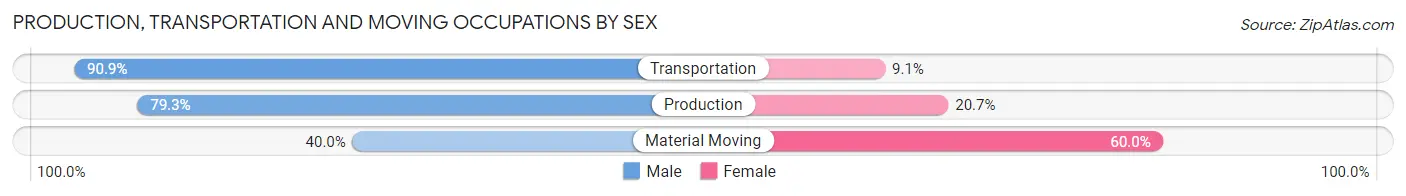
| Occupation | Male | Female |
| Production | 23 (79.3%) | 6 (20.7%) |
| Transportation | 30 (90.9%) | 3 (9.1%) |
| Material Moving | 10 (40.0%) | 15 (60.0%) |
| Total (Category) | 63 (72.4%) | 24 (27.6%) |
| Total (Overall) | 265 (52.0%) | 245 (48.0%) |
Employment Industries by Sex in Scanlon
Employment Industries in Scanlon
The major employment industries in Scanlon include Health Care & Social Assistance (97 | 19.0%), Manufacturing (71 | 13.9%), Construction (59 | 11.6%), Retail Trade (56 | 11.0%), and Transportation & Warehousing (43 | 8.4%).
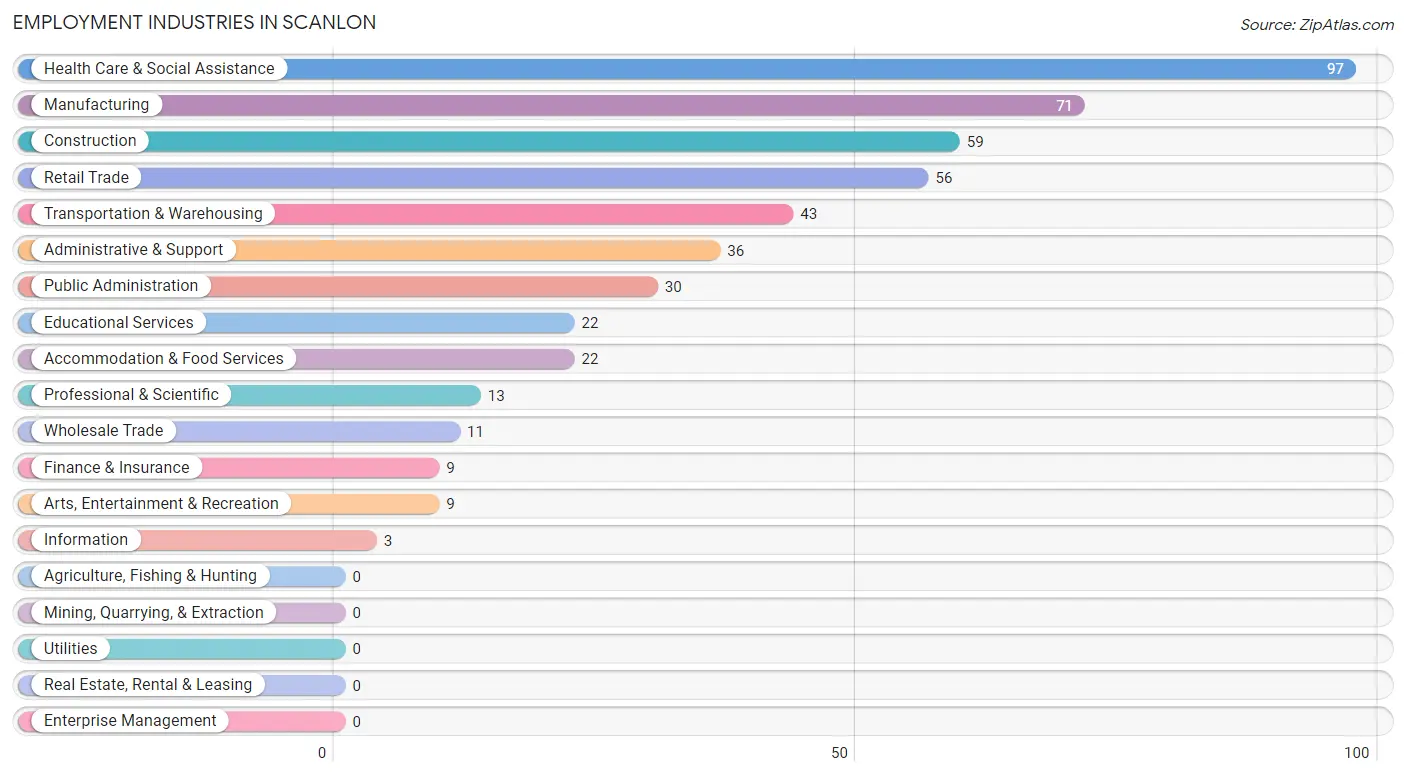
Employment Industries by Sex in Scanlon
The Scanlon industries that see more men than women are Wholesale Trade (100.0%), Information (100.0%), and Administrative & Support (91.7%), whereas the industries that tend to have a higher number of women are Arts, Entertainment & Recreation (100.0%), Health Care & Social Assistance (95.9%), and Educational Services (77.3%).
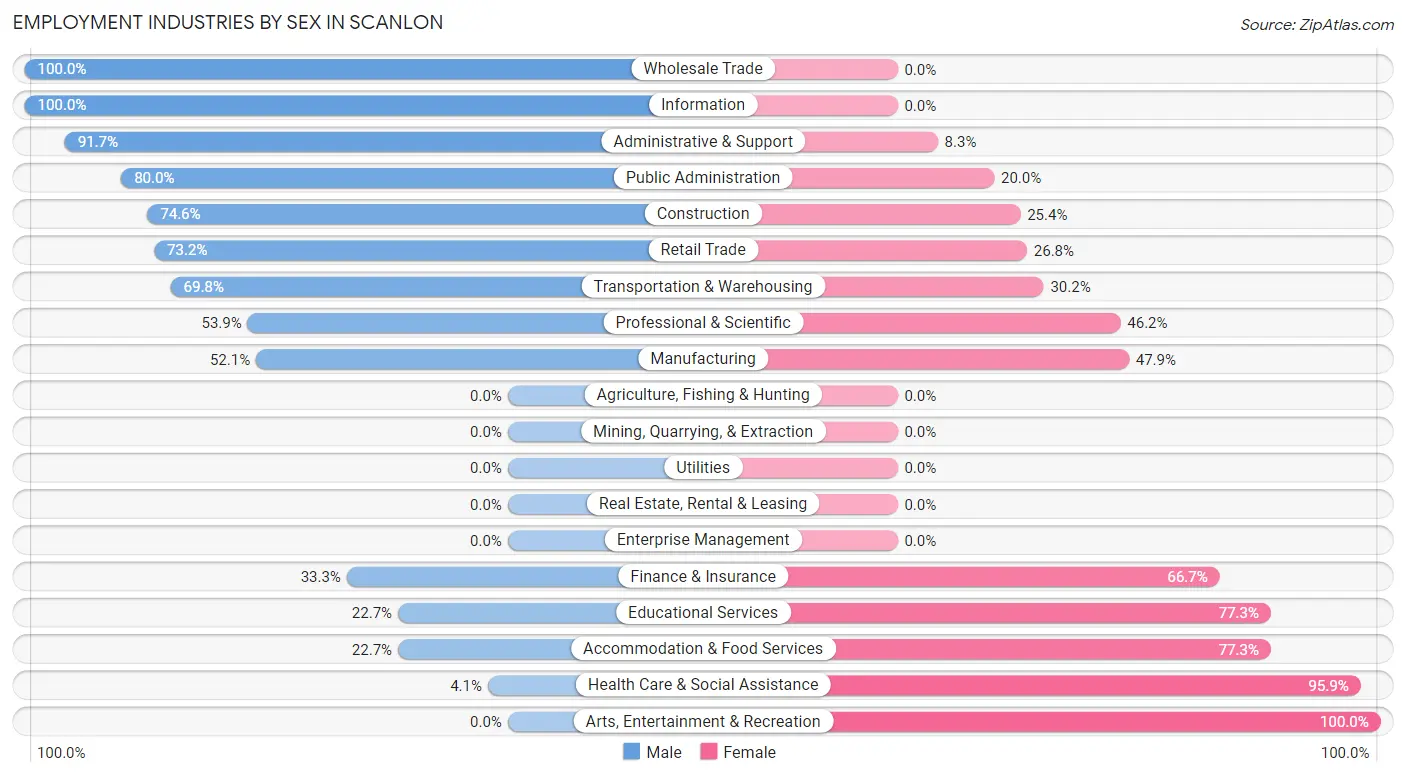
| Industry | Male | Female |
| Agriculture, Fishing & Hunting | 0 (0.0%) | 0 (0.0%) |
| Mining, Quarrying, & Extraction | 0 (0.0%) | 0 (0.0%) |
| Construction | 44 (74.6%) | 15 (25.4%) |
| Manufacturing | 37 (52.1%) | 34 (47.9%) |
| Wholesale Trade | 11 (100.0%) | 0 (0.0%) |
| Retail Trade | 41 (73.2%) | 15 (26.8%) |
| Transportation & Warehousing | 30 (69.8%) | 13 (30.2%) |
| Utilities | 0 (0.0%) | 0 (0.0%) |
| Information | 3 (100.0%) | 0 (0.0%) |
| Finance & Insurance | 3 (33.3%) | 6 (66.7%) |
| Real Estate, Rental & Leasing | 0 (0.0%) | 0 (0.0%) |
| Professional & Scientific | 7 (53.8%) | 6 (46.2%) |
| Enterprise Management | 0 (0.0%) | 0 (0.0%) |
| Administrative & Support | 33 (91.7%) | 3 (8.3%) |
| Educational Services | 5 (22.7%) | 17 (77.3%) |
| Health Care & Social Assistance | 4 (4.1%) | 93 (95.9%) |
| Arts, Entertainment & Recreation | 0 (0.0%) | 9 (100.0%) |
| Accommodation & Food Services | 5 (22.7%) | 17 (77.3%) |
| Public Administration | 24 (80.0%) | 6 (20.0%) |
| Total | 265 (52.0%) | 245 (48.0%) |
Education in Scanlon
School Enrollment in Scanlon
The most common levels of schooling among the 222 students in Scanlon are high school (67 | 30.2%), middle school (48 | 21.6%), and elementary school (41 | 18.5%).
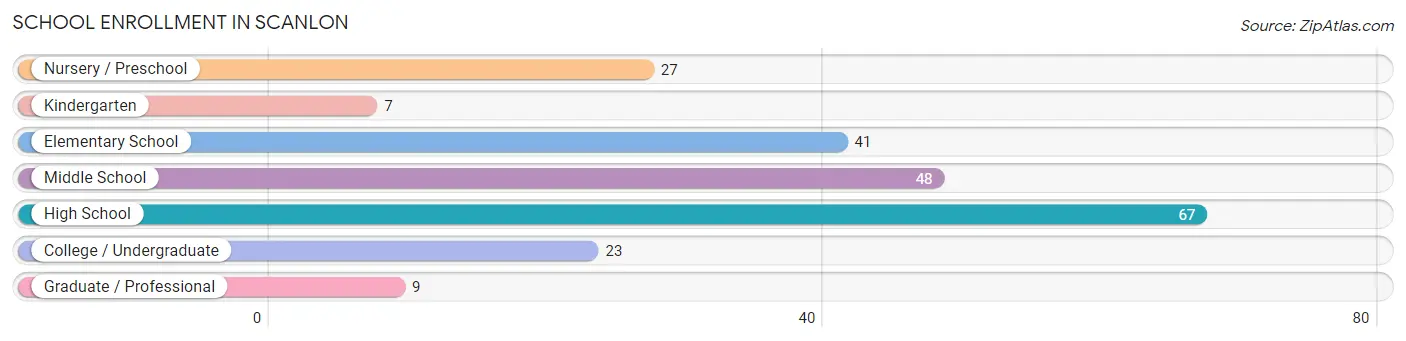
| School Level | # Students | % Students |
| Nursery / Preschool | 27 | 12.2% |
| Kindergarten | 7 | 3.2% |
| Elementary School | 41 | 18.5% |
| Middle School | 48 | 21.6% |
| High School | 67 | 30.2% |
| College / Undergraduate | 23 | 10.4% |
| Graduate / Professional | 9 | 4.1% |
| Total | 222 | 100.0% |
School Enrollment by Age by Funding Source in Scanlon
Out of a total of 222 students who are enrolled in schools in Scanlon, 3 (1.4%) attend a private institution, while the remaining 219 (98.6%) are enrolled in public schools. The age group of 20 to 24 year olds has the highest likelihood of being enrolled in private schools, with 2 (15.4% in the age bracket) enrolled. Conversely, the age group of 5 to 9 year old has the lowest likelihood of being enrolled in a private school, with 68 (100.0% in the age bracket) attending a public institution.
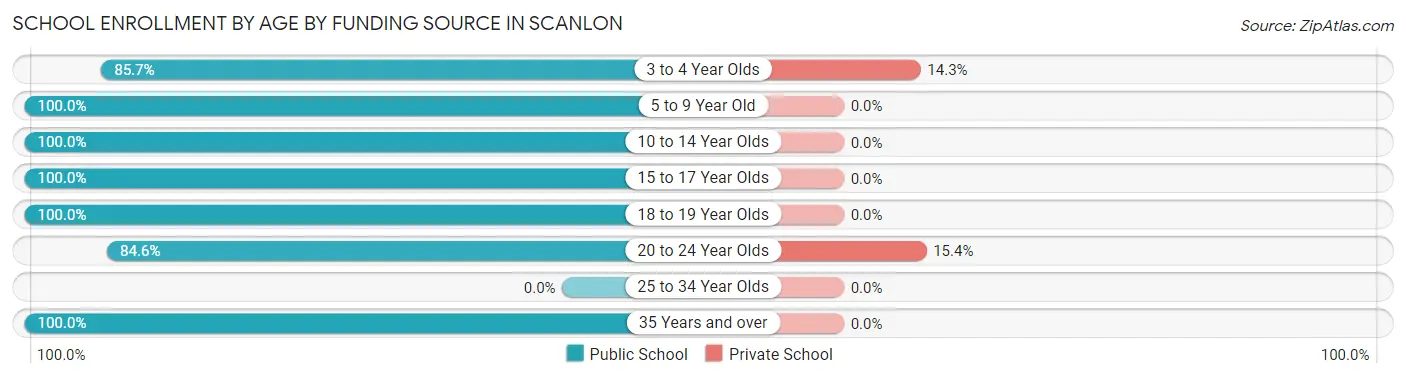
| Age Bracket | Public School | Private School |
| 3 to 4 Year Olds | 6 (85.7%) | 1 (14.3%) |
| 5 to 9 Year Old | 68 (100.0%) | 0 (0.0%) |
| 10 to 14 Year Olds | 48 (100.0%) | 0 (0.0%) |
| 15 to 17 Year Olds | 49 (100.0%) | 0 (0.0%) |
| 18 to 19 Year Olds | 19 (100.0%) | 0 (0.0%) |
| 20 to 24 Year Olds | 11 (84.6%) | 2 (15.4%) |
| 25 to 34 Year Olds | 0 (0.0%) | 0 (0.0%) |
| 35 Years and over | 18 (100.0%) | 0 (0.0%) |
| Total | 219 (98.6%) | 3 (1.4%) |
Educational Attainment by Field of Study in Scanlon
Science & technology (28 | 18.1%), business (28 | 18.1%), arts & humanities (28 | 18.1%), bio, nature & agricultural (25 | 16.1%), and education (13 | 8.4%) are the most common fields of study among 155 individuals in Scanlon who have obtained a bachelor's degree or higher.
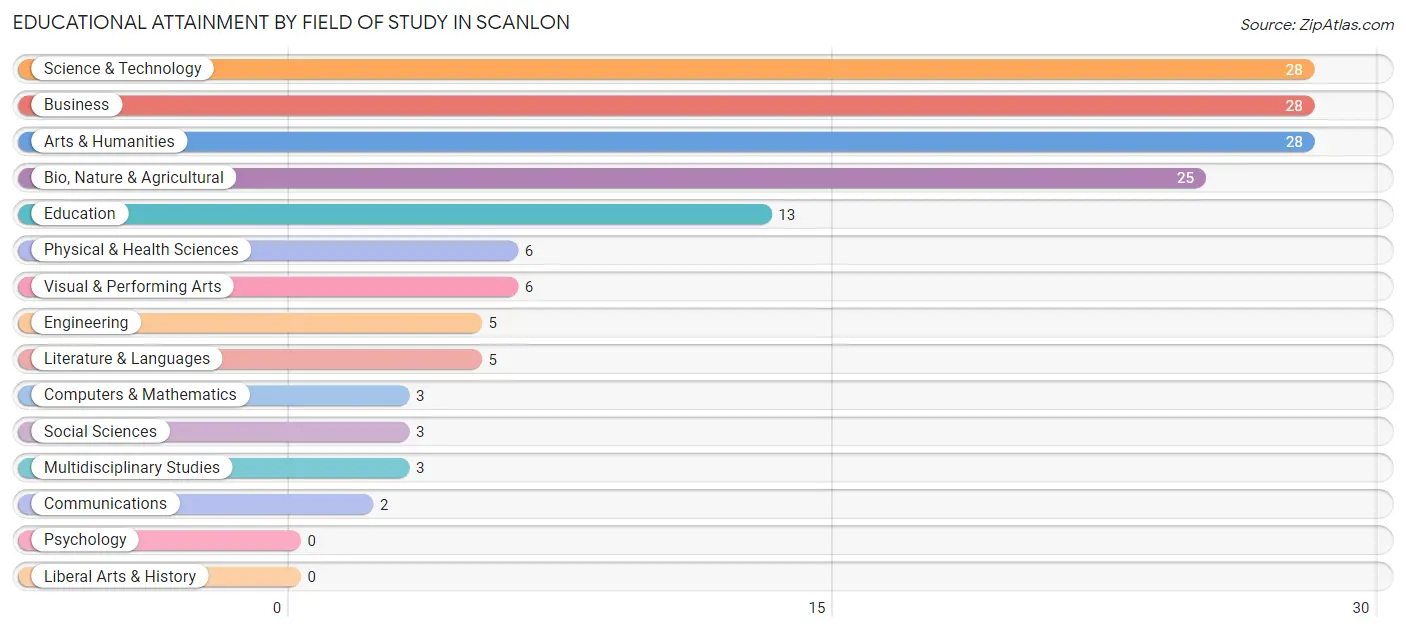
| Field of Study | # Graduates | % Graduates |
| Computers & Mathematics | 3 | 1.9% |
| Bio, Nature & Agricultural | 25 | 16.1% |
| Physical & Health Sciences | 6 | 3.9% |
| Psychology | 0 | 0.0% |
| Social Sciences | 3 | 1.9% |
| Engineering | 5 | 3.2% |
| Multidisciplinary Studies | 3 | 1.9% |
| Science & Technology | 28 | 18.1% |
| Business | 28 | 18.1% |
| Education | 13 | 8.4% |
| Literature & Languages | 5 | 3.2% |
| Liberal Arts & History | 0 | 0.0% |
| Visual & Performing Arts | 6 | 3.9% |
| Communications | 2 | 1.3% |
| Arts & Humanities | 28 | 18.1% |
| Total | 155 | 100.0% |
Transportation & Commute in Scanlon
Vehicle Availability by Sex in Scanlon
The most prevalent vehicle ownership categories in Scanlon are males with 3 vehicles (93, accounting for 38.8%) and females with 3 vehicles (79, making up 35.8%).
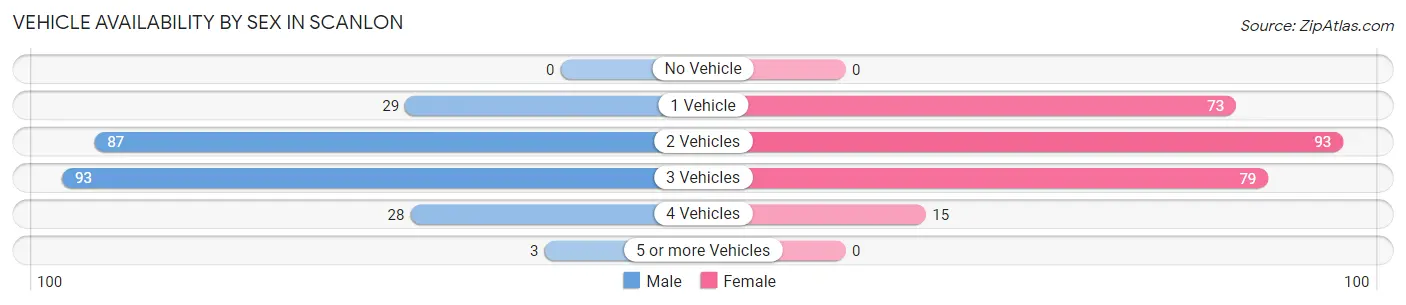
| Vehicles Available | Male | Female |
| No Vehicle | 0 (0.0%) | 0 (0.0%) |
| 1 Vehicle | 29 (12.1%) | 73 (28.1%) |
| 2 Vehicles | 87 (36.2%) | 93 (35.8%) |
| 3 Vehicles | 93 (38.8%) | 79 (30.4%) |
| 4 Vehicles | 28 (11.7%) | 15 (5.8%) |
| 5 or more Vehicles | 3 (1.3%) | 0 (0.0%) |
| Total | 240 (100.0%) | 260 (100.0%) |
Commute Time in Scanlon
The most frequently occuring commute durations in Scanlon are 5 to 9 minutes (163 commuters, 34.1%), 25 to 29 minutes (76 commuters, 15.9%), and less than 5 minutes (65 commuters, 13.6%).
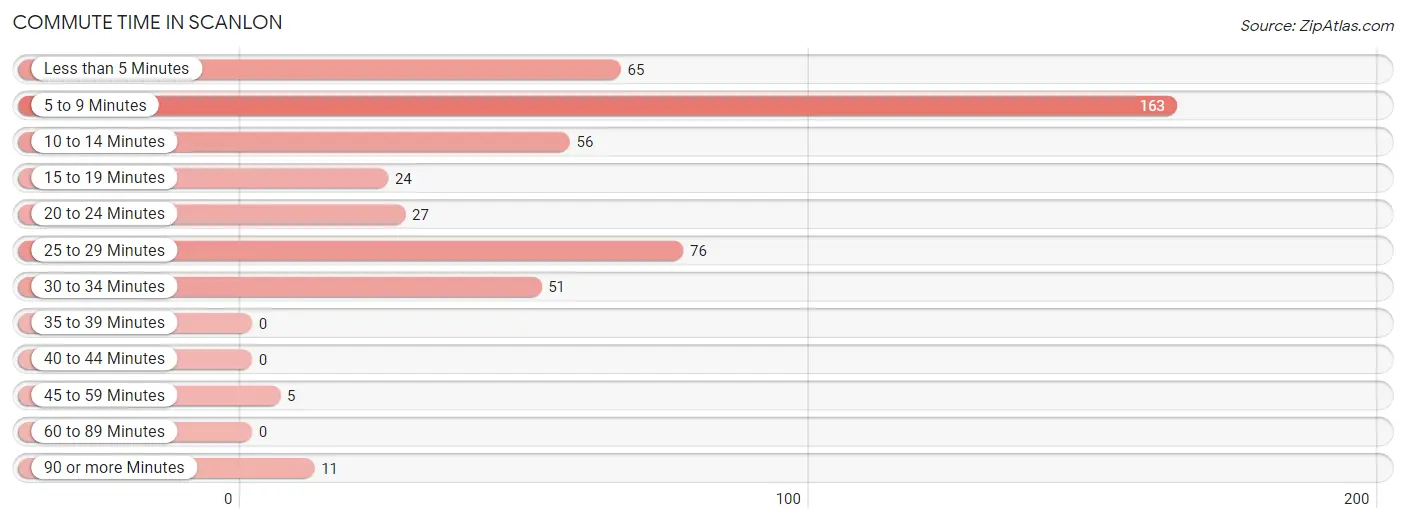
| Commute Time | # Commuters | % Commuters |
| Less than 5 Minutes | 65 | 13.6% |
| 5 to 9 Minutes | 163 | 34.1% |
| 10 to 14 Minutes | 56 | 11.7% |
| 15 to 19 Minutes | 24 | 5.0% |
| 20 to 24 Minutes | 27 | 5.7% |
| 25 to 29 Minutes | 76 | 15.9% |
| 30 to 34 Minutes | 51 | 10.7% |
| 35 to 39 Minutes | 0 | 0.0% |
| 40 to 44 Minutes | 0 | 0.0% |
| 45 to 59 Minutes | 5 | 1.1% |
| 60 to 89 Minutes | 0 | 0.0% |
| 90 or more Minutes | 11 | 2.3% |
Commute Time by Sex in Scanlon
The most common commute times in Scanlon are 5 to 9 minutes (85 commuters, 36.6%) for males and 5 to 9 minutes (78 commuters, 31.7%) for females.
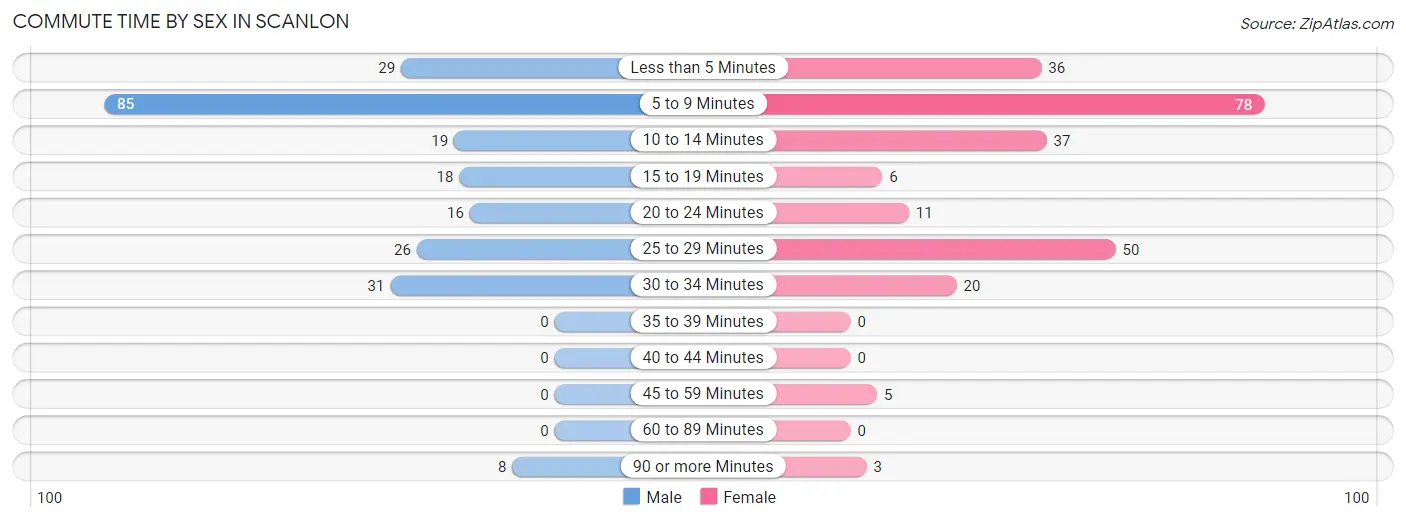
| Commute Time | Male | Female |
| Less than 5 Minutes | 29 (12.5%) | 36 (14.6%) |
| 5 to 9 Minutes | 85 (36.6%) | 78 (31.7%) |
| 10 to 14 Minutes | 19 (8.2%) | 37 (15.0%) |
| 15 to 19 Minutes | 18 (7.8%) | 6 (2.4%) |
| 20 to 24 Minutes | 16 (6.9%) | 11 (4.5%) |
| 25 to 29 Minutes | 26 (11.2%) | 50 (20.3%) |
| 30 to 34 Minutes | 31 (13.4%) | 20 (8.1%) |
| 35 to 39 Minutes | 0 (0.0%) | 0 (0.0%) |
| 40 to 44 Minutes | 0 (0.0%) | 0 (0.0%) |
| 45 to 59 Minutes | 0 (0.0%) | 5 (2.0%) |
| 60 to 89 Minutes | 0 (0.0%) | 0 (0.0%) |
| 90 or more Minutes | 8 (3.5%) | 3 (1.2%) |
Time of Departure to Work by Sex in Scanlon
The most frequent times of departure to work in Scanlon are 5:00 AM to 5:29 AM (44, 19.0%) for males and 7:00 AM to 7:29 AM (54, 22.0%) for females.
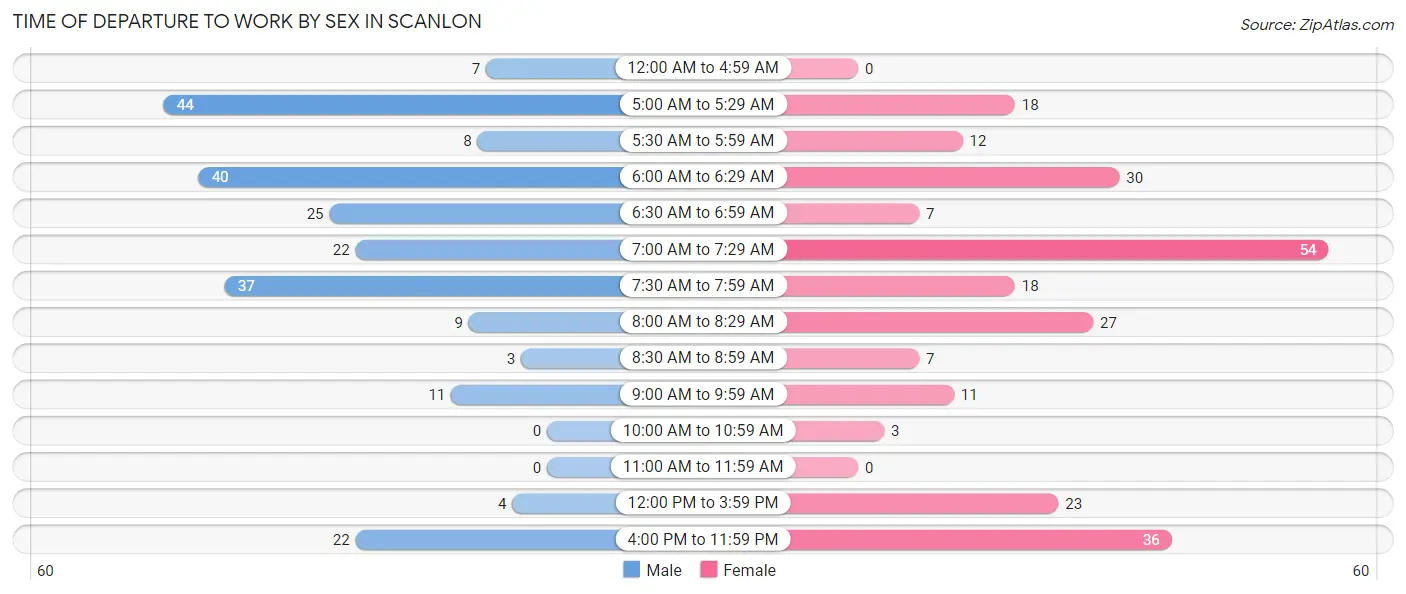
| Time of Departure | Male | Female |
| 12:00 AM to 4:59 AM | 7 (3.0%) | 0 (0.0%) |
| 5:00 AM to 5:29 AM | 44 (19.0%) | 18 (7.3%) |
| 5:30 AM to 5:59 AM | 8 (3.5%) | 12 (4.9%) |
| 6:00 AM to 6:29 AM | 40 (17.2%) | 30 (12.2%) |
| 6:30 AM to 6:59 AM | 25 (10.8%) | 7 (2.9%) |
| 7:00 AM to 7:29 AM | 22 (9.5%) | 54 (22.0%) |
| 7:30 AM to 7:59 AM | 37 (16.0%) | 18 (7.3%) |
| 8:00 AM to 8:29 AM | 9 (3.9%) | 27 (11.0%) |
| 8:30 AM to 8:59 AM | 3 (1.3%) | 7 (2.9%) |
| 9:00 AM to 9:59 AM | 11 (4.7%) | 11 (4.5%) |
| 10:00 AM to 10:59 AM | 0 (0.0%) | 3 (1.2%) |
| 11:00 AM to 11:59 AM | 0 (0.0%) | 0 (0.0%) |
| 12:00 PM to 3:59 PM | 4 (1.7%) | 23 (9.3%) |
| 4:00 PM to 11:59 PM | 22 (9.5%) | 36 (14.6%) |
| Total | 232 (100.0%) | 246 (100.0%) |
Housing Occupancy in Scanlon
Occupancy by Ownership in Scanlon
Of the total 461 dwellings in Scanlon, owner-occupied units account for 425 (92.2%), while renter-occupied units make up 36 (7.8%).
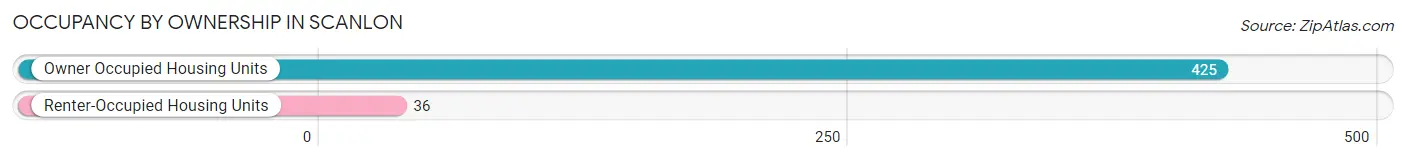
| Occupancy | # Housing Units | % Housing Units |
| Owner Occupied Housing Units | 425 | 92.2% |
| Renter-Occupied Housing Units | 36 | 7.8% |
| Total Occupied Housing Units | 461 | 100.0% |
Occupancy by Household Size in Scanlon
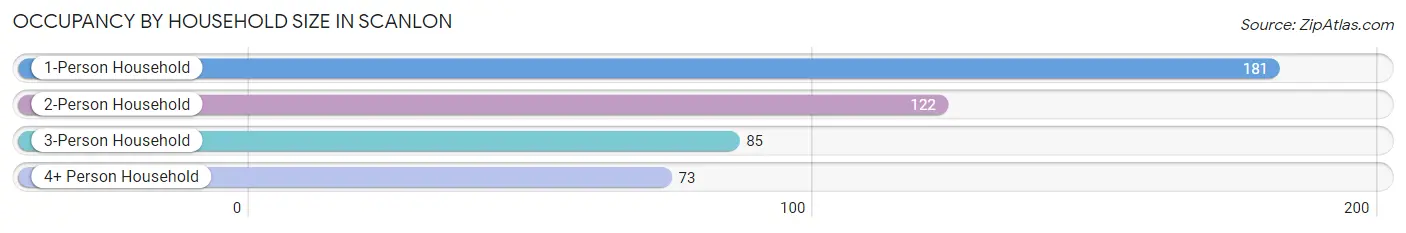
| Household Size | # Housing Units | % Housing Units |
| 1-Person Household | 181 | 39.3% |
| 2-Person Household | 122 | 26.5% |
| 3-Person Household | 85 | 18.4% |
| 4+ Person Household | 73 | 15.8% |
| Total Housing Units | 461 | 100.0% |
Occupancy by Ownership by Household Size in Scanlon
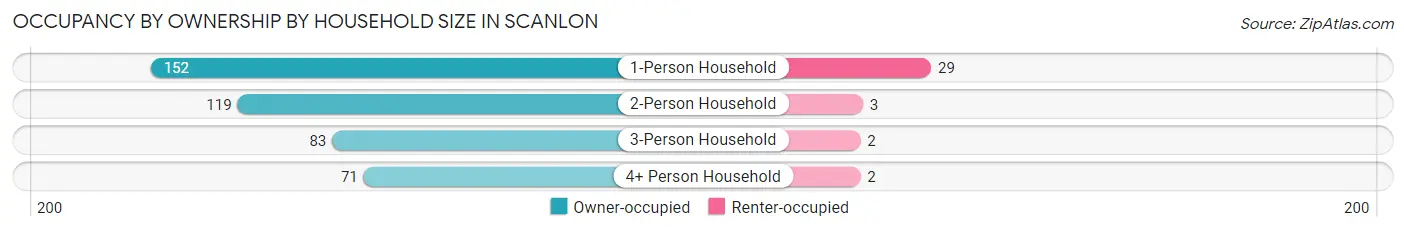
| Household Size | Owner-occupied | Renter-occupied |
| 1-Person Household | 152 (84.0%) | 29 (16.0%) |
| 2-Person Household | 119 (97.5%) | 3 (2.5%) |
| 3-Person Household | 83 (97.7%) | 2 (2.4%) |
| 4+ Person Household | 71 (97.3%) | 2 (2.7%) |
| Total Housing Units | 425 (92.2%) | 36 (7.8%) |
Occupancy by Educational Attainment in Scanlon
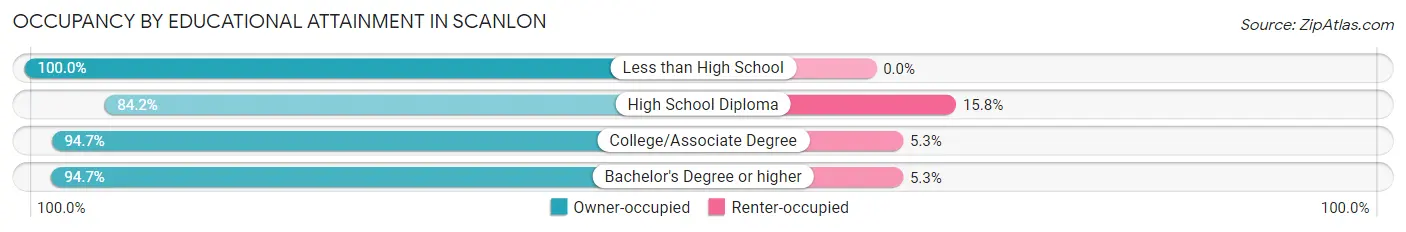
| Household Size | Owner-occupied | Renter-occupied |
| Less than High School | 22 (100.0%) | 0 (0.0%) |
| High School Diploma | 101 (84.2%) | 19 (15.8%) |
| College/Associate Degree | 213 (94.7%) | 12 (5.3%) |
| Bachelor's Degree or higher | 89 (94.7%) | 5 (5.3%) |
Occupancy by Age of Householder in Scanlon
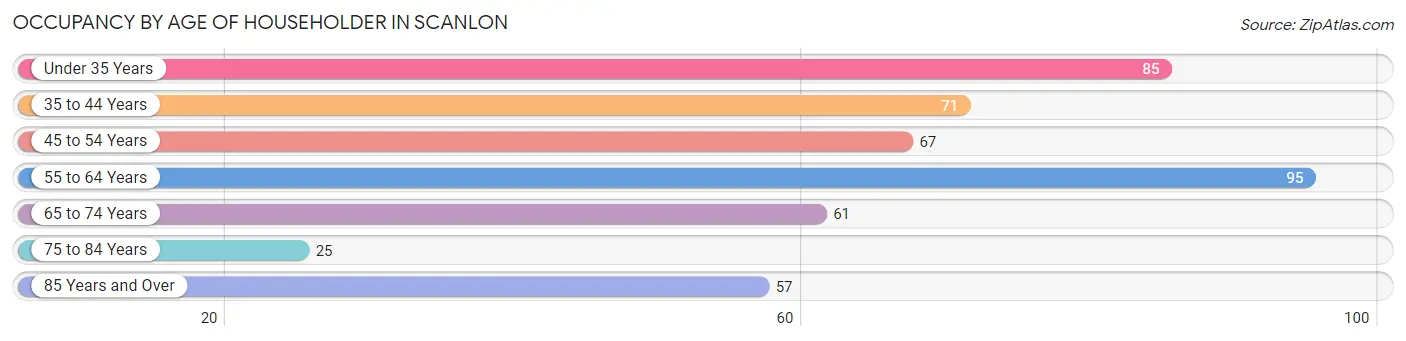
| Age Bracket | # Households | % Households |
| Under 35 Years | 85 | 18.4% |
| 35 to 44 Years | 71 | 15.4% |
| 45 to 54 Years | 67 | 14.5% |
| 55 to 64 Years | 95 | 20.6% |
| 65 to 74 Years | 61 | 13.2% |
| 75 to 84 Years | 25 | 5.4% |
| 85 Years and Over | 57 | 12.4% |
| Total | 461 | 100.0% |
Housing Finances in Scanlon
Median Income by Occupancy in Scanlon
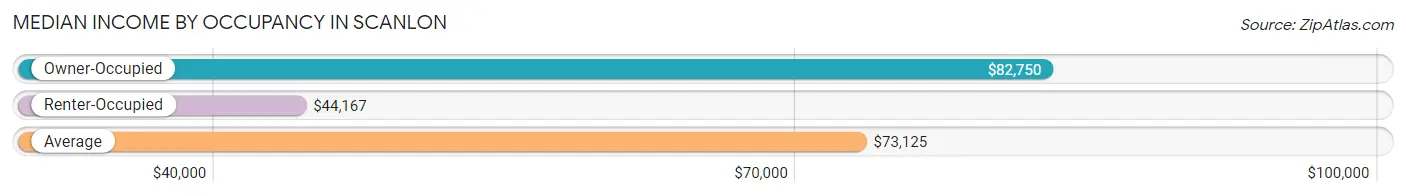
| Occupancy Type | # Households | Median Income |
| Owner-Occupied | 425 (92.2%) | $82,750 |
| Renter-Occupied | 36 (7.8%) | $44,167 |
| Average | 461 (100.0%) | $73,125 |
Occupancy by Householder Income Bracket in Scanlon
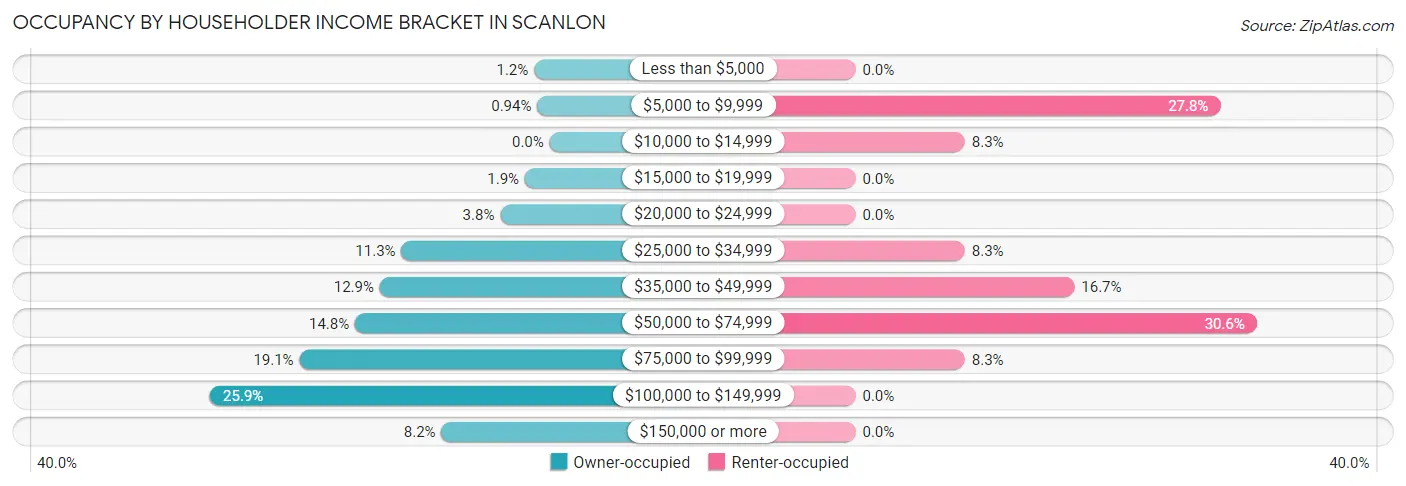
| Income Bracket | Owner-occupied | Renter-occupied |
| Less than $5,000 | 5 (1.2%) | 0 (0.0%) |
| $5,000 to $9,999 | 4 (0.9%) | 10 (27.8%) |
| $10,000 to $14,999 | 0 (0.0%) | 3 (8.3%) |
| $15,000 to $19,999 | 8 (1.9%) | 0 (0.0%) |
| $20,000 to $24,999 | 16 (3.8%) | 0 (0.0%) |
| $25,000 to $34,999 | 48 (11.3%) | 3 (8.3%) |
| $35,000 to $49,999 | 55 (12.9%) | 6 (16.7%) |
| $50,000 to $74,999 | 63 (14.8%) | 11 (30.6%) |
| $75,000 to $99,999 | 81 (19.1%) | 3 (8.3%) |
| $100,000 to $149,999 | 110 (25.9%) | 0 (0.0%) |
| $150,000 or more | 35 (8.2%) | 0 (0.0%) |
| Total | 425 (100.0%) | 36 (100.0%) |
Monthly Housing Cost Tiers in Scanlon
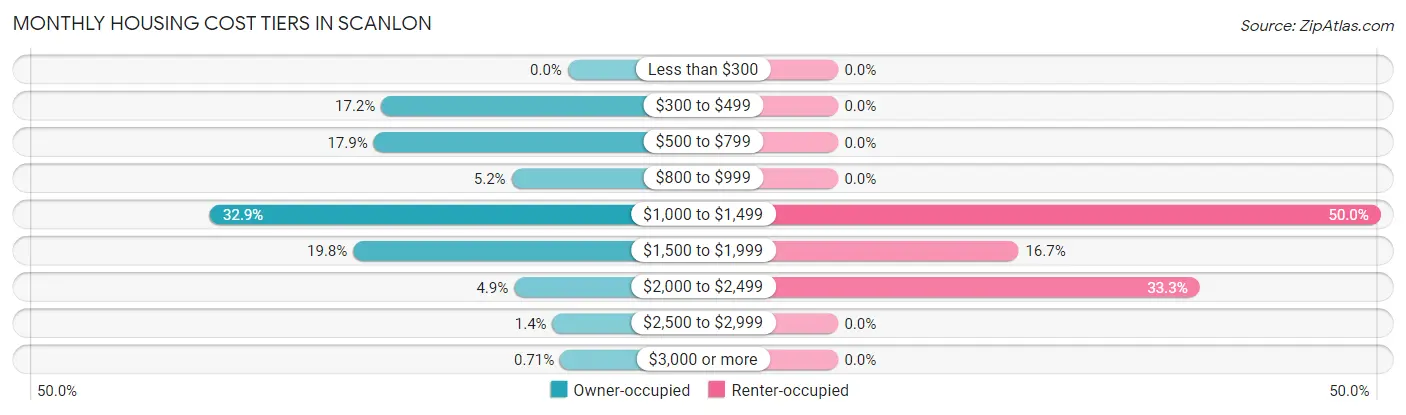
| Monthly Cost | Owner-occupied | Renter-occupied |
| Less than $300 | 0 (0.0%) | 0 (0.0%) |
| $300 to $499 | 73 (17.2%) | 0 (0.0%) |
| $500 to $799 | 76 (17.9%) | 0 (0.0%) |
| $800 to $999 | 22 (5.2%) | 0 (0.0%) |
| $1,000 to $1,499 | 140 (32.9%) | 18 (50.0%) |
| $1,500 to $1,999 | 84 (19.8%) | 6 (16.7%) |
| $2,000 to $2,499 | 21 (4.9%) | 12 (33.3%) |
| $2,500 to $2,999 | 6 (1.4%) | 0 (0.0%) |
| $3,000 or more | 3 (0.7%) | 0 (0.0%) |
| Total | 425 (100.0%) | 36 (100.0%) |
Physical Housing Characteristics in Scanlon
Housing Structures in Scanlon
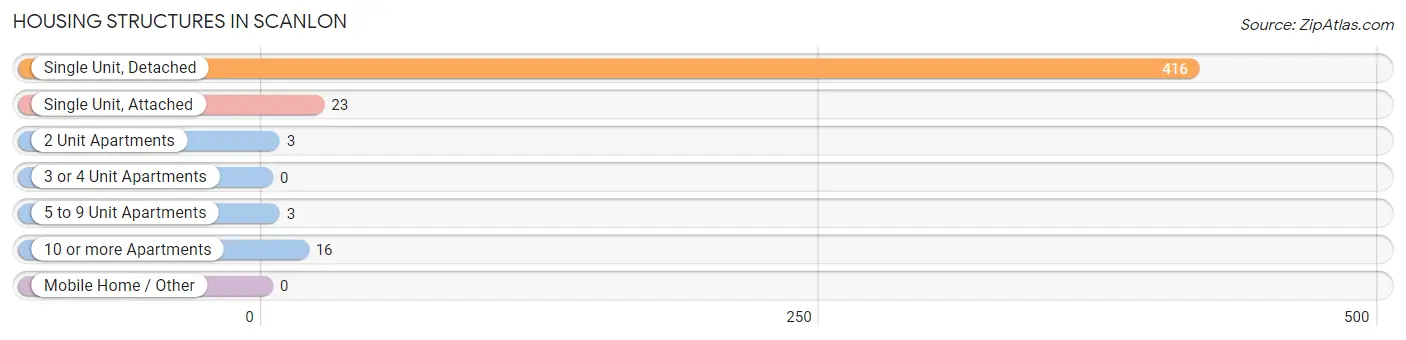
| Structure Type | # Housing Units | % Housing Units |
| Single Unit, Detached | 416 | 90.2% |
| Single Unit, Attached | 23 | 5.0% |
| 2 Unit Apartments | 3 | 0.6% |
| 3 or 4 Unit Apartments | 0 | 0.0% |
| 5 to 9 Unit Apartments | 3 | 0.6% |
| 10 or more Apartments | 16 | 3.5% |
| Mobile Home / Other | 0 | 0.0% |
| Total | 461 | 100.0% |
Housing Structures by Occupancy in Scanlon
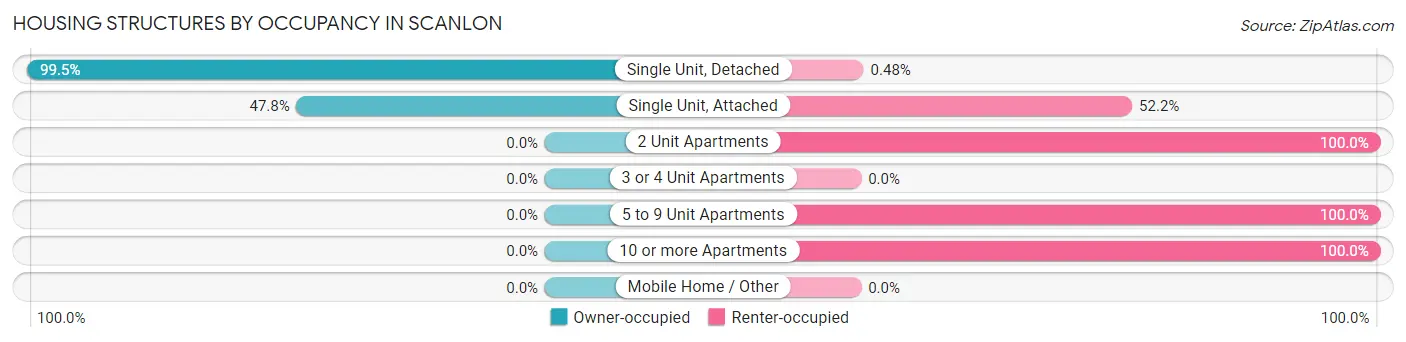
| Structure Type | Owner-occupied | Renter-occupied |
| Single Unit, Detached | 414 (99.5%) | 2 (0.5%) |
| Single Unit, Attached | 11 (47.8%) | 12 (52.2%) |
| 2 Unit Apartments | 0 (0.0%) | 3 (100.0%) |
| 3 or 4 Unit Apartments | 0 (0.0%) | 0 (0.0%) |
| 5 to 9 Unit Apartments | 0 (0.0%) | 3 (100.0%) |
| 10 or more Apartments | 0 (0.0%) | 16 (100.0%) |
| Mobile Home / Other | 0 (0.0%) | 0 (0.0%) |
| Total | 425 (92.2%) | 36 (7.8%) |
Housing Structures by Number of Rooms in Scanlon
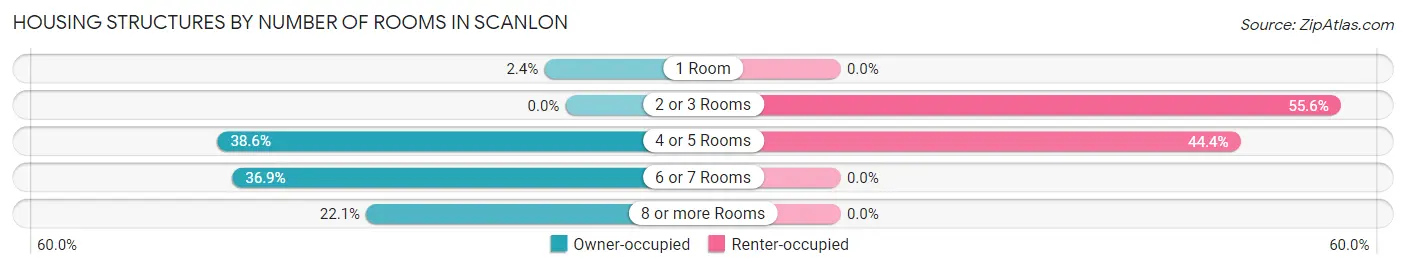
| Number of Rooms | Owner-occupied | Renter-occupied |
| 1 Room | 10 (2.4%) | 0 (0.0%) |
| 2 or 3 Rooms | 0 (0.0%) | 20 (55.6%) |
| 4 or 5 Rooms | 164 (38.6%) | 16 (44.4%) |
| 6 or 7 Rooms | 157 (36.9%) | 0 (0.0%) |
| 8 or more Rooms | 94 (22.1%) | 0 (0.0%) |
| Total | 425 (100.0%) | 36 (100.0%) |
Housing Structure by Heating Type in Scanlon
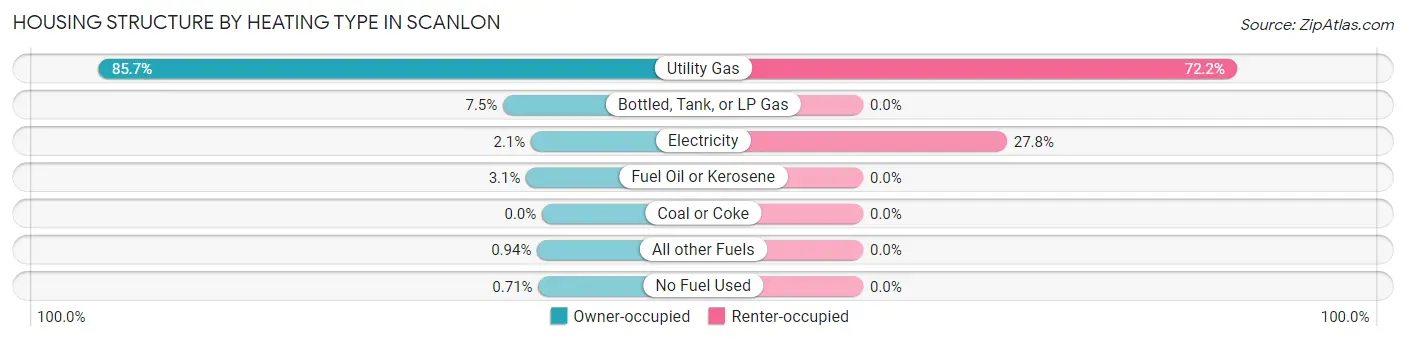
| Heating Type | Owner-occupied | Renter-occupied |
| Utility Gas | 364 (85.7%) | 26 (72.2%) |
| Bottled, Tank, or LP Gas | 32 (7.5%) | 0 (0.0%) |
| Electricity | 9 (2.1%) | 10 (27.8%) |
| Fuel Oil or Kerosene | 13 (3.1%) | 0 (0.0%) |
| Coal or Coke | 0 (0.0%) | 0 (0.0%) |
| All other Fuels | 4 (0.9%) | 0 (0.0%) |
| No Fuel Used | 3 (0.7%) | 0 (0.0%) |
| Total | 425 (100.0%) | 36 (100.0%) |
Household Vehicle Usage in Scanlon
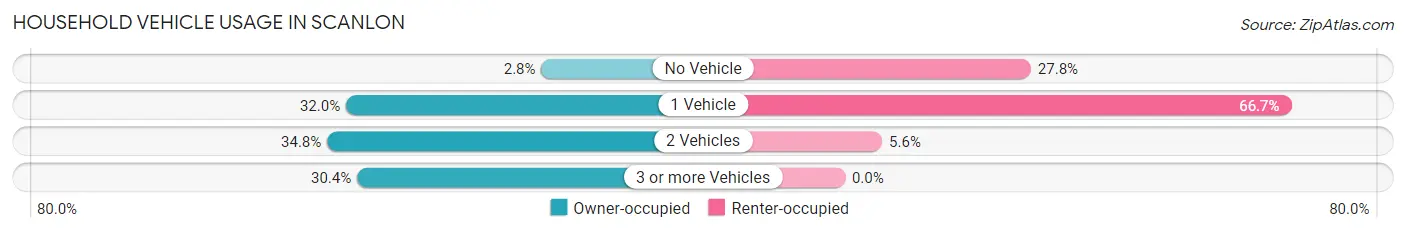
| Vehicles per Household | Owner-occupied | Renter-occupied |
| No Vehicle | 12 (2.8%) | 10 (27.8%) |
| 1 Vehicle | 136 (32.0%) | 24 (66.7%) |
| 2 Vehicles | 148 (34.8%) | 2 (5.6%) |
| 3 or more Vehicles | 129 (30.3%) | 0 (0.0%) |
| Total | 425 (100.0%) | 36 (100.0%) |
Real Estate & Mortgages in Scanlon
Real Estate and Mortgage Overview in Scanlon
| Characteristic | Without Mortgage | With Mortgage |
| Housing Units | 156 | 269 |
| Median Property Value | $189,900 | $217,400 |
| Median Household Income | $62,000 | $21 |
| Monthly Housing Costs | $518 | $3 |
| Real Estate Taxes | $2,828 | $0 |
Property Value by Mortgage Status in Scanlon
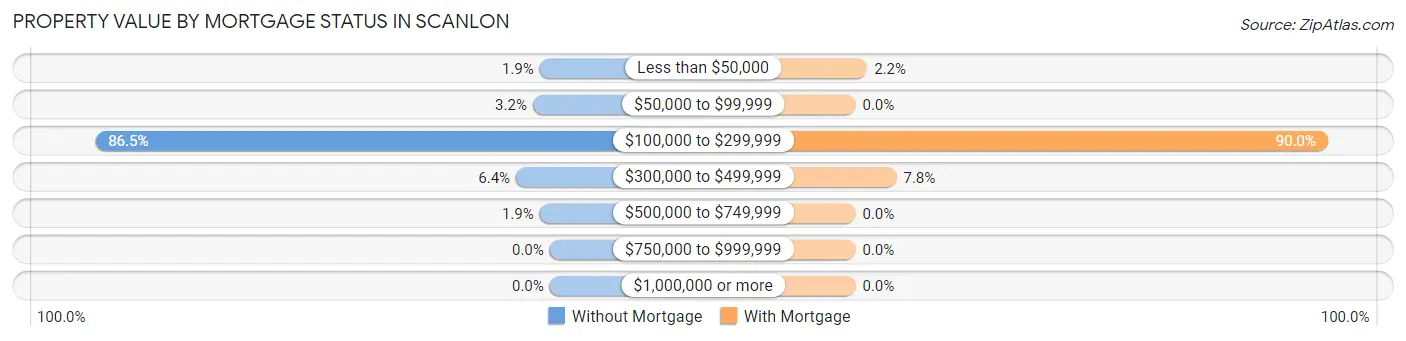
| Property Value | Without Mortgage | With Mortgage |
| Less than $50,000 | 3 (1.9%) | 6 (2.2%) |
| $50,000 to $99,999 | 5 (3.2%) | 0 (0.0%) |
| $100,000 to $299,999 | 135 (86.5%) | 242 (90.0%) |
| $300,000 to $499,999 | 10 (6.4%) | 21 (7.8%) |
| $500,000 to $749,999 | 3 (1.9%) | 0 (0.0%) |
| $750,000 to $999,999 | 0 (0.0%) | 0 (0.0%) |
| $1,000,000 or more | 0 (0.0%) | 0 (0.0%) |
| Total | 156 (100.0%) | 269 (100.0%) |
Household Income by Mortgage Status in Scanlon
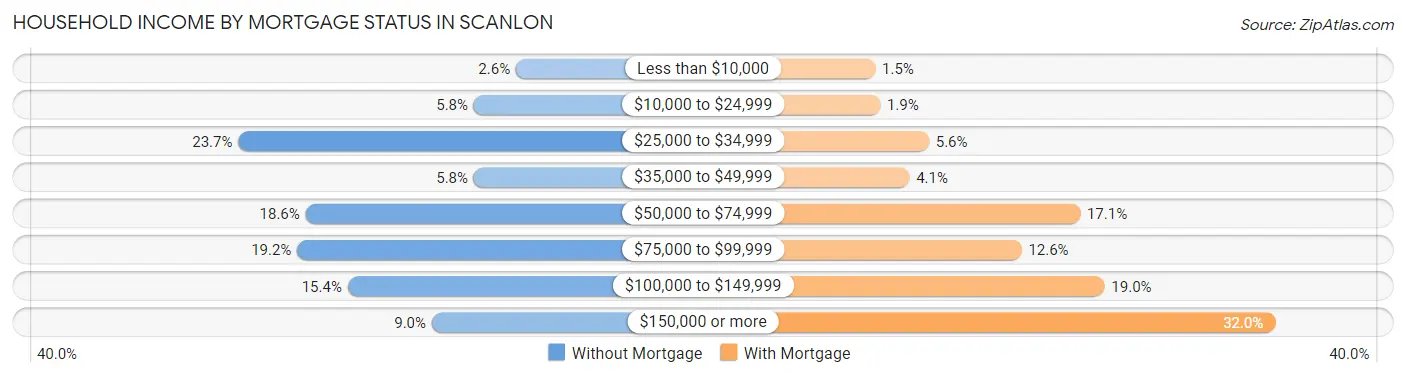
| Household Income | Without Mortgage | With Mortgage |
| Less than $10,000 | 4 (2.6%) | 4 (1.5%) |
| $10,000 to $24,999 | 9 (5.8%) | 5 (1.9%) |
| $25,000 to $34,999 | 37 (23.7%) | 15 (5.6%) |
| $35,000 to $49,999 | 9 (5.8%) | 11 (4.1%) |
| $50,000 to $74,999 | 29 (18.6%) | 46 (17.1%) |
| $75,000 to $99,999 | 30 (19.2%) | 34 (12.6%) |
| $100,000 to $149,999 | 24 (15.4%) | 51 (19.0%) |
| $150,000 or more | 14 (9.0%) | 86 (32.0%) |
| Total | 156 (100.0%) | 269 (100.0%) |
Property Value to Household Income Ratio in Scanlon
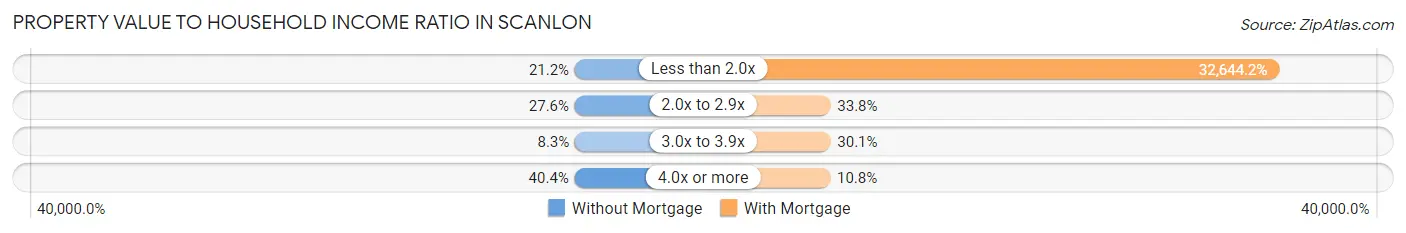
| Value-to-Income Ratio | Without Mortgage | With Mortgage |
| Less than 2.0x | 33 (21.1%) | 87,813 (32,644.2%) |
| 2.0x to 2.9x | 43 (27.6%) | 91 (33.8%) |
| 3.0x to 3.9x | 13 (8.3%) | 81 (30.1%) |
| 4.0x or more | 63 (40.4%) | 29 (10.8%) |
| Total | 156 (100.0%) | 269 (100.0%) |
Real Estate Taxes by Mortgage Status in Scanlon
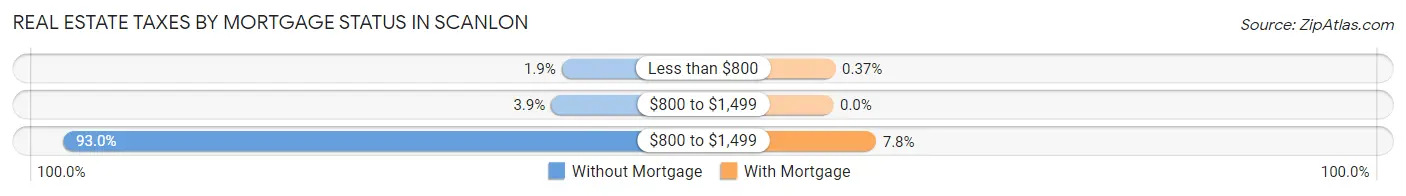
| Property Taxes | Without Mortgage | With Mortgage |
| Less than $800 | 3 (1.9%) | 1 (0.4%) |
| $800 to $1,499 | 6 (3.8%) | 0 (0.0%) |
| $800 to $1,499 | 145 (92.9%) | 21 (7.8%) |
| Total | 156 (100.0%) | 269 (100.0%) |
Health & Disability in Scanlon
Health Insurance Coverage by Age in Scanlon
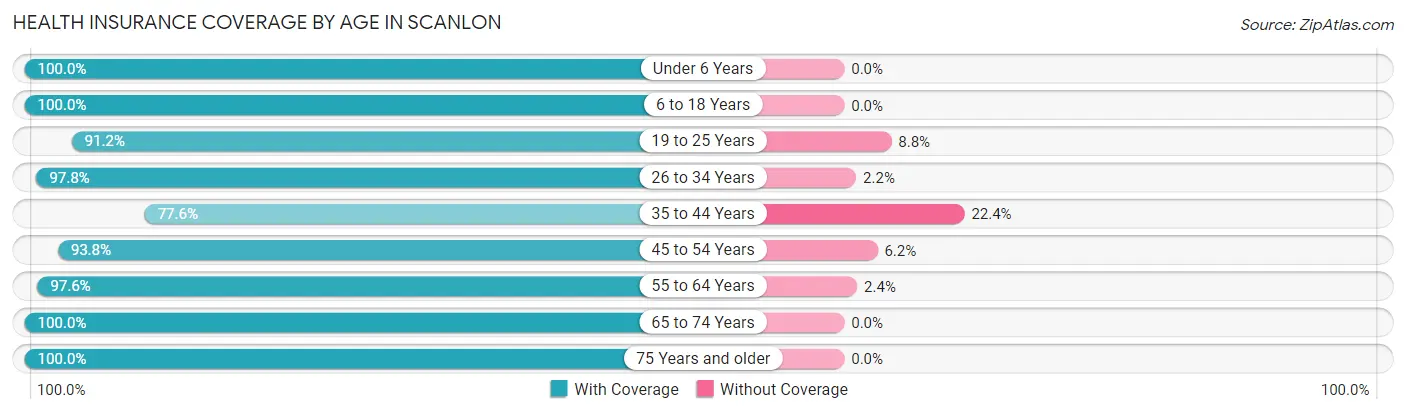
| Age Bracket | With Coverage | Without Coverage |
| Under 6 Years | 79 (100.0%) | 0 (0.0%) |
| 6 to 18 Years | 168 (100.0%) | 0 (0.0%) |
| 19 to 25 Years | 52 (91.2%) | 5 (8.8%) |
| 26 to 34 Years | 133 (97.8%) | 3 (2.2%) |
| 35 to 44 Years | 90 (77.6%) | 26 (22.4%) |
| 45 to 54 Years | 106 (93.8%) | 7 (6.2%) |
| 55 to 64 Years | 163 (97.6%) | 4 (2.4%) |
| 65 to 74 Years | 82 (100.0%) | 0 (0.0%) |
| 75 Years and older | 99 (100.0%) | 0 (0.0%) |
| Total | 972 (95.6%) | 45 (4.4%) |
Health Insurance Coverage by Citizenship Status in Scanlon
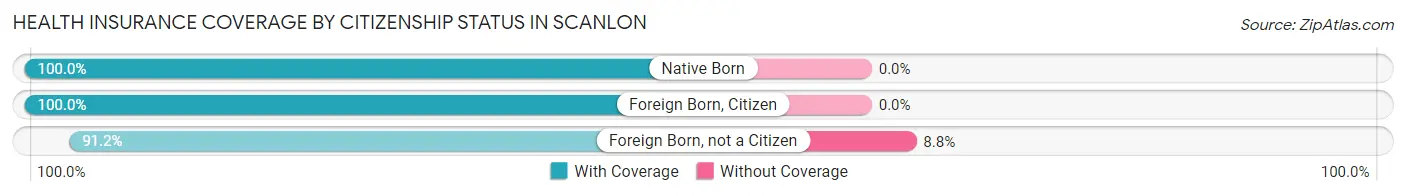
| Citizenship Status | With Coverage | Without Coverage |
| Native Born | 79 (100.0%) | 0 (0.0%) |
| Foreign Born, Citizen | 168 (100.0%) | 0 (0.0%) |
| Foreign Born, not a Citizen | 52 (91.2%) | 5 (8.8%) |
Health Insurance Coverage by Household Income in Scanlon
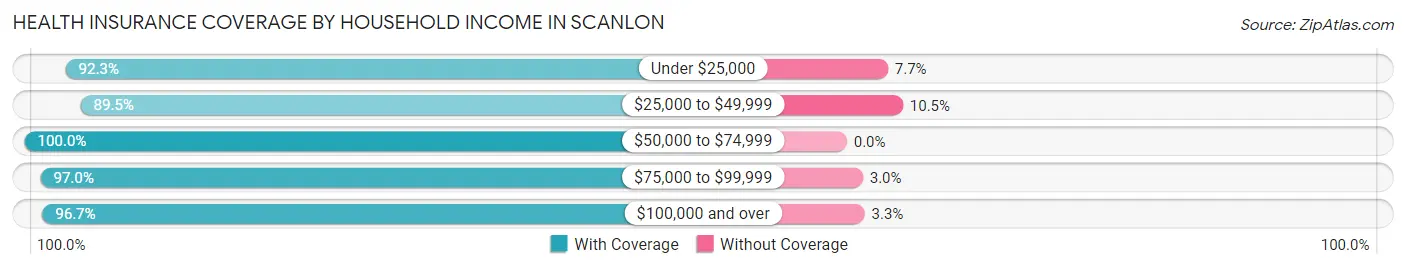
| Household Income | With Coverage | Without Coverage |
| Under $25,000 | 48 (92.3%) | 4 (7.7%) |
| $25,000 to $49,999 | 196 (89.5%) | 23 (10.5%) |
| $50,000 to $74,999 | 149 (100.0%) | 0 (0.0%) |
| $75,000 to $99,999 | 194 (97.0%) | 6 (3.0%) |
| $100,000 and over | 348 (96.7%) | 12 (3.3%) |
Public vs Private Health Insurance Coverage by Age in Scanlon
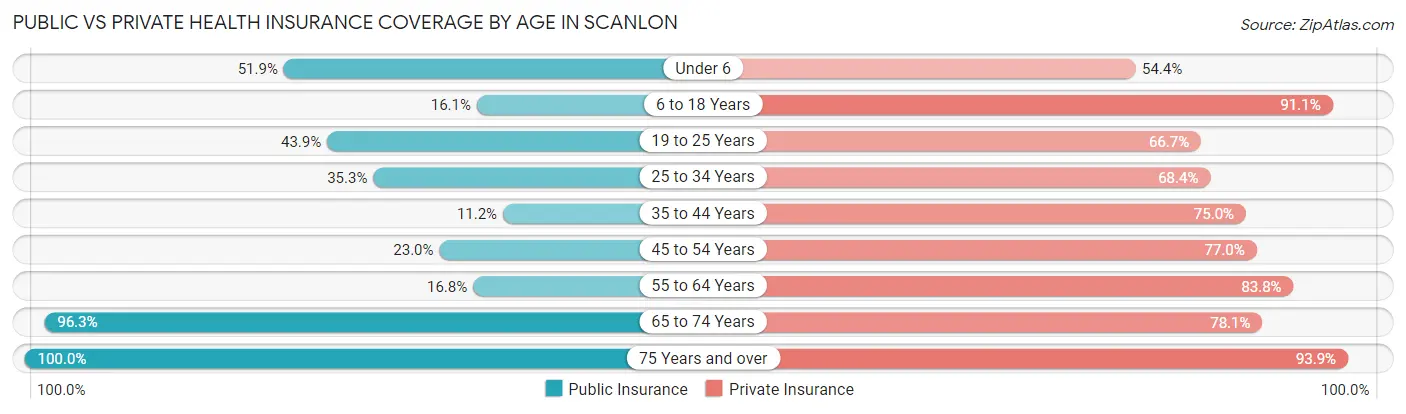
| Age Bracket | Public Insurance | Private Insurance |
| Under 6 | 41 (51.9%) | 43 (54.4%) |
| 6 to 18 Years | 27 (16.1%) | 153 (91.1%) |
| 19 to 25 Years | 25 (43.9%) | 38 (66.7%) |
| 25 to 34 Years | 48 (35.3%) | 93 (68.4%) |
| 35 to 44 Years | 13 (11.2%) | 87 (75.0%) |
| 45 to 54 Years | 26 (23.0%) | 87 (77.0%) |
| 55 to 64 Years | 28 (16.8%) | 140 (83.8%) |
| 65 to 74 Years | 79 (96.3%) | 64 (78.0%) |
| 75 Years and over | 99 (100.0%) | 93 (93.9%) |
| Total | 386 (38.0%) | 798 (78.5%) |
Disability Status by Sex by Age in Scanlon
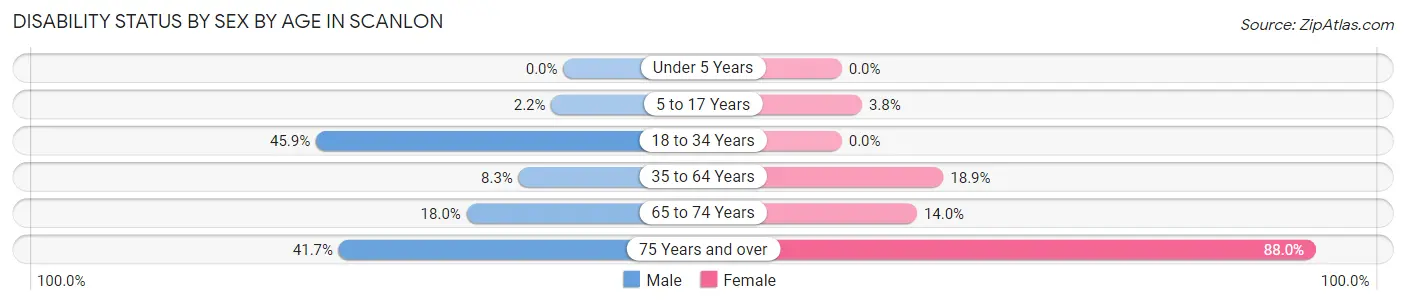
| Age Bracket | Male | Female |
| Under 5 Years | 0 (0.0%) | 0 (0.0%) |
| 5 to 17 Years | 2 (2.2%) | 3 (3.7%) |
| 18 to 34 Years | 56 (45.9%) | 0 (0.0%) |
| 35 to 64 Years | 17 (8.3%) | 36 (18.9%) |
| 65 to 74 Years | 7 (17.9%) | 6 (14.0%) |
| 75 Years and over | 10 (41.7%) | 66 (88.0%) |
Disability Class by Sex by Age in Scanlon
Disability Class: Hearing Difficulty
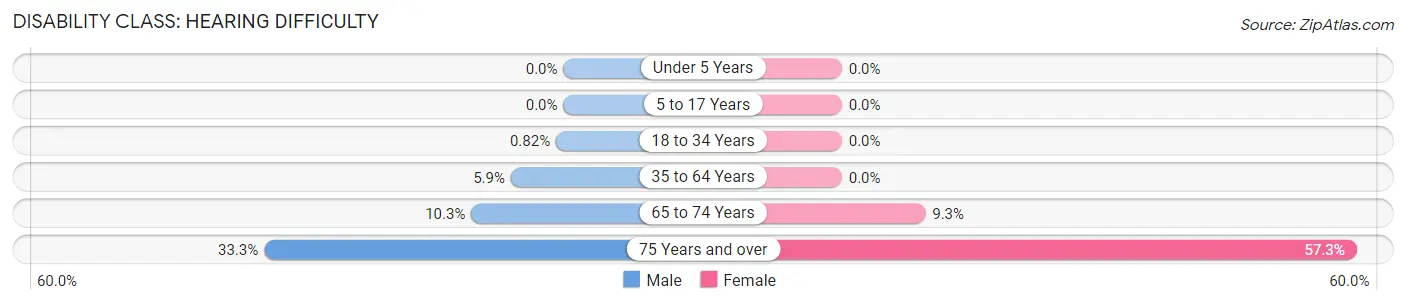
| Age Bracket | Male | Female |
| Under 5 Years | 0 (0.0%) | 0 (0.0%) |
| 5 to 17 Years | 0 (0.0%) | 0 (0.0%) |
| 18 to 34 Years | 1 (0.8%) | 0 (0.0%) |
| 35 to 64 Years | 12 (5.9%) | 0 (0.0%) |
| 65 to 74 Years | 4 (10.3%) | 4 (9.3%) |
| 75 Years and over | 8 (33.3%) | 43 (57.3%) |
Disability Class: Vision Difficulty
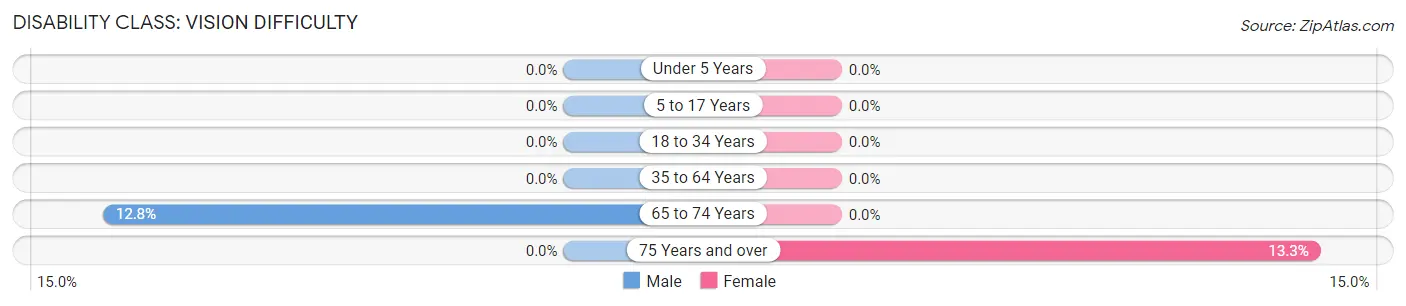
| Age Bracket | Male | Female |
| Under 5 Years | 0 (0.0%) | 0 (0.0%) |
| 5 to 17 Years | 0 (0.0%) | 0 (0.0%) |
| 18 to 34 Years | 0 (0.0%) | 0 (0.0%) |
| 35 to 64 Years | 0 (0.0%) | 0 (0.0%) |
| 65 to 74 Years | 5 (12.8%) | 0 (0.0%) |
| 75 Years and over | 0 (0.0%) | 10 (13.3%) |
Disability Class: Cognitive Difficulty
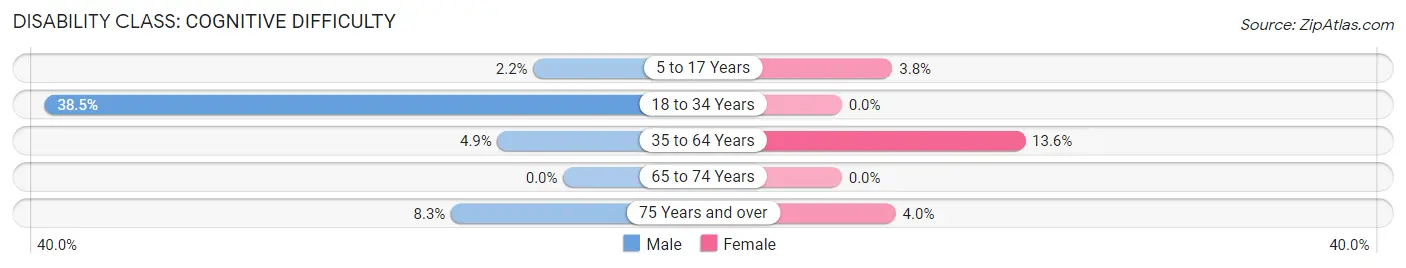
| Age Bracket | Male | Female |
| 5 to 17 Years | 2 (2.2%) | 3 (3.7%) |
| 18 to 34 Years | 47 (38.5%) | 0 (0.0%) |
| 35 to 64 Years | 10 (4.9%) | 26 (13.6%) |
| 65 to 74 Years | 0 (0.0%) | 0 (0.0%) |
| 75 Years and over | 2 (8.3%) | 3 (4.0%) |
Disability Class: Ambulatory Difficulty
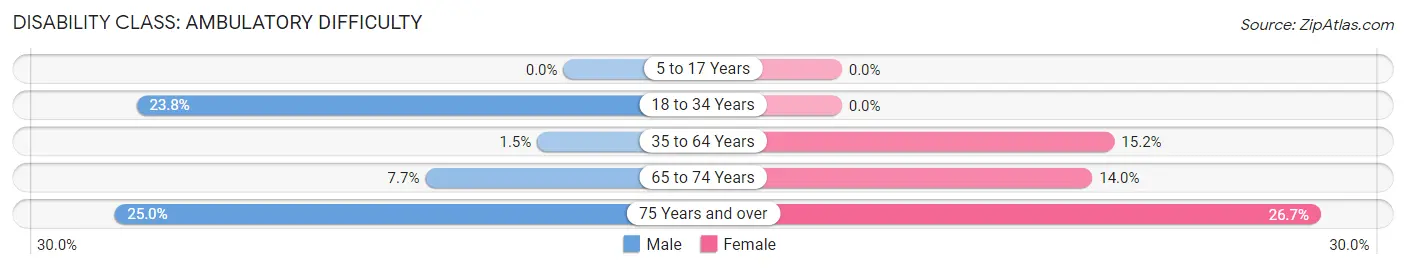
| Age Bracket | Male | Female |
| 5 to 17 Years | 0 (0.0%) | 0 (0.0%) |
| 18 to 34 Years | 29 (23.8%) | 0 (0.0%) |
| 35 to 64 Years | 3 (1.5%) | 29 (15.2%) |
| 65 to 74 Years | 3 (7.7%) | 6 (14.0%) |
| 75 Years and over | 6 (25.0%) | 20 (26.7%) |
Disability Class: Self-Care Difficulty
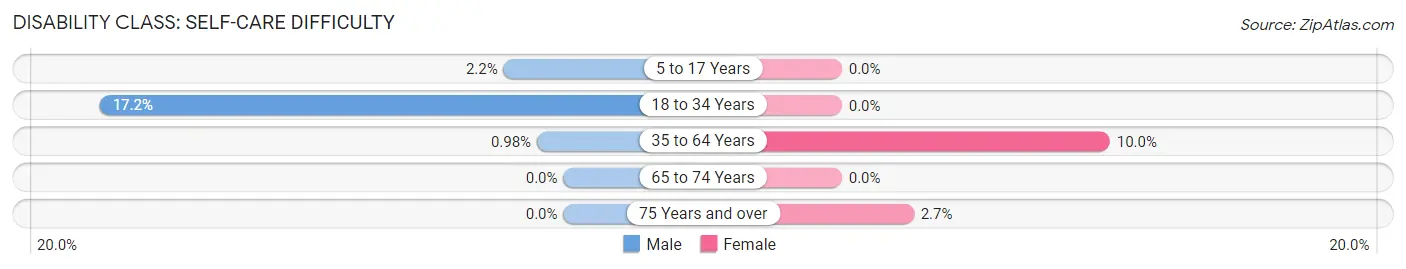
| Age Bracket | Male | Female |
| 5 to 17 Years | 2 (2.2%) | 0 (0.0%) |
| 18 to 34 Years | 21 (17.2%) | 0 (0.0%) |
| 35 to 64 Years | 2 (1.0%) | 19 (10.0%) |
| 65 to 74 Years | 0 (0.0%) | 0 (0.0%) |
| 75 Years and over | 0 (0.0%) | 2 (2.7%) |
Technology Access in Scanlon
Computing Device Access in Scanlon
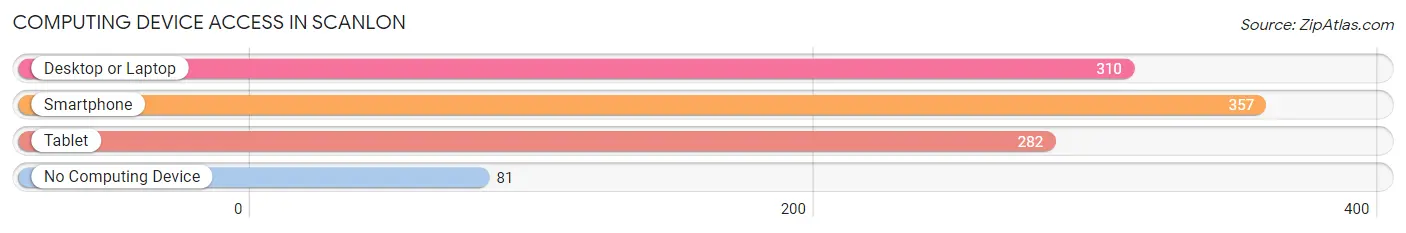
| Device Type | # Households | % Households |
| Desktop or Laptop | 310 | 67.2% |
| Smartphone | 357 | 77.4% |
| Tablet | 282 | 61.2% |
| No Computing Device | 81 | 17.6% |
| Total | 461 | 100.0% |
Internet Access in Scanlon
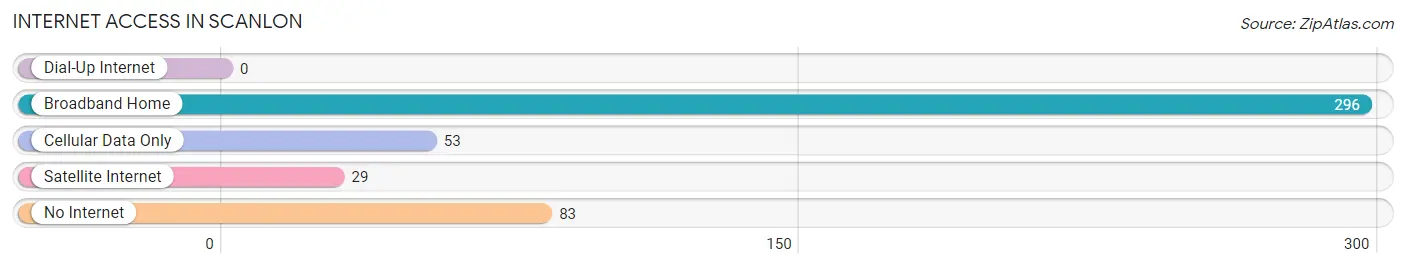
| Internet Type | # Households | % Households |
| Dial-Up Internet | 0 | 0.0% |
| Broadband Home | 296 | 64.2% |
| Cellular Data Only | 53 | 11.5% |
| Satellite Internet | 29 | 6.3% |
| No Internet | 83 | 18.0% |
| Total | 461 | 100.0% |
Scanlon Summary
Scanlon is a small unincorporated community located in Carlton County, Minnesota. It is situated on the banks of the St. Louis River, approximately 10 miles south of Cloquet and 25 miles southwest of Duluth. The population of Scanlon was estimated to be around 200 people in 2020.
History
Scanlon was founded in the late 1800s by a group of Finnish immigrants who had come to the area to work in the lumber industry. The town was named after a local lumberman, John Scanlon, who had a sawmill in the area. The town grew quickly and by the early 1900s, it had a post office, a general store, a school, and several churches.
In the 1920s, Scanlon was a thriving community with a population of over 500 people. The town had a variety of businesses, including a bank, a hotel, a movie theater, and a variety of stores. The town also had a large Finnish population, and many of the town’s residents were involved in the local lumber industry.
In the 1950s, the lumber industry began to decline in the area, and many of the town’s residents moved away. By the 1970s, the population of Scanlon had dropped to around 200 people. The town has remained relatively unchanged since then, and the population has remained steady.
Geography
Scanlon is located in the St. Louis River Valley, which is part of the larger Lake Superior watershed. The town is situated on the banks of the St. Louis River, which is a tributary of the larger Lake Superior. The town is surrounded by forests and wetlands, and is home to a variety of wildlife, including deer, bear, and moose.
The climate in Scanlon is typical of the northern Great Lakes region, with cold winters and warm summers. The average annual temperature is around 40 degrees Fahrenheit, and the average annual precipitation is around 30 inches.
Economy
The economy of Scanlon is largely based on tourism and recreation. The town is home to a variety of outdoor activities, including fishing, hunting, camping, and hiking. The town also has a number of small businesses, including a general store, a restaurant, and a bar.
Demographics
The population of Scanlon is estimated to be around 200 people. The town is predominantly white, with a small minority population. The median household income is around $40,000, and the median home value is around $150,000. The town has a high rate of homeownership, with over 80% of the population owning their own homes.
Common Questions
What is Per Capita Income in Scanlon?
Per Capita income in Scanlon is $36,720.
What is the Median Family Income in Scanlon?
Median Family Income in Scanlon is $94,063.
What is the Median Household income in Scanlon?
Median Household Income in Scanlon is $73,125.
What is Income or Wage Gap in Scanlon?
Income or Wage Gap in Scanlon is 24.7%.
Women in Scanlon earn 75.3 cents for every dollar earned by a man.
What is Inequality or Gini Index in Scanlon?
Inequality or Gini Index in Scanlon is 0.34.
What is the Total Population of Scanlon?
Total Population of Scanlon is 1,047.
What is the Total Male Population of Scanlon?
Total Male Population of Scanlon is 500.
What is the Total Female Population of Scanlon?
Total Female Population of Scanlon is 547.
What is the Ratio of Males per 100 Females in Scanlon?
There are 91.41 Males per 100 Females in Scanlon.
What is the Ratio of Females per 100 Males in Scanlon?
There are 109.40 Females per 100 Males in Scanlon.
What is the Median Population Age in Scanlon?
Median Population Age in Scanlon is 41.9 Years.
What is the Average Family Size in Scanlon
Average Family Size in Scanlon is 2.9 People.
What is the Average Household Size in Scanlon
Average Household Size in Scanlon is 2.2 People.
How Large is the Labor Force in Scanlon?
There are 572 People in the Labor Forcein in Scanlon.
What is the Percentage of People in the Labor Force in Scanlon?
66.8% of People are in the Labor Force in Scanlon.
What is the Unemployment Rate in Scanlon?
Unemployment Rate in Scanlon is 8.4%.