Brook Park, MN Map & Demographics
Brook Park Map
Brook Park Overview
$23,839
PER CAPITA INCOME
$84,063
AVG FAMILY INCOME
$71,250
AVG HOUSEHOLD INCOME
56.4%
WAGE / INCOME GAP [ % ]
43.6¢/ $1
WAGE / INCOME GAP [ $ ]
0.34
INEQUALITY / GINI INDEX
136
TOTAL POPULATION
64
MALE POPULATION
72
FEMALE POPULATION
88.89
MALES / 100 FEMALES
112.50
FEMALES / 100 MALES
36.0
MEDIAN AGE
3.5
AVG FAMILY SIZE
3.1
AVG HOUSEHOLD SIZE
68
LABOR FORCE [ PEOPLE ]
61.3%
PERCENT IN LABOR FORCE
1.5%
UNEMPLOYMENT RATE
Brook Park Zip Codes
Income in Brook Park
Income Overview in Brook Park
Per Capita Income in Brook Park is $23,839, while median incomes of families and households are $84,063 and $71,250 respectively.
| Characteristic | Number | Measure |
| Per Capita Income | 136 | $23,839 |
| Median Family Income | 31 | $84,063 |
| Mean Family Income | 31 | $77,439 |
| Median Household Income | 44 | $71,250 |
| Mean Household Income | 44 | $69,836 |
| Income Deficit | 31 | $0 |
| Wage / Income Gap (%) | 136 | 56.41% |
| Wage / Income Gap ($) | 136 | 43.59¢ per $1 |
| Gini / Inequality Index | 136 | 0.34 |
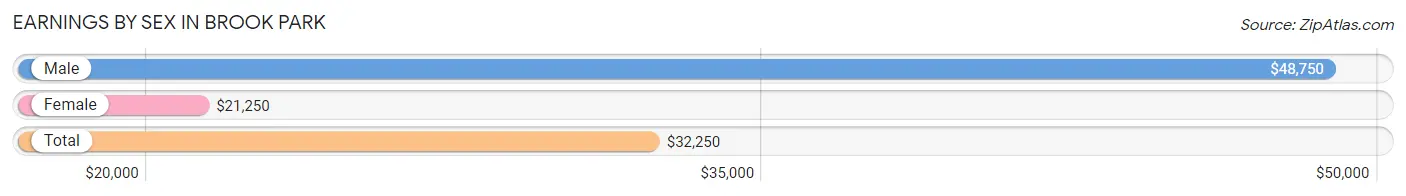
Earnings by Sex in Brook Park
Average Earnings in Brook Park are $32,250, $48,750 for men and $21,250 for women, a difference of 56.4%.
| Sex | Number | Average Earnings |
| Male | 44 (57.1%) | $48,750 |
| Female | 33 (42.9%) | $21,250 |
| Total | 77 (100.0%) | $32,250 |
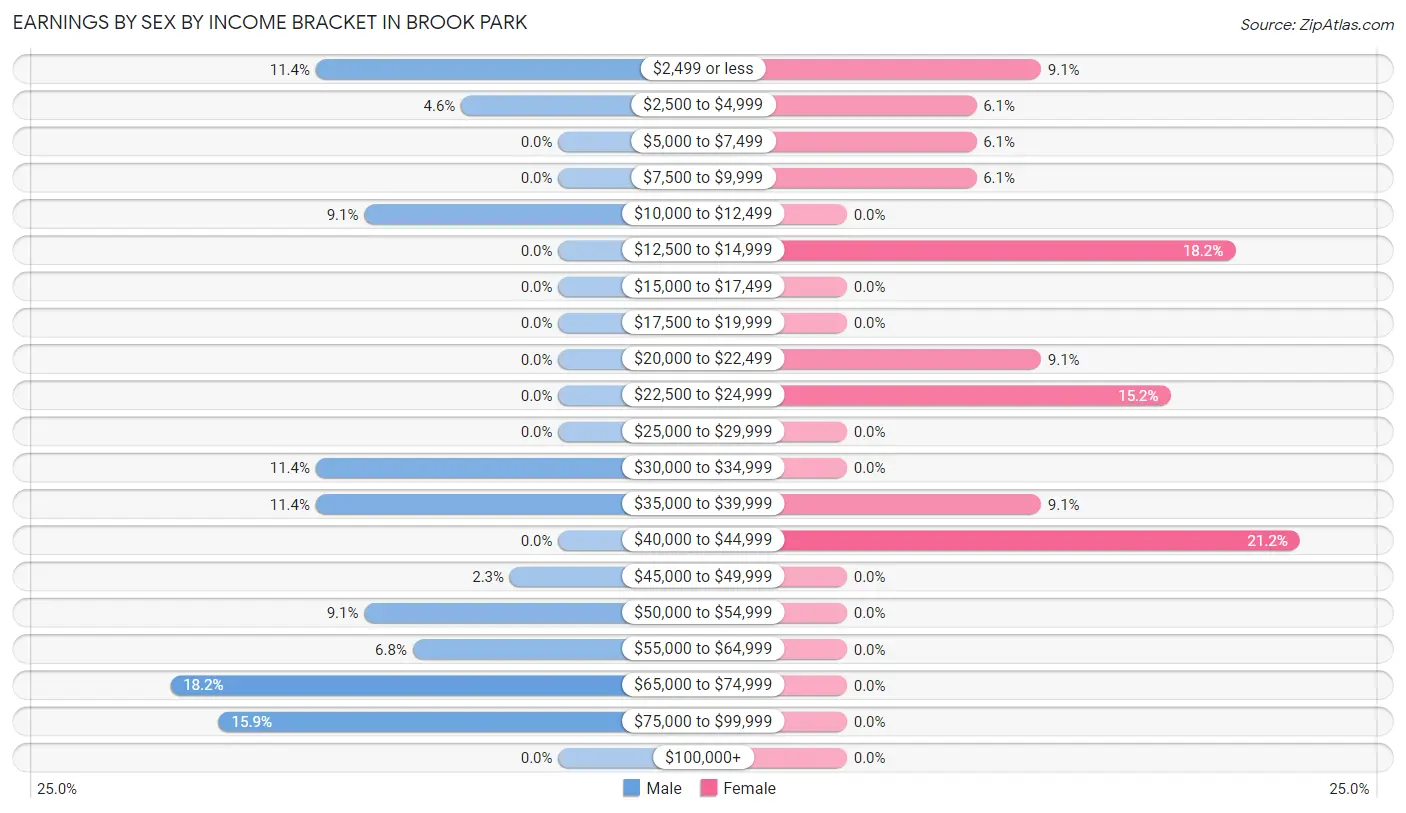
Earnings by Sex by Income Bracket in Brook Park
The most common earnings brackets in Brook Park are $65,000 to $74,999 for men (8 | 18.2%) and $40,000 to $44,999 for women (7 | 21.2%).
| Income | Male | Female |
| $2,499 or less | 5 (11.4%) | 3 (9.1%) |
| $2,500 to $4,999 | 2 (4.5%) | 2 (6.1%) |
| $5,000 to $7,499 | 0 (0.0%) | 2 (6.1%) |
| $7,500 to $9,999 | 0 (0.0%) | 2 (6.1%) |
| $10,000 to $12,499 | 4 (9.1%) | 0 (0.0%) |
| $12,500 to $14,999 | 0 (0.0%) | 6 (18.2%) |
| $15,000 to $17,499 | 0 (0.0%) | 0 (0.0%) |
| $17,500 to $19,999 | 0 (0.0%) | 0 (0.0%) |
| $20,000 to $22,499 | 0 (0.0%) | 3 (9.1%) |
| $22,500 to $24,999 | 0 (0.0%) | 5 (15.1%) |
| $25,000 to $29,999 | 0 (0.0%) | 0 (0.0%) |
| $30,000 to $34,999 | 5 (11.4%) | 0 (0.0%) |
| $35,000 to $39,999 | 5 (11.4%) | 3 (9.1%) |
| $40,000 to $44,999 | 0 (0.0%) | 7 (21.2%) |
| $45,000 to $49,999 | 1 (2.3%) | 0 (0.0%) |
| $50,000 to $54,999 | 4 (9.1%) | 0 (0.0%) |
| $55,000 to $64,999 | 3 (6.8%) | 0 (0.0%) |
| $65,000 to $74,999 | 8 (18.2%) | 0 (0.0%) |
| $75,000 to $99,999 | 7 (15.9%) | 0 (0.0%) |
| $100,000+ | 0 (0.0%) | 0 (0.0%) |
| Total | 44 (100.0%) | 33 (100.0%) |
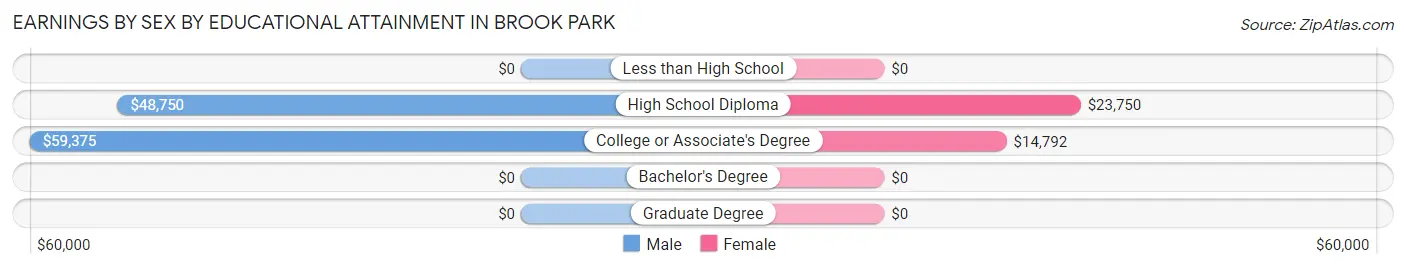
Earnings by Sex by Educational Attainment in Brook Park
Average earnings in Brook Park are $52,500 for men and $23,250 for women, a difference of 55.7%. Men with an educational attainment of college or associate's degree enjoy the highest average annual earnings of $59,375, while those with high school diploma education earn the least with $48,750. Women with an educational attainment of high school diploma earn the most with the average annual earnings of $23,750, while those with college or associate's degree education have the smallest earnings of $14,792.
| Educational Attainment | Male Income | Female Income |
| Less than High School | - | - |
| High School Diploma | $48,750 | $23,750 |
| College or Associate's Degree | $59,375 | $14,792 |
| Bachelor's Degree | - | - |
| Graduate Degree | - | - |
| Total | $52,500 | $23,250 |
Family Income in Brook Park
Family Income Brackets in Brook Park
According to the Brook Park family income data, there are 9 families falling into the $75,000 to $99,999 income range, which is the most common income bracket and makes up 29.0% of all families.
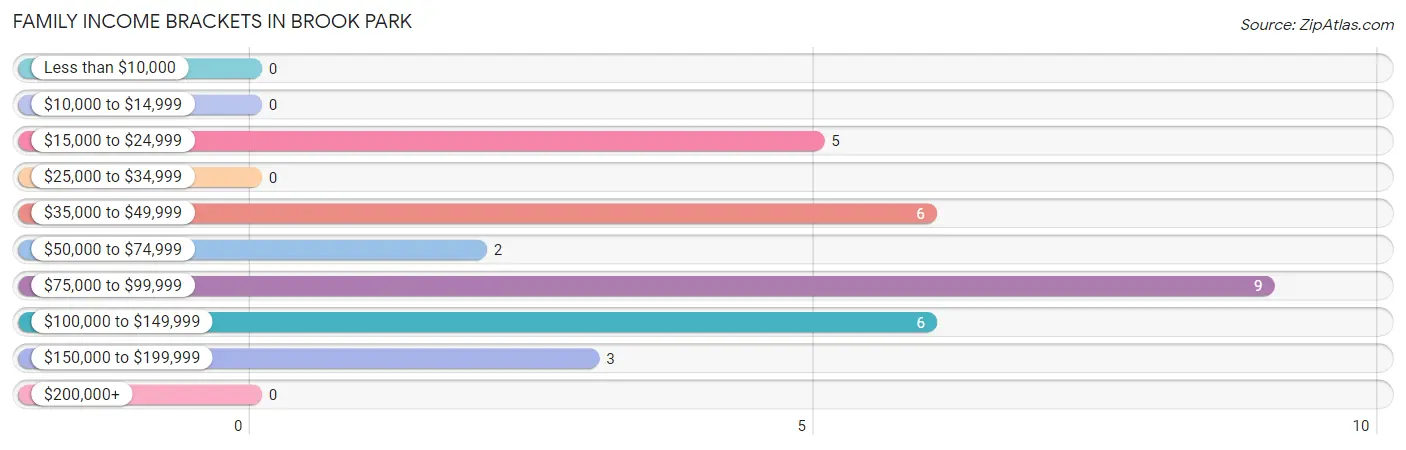
| Income Bracket | # Families | % Families |
| Less than $10,000 | 0 | 0.0% |
| $10,000 to $14,999 | 0 | 0.0% |
| $15,000 to $24,999 | 5 | 16.1% |
| $25,000 to $34,999 | 0 | 0.0% |
| $35,000 to $49,999 | 6 | 19.4% |
| $50,000 to $74,999 | 2 | 6.5% |
| $75,000 to $99,999 | 9 | 29.0% |
| $100,000 to $149,999 | 6 | 19.4% |
| $150,000 to $199,999 | 3 | 9.7% |
| $200,000+ | 0 | 0.0% |
Family Income by Famaliy Size in Brook Park
3-person families (9 | 29.0%) account for the highest median family income in Brook Park with $113,125 per family, while 3-person families (9 | 29.0%) have the highest median income of $37,708 per family member.
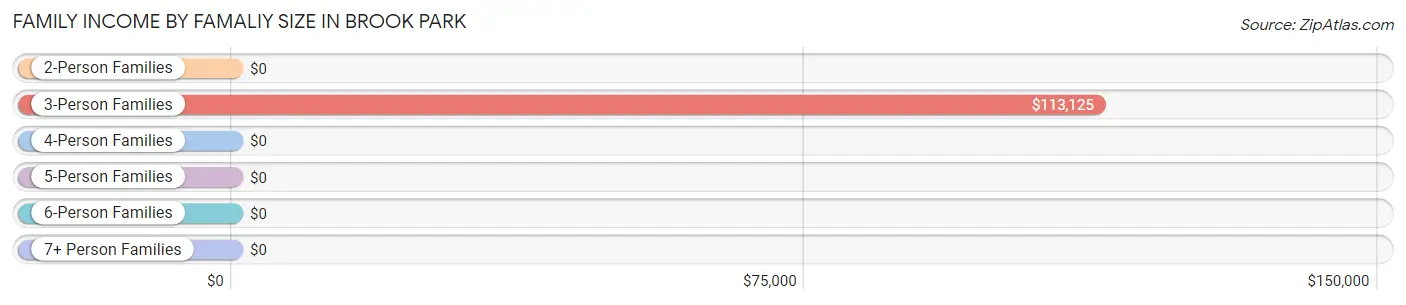
| Income Bracket | # Families | Median Income |
| 2-Person Families | 8 (25.8%) | $0 |
| 3-Person Families | 9 (29.0%) | $113,125 |
| 4-Person Families | 4 (12.9%) | $0 |
| 5-Person Families | 8 (25.8%) | $0 |
| 6-Person Families | 2 (6.5%) | $0 |
| 7+ Person Families | 0 (0.0%) | $0 |
| Total | 31 (100.0%) | $84,063 |
Family Income by Number of Earners in Brook Park
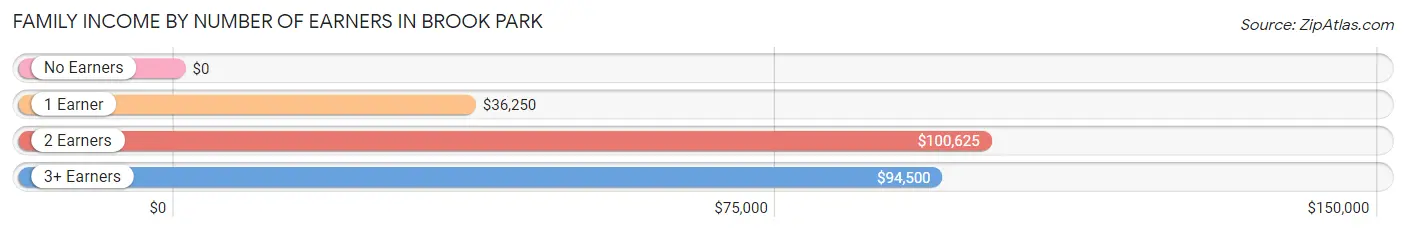
| Number of Earners | # Families | Median Income |
| No Earners | 5 (16.1%) | $0 |
| 1 Earner | 7 (22.6%) | $36,250 |
| 2 Earners | 7 (22.6%) | $100,625 |
| 3+ Earners | 12 (38.7%) | $94,500 |
| Total | 31 (100.0%) | $84,063 |
Household Income in Brook Park
Household Income Brackets in Brook Park
With 11 households falling in the category, the $75,000 to $99,999 income range is the most frequent in Brook Park, accounting for 25.0% of all households.
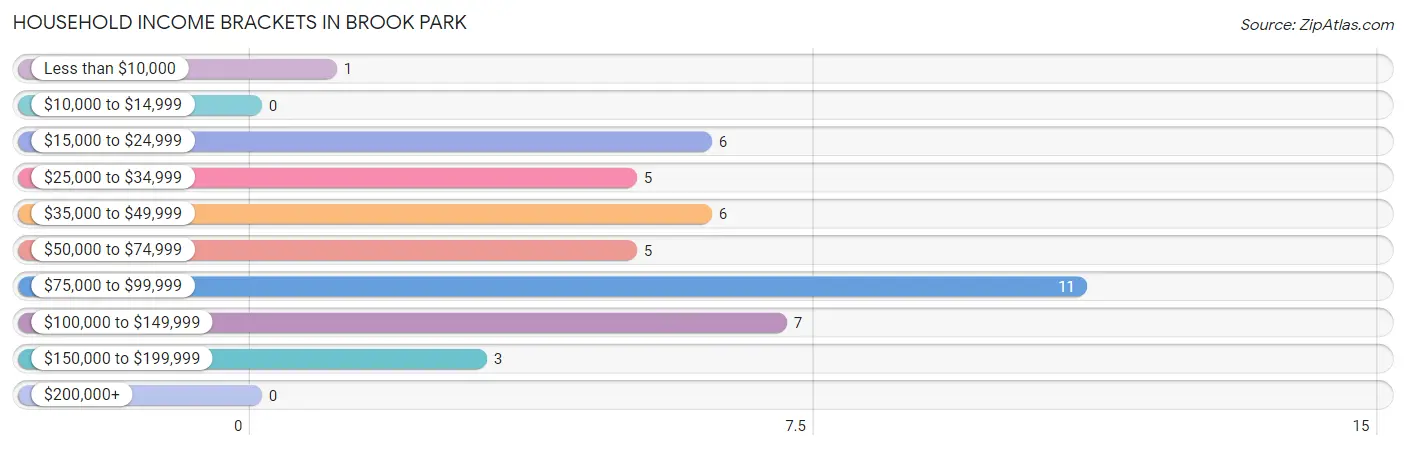
| Income Bracket | # Households | % Households |
| Less than $10,000 | 1 | 2.3% |
| $10,000 to $14,999 | 0 | 0.0% |
| $15,000 to $24,999 | 6 | 13.6% |
| $25,000 to $34,999 | 5 | 11.4% |
| $35,000 to $49,999 | 6 | 13.6% |
| $50,000 to $74,999 | 5 | 11.4% |
| $75,000 to $99,999 | 11 | 25.0% |
| $100,000 to $149,999 | 7 | 15.9% |
| $150,000 to $199,999 | 3 | 6.8% |
| $200,000+ | 0 | 0.0% |
Household Income by Householder Age in Brook Park
The median household income in Brook Park is $71,250, with the highest median household income of $93,036 found in the 25 to 44 years age bracket for the primary householder. A total of 19 households (43.2%) fall into this category.
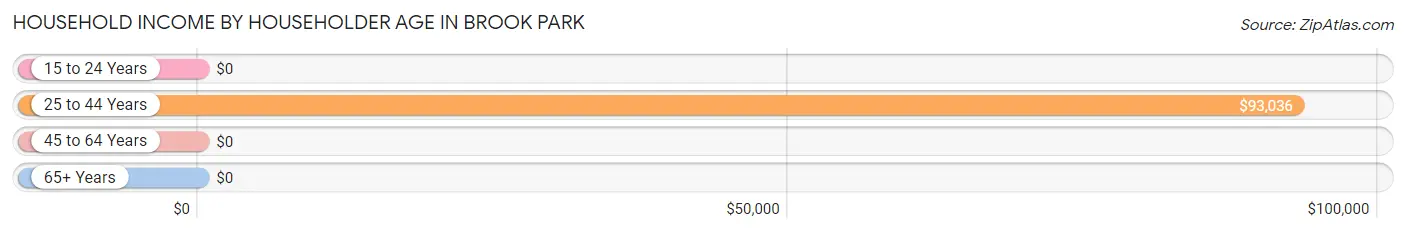
| Income Bracket | # Households | Median Income |
| 15 to 24 Years | 0 (0.0%) | $0 |
| 25 to 44 Years | 19 (43.2%) | $93,036 |
| 45 to 64 Years | 17 (38.6%) | $0 |
| 65+ Years | 8 (18.2%) | $0 |
| Total | 44 (100.0%) | $71,250 |
Poverty in Brook Park
Income Below Poverty by Sex and Age in Brook Park
With 4.7% poverty level for males and 4.2% for females among the residents of Brook Park, 55 to 64 year old males and 18 to 24 year old females are the most vulnerable to poverty, with 3 males (33.3%) and 3 females (30.0%) in their respective age groups living below the poverty level.
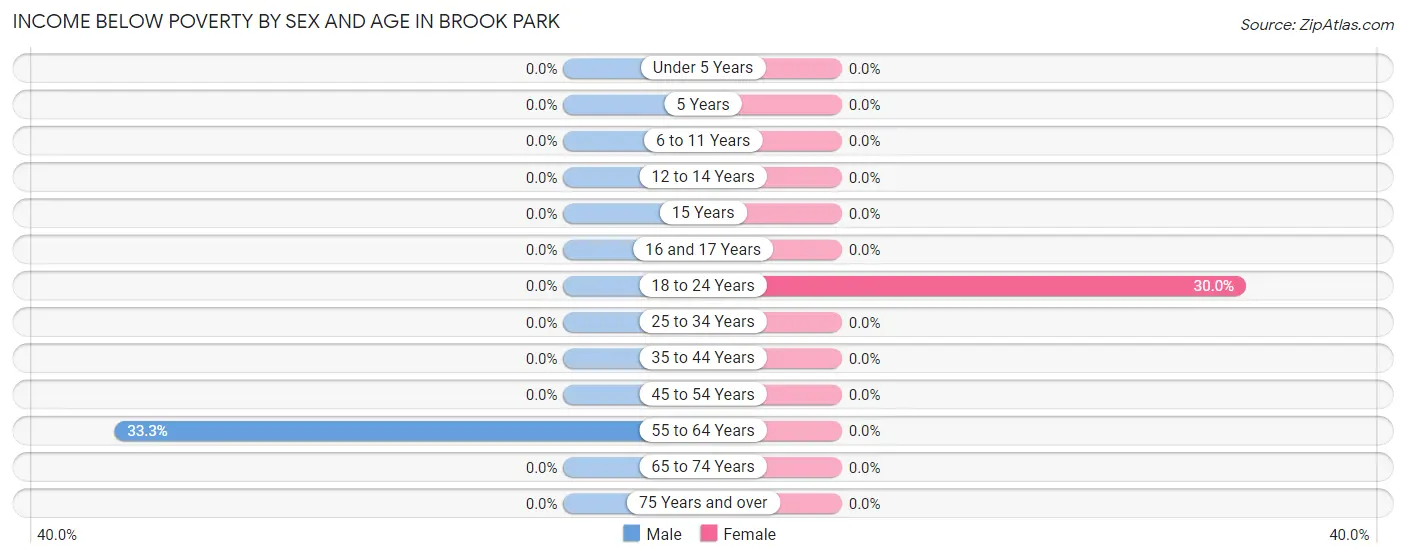
| Age Bracket | Male | Female |
| Under 5 Years | 0 (0.0%) | 0 (0.0%) |
| 5 Years | 0 (0.0%) | 0 (0.0%) |
| 6 to 11 Years | 0 (0.0%) | 0 (0.0%) |
| 12 to 14 Years | 0 (0.0%) | 0 (0.0%) |
| 15 Years | 0 (0.0%) | 0 (0.0%) |
| 16 and 17 Years | 0 (0.0%) | 0 (0.0%) |
| 18 to 24 Years | 0 (0.0%) | 3 (30.0%) |
| 25 to 34 Years | 0 (0.0%) | 0 (0.0%) |
| 35 to 44 Years | 0 (0.0%) | 0 (0.0%) |
| 45 to 54 Years | 0 (0.0%) | 0 (0.0%) |
| 55 to 64 Years | 3 (33.3%) | 0 (0.0%) |
| 65 to 74 Years | 0 (0.0%) | 0 (0.0%) |
| 75 Years and over | 0 (0.0%) | 0 (0.0%) |
| Total | 3 (4.7%) | 3 (4.2%) |
Income Above Poverty by Sex and Age in Brook Park
According to the poverty statistics in Brook Park, males aged 6 to 11 years and females aged under 5 years are the age groups that are most secure financially, with 100.0% of males and 100.0% of females in these age groups living above the poverty line.
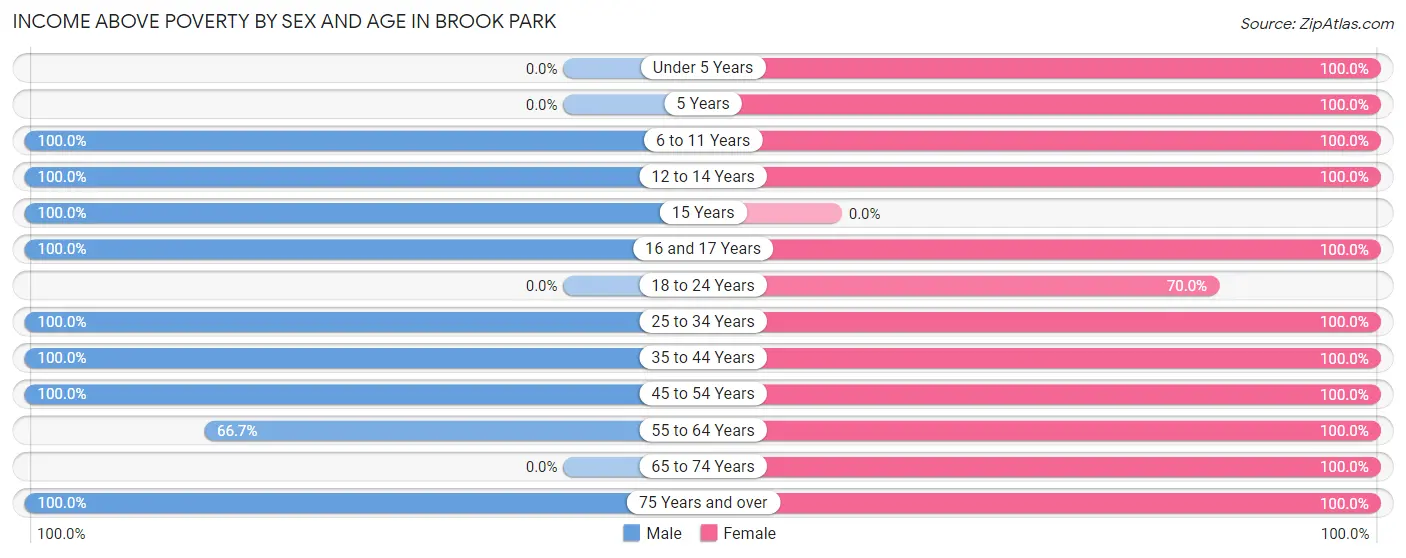
| Age Bracket | Male | Female |
| Under 5 Years | 0 (0.0%) | 2 (100.0%) |
| 5 Years | 0 (0.0%) | 2 (100.0%) |
| 6 to 11 Years | 4 (100.0%) | 7 (100.0%) |
| 12 to 14 Years | 3 (100.0%) | 5 (100.0%) |
| 15 Years | 2 (100.0%) | 0 (0.0%) |
| 16 and 17 Years | 4 (100.0%) | 4 (100.0%) |
| 18 to 24 Years | 0 (0.0%) | 7 (70.0%) |
| 25 to 34 Years | 18 (100.0%) | 5 (100.0%) |
| 35 to 44 Years | 19 (100.0%) | 12 (100.0%) |
| 45 to 54 Years | 3 (100.0%) | 9 (100.0%) |
| 55 to 64 Years | 6 (66.7%) | 10 (100.0%) |
| 65 to 74 Years | 0 (0.0%) | 3 (100.0%) |
| 75 Years and over | 2 (100.0%) | 3 (100.0%) |
| Total | 61 (95.3%) | 69 (95.8%) |
Income Below Poverty Among Married-Couple Families in Brook Park
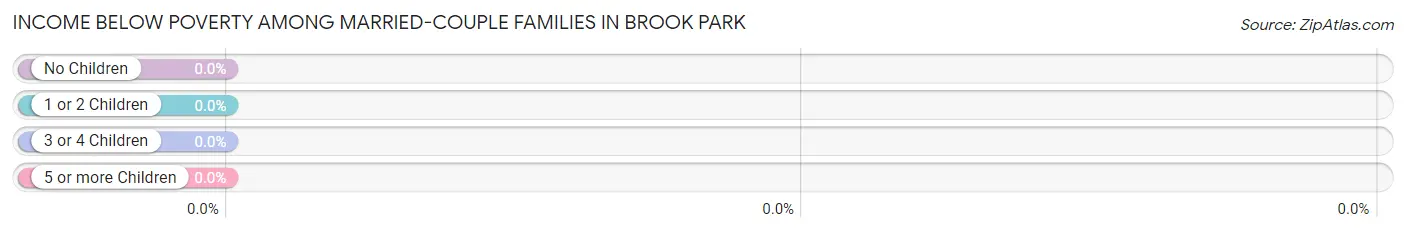
| Children | Above Poverty | Below Poverty |
| No Children | 4 (100.0%) | 0 (0.0%) |
| 1 or 2 Children | 11 (100.0%) | 0 (0.0%) |
| 3 or 4 Children | 5 (100.0%) | 0 (0.0%) |
| 5 or more Children | 0 (0.0%) | 0 (0.0%) |
| Total | 20 (100.0%) | 0 (0.0%) |
Income Below Poverty Among Single-Parent Households in Brook Park
| Children | Single Father | Single Mother |
| No Children | 0 (0.0%) | 0 (0.0%) |
| 1 or 2 Children | 0 (0.0%) | 0 (0.0%) |
| 3 or 4 Children | 0 (0.0%) | 0 (0.0%) |
| 5 or more Children | 0 (0.0%) | 0 (0.0%) |
| Total | 0 (0.0%) | 0 (0.0%) |
Income Below Poverty Among Married-Couple vs Single-Parent Households in Brook Park
| Children | Married-Couple Families | Single-Parent Households |
| No Children | 0 (0.0%) | 0 (0.0%) |
| 1 or 2 Children | 0 (0.0%) | 0 (0.0%) |
| 3 or 4 Children | 0 (0.0%) | 0 (0.0%) |
| 5 or more Children | 0 (0.0%) | 0 (0.0%) |
| Total | 0 (0.0%) | 0 (0.0%) |
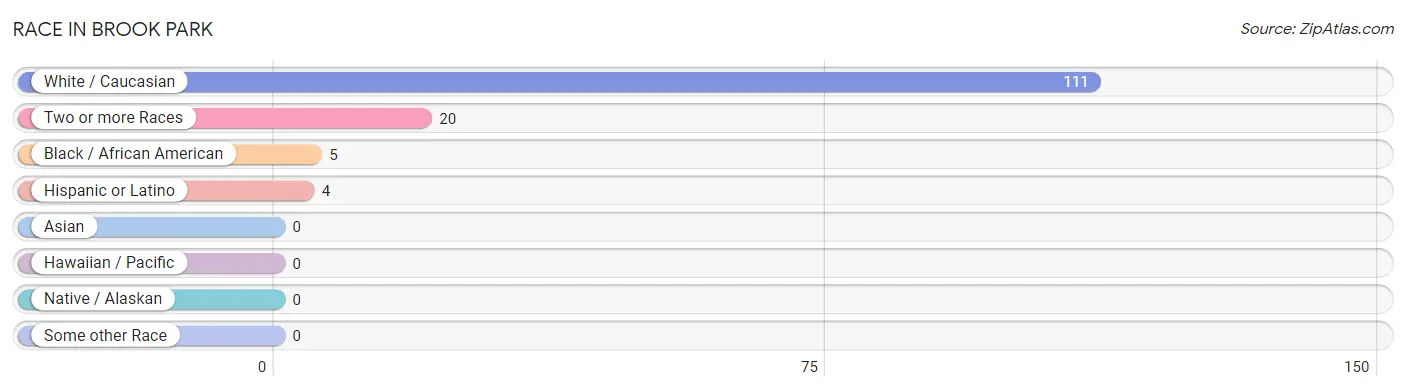
Race in Brook Park
The most populous races in Brook Park are White / Caucasian (111 | 81.6%), Two or more Races (20 | 14.7%), and Black / African American (5 | 3.7%).
| Race | # Population | % Population |
| Asian | 0 | 0.0% |
| Black / African American | 5 | 3.7% |
| Hawaiian / Pacific | 0 | 0.0% |
| Hispanic or Latino | 4 | 2.9% |
| Native / Alaskan | 0 | 0.0% |
| White / Caucasian | 111 | 81.6% |
| Two or more Races | 20 | 14.7% |
| Some other Race | 0 | 0.0% |
| Total | 136 | 100.0% |
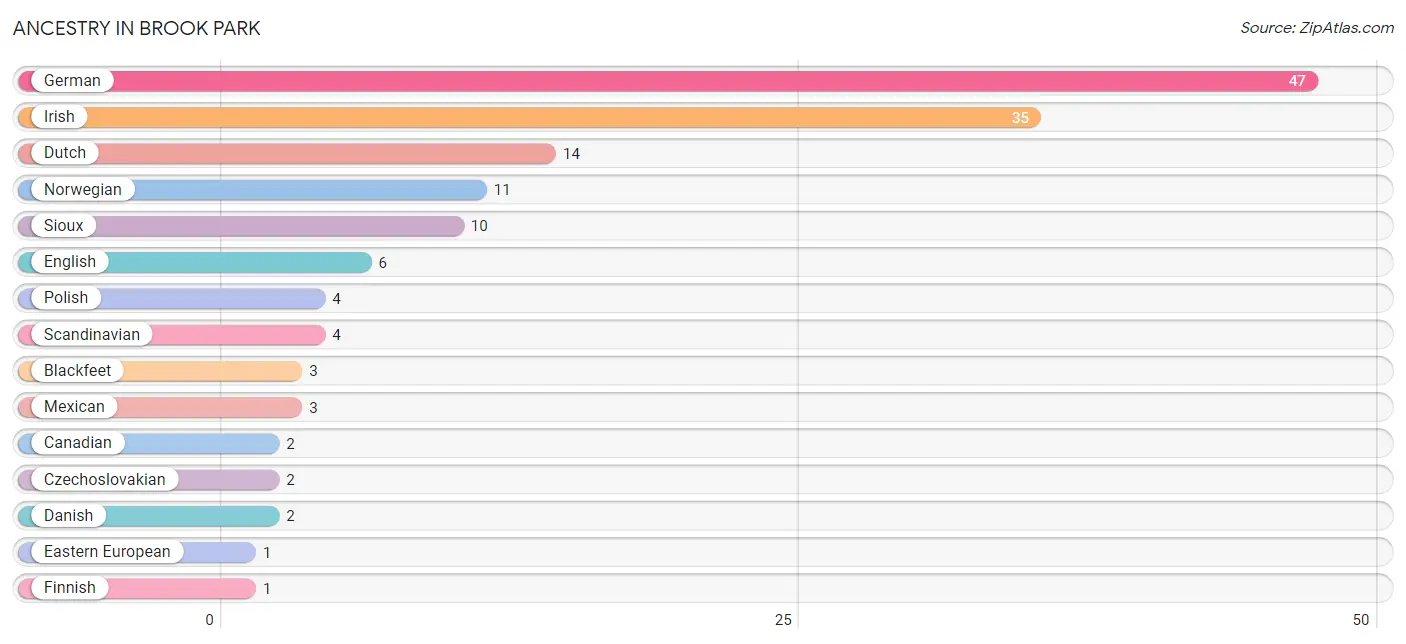
Ancestry in Brook Park
The most populous ancestries reported in Brook Park are German (47 | 34.6%), Irish (35 | 25.7%), Dutch (14 | 10.3%), Norwegian (11 | 8.1%), and Sioux (10 | 7.3%), together accounting for 86.0% of all Brook Park residents.
| Ancestry | # Population | % Population |
| Blackfeet | 3 | 2.2% |
| Canadian | 2 | 1.5% |
| Czechoslovakian | 2 | 1.5% |
| Danish | 2 | 1.5% |
| Dutch | 14 | 10.3% |
| Eastern European | 1 | 0.7% |
| English | 6 | 4.4% |
| Finnish | 1 | 0.7% |
| German | 47 | 34.6% |
| Irish | 35 | 25.7% |
| Mexican | 3 | 2.2% |
| Norwegian | 11 | 8.1% |
| Polish | 4 | 2.9% |
| Scandinavian | 4 | 2.9% |
| Sioux | 10 | 7.3% |
| Spanish | 1 | 0.7% | View All 16 Rows |
Immigrants in Brook Park

| Immigration Origin | # Population | % Population | View All 0 Rows |
Sex and Age in Brook Park
Sex and Age in Brook Park
The most populous age groups in Brook Park are 40 to 44 Years (12 | 18.8%) for men and 15 to 19 Years (14 | 19.4%) for women.
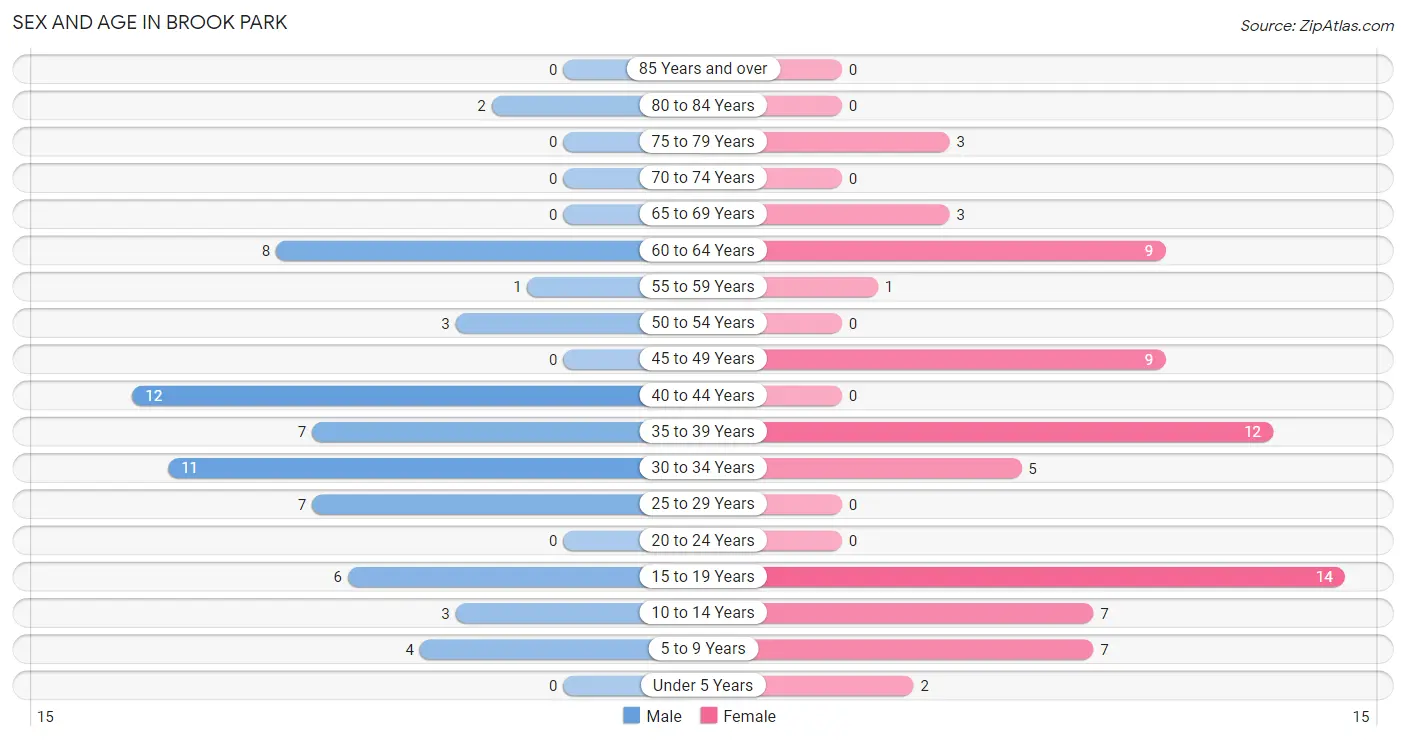
| Age Bracket | Male | Female |
| Under 5 Years | 0 (0.0%) | 2 (2.8%) |
| 5 to 9 Years | 4 (6.2%) | 7 (9.7%) |
| 10 to 14 Years | 3 (4.7%) | 7 (9.7%) |
| 15 to 19 Years | 6 (9.4%) | 14 (19.4%) |
| 20 to 24 Years | 0 (0.0%) | 0 (0.0%) |
| 25 to 29 Years | 7 (10.9%) | 0 (0.0%) |
| 30 to 34 Years | 11 (17.2%) | 5 (6.9%) |
| 35 to 39 Years | 7 (10.9%) | 12 (16.7%) |
| 40 to 44 Years | 12 (18.8%) | 0 (0.0%) |
| 45 to 49 Years | 0 (0.0%) | 9 (12.5%) |
| 50 to 54 Years | 3 (4.7%) | 0 (0.0%) |
| 55 to 59 Years | 1 (1.6%) | 1 (1.4%) |
| 60 to 64 Years | 8 (12.5%) | 9 (12.5%) |
| 65 to 69 Years | 0 (0.0%) | 3 (4.2%) |
| 70 to 74 Years | 0 (0.0%) | 0 (0.0%) |
| 75 to 79 Years | 0 (0.0%) | 3 (4.2%) |
| 80 to 84 Years | 2 (3.1%) | 0 (0.0%) |
| 85 Years and over | 0 (0.0%) | 0 (0.0%) |
| Total | 64 (100.0%) | 72 (100.0%) |
Families and Households in Brook Park
Median Family Size in Brook Park
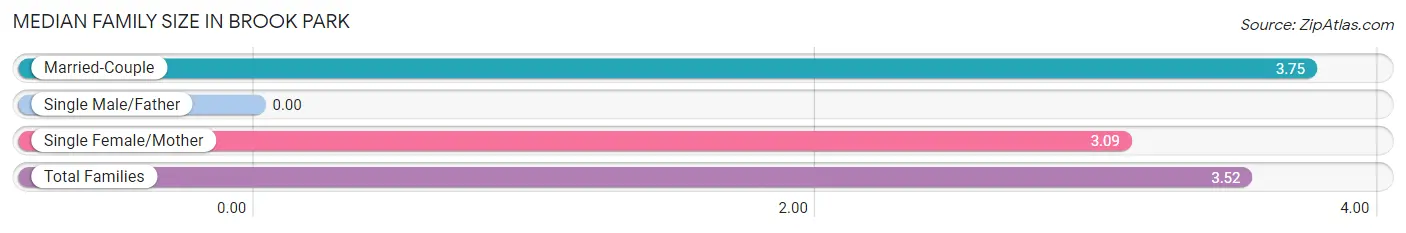
| Family Type | # Families | Family Size |
| Married-Couple | 20 (64.5%) | 3.75 |
| Single Male/Father | 0 (0.0%) | - |
| Single Female/Mother | 11 (35.5%) | 3.09 |
| Total Families | 31 (100.0%) | 3.52 |
Median Household Size in Brook Park
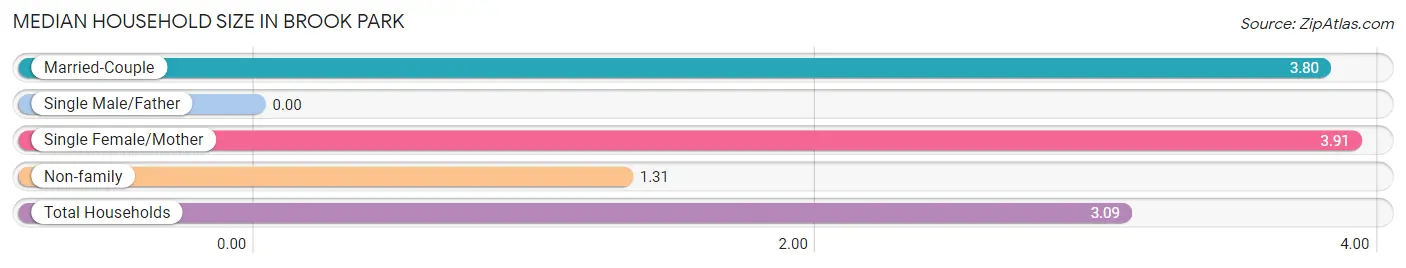
| Household Type | # Households | Household Size |
| Married-Couple | 20 (45.5%) | 3.80 |
| Single Male/Father | 0 (0.0%) | - |
| Single Female/Mother | 11 (25.0%) | 3.91 |
| Non-family | 13 (29.5%) | 1.31 |
| Total Households | 44 (100.0%) | 3.09 |
Household Size by Marriage Status in Brook Park
Out of a total of 44 households in Brook Park, 31 (70.5%) are family households, while 13 (29.5%) are nonfamily households. The most numerous type of family households are 3-person households, comprising 10, and the most common type of nonfamily households are 1-person households, comprising 12.
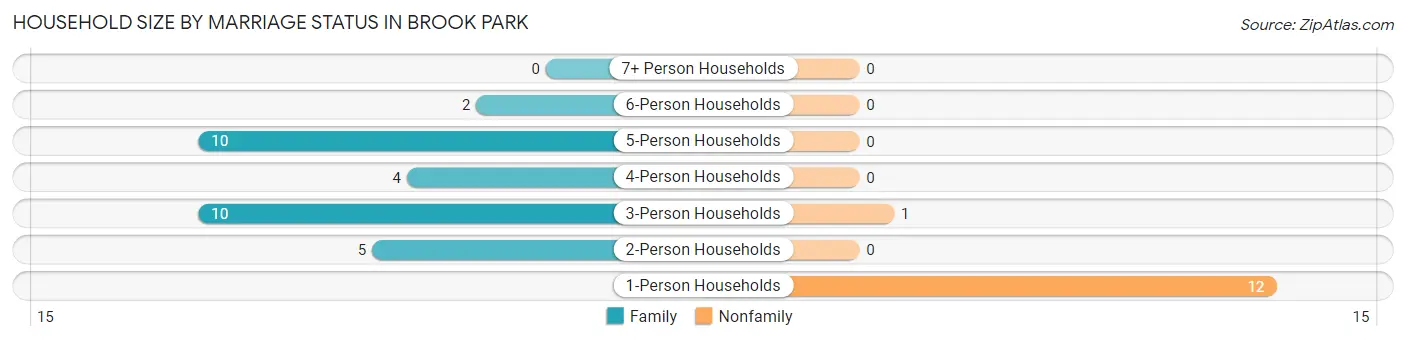
| Household Size | Family Households | Nonfamily Households |
| 1-Person Households | - | 12 (27.3%) |
| 2-Person Households | 5 (11.4%) | 0 (0.0%) |
| 3-Person Households | 10 (22.7%) | 1 (2.3%) |
| 4-Person Households | 4 (9.1%) | 0 (0.0%) |
| 5-Person Households | 10 (22.7%) | 0 (0.0%) |
| 6-Person Households | 2 (4.5%) | 0 (0.0%) |
| 7+ Person Households | 0 (0.0%) | 0 (0.0%) |
| Total | 31 (70.5%) | 13 (29.5%) |
Female Fertility in Brook Park
Fertility by Age in Brook Park
| Age Bracket | Women with Births | Births / 1,000 Women |
| 15 to 19 years | 0 (0.0%) | 0.0 |
| 20 to 34 years | 0 (0.0%) | 0.0 |
| 35 to 50 years | 0 (0.0%) | 0.0 |
| Total | 0 (0.0%) | 0.0 |
Fertility by Age by Marriage Status in Brook Park
| Age Bracket | Married | Unmarried |
| 15 to 19 years | 0 (0.0%) | 0 (0.0%) |
| 20 to 34 years | 0 (0.0%) | 0 (0.0%) |
| 35 to 50 years | 0 (0.0%) | 0 (0.0%) |
| Total | 0 (0.0%) | 0 (0.0%) |
Fertility by Education in Brook Park
| Educational Attainment | Women with Births | Births / 1,000 Women |
| Less than High School | 0 (0.0%) | 0.0 |
| High School Diploma | 0 (0.0%) | 0.0 |
| College or Associate's Degree | 0 (0.0%) | 0.0 |
| Bachelor's Degree | 0 (0.0%) | 0.0 |
| Graduate Degree | 0 (0.0%) | 0.0 |
| Total | 0 (0.0%) | 0.0 |
Fertility by Education by Marriage Status in Brook Park
| Educational Attainment | Married | Unmarried |
| Less than High School | 0 (0.0%) | 0 (0.0%) |
| High School Diploma | 0 (0.0%) | 0 (0.0%) |
| College or Associate's Degree | 0 (0.0%) | 0 (0.0%) |
| Bachelor's Degree | 0 (0.0%) | 0 (0.0%) |
| Graduate Degree | 0 (0.0%) | 0 (0.0%) |
| Total | 0 (0.0%) | 0 (0.0%) |
Employment Characteristics in Brook Park
Employment by Class of Employer in Brook Park
Among the 67 employed individuals in Brook Park, private company employees (52 | 77.6%), not-for-profit organizations (6 | 9.0%), and federal government employees (5 | 7.5%) make up the most common classes of employment.
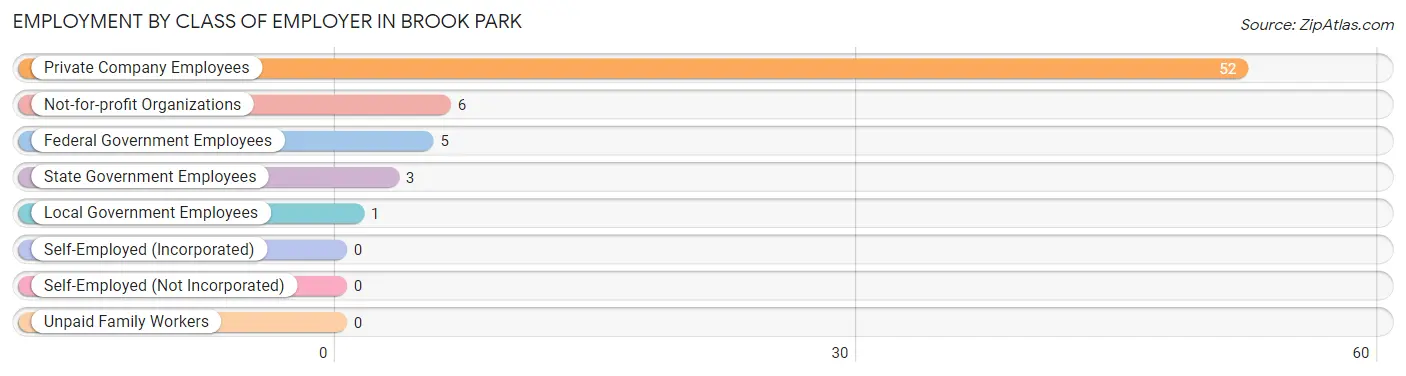
| Employer Class | # Employees | % Employees |
| Private Company Employees | 52 | 77.6% |
| Self-Employed (Incorporated) | 0 | 0.0% |
| Self-Employed (Not Incorporated) | 0 | 0.0% |
| Not-for-profit Organizations | 6 | 9.0% |
| Local Government Employees | 1 | 1.5% |
| State Government Employees | 3 | 4.5% |
| Federal Government Employees | 5 | 7.5% |
| Unpaid Family Workers | 0 | 0.0% |
| Total | 67 | 100.0% |
Employment Status by Age in Brook Park
According to the labor force statistics for Brook Park, out of the total population over 16 years of age (111), 61.3% or 68 individuals are in the labor force, with 1.5% or 1 of them unemployed. The age group with the highest labor force participation rate is 30 to 34 years, with 100.0% or 16 individuals in the labor force. Within the labor force, the 55 to 59 years age range has the highest percentage of unemployed individuals, with 50.0% or 1 of them being unemployed.
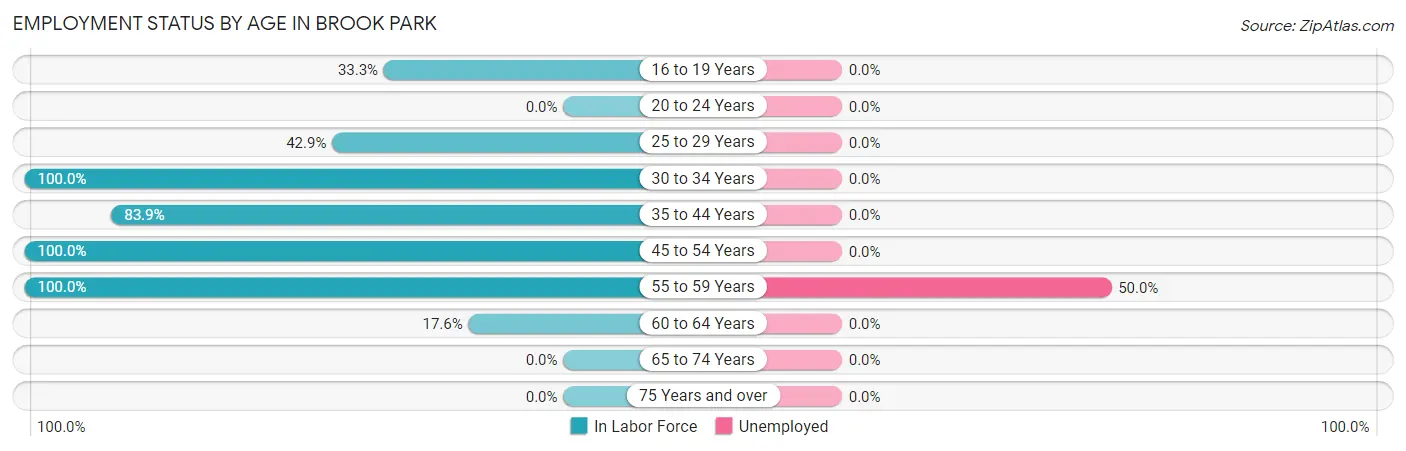
| Age Bracket | In Labor Force | Unemployed |
| 16 to 19 Years | 6 (33.3%) | 0 (0.0%) |
| 20 to 24 Years | 0 (0.0%) | 0 (0.0%) |
| 25 to 29 Years | 3 (42.9%) | 0 (0.0%) |
| 30 to 34 Years | 16 (100.0%) | 0 (0.0%) |
| 35 to 44 Years | 26 (83.9%) | 0 (0.0%) |
| 45 to 54 Years | 12 (100.0%) | 0 (0.0%) |
| 55 to 59 Years | 2 (100.0%) | 1 (50.0%) |
| 60 to 64 Years | 3 (17.6%) | 0 (0.0%) |
| 65 to 74 Years | 0 (0.0%) | 0 (0.0%) |
| 75 Years and over | 0 (0.0%) | 0 (0.0%) |
| Total | 68 (61.3%) | 1 (1.5%) |
Employment Status by Educational Attainment in Brook Park
According to labor force statistics for Brook Park, 72.9% of individuals (62) out of the total population between 25 and 64 years of age (85) are in the labor force, with 1.6% or 1 of them being unemployed. The group with the highest labor force participation rate are those with the educational attainment of less than high school, with 100.0% or 11 individuals in the labor force. Within the labor force, individuals with less than high school education have the highest percentage of unemployment, with 9.1% or 1 of them being unemployed.
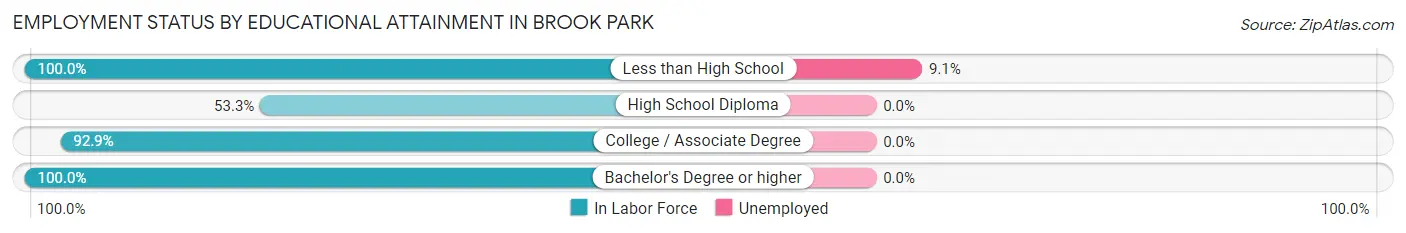
| Educational Attainment | In Labor Force | Unemployed |
| Less than High School | 11 (100.0%) | 1 (9.1%) |
| High School Diploma | 24 (53.3%) | 0 (0.0%) |
| College / Associate Degree | 26 (92.9%) | 0 (0.0%) |
| Bachelor's Degree or higher | 1 (100.0%) | 0 (0.0%) |
| Total | 62 (72.9%) | 1 (1.6%) |
Employment Occupations by Sex in Brook Park
Management, Business, Science and Arts Occupations
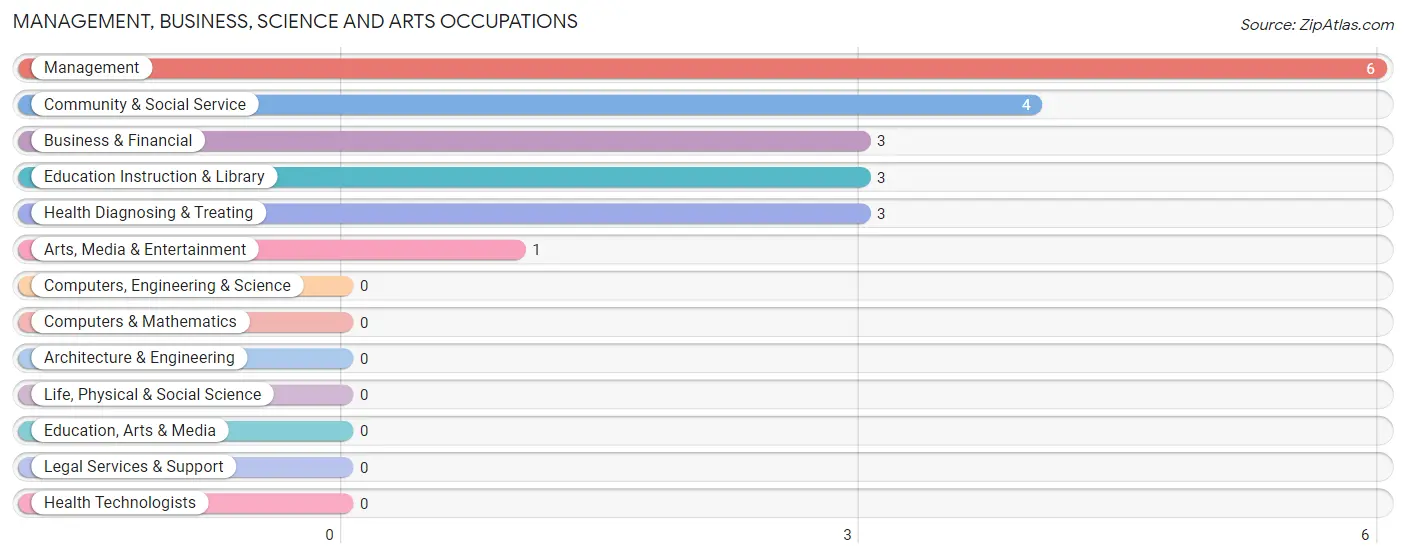
The most common Management, Business, Science and Arts occupations in Brook Park are Management (6 | 9.0%), Community & Social Service (4 | 6.0%), Business & Financial (3 | 4.5%), Education Instruction & Library (3 | 4.5%), and Health Diagnosing & Treating (3 | 4.5%).
Management, Business, Science and Arts Occupations by Sex
Within the Management, Business, Science and Arts occupations in Brook Park, the most male-oriented occupations are Management (100.0%), Business & Financial (33.3%), and Education Instruction & Library (33.3%), while the most female-oriented occupations are Arts, Media & Entertainment (100.0%), Health Diagnosing & Treating (100.0%), and Community & Social Service (75.0%).
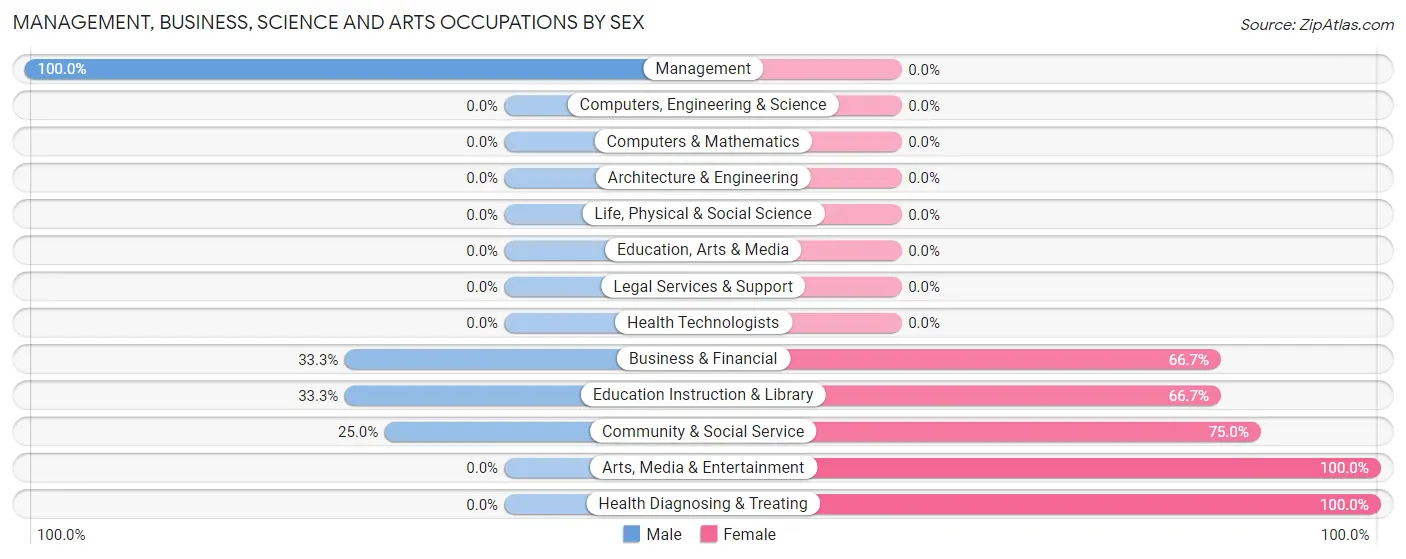
| Occupation | Male | Female |
| Management | 6 (100.0%) | 0 (0.0%) |
| Business & Financial | 1 (33.3%) | 2 (66.7%) |
| Computers, Engineering & Science | 0 (0.0%) | 0 (0.0%) |
| Computers & Mathematics | 0 (0.0%) | 0 (0.0%) |
| Architecture & Engineering | 0 (0.0%) | 0 (0.0%) |
| Life, Physical & Social Science | 0 (0.0%) | 0 (0.0%) |
| Community & Social Service | 1 (25.0%) | 3 (75.0%) |
| Education, Arts & Media | 0 (0.0%) | 0 (0.0%) |
| Legal Services & Support | 0 (0.0%) | 0 (0.0%) |
| Education Instruction & Library | 1 (33.3%) | 2 (66.7%) |
| Arts, Media & Entertainment | 0 (0.0%) | 1 (100.0%) |
| Health Diagnosing & Treating | 0 (0.0%) | 3 (100.0%) |
| Health Technologists | 0 (0.0%) | 0 (0.0%) |
| Total (Category) | 8 (50.0%) | 8 (50.0%) |
| Total (Overall) | 37 (55.2%) | 30 (44.8%) |
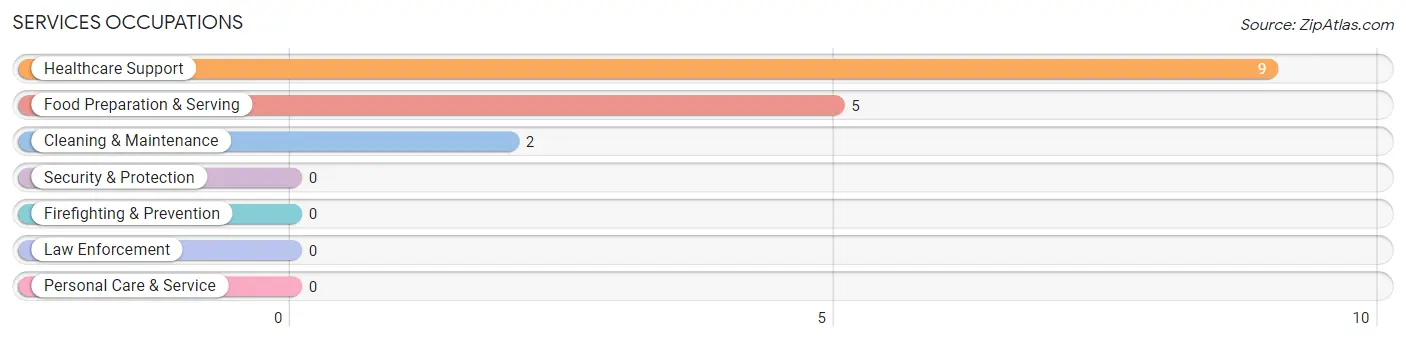
Services Occupations
The most common Services occupations in Brook Park are Healthcare Support (9 | 13.4%), Food Preparation & Serving (5 | 7.5%), and Cleaning & Maintenance (2 | 3.0%).
Services Occupations by Sex
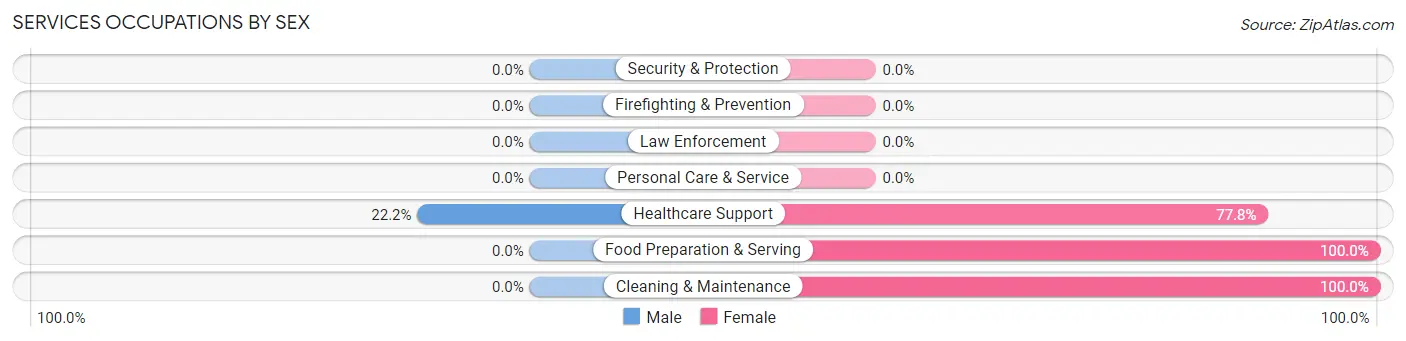
| Occupation | Male | Female |
| Healthcare Support | 2 (22.2%) | 7 (77.8%) |
| Security & Protection | 0 (0.0%) | 0 (0.0%) |
| Firefighting & Prevention | 0 (0.0%) | 0 (0.0%) |
| Law Enforcement | 0 (0.0%) | 0 (0.0%) |
| Food Preparation & Serving | 0 (0.0%) | 5 (100.0%) |
| Cleaning & Maintenance | 0 (0.0%) | 2 (100.0%) |
| Personal Care & Service | 0 (0.0%) | 0 (0.0%) |
| Total (Category) | 2 (12.5%) | 14 (87.5%) |
| Total (Overall) | 37 (55.2%) | 30 (44.8%) |
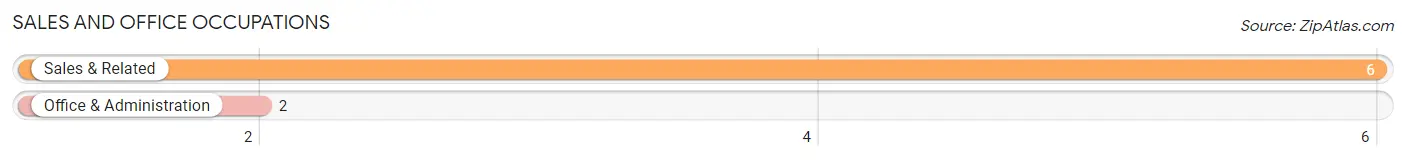
Sales and Office Occupations
The most common Sales and Office occupations in Brook Park are Sales & Related (6 | 9.0%), and Office & Administration (2 | 3.0%).
Sales and Office Occupations by Sex
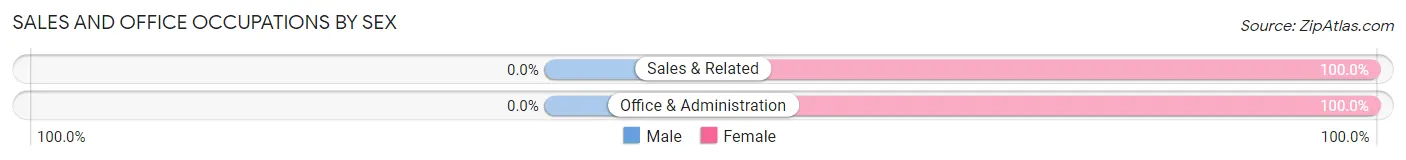
| Occupation | Male | Female |
| Sales & Related | 0 (0.0%) | 6 (100.0%) |
| Office & Administration | 0 (0.0%) | 2 (100.0%) |
| Total (Category) | 0 (0.0%) | 8 (100.0%) |
| Total (Overall) | 37 (55.2%) | 30 (44.8%) |
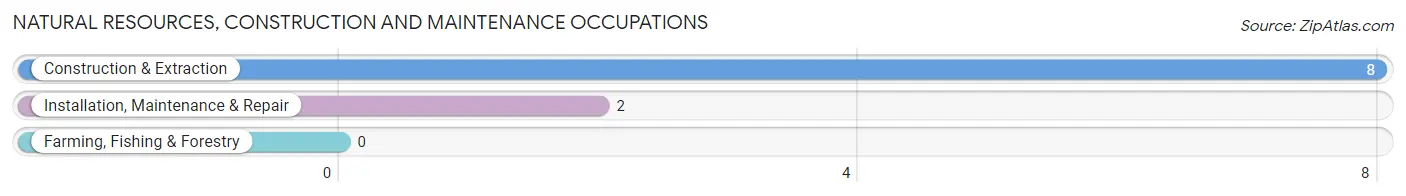
Natural Resources, Construction and Maintenance Occupations
The most common Natural Resources, Construction and Maintenance occupations in Brook Park are Construction & Extraction (8 | 11.9%), and Installation, Maintenance & Repair (2 | 3.0%).
Natural Resources, Construction and Maintenance Occupations by Sex
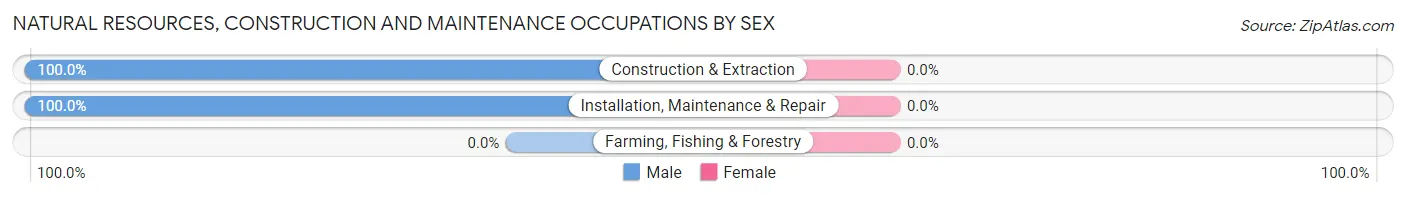
| Occupation | Male | Female |
| Farming, Fishing & Forestry | 0 (0.0%) | 0 (0.0%) |
| Construction & Extraction | 8 (100.0%) | 0 (0.0%) |
| Installation, Maintenance & Repair | 2 (100.0%) | 0 (0.0%) |
| Total (Category) | 10 (100.0%) | 0 (0.0%) |
| Total (Overall) | 37 (55.2%) | 30 (44.8%) |
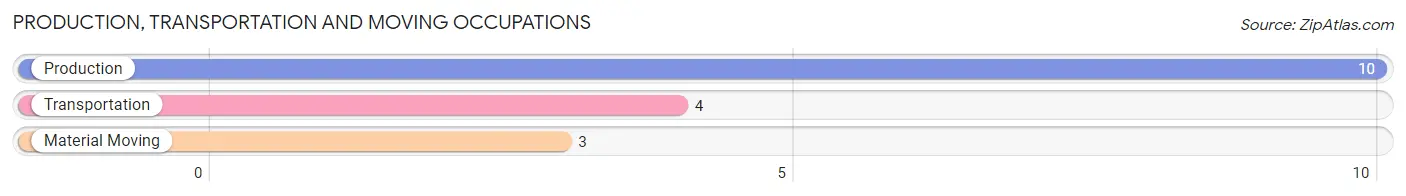
Production, Transportation and Moving Occupations
The most common Production, Transportation and Moving occupations in Brook Park are Production (10 | 14.9%), Transportation (4 | 6.0%), and Material Moving (3 | 4.5%).
Production, Transportation and Moving Occupations by Sex
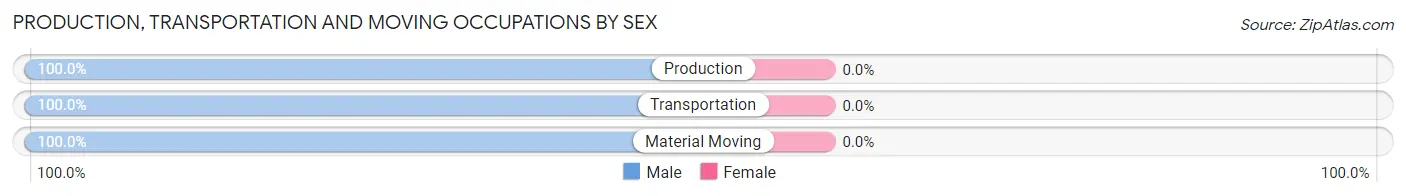
| Occupation | Male | Female |
| Production | 10 (100.0%) | 0 (0.0%) |
| Transportation | 4 (100.0%) | 0 (0.0%) |
| Material Moving | 3 (100.0%) | 0 (0.0%) |
| Total (Category) | 17 (100.0%) | 0 (0.0%) |
| Total (Overall) | 37 (55.2%) | 30 (44.8%) |
Employment Industries by Sex in Brook Park
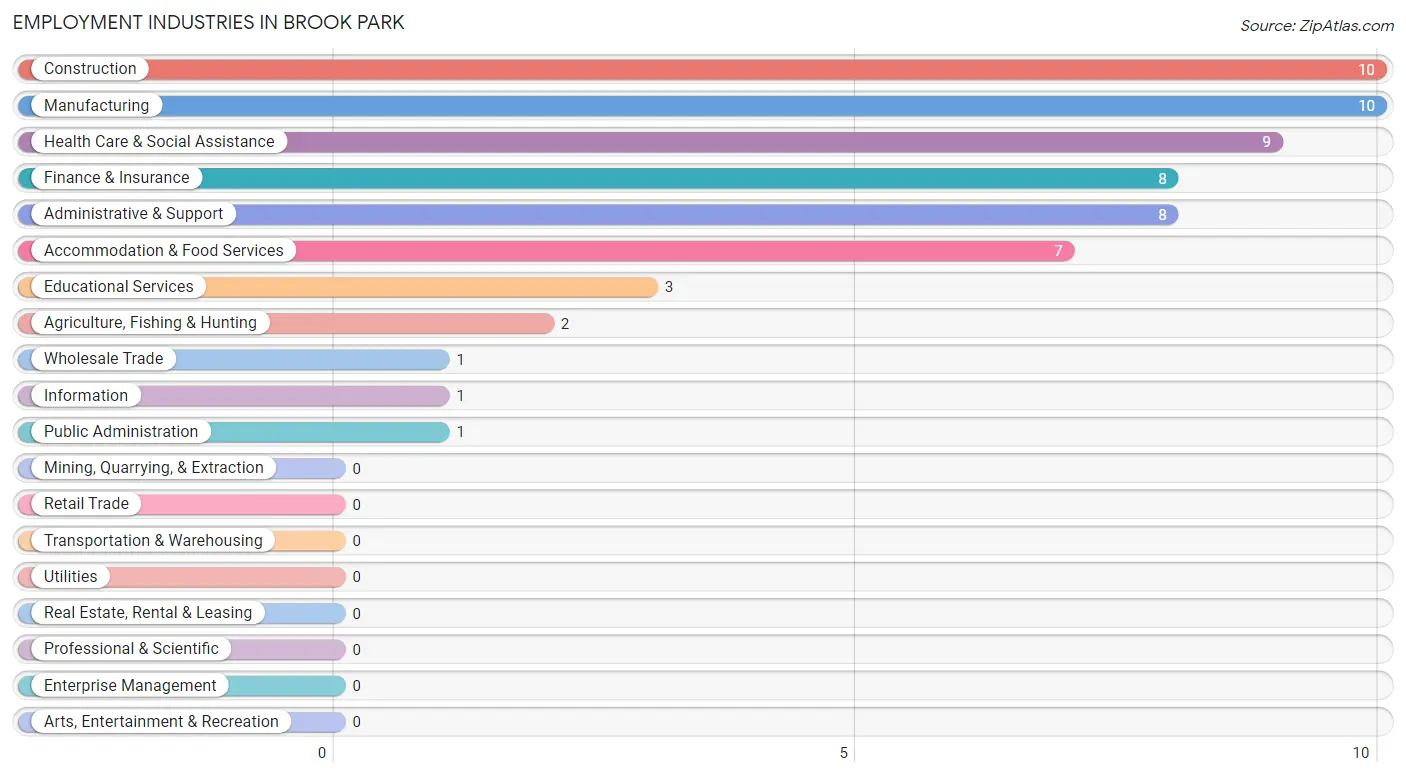
Employment Industries in Brook Park
The major employment industries in Brook Park include Construction (10 | 14.9%), Manufacturing (10 | 14.9%), Health Care & Social Assistance (9 | 13.4%), Finance & Insurance (8 | 11.9%), and Administrative & Support (8 | 11.9%).
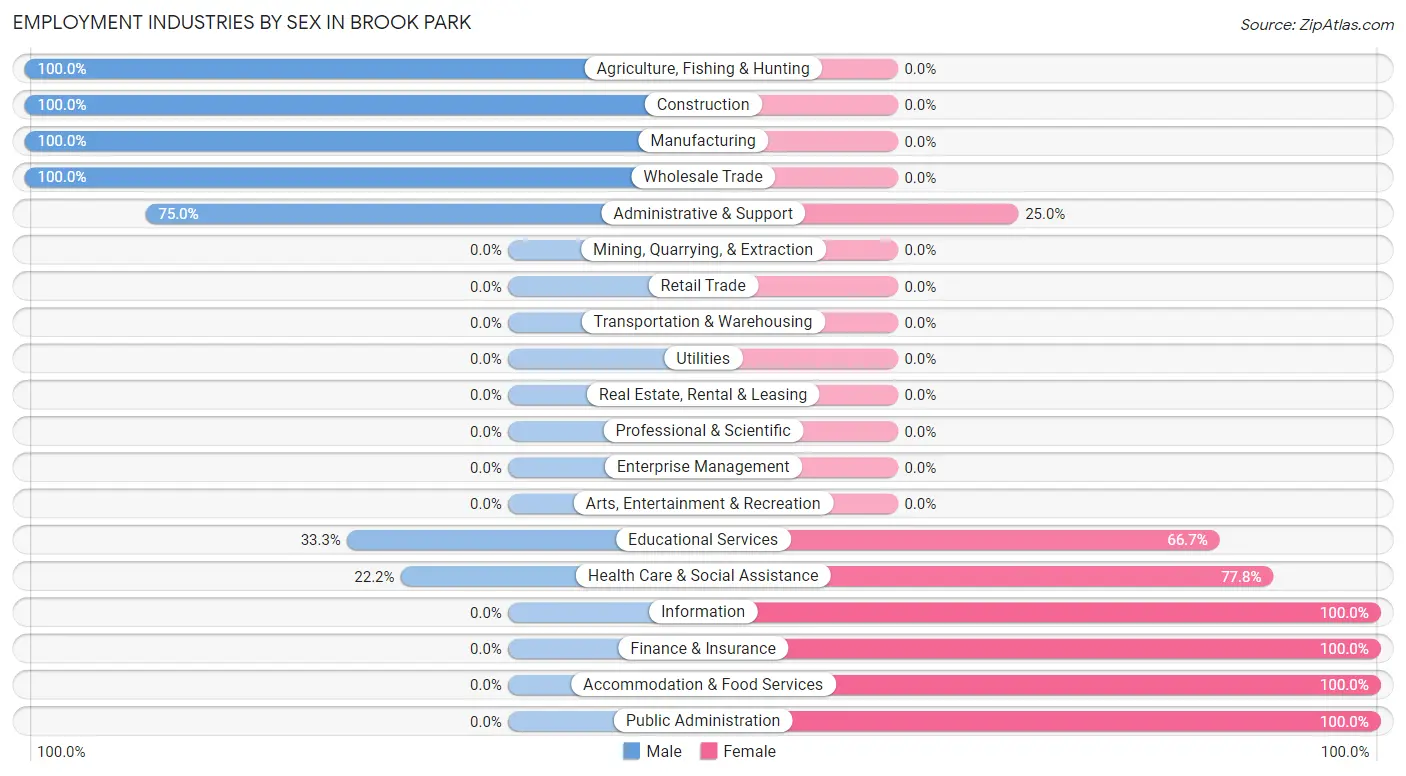
Employment Industries by Sex in Brook Park
The Brook Park industries that see more men than women are Agriculture, Fishing & Hunting (100.0%), Construction (100.0%), and Manufacturing (100.0%), whereas the industries that tend to have a higher number of women are Information (100.0%), Finance & Insurance (100.0%), and Accommodation & Food Services (100.0%).
| Industry | Male | Female |
| Agriculture, Fishing & Hunting | 2 (100.0%) | 0 (0.0%) |
| Mining, Quarrying, & Extraction | 0 (0.0%) | 0 (0.0%) |
| Construction | 10 (100.0%) | 0 (0.0%) |
| Manufacturing | 10 (100.0%) | 0 (0.0%) |
| Wholesale Trade | 1 (100.0%) | 0 (0.0%) |
| Retail Trade | 0 (0.0%) | 0 (0.0%) |
| Transportation & Warehousing | 0 (0.0%) | 0 (0.0%) |
| Utilities | 0 (0.0%) | 0 (0.0%) |
| Information | 0 (0.0%) | 1 (100.0%) |
| Finance & Insurance | 0 (0.0%) | 8 (100.0%) |
| Real Estate, Rental & Leasing | 0 (0.0%) | 0 (0.0%) |
| Professional & Scientific | 0 (0.0%) | 0 (0.0%) |
| Enterprise Management | 0 (0.0%) | 0 (0.0%) |
| Administrative & Support | 6 (75.0%) | 2 (25.0%) |
| Educational Services | 1 (33.3%) | 2 (66.7%) |
| Health Care & Social Assistance | 2 (22.2%) | 7 (77.8%) |
| Arts, Entertainment & Recreation | 0 (0.0%) | 0 (0.0%) |
| Accommodation & Food Services | 0 (0.0%) | 7 (100.0%) |
| Public Administration | 0 (0.0%) | 1 (100.0%) |
| Total | 37 (55.2%) | 30 (44.8%) |
Education in Brook Park
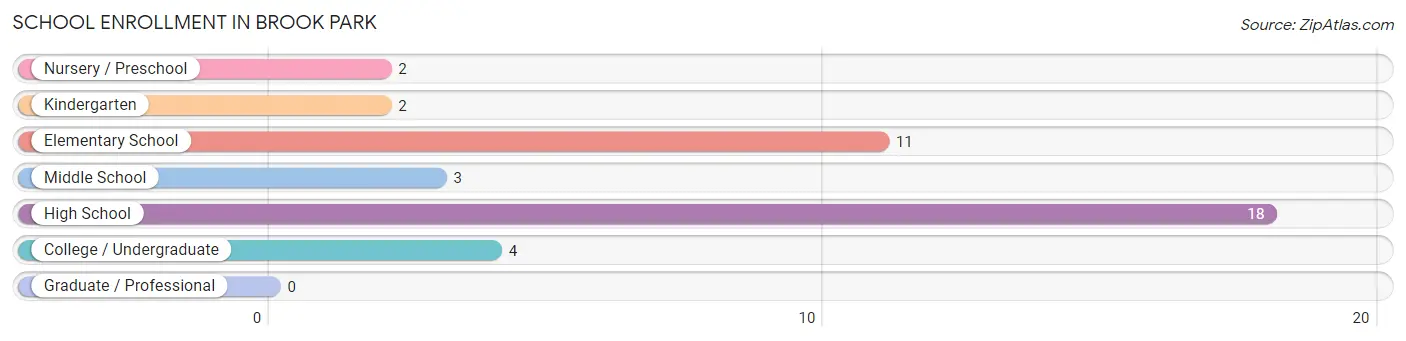
School Enrollment in Brook Park
The most common levels of schooling among the 40 students in Brook Park are high school (18 | 45.0%), elementary school (11 | 27.5%), and college / undergraduate (4 | 10.0%).
| School Level | # Students | % Students |
| Nursery / Preschool | 2 | 5.0% |
| Kindergarten | 2 | 5.0% |
| Elementary School | 11 | 27.5% |
| Middle School | 3 | 7.5% |
| High School | 18 | 45.0% |
| College / Undergraduate | 4 | 10.0% |
| Graduate / Professional | 0 | 0.0% |
| Total | 40 | 100.0% |
School Enrollment by Age by Funding Source in Brook Park
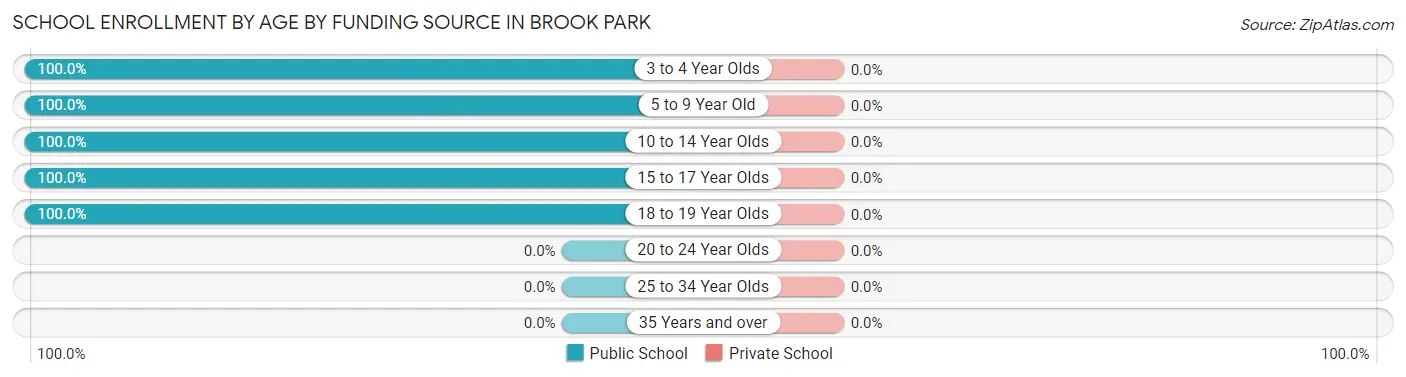
| Age Bracket | Public School | Private School |
| 3 to 4 Year Olds | 2 (100.0%) | 0 (0.0%) |
| 5 to 9 Year Old | 11 (100.0%) | 0 (0.0%) |
| 10 to 14 Year Olds | 10 (100.0%) | 0 (0.0%) |
| 15 to 17 Year Olds | 10 (100.0%) | 0 (0.0%) |
| 18 to 19 Year Olds | 7 (100.0%) | 0 (0.0%) |
| 20 to 24 Year Olds | 0 (0.0%) | 0 (0.0%) |
| 25 to 34 Year Olds | 0 (0.0%) | 0 (0.0%) |
| 35 Years and over | 0 (0.0%) | 0 (0.0%) |
| Total | 40 (100.0%) | 0 (0.0%) |
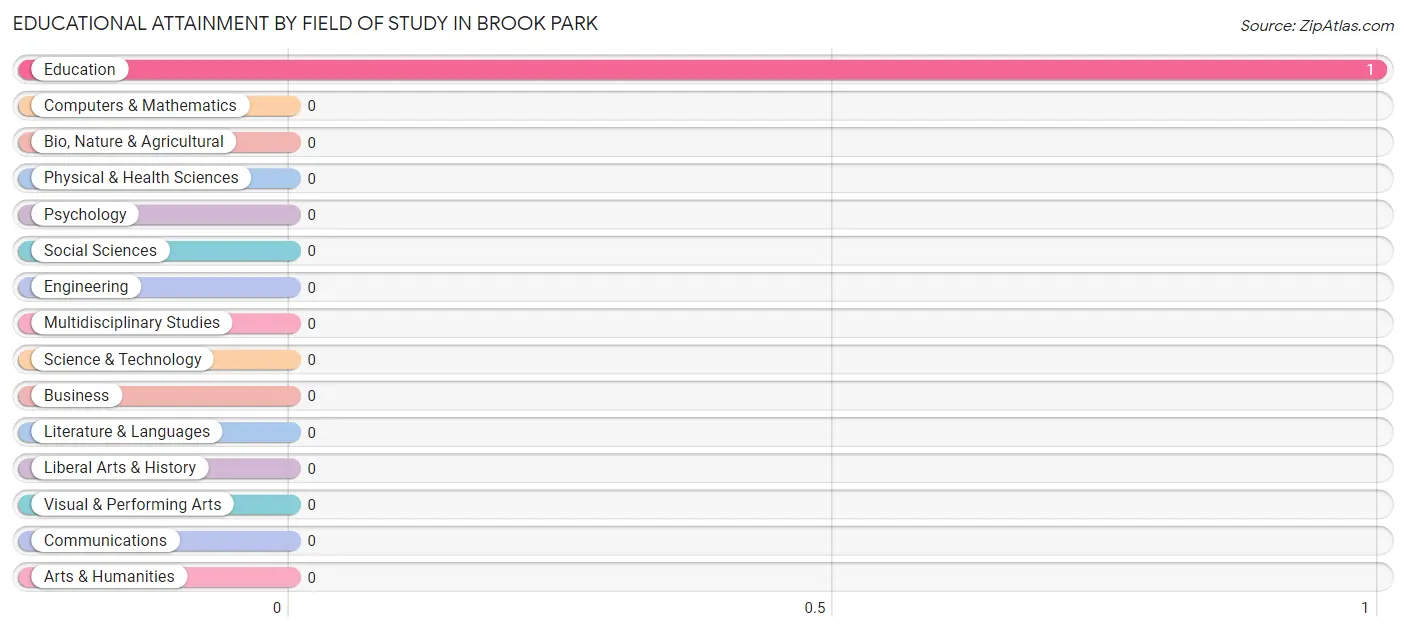
Educational Attainment by Field of Study in Brook Park
, and education (1 | 100.0%) are the most common fields of study among 1 individuals in Brook Park who have obtained a bachelor's degree or higher.
| Field of Study | # Graduates | % Graduates |
| Computers & Mathematics | 0 | 0.0% |
| Bio, Nature & Agricultural | 0 | 0.0% |
| Physical & Health Sciences | 0 | 0.0% |
| Psychology | 0 | 0.0% |
| Social Sciences | 0 | 0.0% |
| Engineering | 0 | 0.0% |
| Multidisciplinary Studies | 0 | 0.0% |
| Science & Technology | 0 | 0.0% |
| Business | 0 | 0.0% |
| Education | 1 | 100.0% |
| Literature & Languages | 0 | 0.0% |
| Liberal Arts & History | 0 | 0.0% |
| Visual & Performing Arts | 0 | 0.0% |
| Communications | 0 | 0.0% |
| Arts & Humanities | 0 | 0.0% |
| Total | 1 | 100.0% |
Transportation & Commute in Brook Park
Vehicle Availability by Sex in Brook Park
The most prevalent vehicle ownership categories in Brook Park are males with 3 vehicles (16, accounting for 43.2%) and females with 3 vehicles (14, making up 53.3%).
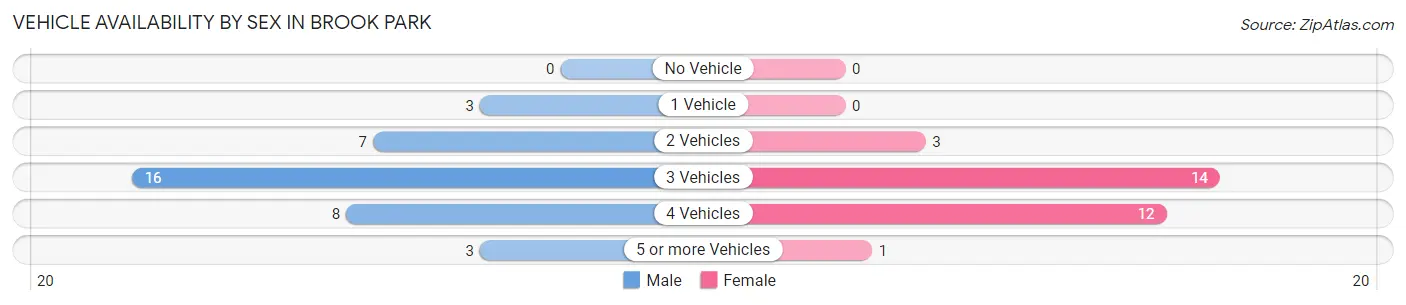
| Vehicles Available | Male | Female |
| No Vehicle | 0 (0.0%) | 0 (0.0%) |
| 1 Vehicle | 3 (8.1%) | 0 (0.0%) |
| 2 Vehicles | 7 (18.9%) | 3 (10.0%) |
| 3 Vehicles | 16 (43.2%) | 14 (46.7%) |
| 4 Vehicles | 8 (21.6%) | 12 (40.0%) |
| 5 or more Vehicles | 3 (8.1%) | 1 (3.3%) |
| Total | 37 (100.0%) | 30 (100.0%) |
Commute Time in Brook Park
The most frequently occuring commute durations in Brook Park are 20 to 24 minutes (17 commuters, 28.8%), 45 to 59 minutes (11 commuters, 18.6%), and 90 or more minutes (9 commuters, 15.2%).
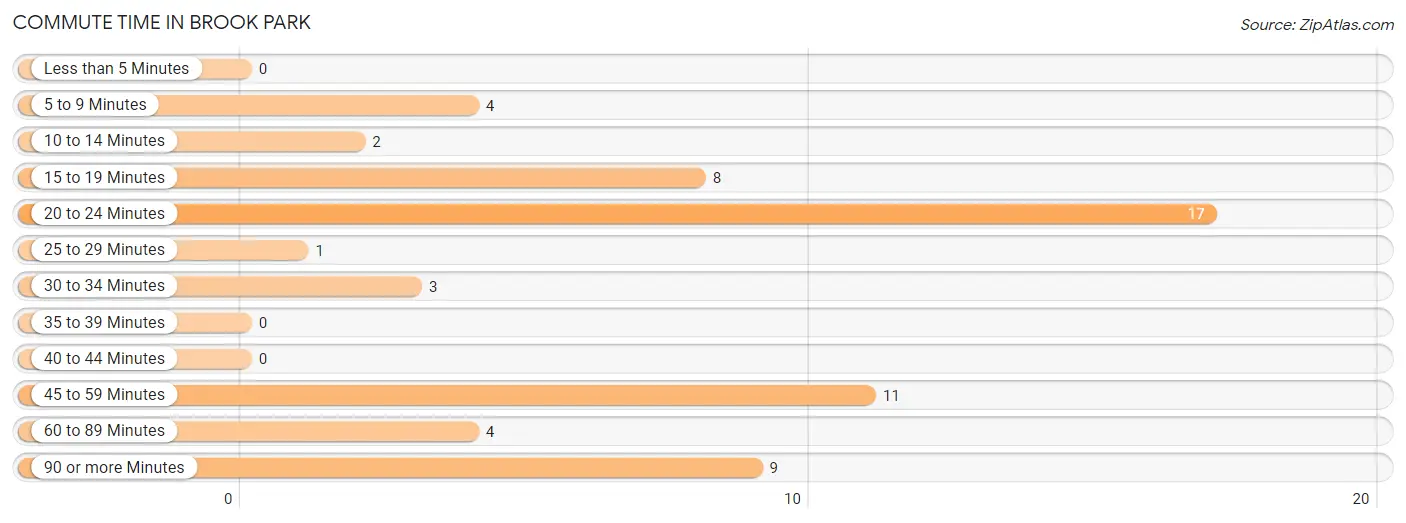
| Commute Time | # Commuters | % Commuters |
| Less than 5 Minutes | 0 | 0.0% |
| 5 to 9 Minutes | 4 | 6.8% |
| 10 to 14 Minutes | 2 | 3.4% |
| 15 to 19 Minutes | 8 | 13.6% |
| 20 to 24 Minutes | 17 | 28.8% |
| 25 to 29 Minutes | 1 | 1.7% |
| 30 to 34 Minutes | 3 | 5.1% |
| 35 to 39 Minutes | 0 | 0.0% |
| 40 to 44 Minutes | 0 | 0.0% |
| 45 to 59 Minutes | 11 | 18.6% |
| 60 to 89 Minutes | 4 | 6.8% |
| 90 or more Minutes | 9 | 15.2% |
Commute Time by Sex in Brook Park
The most common commute times in Brook Park are 20 to 24 minutes (14 commuters, 37.8%) for males and 15 to 19 minutes (6 commuters, 27.3%) for females.
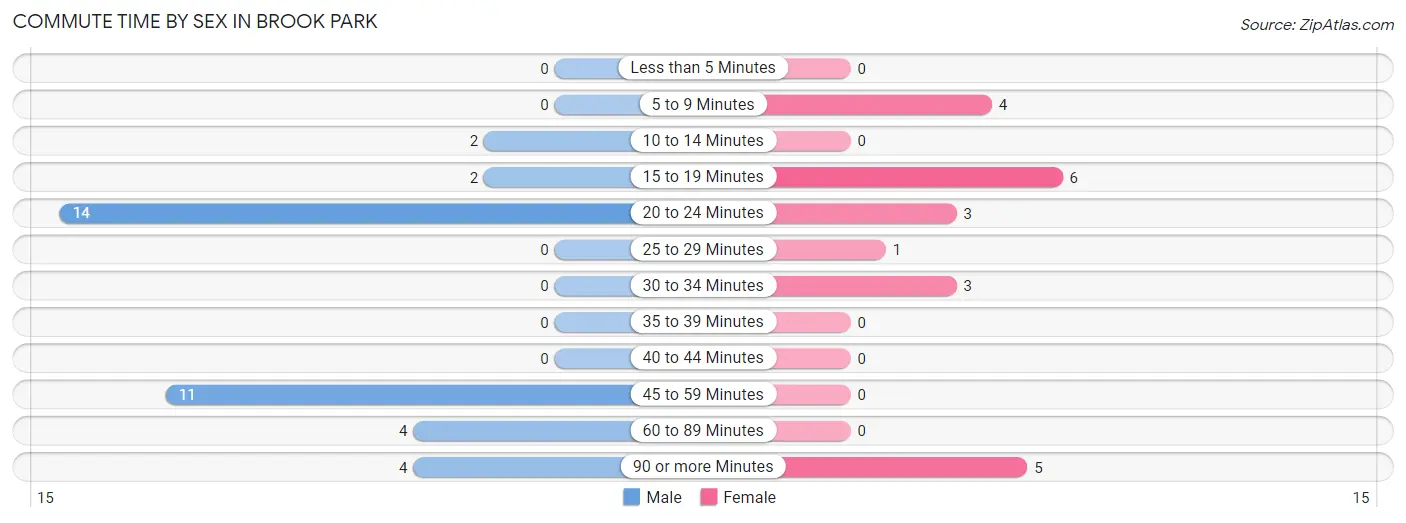
| Commute Time | Male | Female |
| Less than 5 Minutes | 0 (0.0%) | 0 (0.0%) |
| 5 to 9 Minutes | 0 (0.0%) | 4 (18.2%) |
| 10 to 14 Minutes | 2 (5.4%) | 0 (0.0%) |
| 15 to 19 Minutes | 2 (5.4%) | 6 (27.3%) |
| 20 to 24 Minutes | 14 (37.8%) | 3 (13.6%) |
| 25 to 29 Minutes | 0 (0.0%) | 1 (4.5%) |
| 30 to 34 Minutes | 0 (0.0%) | 3 (13.6%) |
| 35 to 39 Minutes | 0 (0.0%) | 0 (0.0%) |
| 40 to 44 Minutes | 0 (0.0%) | 0 (0.0%) |
| 45 to 59 Minutes | 11 (29.7%) | 0 (0.0%) |
| 60 to 89 Minutes | 4 (10.8%) | 0 (0.0%) |
| 90 or more Minutes | 4 (10.8%) | 5 (22.7%) |
Time of Departure to Work by Sex in Brook Park
The most frequent times of departure to work in Brook Park are 12:00 AM to 4:59 AM (17, 46.0%) for males and 6:00 AM to 6:29 AM (5, 22.7%) for females.
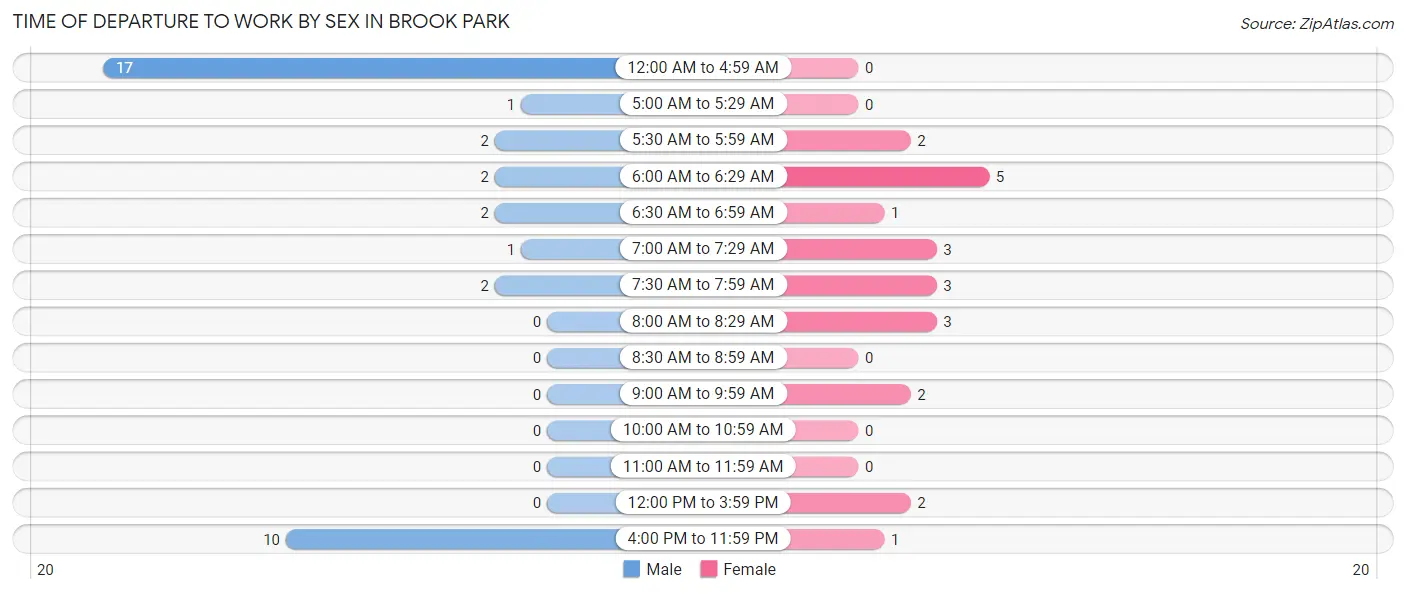
| Time of Departure | Male | Female |
| 12:00 AM to 4:59 AM | 17 (46.0%) | 0 (0.0%) |
| 5:00 AM to 5:29 AM | 1 (2.7%) | 0 (0.0%) |
| 5:30 AM to 5:59 AM | 2 (5.4%) | 2 (9.1%) |
| 6:00 AM to 6:29 AM | 2 (5.4%) | 5 (22.7%) |
| 6:30 AM to 6:59 AM | 2 (5.4%) | 1 (4.5%) |
| 7:00 AM to 7:29 AM | 1 (2.7%) | 3 (13.6%) |
| 7:30 AM to 7:59 AM | 2 (5.4%) | 3 (13.6%) |
| 8:00 AM to 8:29 AM | 0 (0.0%) | 3 (13.6%) |
| 8:30 AM to 8:59 AM | 0 (0.0%) | 0 (0.0%) |
| 9:00 AM to 9:59 AM | 0 (0.0%) | 2 (9.1%) |
| 10:00 AM to 10:59 AM | 0 (0.0%) | 0 (0.0%) |
| 11:00 AM to 11:59 AM | 0 (0.0%) | 0 (0.0%) |
| 12:00 PM to 3:59 PM | 0 (0.0%) | 2 (9.1%) |
| 4:00 PM to 11:59 PM | 10 (27.0%) | 1 (4.5%) |
| Total | 37 (100.0%) | 22 (100.0%) |
Housing Occupancy in Brook Park
Occupancy by Ownership in Brook Park
Of the total 44 dwellings in Brook Park, owner-occupied units account for 29 (65.9%), while renter-occupied units make up 15 (34.1%).
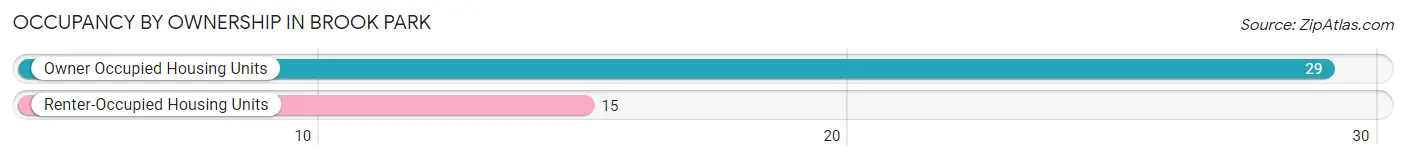
| Occupancy | # Housing Units | % Housing Units |
| Owner Occupied Housing Units | 29 | 65.9% |
| Renter-Occupied Housing Units | 15 | 34.1% |
| Total Occupied Housing Units | 44 | 100.0% |
Occupancy by Household Size in Brook Park
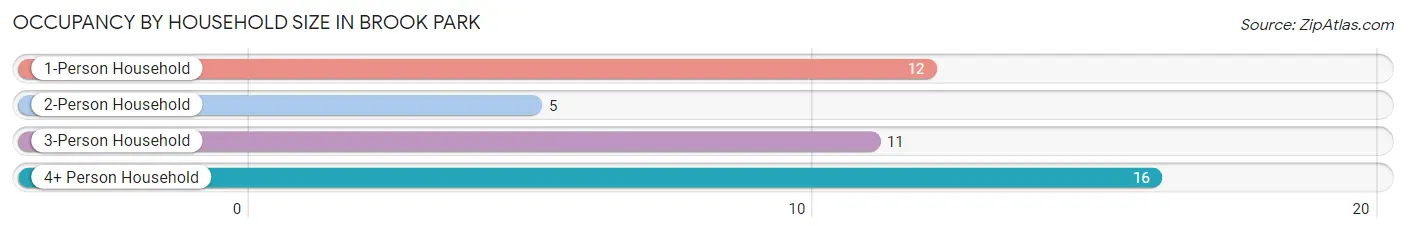
| Household Size | # Housing Units | % Housing Units |
| 1-Person Household | 12 | 27.3% |
| 2-Person Household | 5 | 11.4% |
| 3-Person Household | 11 | 25.0% |
| 4+ Person Household | 16 | 36.4% |
| Total Housing Units | 44 | 100.0% |
Occupancy by Ownership by Household Size in Brook Park
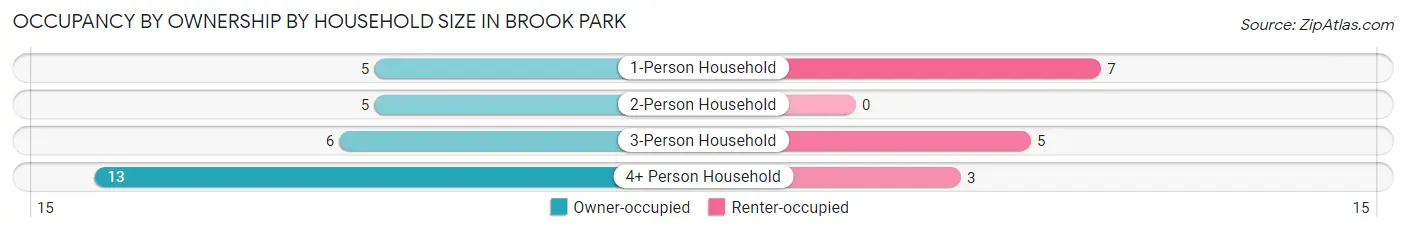
| Household Size | Owner-occupied | Renter-occupied |
| 1-Person Household | 5 (41.7%) | 7 (58.3%) |
| 2-Person Household | 5 (100.0%) | 0 (0.0%) |
| 3-Person Household | 6 (54.5%) | 5 (45.5%) |
| 4+ Person Household | 13 (81.2%) | 3 (18.8%) |
| Total Housing Units | 29 (65.9%) | 15 (34.1%) |
Occupancy by Educational Attainment in Brook Park
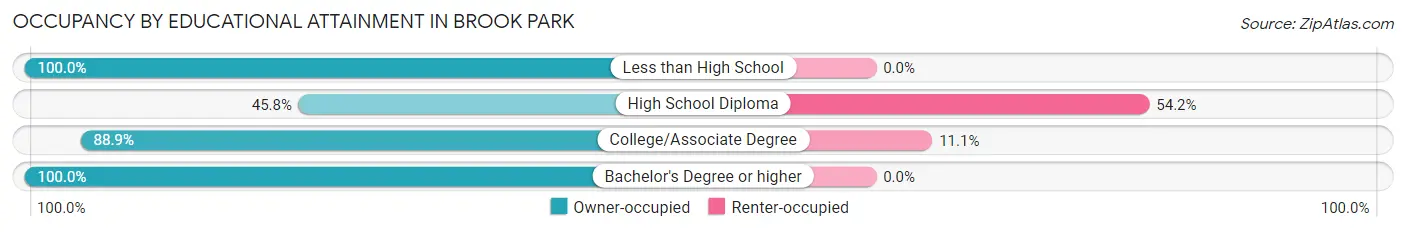
| Household Size | Owner-occupied | Renter-occupied |
| Less than High School | 1 (100.0%) | 0 (0.0%) |
| High School Diploma | 11 (45.8%) | 13 (54.2%) |
| College/Associate Degree | 16 (88.9%) | 2 (11.1%) |
| Bachelor's Degree or higher | 1 (100.0%) | 0 (0.0%) |
Occupancy by Age of Householder in Brook Park
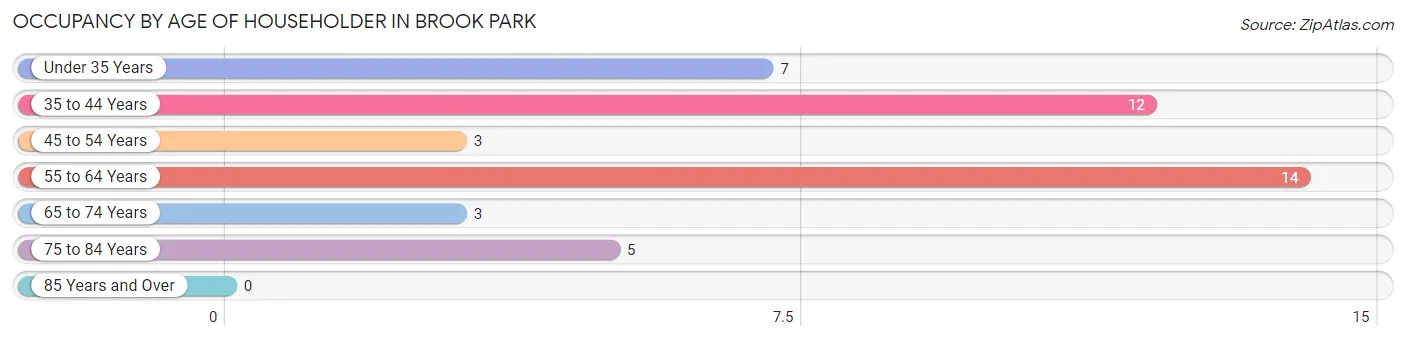
| Age Bracket | # Households | % Households |
| Under 35 Years | 7 | 15.9% |
| 35 to 44 Years | 12 | 27.3% |
| 45 to 54 Years | 3 | 6.8% |
| 55 to 64 Years | 14 | 31.8% |
| 65 to 74 Years | 3 | 6.8% |
| 75 to 84 Years | 5 | 11.4% |
| 85 Years and Over | 0 | 0.0% |
| Total | 44 | 100.0% |
Housing Finances in Brook Park
Median Income by Occupancy in Brook Park
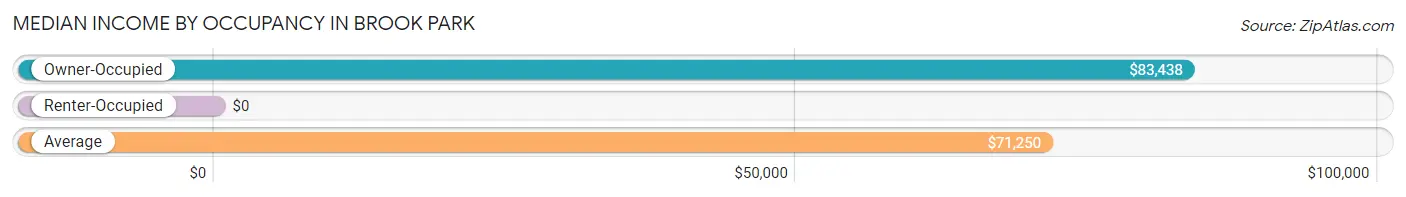
| Occupancy Type | # Households | Median Income |
| Owner-Occupied | 29 (65.9%) | $83,438 |
| Renter-Occupied | 15 (34.1%) | $0 |
| Average | 44 (100.0%) | $71,250 |
Occupancy by Householder Income Bracket in Brook Park
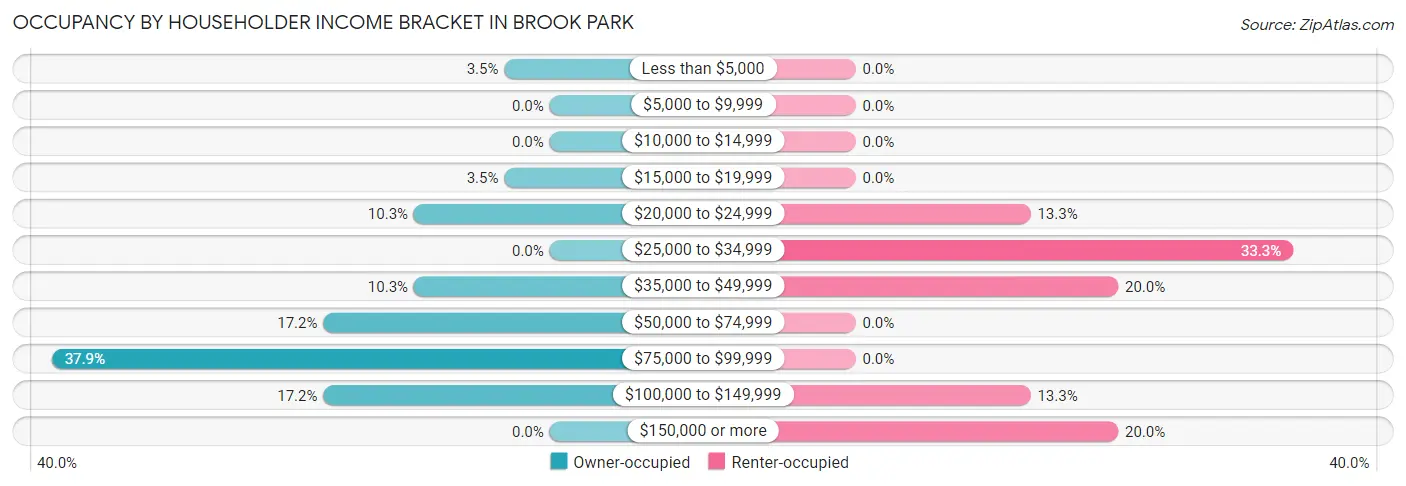
| Income Bracket | Owner-occupied | Renter-occupied |
| Less than $5,000 | 1 (3.5%) | 0 (0.0%) |
| $5,000 to $9,999 | 0 (0.0%) | 0 (0.0%) |
| $10,000 to $14,999 | 0 (0.0%) | 0 (0.0%) |
| $15,000 to $19,999 | 1 (3.5%) | 0 (0.0%) |
| $20,000 to $24,999 | 3 (10.3%) | 2 (13.3%) |
| $25,000 to $34,999 | 0 (0.0%) | 5 (33.3%) |
| $35,000 to $49,999 | 3 (10.3%) | 3 (20.0%) |
| $50,000 to $74,999 | 5 (17.2%) | 0 (0.0%) |
| $75,000 to $99,999 | 11 (37.9%) | 0 (0.0%) |
| $100,000 to $149,999 | 5 (17.2%) | 2 (13.3%) |
| $150,000 or more | 0 (0.0%) | 3 (20.0%) |
| Total | 29 (100.0%) | 15 (100.0%) |
Monthly Housing Cost Tiers in Brook Park
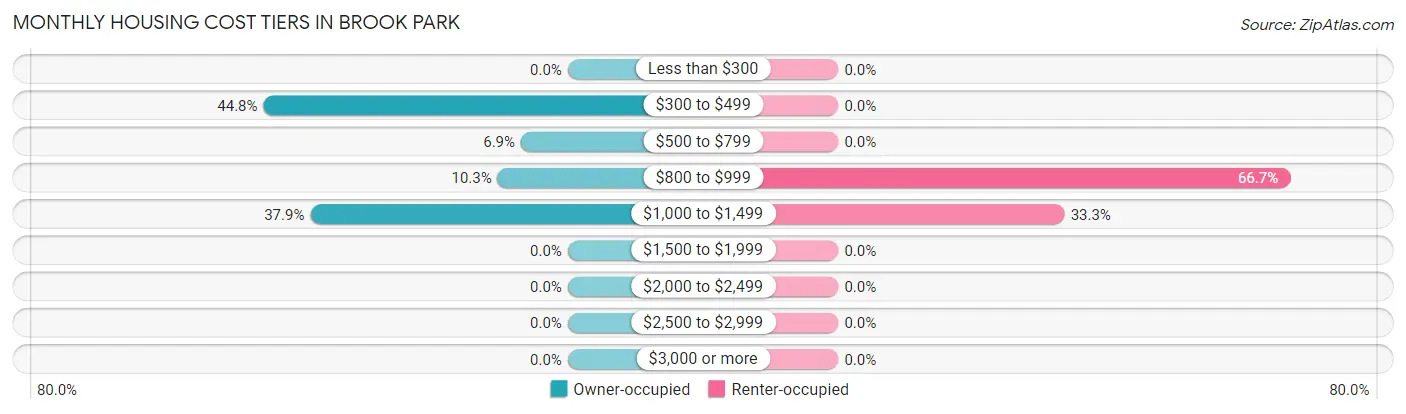
| Monthly Cost | Owner-occupied | Renter-occupied |
| Less than $300 | 0 (0.0%) | 0 (0.0%) |
| $300 to $499 | 13 (44.8%) | 0 (0.0%) |
| $500 to $799 | 2 (6.9%) | 0 (0.0%) |
| $800 to $999 | 3 (10.3%) | 10 (66.7%) |
| $1,000 to $1,499 | 11 (37.9%) | 5 (33.3%) |
| $1,500 to $1,999 | 0 (0.0%) | 0 (0.0%) |
| $2,000 to $2,499 | 0 (0.0%) | 0 (0.0%) |
| $2,500 to $2,999 | 0 (0.0%) | 0 (0.0%) |
| $3,000 or more | 0 (0.0%) | 0 (0.0%) |
| Total | 29 (100.0%) | 15 (100.0%) |
Physical Housing Characteristics in Brook Park
Housing Structures in Brook Park
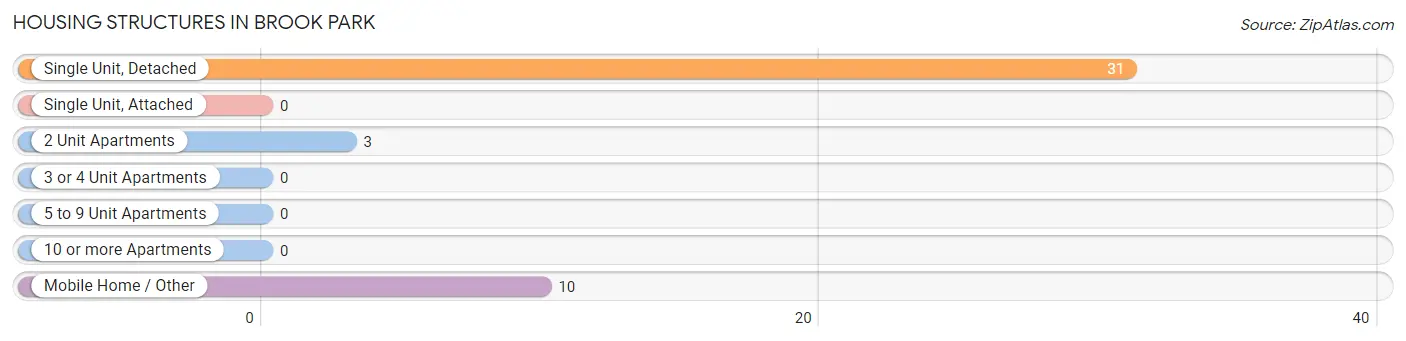
| Structure Type | # Housing Units | % Housing Units |
| Single Unit, Detached | 31 | 70.5% |
| Single Unit, Attached | 0 | 0.0% |
| 2 Unit Apartments | 3 | 6.8% |
| 3 or 4 Unit Apartments | 0 | 0.0% |
| 5 to 9 Unit Apartments | 0 | 0.0% |
| 10 or more Apartments | 0 | 0.0% |
| Mobile Home / Other | 10 | 22.7% |
| Total | 44 | 100.0% |
Housing Structures by Occupancy in Brook Park
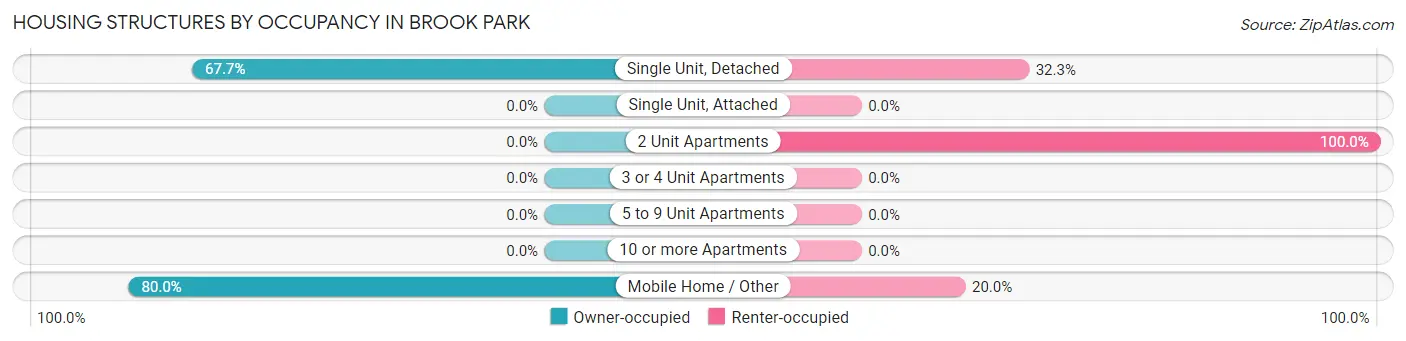
| Structure Type | Owner-occupied | Renter-occupied |
| Single Unit, Detached | 21 (67.7%) | 10 (32.3%) |
| Single Unit, Attached | 0 (0.0%) | 0 (0.0%) |
| 2 Unit Apartments | 0 (0.0%) | 3 (100.0%) |
| 3 or 4 Unit Apartments | 0 (0.0%) | 0 (0.0%) |
| 5 to 9 Unit Apartments | 0 (0.0%) | 0 (0.0%) |
| 10 or more Apartments | 0 (0.0%) | 0 (0.0%) |
| Mobile Home / Other | 8 (80.0%) | 2 (20.0%) |
| Total | 29 (65.9%) | 15 (34.1%) |
Housing Structures by Number of Rooms in Brook Park
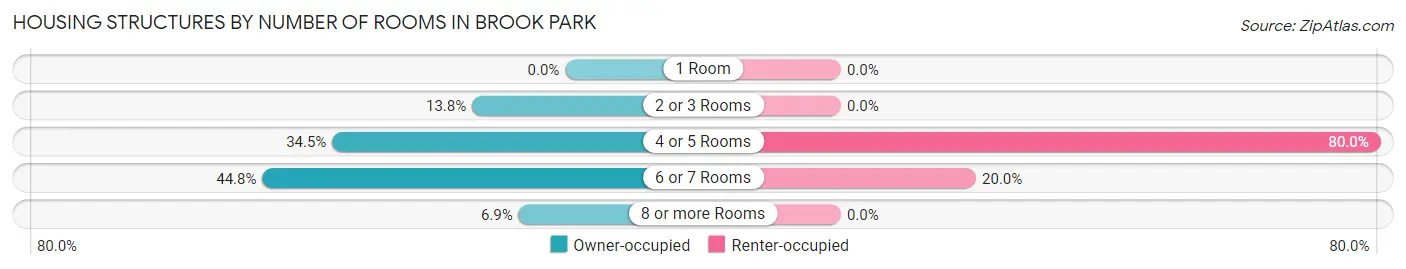
| Number of Rooms | Owner-occupied | Renter-occupied |
| 1 Room | 0 (0.0%) | 0 (0.0%) |
| 2 or 3 Rooms | 4 (13.8%) | 0 (0.0%) |
| 4 or 5 Rooms | 10 (34.5%) | 12 (80.0%) |
| 6 or 7 Rooms | 13 (44.8%) | 3 (20.0%) |
| 8 or more Rooms | 2 (6.9%) | 0 (0.0%) |
| Total | 29 (100.0%) | 15 (100.0%) |
Housing Structure by Heating Type in Brook Park
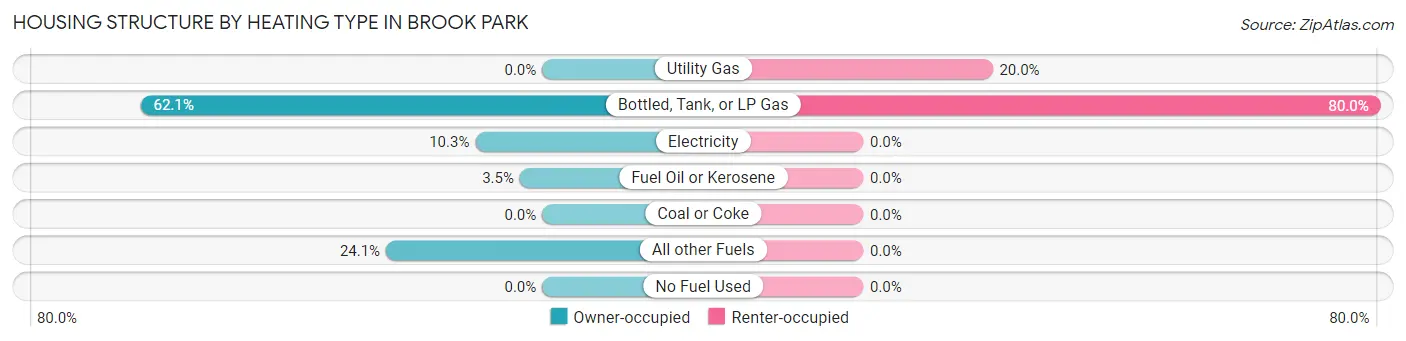
| Heating Type | Owner-occupied | Renter-occupied |
| Utility Gas | 0 (0.0%) | 3 (20.0%) |
| Bottled, Tank, or LP Gas | 18 (62.1%) | 12 (80.0%) |
| Electricity | 3 (10.3%) | 0 (0.0%) |
| Fuel Oil or Kerosene | 1 (3.5%) | 0 (0.0%) |
| Coal or Coke | 0 (0.0%) | 0 (0.0%) |
| All other Fuels | 7 (24.1%) | 0 (0.0%) |
| No Fuel Used | 0 (0.0%) | 0 (0.0%) |
| Total | 29 (100.0%) | 15 (100.0%) |
Household Vehicle Usage in Brook Park
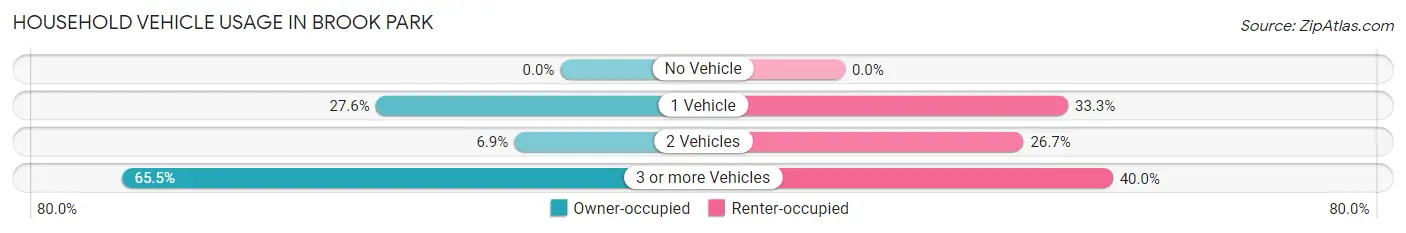
| Vehicles per Household | Owner-occupied | Renter-occupied |
| No Vehicle | 0 (0.0%) | 0 (0.0%) |
| 1 Vehicle | 8 (27.6%) | 5 (33.3%) |
| 2 Vehicles | 2 (6.9%) | 4 (26.7%) |
| 3 or more Vehicles | 19 (65.5%) | 6 (40.0%) |
| Total | 29 (100.0%) | 15 (100.0%) |
Real Estate & Mortgages in Brook Park
Real Estate and Mortgage Overview in Brook Park
| Characteristic | Without Mortgage | With Mortgage |
| Housing Units | 17 | 12 |
| Median Property Value | $49,000 | $100,000 |
| Median Household Income | $71,875 | $0 |
| Monthly Housing Costs | $425 | $0 |
| Real Estate Taxes | $540 | $0 |
Property Value by Mortgage Status in Brook Park
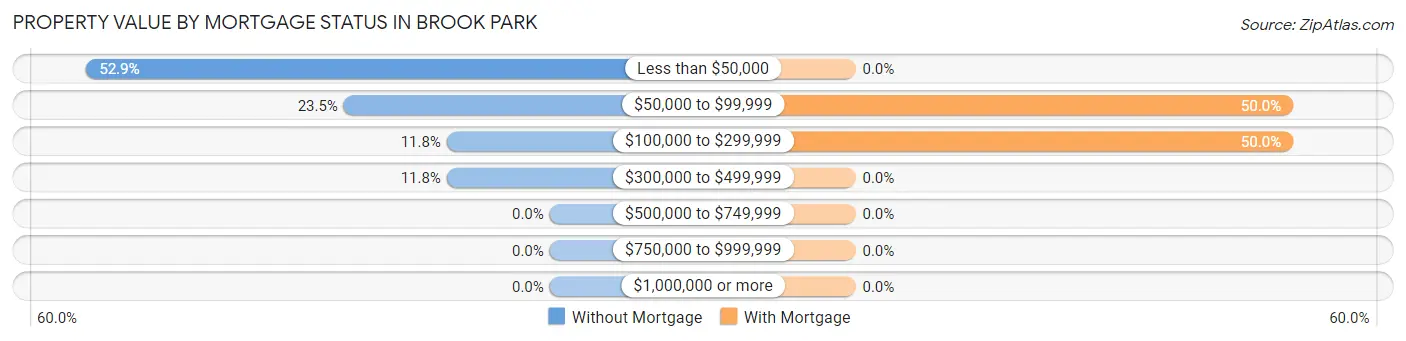
| Property Value | Without Mortgage | With Mortgage |
| Less than $50,000 | 9 (52.9%) | 0 (0.0%) |
| $50,000 to $99,999 | 4 (23.5%) | 6 (50.0%) |
| $100,000 to $299,999 | 2 (11.8%) | 6 (50.0%) |
| $300,000 to $499,999 | 2 (11.8%) | 0 (0.0%) |
| $500,000 to $749,999 | 0 (0.0%) | 0 (0.0%) |
| $750,000 to $999,999 | 0 (0.0%) | 0 (0.0%) |
| $1,000,000 or more | 0 (0.0%) | 0 (0.0%) |
| Total | 17 (100.0%) | 12 (100.0%) |
Household Income by Mortgage Status in Brook Park
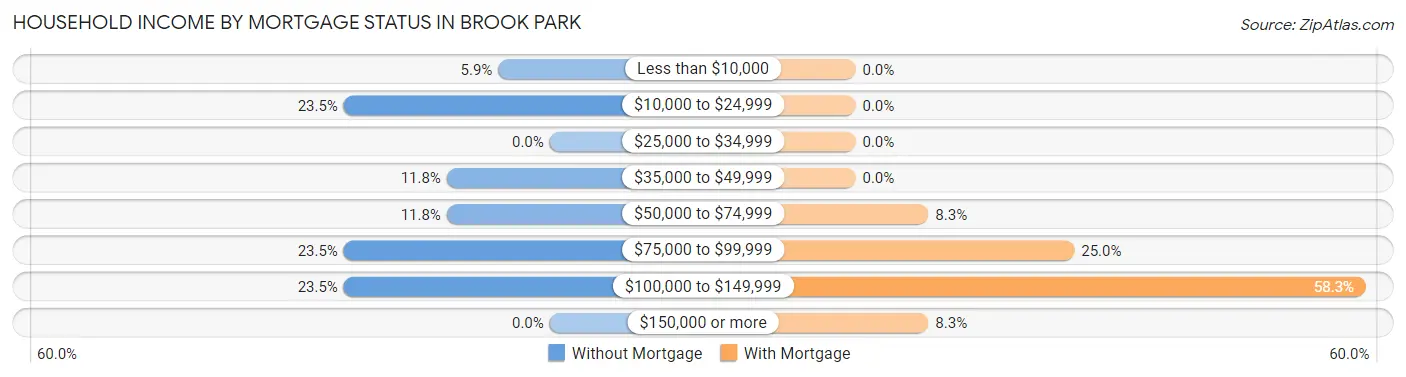
| Household Income | Without Mortgage | With Mortgage |
| Less than $10,000 | 1 (5.9%) | 0 (0.0%) |
| $10,000 to $24,999 | 4 (23.5%) | 0 (0.0%) |
| $25,000 to $34,999 | 0 (0.0%) | 0 (0.0%) |
| $35,000 to $49,999 | 2 (11.8%) | 0 (0.0%) |
| $50,000 to $74,999 | 2 (11.8%) | 1 (8.3%) |
| $75,000 to $99,999 | 4 (23.5%) | 3 (25.0%) |
| $100,000 to $149,999 | 4 (23.5%) | 7 (58.3%) |
| $150,000 or more | 0 (0.0%) | 1 (8.3%) |
| Total | 17 (100.0%) | 12 (100.0%) |
Property Value to Household Income Ratio in Brook Park
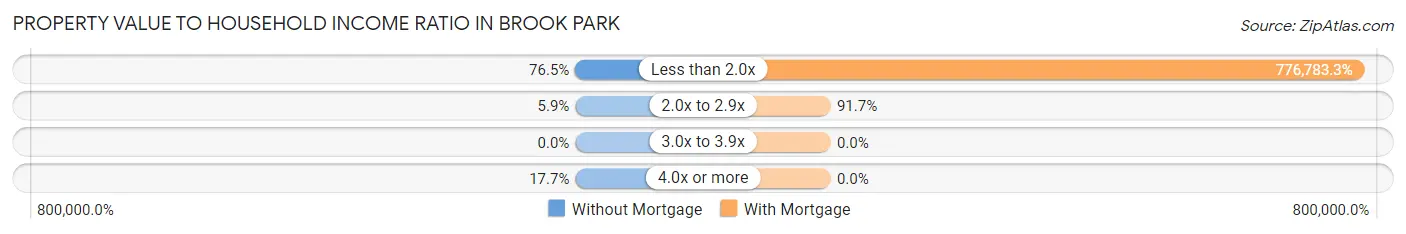
| Value-to-Income Ratio | Without Mortgage | With Mortgage |
| Less than 2.0x | 13 (76.5%) | 93,214 (776,783.3%) |
| 2.0x to 2.9x | 1 (5.9%) | 11 (91.7%) |
| 3.0x to 3.9x | 0 (0.0%) | 0 (0.0%) |
| 4.0x or more | 3 (17.6%) | 0 (0.0%) |
| Total | 17 (100.0%) | 12 (100.0%) |
Real Estate Taxes by Mortgage Status in Brook Park
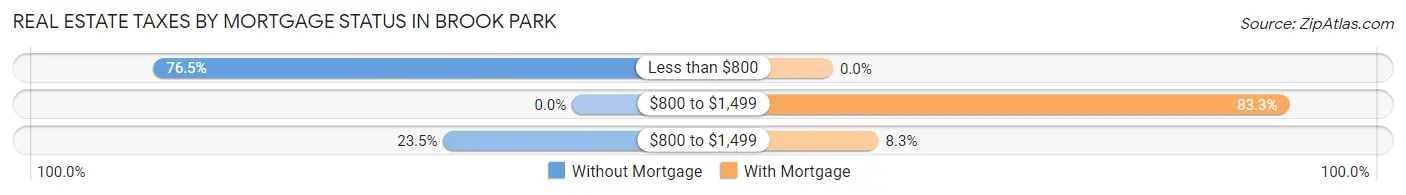
| Property Taxes | Without Mortgage | With Mortgage |
| Less than $800 | 13 (76.5%) | 0 (0.0%) |
| $800 to $1,499 | 0 (0.0%) | 10 (83.3%) |
| $800 to $1,499 | 4 (23.5%) | 1 (8.3%) |
| Total | 17 (100.0%) | 12 (100.0%) |
Health & Disability in Brook Park
Health Insurance Coverage by Age in Brook Park
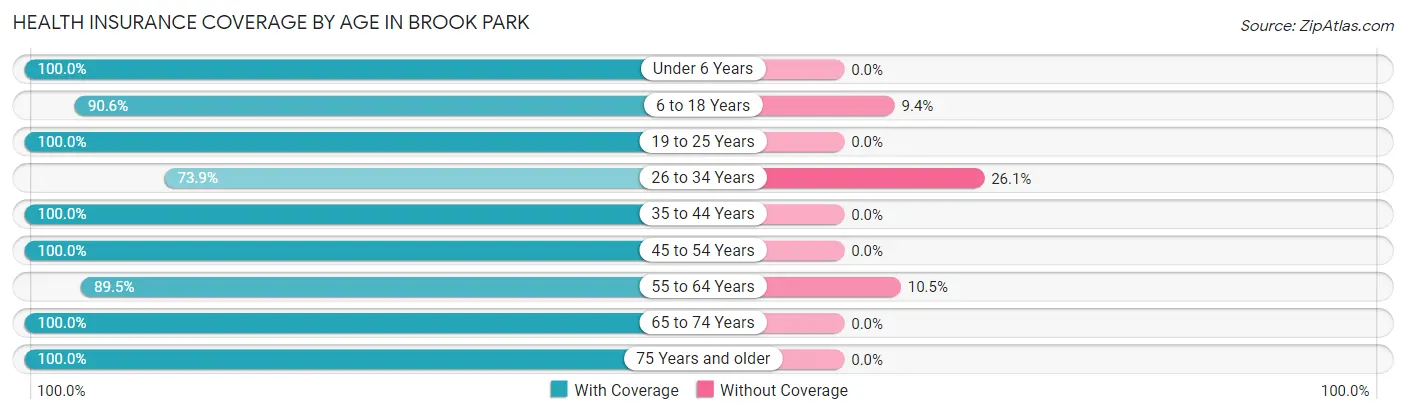
| Age Bracket | With Coverage | Without Coverage |
| Under 6 Years | 4 (100.0%) | 0 (0.0%) |
| 6 to 18 Years | 29 (90.6%) | 3 (9.4%) |
| 19 to 25 Years | 7 (100.0%) | 0 (0.0%) |
| 26 to 34 Years | 17 (73.9%) | 6 (26.1%) |
| 35 to 44 Years | 31 (100.0%) | 0 (0.0%) |
| 45 to 54 Years | 12 (100.0%) | 0 (0.0%) |
| 55 to 64 Years | 17 (89.5%) | 2 (10.5%) |
| 65 to 74 Years | 3 (100.0%) | 0 (0.0%) |
| 75 Years and older | 5 (100.0%) | 0 (0.0%) |
| Total | 125 (91.9%) | 11 (8.1%) |
Health Insurance Coverage by Citizenship Status in Brook Park
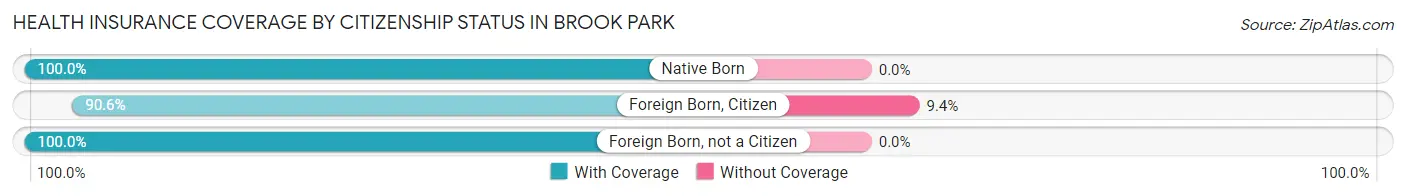
| Citizenship Status | With Coverage | Without Coverage |
| Native Born | 4 (100.0%) | 0 (0.0%) |
| Foreign Born, Citizen | 29 (90.6%) | 3 (9.4%) |
| Foreign Born, not a Citizen | 7 (100.0%) | 0 (0.0%) |
Health Insurance Coverage by Household Income in Brook Park
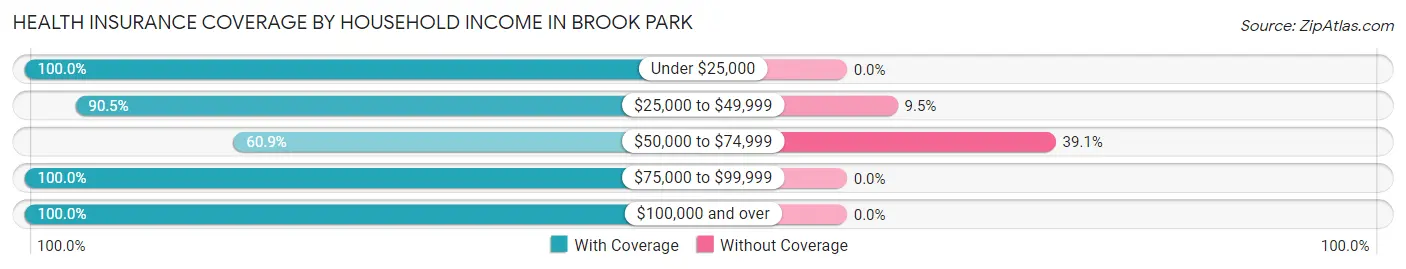
| Household Income | With Coverage | Without Coverage |
| Under $25,000 | 11 (100.0%) | 0 (0.0%) |
| $25,000 to $49,999 | 19 (90.5%) | 2 (9.5%) |
| $50,000 to $74,999 | 14 (60.9%) | 9 (39.1%) |
| $75,000 to $99,999 | 45 (100.0%) | 0 (0.0%) |
| $100,000 and over | 36 (100.0%) | 0 (0.0%) |
Public vs Private Health Insurance Coverage by Age in Brook Park
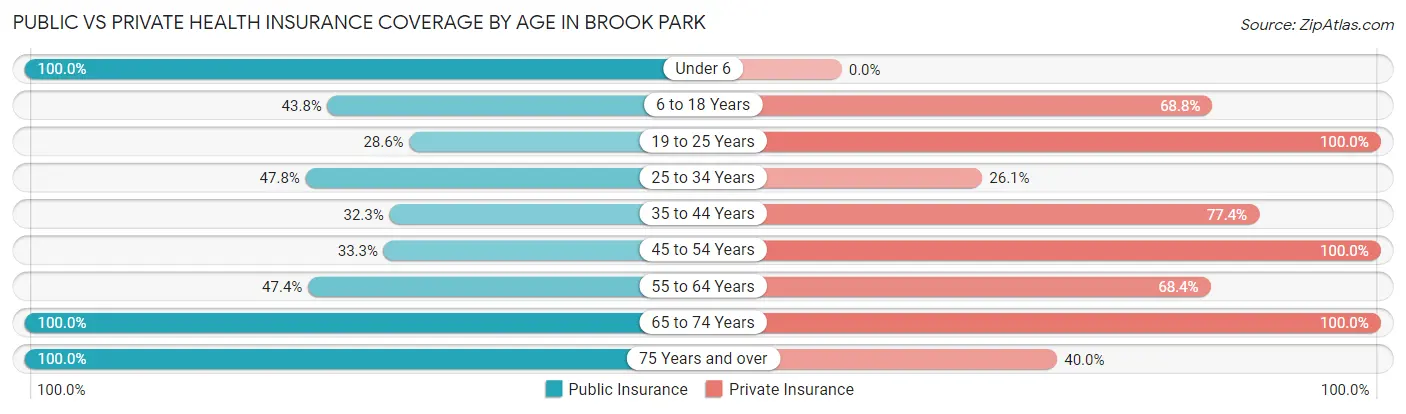
| Age Bracket | Public Insurance | Private Insurance |
| Under 6 | 4 (100.0%) | 0 (0.0%) |
| 6 to 18 Years | 14 (43.8%) | 22 (68.8%) |
| 19 to 25 Years | 2 (28.6%) | 7 (100.0%) |
| 25 to 34 Years | 11 (47.8%) | 6 (26.1%) |
| 35 to 44 Years | 10 (32.3%) | 24 (77.4%) |
| 45 to 54 Years | 4 (33.3%) | 12 (100.0%) |
| 55 to 64 Years | 9 (47.4%) | 13 (68.4%) |
| 65 to 74 Years | 3 (100.0%) | 3 (100.0%) |
| 75 Years and over | 5 (100.0%) | 2 (40.0%) |
| Total | 62 (45.6%) | 89 (65.4%) |
Disability Status by Sex by Age in Brook Park
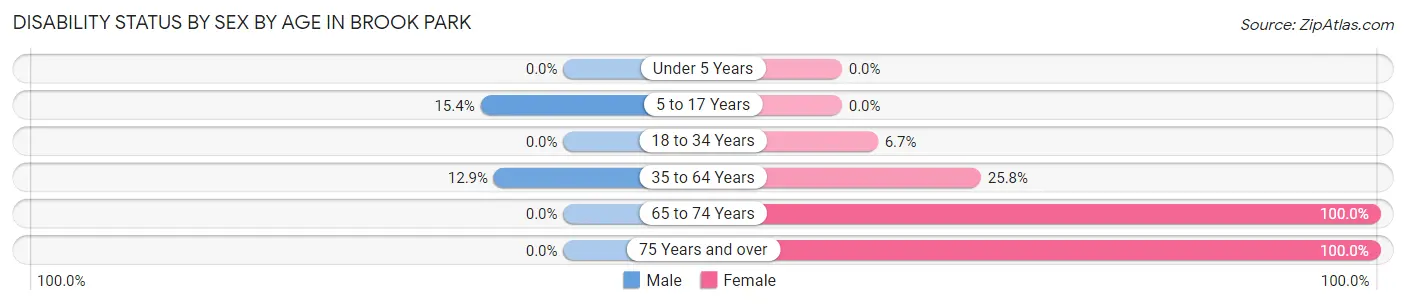
| Age Bracket | Male | Female |
| Under 5 Years | 0 (0.0%) | 0 (0.0%) |
| 5 to 17 Years | 2 (15.4%) | 0 (0.0%) |
| 18 to 34 Years | 0 (0.0%) | 1 (6.7%) |
| 35 to 64 Years | 4 (12.9%) | 8 (25.8%) |
| 65 to 74 Years | 0 (0.0%) | 3 (100.0%) |
| 75 Years and over | 0 (0.0%) | 3 (100.0%) |
Disability Class by Sex by Age in Brook Park
Disability Class: Hearing Difficulty
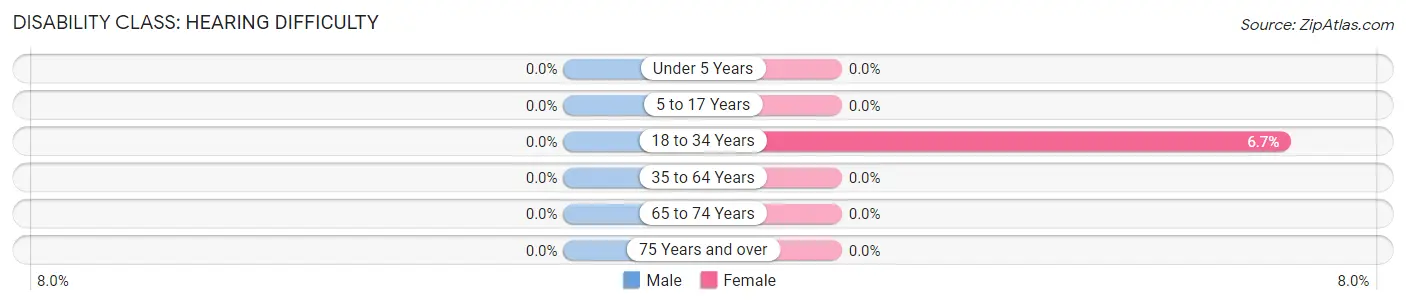
| Age Bracket | Male | Female |
| Under 5 Years | 0 (0.0%) | 0 (0.0%) |
| 5 to 17 Years | 0 (0.0%) | 0 (0.0%) |
| 18 to 34 Years | 0 (0.0%) | 1 (6.7%) |
| 35 to 64 Years | 0 (0.0%) | 0 (0.0%) |
| 65 to 74 Years | 0 (0.0%) | 0 (0.0%) |
| 75 Years and over | 0 (0.0%) | 0 (0.0%) |
Disability Class: Vision Difficulty
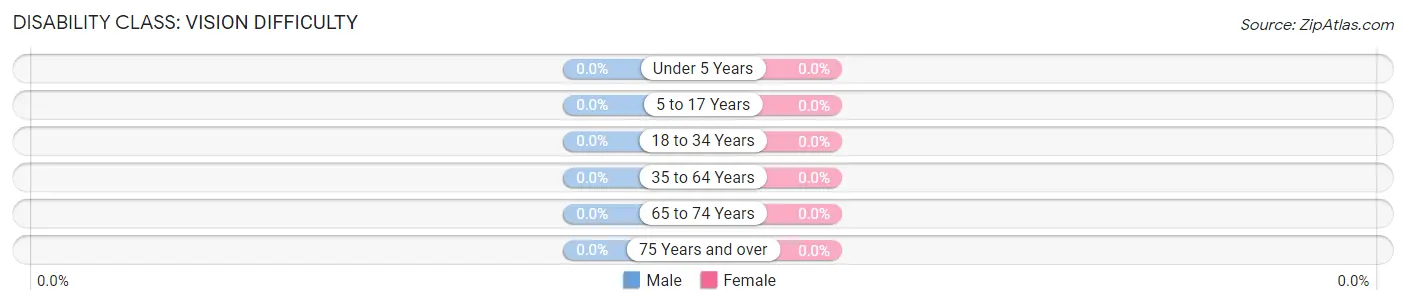
| Age Bracket | Male | Female |
| Under 5 Years | 0 (0.0%) | 0 (0.0%) |
| 5 to 17 Years | 0 (0.0%) | 0 (0.0%) |
| 18 to 34 Years | 0 (0.0%) | 0 (0.0%) |
| 35 to 64 Years | 0 (0.0%) | 0 (0.0%) |
| 65 to 74 Years | 0 (0.0%) | 0 (0.0%) |
| 75 Years and over | 0 (0.0%) | 0 (0.0%) |
Disability Class: Cognitive Difficulty
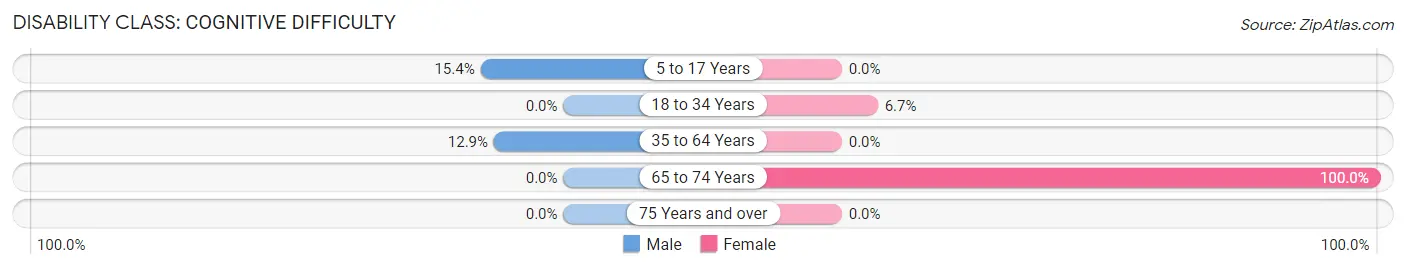
| Age Bracket | Male | Female |
| 5 to 17 Years | 2 (15.4%) | 0 (0.0%) |
| 18 to 34 Years | 0 (0.0%) | 1 (6.7%) |
| 35 to 64 Years | 4 (12.9%) | 0 (0.0%) |
| 65 to 74 Years | 0 (0.0%) | 3 (100.0%) |
| 75 Years and over | 0 (0.0%) | 0 (0.0%) |
Disability Class: Ambulatory Difficulty
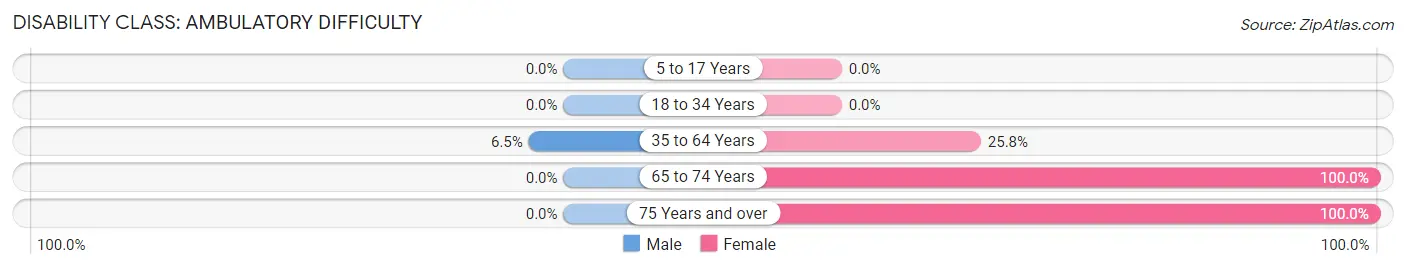
| Age Bracket | Male | Female |
| 5 to 17 Years | 0 (0.0%) | 0 (0.0%) |
| 18 to 34 Years | 0 (0.0%) | 0 (0.0%) |
| 35 to 64 Years | 2 (6.5%) | 8 (25.8%) |
| 65 to 74 Years | 0 (0.0%) | 3 (100.0%) |
| 75 Years and over | 0 (0.0%) | 3 (100.0%) |
Disability Class: Self-Care Difficulty
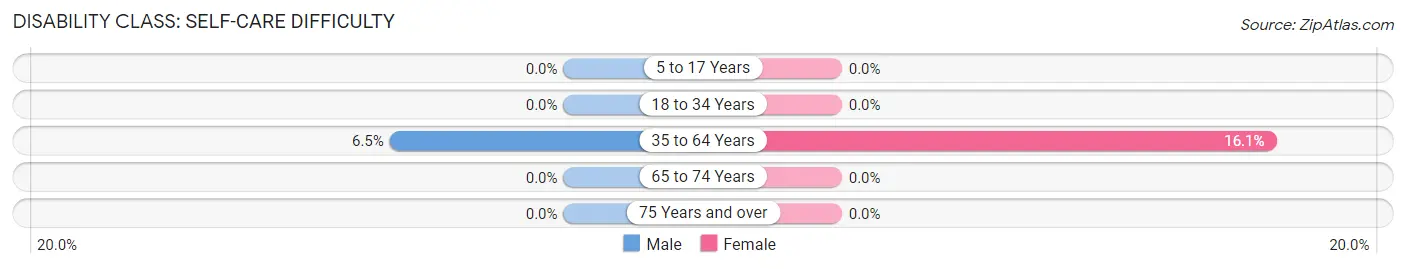
| Age Bracket | Male | Female |
| 5 to 17 Years | 0 (0.0%) | 0 (0.0%) |
| 18 to 34 Years | 0 (0.0%) | 0 (0.0%) |
| 35 to 64 Years | 2 (6.5%) | 5 (16.1%) |
| 65 to 74 Years | 0 (0.0%) | 0 (0.0%) |
| 75 Years and over | 0 (0.0%) | 0 (0.0%) |
Technology Access in Brook Park
Computing Device Access in Brook Park
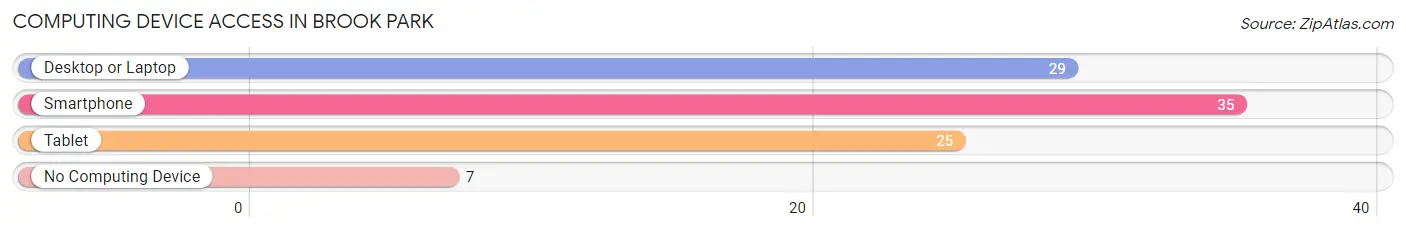
| Device Type | # Households | % Households |
| Desktop or Laptop | 29 | 65.9% |
| Smartphone | 35 | 79.5% |
| Tablet | 25 | 56.8% |
| No Computing Device | 7 | 15.9% |
| Total | 44 | 100.0% |
Internet Access in Brook Park
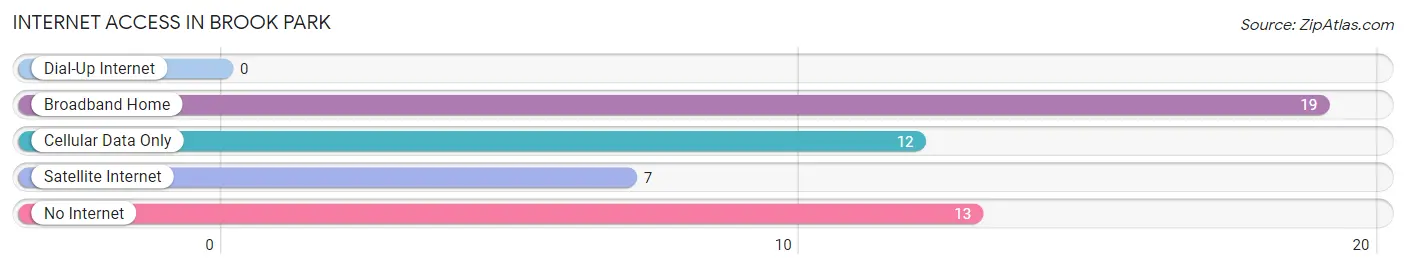
| Internet Type | # Households | % Households |
| Dial-Up Internet | 0 | 0.0% |
| Broadband Home | 19 | 43.2% |
| Cellular Data Only | 12 | 27.3% |
| Satellite Internet | 7 | 15.9% |
| No Internet | 13 | 29.5% |
| Total | 44 | 100.0% |
Brook Park Summary
History
The city of Brook Park, Minnesota is located in the southeastern corner of the state, just south of the Twin Cities metropolitan area. The city was founded in 1856 by a group of settlers from New York and New England. The settlers were attracted to the area by its abundant natural resources, including timber, water, and fertile soil. The city was originally named Brookville, but the name was changed to Brook Park in 1872.
The city grew steadily throughout the late 19th and early 20th centuries, and by the 1950s, it had become a thriving community. The city was home to a variety of businesses, including a sawmill, a flour mill, a creamery, and a brickyard. The city also had a thriving agricultural sector, with dairy farms, poultry farms, and vegetable farms.
In the late 1950s, the city began to experience rapid growth due to the expansion of the Twin Cities metropolitan area. This growth was fueled by the construction of Interstate Highway 35W, which connected the city to the rest of the metropolitan area. The city also experienced a population boom, with the population increasing from 1,000 in 1950 to over 10,000 by the year 2000.
Geography
Brook Park is located in the southeastern corner of Minnesota, just south of the Twin Cities metropolitan area. The city is situated on the banks of the Mississippi River, and is surrounded by rolling hills and wooded areas. The city covers an area of approximately 8.5 square miles, and has a population of 10,000.
The city is located in Hennepin County, and is bordered by the cities of Bloomington, Richfield, and Edina. The city is also close to the cities of Minneapolis and St. Paul, which are located just to the north.
The climate in Brook Park is typical of the Upper Midwest, with cold winters and hot summers. The average temperature in the winter is around 20 degrees Fahrenheit, and the average temperature in the summer is around 75 degrees Fahrenheit.
Economy
The economy of Brook Park is largely based on the service sector, with many businesses providing services to the surrounding communities. The city is home to a variety of retail stores, restaurants, and other businesses. The city also has a thriving medical sector, with several hospitals and medical centers located in the area.
The city is also home to a number of manufacturing companies, including a paper mill, a printing company, and a plastics manufacturer. The city is also home to a number of technology companies, including a software development firm and a computer hardware manufacturer.
Demographics
As of the 2010 census, the population of Brook Park was 10,000. The population is largely white, with approximately 85% of the population identifying as white. The remaining 15% of the population is made up of African Americans, Asians, and other ethnicities.
The median household income in Brook Park is $50,000, and the median home value is $200,000. The city has a low unemployment rate, and the poverty rate is below the national average.
The city is served by the Anoka-Hennepin School District, which is one of the largest school districts in the state. The district serves over 40,000 students, and is home to several high-performing schools. The city is also home to several colleges and universities, including the University of Minnesota and the University of St. Thomas.
Common Questions
What is Per Capita Income in Brook Park?
Per Capita income in Brook Park is $23,839.
What is the Median Family Income in Brook Park?
Median Family Income in Brook Park is $84,063.
What is the Median Household income in Brook Park?
Median Household Income in Brook Park is $71,250.
What is Income or Wage Gap in Brook Park?
Income or Wage Gap in Brook Park is 56.4%.
Women in Brook Park earn 43.6 cents for every dollar earned by a man.
What is Inequality or Gini Index in Brook Park?
Inequality or Gini Index in Brook Park is 0.34.
What is the Total Population of Brook Park?
Total Population of Brook Park is 136.
What is the Total Male Population of Brook Park?
Total Male Population of Brook Park is 64.
What is the Total Female Population of Brook Park?
Total Female Population of Brook Park is 72.
What is the Ratio of Males per 100 Females in Brook Park?
There are 88.89 Males per 100 Females in Brook Park.
What is the Ratio of Females per 100 Males in Brook Park?
There are 112.50 Females per 100 Males in Brook Park.
What is the Median Population Age in Brook Park?
Median Population Age in Brook Park is 36.0 Years.
What is the Average Family Size in Brook Park
Average Family Size in Brook Park is 3.5 People.
What is the Average Household Size in Brook Park
Average Household Size in Brook Park is 3.1 People.
How Large is the Labor Force in Brook Park?
There are 68 People in the Labor Forcein in Brook Park.
What is the Percentage of People in the Labor Force in Brook Park?
61.3% of People are in the Labor Force in Brook Park.
What is the Unemployment Rate in Brook Park?
Unemployment Rate in Brook Park is 1.5%.