Zip Codes with the Highest Percentage of Population with a Degree in Education in Indiana
RELATED REPORTS & OPTIONS
Education
Indiana
Compare Zip Codes
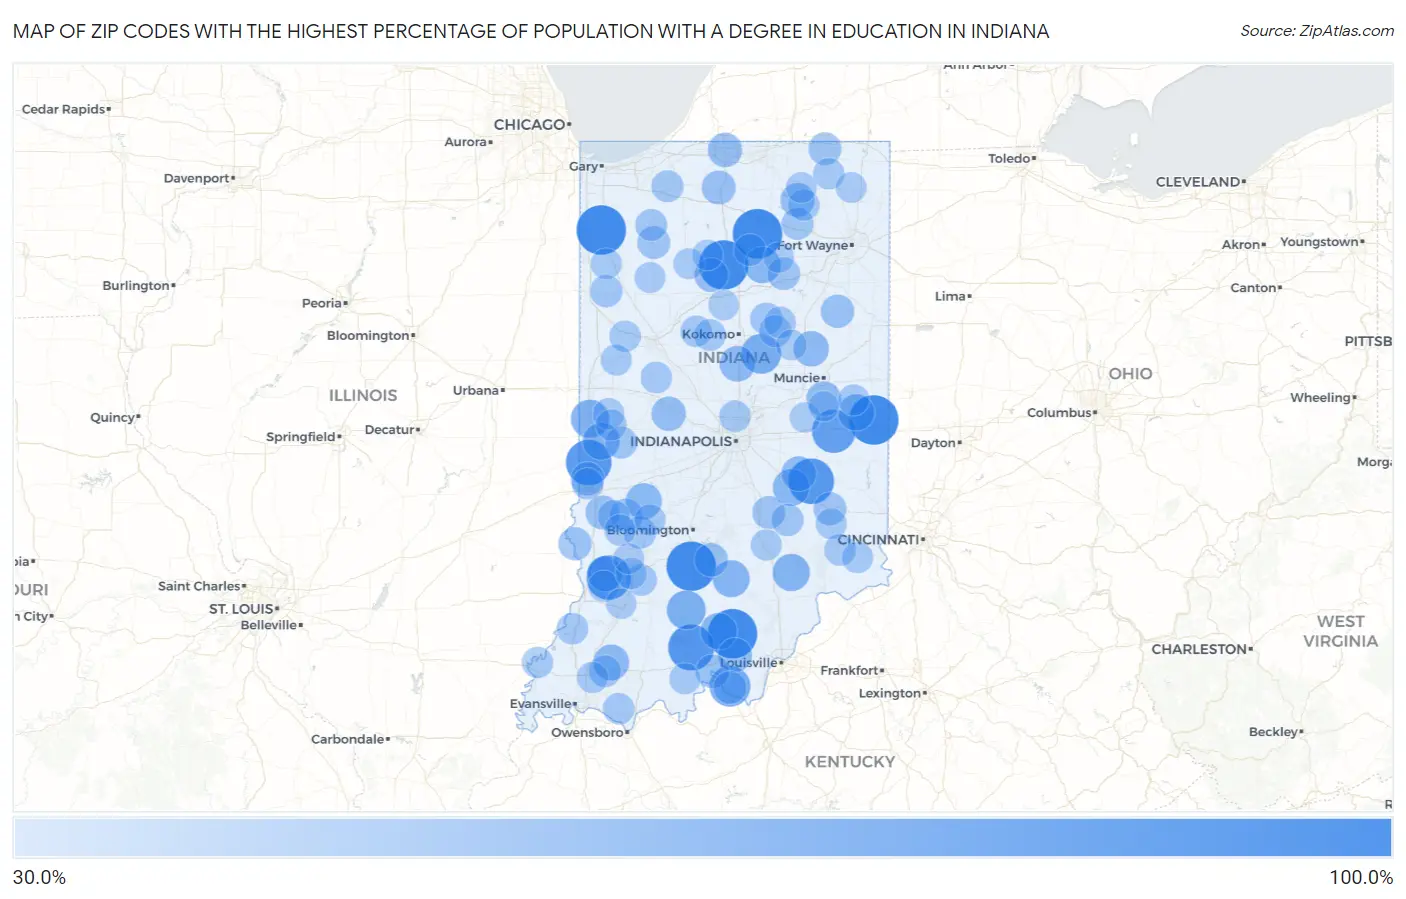
Map of Zip Codes with the Highest Percentage of Population with a Degree in Education in Indiana
30.0%
100.0%
Zip Codes with the Highest Percentage of Population with a Degree in Education in Indiana
| Zip Code | % Graduates | vs State | vs National | |
| 1. | 47120 | 100.0% | 14.8%(+85.2)#1 | 11.1%(+88.9)#37 |
| 2. | 46381 | 100.0% | 14.8%(+85.2)#2 | 11.1%(+88.9)#41 |
| 3. | 46931 | 100.0% | 14.8%(+85.2)#3 | 11.1%(+88.9)#117 |
| 4. | 46508 | 100.0% | 14.8%(+85.2)#4 | 11.1%(+88.9)#148 |
| 5. | 47392 | 100.0% | 14.8%(+85.2)#5 | 11.1%(+88.9)#155 |
| 6. | 47420 | 100.0% | 14.8%(+85.2)#6 | 11.1%(+88.9)#262 |
| 7. | 47175 | 87.1% | 14.8%(+72.3)#7 | 11.1%(+76.0)#340 |
| 8. | 46156 | 85.7% | 14.8%(+71.0)#8 | 11.1%(+74.7)#353 |
| 9. | 47884 | 85.7% | 14.8%(+71.0)#9 | 11.1%(+74.7)#355 |
| 10. | 47528 | 81.8% | 14.8%(+67.1)#10 | 11.1%(+70.8)#377 |
| 11. | 47387 | 78.0% | 14.8%(+63.2)#11 | 11.1%(+66.9)#414 |
| 12. | 47110 | 67.9% | 14.8%(+53.2)#12 | 11.1%(+56.9)#540 |
| 13. | 46076 | 64.5% | 14.8%(+49.8)#13 | 11.1%(+53.4)#622 |
| 14. | 47469 | 61.1% | 14.8%(+46.3)#14 | 11.1%(+50.0)#718 |
| 15. | 47928 | 58.5% | 14.8%(+43.8)#15 | 11.1%(+47.5)#794 |
| 16. | 47227 | 55.2% | 14.8%(+40.5)#16 | 11.1%(+44.2)#910 |
| 17. | 47862 | 54.7% | 14.8%(+39.9)#17 | 11.1%(+43.6)#933 |
| 18. | 47260 | 54.4% | 14.8%(+39.6)#18 | 11.1%(+43.3)#950 |
| 19. | 46182 | 53.8% | 14.8%(+39.0)#19 | 11.1%(+42.7)#974 |
| 20. | 47125 | 52.8% | 14.8%(+38.0)#20 | 11.1%(+41.7)#1,021 |
| 21. | 46974 | 52.7% | 14.8%(+38.0)#21 | 11.1%(+41.7)#1,023 |
| 22. | 47339 | 52.6% | 14.8%(+37.9)#22 | 11.1%(+41.6)#1,028 |
| 23. | 47833 | 51.5% | 14.8%(+36.8)#23 | 11.1%(+40.5)#1,075 |
| 24. | 46045 | 50.0% | 14.8%(+35.2)#24 | 11.1%(+38.9)#1,209 |
| 25. | 47584 | 50.0% | 14.8%(+35.2)#25 | 11.1%(+38.9)#1,217 |
| 26. | 47535 | 48.9% | 14.8%(+34.2)#26 | 11.1%(+37.9)#1,283 |
| 27. | 46957 | 48.4% | 14.8%(+33.6)#27 | 11.1%(+37.3)#1,313 |
| 28. | 46150 | 46.9% | 14.8%(+32.1)#28 | 11.1%(+35.8)#1,400 |
| 29. | 47386 | 46.6% | 14.8%(+31.8)#29 | 11.1%(+35.5)#1,425 |
| 30. | 47968 | 45.2% | 14.8%(+30.5)#30 | 11.1%(+34.2)#1,544 |
| 31. | 46624 | 45.0% | 14.8%(+30.2)#31 | 11.1%(+33.9)#1,571 |
| 32. | 47166 | 44.6% | 14.8%(+29.9)#32 | 11.1%(+33.6)#1,596 |
| 33. | 46732 | 44.4% | 14.8%(+29.6)#33 | 11.1%(+33.3)#1,631 |
| 34. | 46950 | 44.0% | 14.8%(+29.2)#34 | 11.1%(+32.9)#1,667 |
| 35. | 47866 | 43.6% | 14.8%(+28.8)#35 | 11.1%(+32.5)#1,700 |
| 36. | 46537 | 43.2% | 14.8%(+28.5)#36 | 11.1%(+32.2)#1,733 |
| 37. | 47137 | 42.5% | 14.8%(+27.7)#37 | 11.1%(+31.4)#1,818 |
| 38. | 47436 | 41.9% | 14.8%(+27.1)#38 | 11.1%(+30.8)#1,878 |
| 39. | 47876 | 41.9% | 14.8%(+27.1)#39 | 11.1%(+30.8)#1,884 |
| 40. | 46781 | 41.8% | 14.8%(+27.1)#40 | 11.1%(+30.8)#1,889 |
| 41. | 47861 | 41.0% | 14.8%(+26.3)#41 | 11.1%(+30.0)#1,993 |
| 42. | 47841 | 40.1% | 14.8%(+25.3)#42 | 11.1%(+29.0)#2,119 |
| 43. | 47957 | 40.0% | 14.8%(+25.2)#43 | 11.1%(+28.9)#2,121 |
| 44. | 47226 | 40.0% | 14.8%(+25.2)#44 | 11.1%(+28.9)#2,154 |
| 45. | 47263 | 40.0% | 14.8%(+25.2)#45 | 11.1%(+28.9)#2,158 |
| 46. | 46746 | 39.7% | 14.8%(+24.9)#46 | 11.1%(+28.6)#2,207 |
| 47. | 47142 | 39.6% | 14.8%(+24.8)#47 | 11.1%(+28.5)#2,221 |
| 48. | 46990 | 38.8% | 14.8%(+24.1)#48 | 11.1%(+27.7)#2,346 |
| 49. | 47471 | 38.5% | 14.8%(+23.8)#49 | 11.1%(+27.5)#2,380 |
| 50. | 47244 | 37.8% | 14.8%(+23.1)#50 | 11.1%(+26.7)#2,517 |
| 51. | 47948 | 37.5% | 14.8%(+22.7)#51 | 11.1%(+26.4)#2,556 |
| 52. | 46919 | 37.4% | 14.8%(+22.6)#52 | 11.1%(+26.3)#2,596 |
| 53. | 47872 | 37.2% | 14.8%(+22.5)#53 | 11.1%(+26.2)#2,619 |
| 54. | 47858 | 37.2% | 14.8%(+22.5)#54 | 11.1%(+26.2)#2,627 |
| 55. | 46986 | 37.1% | 14.8%(+22.3)#55 | 11.1%(+26.0)#2,657 |
| 56. | 46764 | 36.9% | 14.8%(+22.2)#56 | 11.1%(+25.9)#2,674 |
| 57. | 46910 | 36.8% | 14.8%(+22.1)#57 | 11.1%(+25.8)#2,699 |
| 58. | 46382 | 36.4% | 14.8%(+21.7)#58 | 11.1%(+25.4)#2,746 |
| 59. | 46374 | 36.4% | 14.8%(+21.6)#59 | 11.1%(+25.3)#2,760 |
| 60. | 47619 | 36.1% | 14.8%(+21.3)#60 | 11.1%(+25.0)#2,805 |
| 61. | 46915 | 35.8% | 14.8%(+21.1)#61 | 11.1%(+24.8)#2,856 |
| 62. | 46987 | 35.7% | 14.8%(+20.9)#62 | 11.1%(+24.6)#2,895 |
| 63. | 46290 | 35.6% | 14.8%(+20.8)#63 | 11.1%(+24.5)#2,909 |
| 64. | 46913 | 35.3% | 14.8%(+20.6)#64 | 11.1%(+24.3)#2,951 |
| 65. | 47955 | 35.2% | 14.8%(+20.4)#65 | 11.1%(+24.1)#2,982 |
| 66. | 47524 | 35.0% | 14.8%(+20.2)#66 | 11.1%(+23.9)#3,012 |
| 67. | 47562 | 35.0% | 14.8%(+20.2)#67 | 11.1%(+23.9)#3,024 |
| 68. | 46760 | 34.9% | 14.8%(+20.1)#68 | 11.1%(+23.8)#3,049 |
| 69. | 47885 | 34.8% | 14.8%(+20.0)#69 | 11.1%(+23.7)#3,086 |
| 70. | 47042 | 34.7% | 14.8%(+20.0)#70 | 11.1%(+23.7)#3,091 |
| 71. | 47634 | 34.7% | 14.8%(+20.0)#71 | 11.1%(+23.7)#3,098 |
| 72. | 47438 | 34.6% | 14.8%(+19.9)#72 | 11.1%(+23.6)#3,113 |
| 73. | 46795 | 34.2% | 14.8%(+19.4)#73 | 11.1%(+23.1)#3,223 |
| 74. | 47512 | 34.1% | 14.8%(+19.4)#74 | 11.1%(+23.1)#3,236 |
| 75. | 47952 | 34.1% | 14.8%(+19.4)#75 | 11.1%(+23.0)#3,245 |
| 76. | 47970 | 34.0% | 14.8%(+19.3)#76 | 11.1%(+22.9)#3,268 |
| 77. | 47514 | 33.9% | 14.8%(+19.1)#77 | 11.1%(+22.8)#3,302 |
| 78. | 47018 | 33.9% | 14.8%(+19.1)#78 | 11.1%(+22.8)#3,303 |
| 79. | 47358 | 33.8% | 14.8%(+19.0)#79 | 11.1%(+22.7)#3,327 |
| 80. | 47613 | 33.7% | 14.8%(+19.0)#80 | 11.1%(+22.7)#3,343 |
| 81. | 47616 | 33.7% | 14.8%(+18.9)#81 | 11.1%(+22.6)#3,350 |
| 82. | 47832 | 33.6% | 14.8%(+18.9)#82 | 11.1%(+22.6)#3,364 |
| 83. | 47431 | 33.6% | 14.8%(+18.8)#83 | 11.1%(+22.5)#3,369 |
| 84. | 47918 | 33.6% | 14.8%(+18.8)#84 | 11.1%(+22.5)#3,370 |
| 85. | 47529 | 33.6% | 14.8%(+18.8)#85 | 11.1%(+22.5)#3,372 |
| 86. | 47247 | 33.3% | 14.8%(+18.6)#86 | 11.1%(+22.3)#3,480 |
| 87. | 47034 | 33.3% | 14.8%(+18.6)#87 | 11.1%(+22.3)#3,483 |
| 88. | 47964 | 33.3% | 14.8%(+18.6)#88 | 11.1%(+22.3)#3,499 |
| 89. | 47443 | 32.7% | 14.8%(+17.9)#89 | 11.1%(+21.6)#3,641 |
| 90. | 46985 | 32.4% | 14.8%(+17.7)#90 | 11.1%(+21.3)#3,707 |
| 91. | 47959 | 32.4% | 14.8%(+17.6)#91 | 11.1%(+21.3)#3,716 |
| 92. | 46939 | 32.2% | 14.8%(+17.4)#92 | 11.1%(+21.1)#3,769 |
| 93. | 46730 | 32.1% | 14.8%(+17.3)#93 | 11.1%(+21.0)#3,807 |
| 94. | 46767 | 32.1% | 14.8%(+17.3)#94 | 11.1%(+21.0)#3,810 |
| 95. | 46928 | 31.8% | 14.8%(+17.0)#95 | 11.1%(+20.7)#3,894 |
| 96. | 46962 | 31.5% | 14.8%(+16.7)#96 | 11.1%(+20.4)#3,977 |
| 97. | 47384 | 31.4% | 14.8%(+16.6)#97 | 11.1%(+20.3)#4,012 |
| 98. | 46994 | 31.3% | 14.8%(+16.6)#98 | 11.1%(+20.3)#4,025 |
| 99. | 47501 | 31.3% | 14.8%(+16.5)#99 | 11.1%(+20.2)#4,042 |
| 100. | 47361 | 31.0% | 14.8%(+16.3)#100 | 11.1%(+20.0)#4,112 |
Common Questions
What are the Top 10 Zip Codes with the Highest Percentage of Population with a Degree in Education in Indiana?
Top 10 Zip Codes with the Highest Percentage of Population with a Degree in Education in Indiana are:
What zip code has the Highest Percentage of Population with a Degree in Education in Indiana?
47120 has the Highest Percentage of Population with a Degree in Education in Indiana with 100.0%.
What is the Percentage of Population with a Degree in Education in the State of Indiana?
Percentage of Population with a Degree in Education in Indiana is 14.8%.
What is the Percentage of Population with a Degree in Education in the United States?
Percentage of Population with a Degree in Education in the United States is 11.1%.