Zip Codes with the Highest Percentage of Population with a Degree in Education in South Bend, IN

RELATED REPORTS & OPTIONS

Education
Population
Families and Households
Female Fertility
Female Fertility (Unmarried)
Race (Community Size)
Race (Percentage)
Ancestry (Community Size)
AfricanAmericanApacheArabArgentineanArmenianAustrianBelgianBhutaneseBlackfeetBrazilianBritishBurmeseCajunCanadianCentral AmericanCentral American IndianCherokeeChileanChippewaChoctawColombianCosta RicanCroatianCubanCzechCzechoslovakianDanishDominicanDutchEastern EuropeanEcuadorianEnglishEuropeanFinnishFrenchFrench CanadianGermanGhanaianGreekGuatemalanHaitianHonduranHungarianIndian (Asian)IndonesianIraqiIrishIroquoisItalianJamaicanJapaneseKenyanKoreanLaotianLebaneseLithuanianLuxembourgerMalteseMexicanMexican American IndianMoroccanNative HawaiianNavajoNigerianNorthern EuropeanNorwegianPakistaniPalestinianParaguayanPennsylvania GermanPeruvianPolishPortuguesePotawatomiPuerto RicanRomanianRussianSalvadoranScandinavianScotch-IrishScottishSerbianSiouxSlavicSlovakSloveneSouth AfricanSouth AmericanSpaniardSpanishSri LankanSubsaharan AfricanSwedishSwissThaiUkrainianUruguayanVenezuelanVietnameseWelshYugoslavian
Ancestry (Percentage)
AfricanAmericanApacheArabArgentineanArmenianAustrianBelgianBhutaneseBlackfeetBrazilianBritishBurmeseCajunCanadianCentral AmericanCentral American IndianCherokeeChileanChippewaChoctawColombianCosta RicanCroatianCubanCzechCzechoslovakianDanishDominicanDutchEastern EuropeanEcuadorianEnglishEuropeanFinnishFrenchFrench CanadianGermanGhanaianGreekGuatemalanHaitianHonduranHungarianIndian (Asian)IndonesianIraqiIrishIroquoisItalianJamaicanJapaneseKenyanKoreanLaotianLebaneseLithuanianLuxembourgerMalteseMexicanMexican American IndianMoroccanNative HawaiianNavajoNigerianNorthern EuropeanNorwegianPakistaniPalestinianParaguayanPennsylvania GermanPeruvianPolishPortuguesePotawatomiPuerto RicanRomanianRussianSalvadoranScandinavianScotch-IrishScottishSerbianSiouxSlavicSlovakSloveneSouth AfricanSouth AmericanSpaniardSpanishSri LankanSubsaharan AfricanSwedishSwissThaiUkrainianUruguayanVenezuelanVietnameseWelshYugoslavian
Immigrant Origin (Total)
Immigrant Origin (Percentage)
Income
Income (Families)
Income (Households)
Poverty
Poverty (Families)
Unemployment
Employment Occupations
Employment Industries
Employer Class
Commute Time
Commute Means
School Enrollment
Education by Degree Field
Occupancy
Finances
Physical Characteristics
South Bend
Compare Zip Codes
Comparison Subject

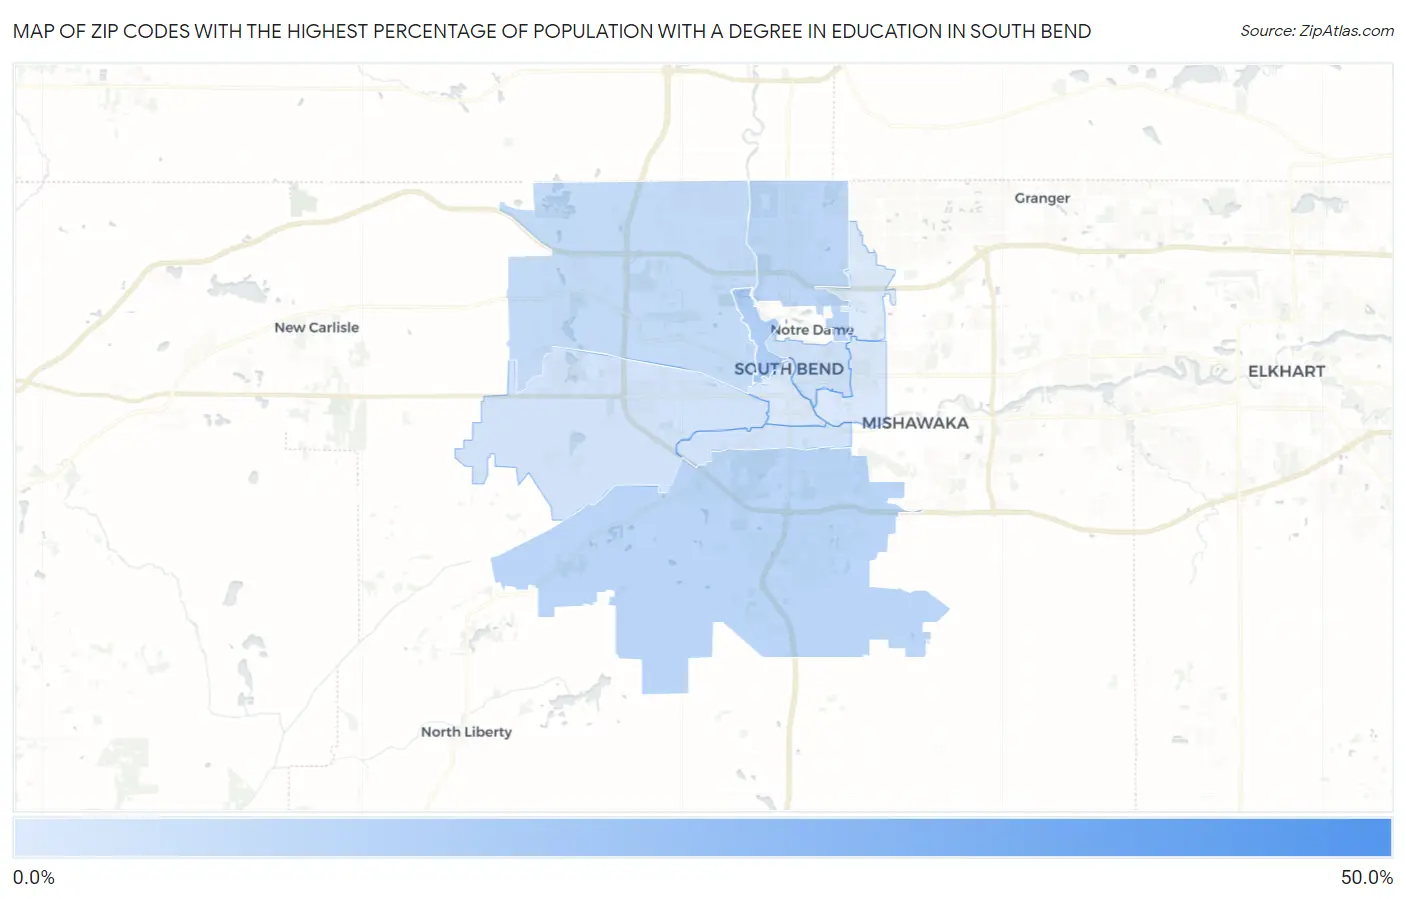
Map of Zip Codes with the Highest Percentage of Population with a Degree in Education in South Bend

0.0%
50.0%
Zip Codes with the Highest Percentage of Population with a Degree in Education in South Bend Map

Zip Codes with the Highest Percentage of Population with a Degree in Education in South Bend, IN

Zip Code % Graduates vs State vs National
1.4662445.0%14.8%(+30.2)#3111.1%(+33.9)#1,571
2.4661619.1%14.8%(+4.34)#30411.1%(+8.04)#11,325
3.4661416.4%14.8%(+1.63)#38711.1%(+5.32)#14,118
4.4663715.9%14.8%(+1.13)#40311.1%(+4.83)#14,632
5.4662814.4%14.8%(-0.356)#45811.1%(+3.34)#16,461
6.4661712.1%14.8%(-2.68)#52511.1%(+1.02)#19,507
7.4661311.6%14.8%(-3.16)#53711.1%(+0.539)#20,159
8.4661911.5%14.8%(-3.23)#53911.1%(+0.470)#20,254
9.466159.8%14.8%(-4.91)#58311.1%(-1.22)#22,575
10.466019.7%14.8%(-5.10)#59011.1%(-1.40)#22,794
11.466359.2%14.8%(-5.54)#60111.1%(-1.85)#23,406

Common Questions

What are the Top 10 Zip Codes with the Highest Percentage of Population with a Degree in Education in South Bend, IN?
Top 10 Zip Codes with the Highest Percentage of Population with a Degree in Education in South Bend, IN are:
#1
45.0%
#2
19.1%
#3
16.4%
#4
15.9%
#5
14.4%
#6
12.1%
#7
11.6%
#8
11.5%
#9
9.8%
#10
9.7%
What zip code has the Highest Percentage of Population with a Degree in Education in South Bend, IN?
46624 has the Highest Percentage of Population with a Degree in Education in South Bend, IN with 45.0%.
What is the Percentage of Population with a Degree in Education in South Bend, IN?
Percentage of Population with a Degree in Education in South Bend is 12.3%.
What is the Percentage of Population with a Degree in Education in Indiana?
Percentage of Population with a Degree in Education in Indiana is 14.8%.
What is the Percentage of Population with a Degree in Education in the United States?
Percentage of Population with a Degree in Education in the United States is 11.1%.