Muncie, IN Map & Demographics
Muncie Map
Muncie Overview
$23,415
PER CAPITA INCOME
$55,415
AVG FAMILY INCOME
$40,309
AVG HOUSEHOLD INCOME
33.6%
WAGE / INCOME GAP [ % ]
66.4¢/ $1
WAGE / INCOME GAP [ $ ]
$10,393
FAMILY INCOME DEFICIT
0.46
INEQUALITY / GINI INDEX
65,167
TOTAL POPULATION
30,577
MALE POPULATION
34,590
FEMALE POPULATION
88.40
MALES / 100 FEMALES
113.12
FEMALES / 100 MALES
29.0
MEDIAN AGE
2.8
AVG FAMILY SIZE
2.2
AVG HOUSEHOLD SIZE
32,709
LABOR FORCE [ PEOPLE ]
58.2%
PERCENT IN LABOR FORCE
8.2%
UNEMPLOYMENT RATE
Muncie Area Codes
Income in Muncie
Income Overview in Muncie
Per Capita Income in Muncie is $23,415, while median incomes of families and households are $55,415 and $40,309 respectively.
| Characteristic | Number | Measure |
| Per Capita Income | 65,167 | $23,415 |
| Median Family Income | 12,993 | $55,415 |
| Mean Family Income | 12,993 | $68,362 |
| Median Household Income | 26,625 | $40,309 |
| Mean Household Income | 26,625 | $55,010 |
| Income Deficit | 12,993 | $10,393 |
| Wage / Income Gap (%) | 65,167 | 33.60% |
| Wage / Income Gap ($) | 65,167 | 66.40¢ per $1 |
| Gini / Inequality Index | 65,167 | 0.46 |
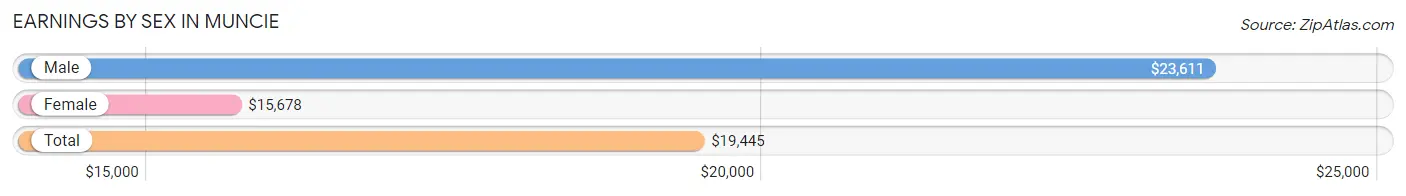
Earnings by Sex in Muncie
Average Earnings in Muncie are $19,445, $23,611 for men and $15,678 for women, a difference of 33.6%.
| Sex | Number | Average Earnings |
| Male | 18,288 (48.4%) | $23,611 |
| Female | 19,487 (51.6%) | $15,678 |
| Total | 37,775 (100.0%) | $19,445 |
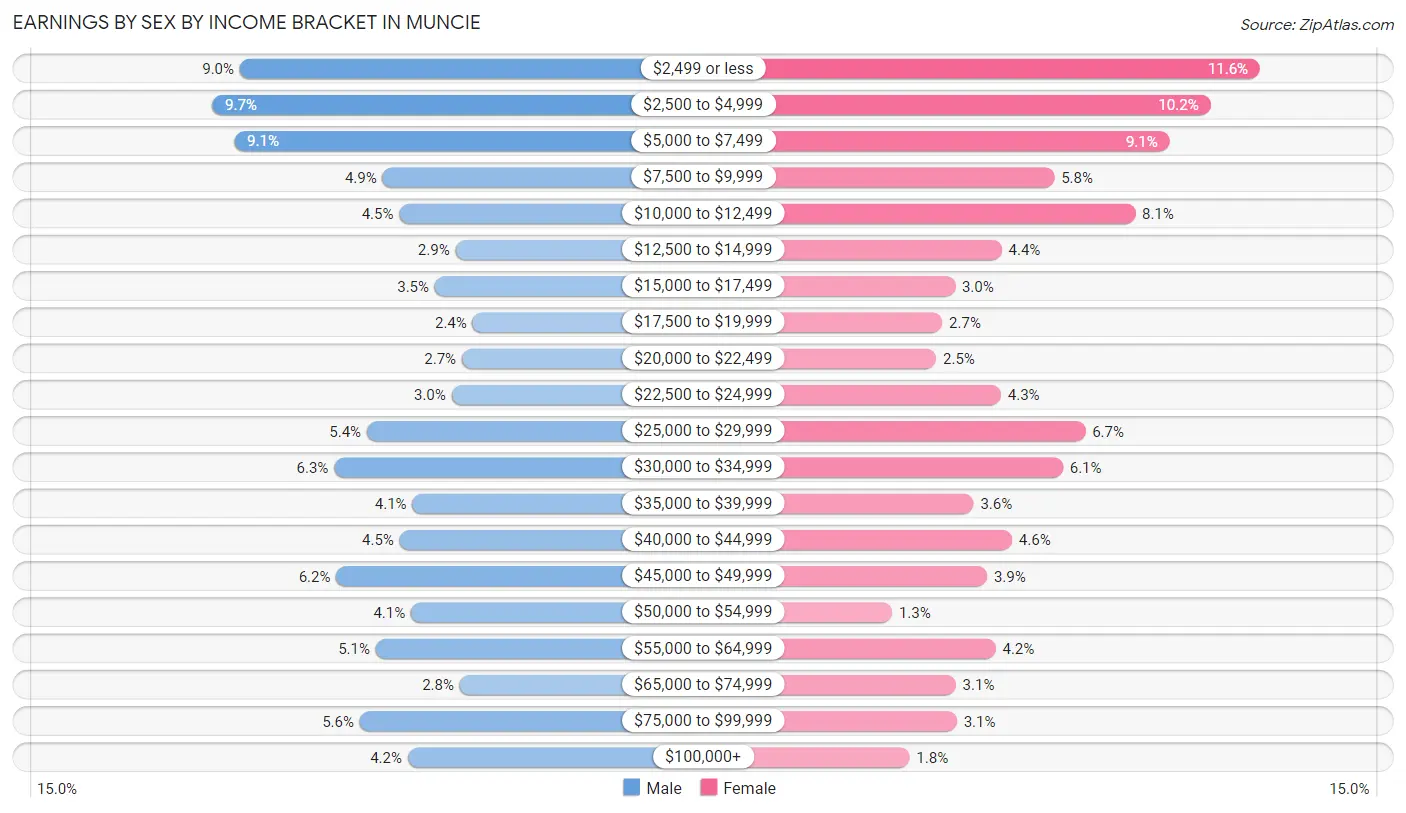
Earnings by Sex by Income Bracket in Muncie
The most common earnings brackets in Muncie are $2,500 to $4,999 for men (1,779 | 9.7%) and $2,499 or less for women (2,262 | 11.6%).
| Income | Male | Female |
| $2,499 or less | 1,636 (8.9%) | 2,262 (11.6%) |
| $2,500 to $4,999 | 1,779 (9.7%) | 1,991 (10.2%) |
| $5,000 to $7,499 | 1,666 (9.1%) | 1,767 (9.1%) |
| $7,500 to $9,999 | 903 (4.9%) | 1,137 (5.8%) |
| $10,000 to $12,499 | 817 (4.5%) | 1,579 (8.1%) |
| $12,500 to $14,999 | 528 (2.9%) | 847 (4.3%) |
| $15,000 to $17,499 | 635 (3.5%) | 592 (3.0%) |
| $17,500 to $19,999 | 440 (2.4%) | 522 (2.7%) |
| $20,000 to $22,499 | 496 (2.7%) | 489 (2.5%) |
| $22,500 to $24,999 | 549 (3.0%) | 843 (4.3%) |
| $25,000 to $29,999 | 984 (5.4%) | 1,306 (6.7%) |
| $30,000 to $34,999 | 1,152 (6.3%) | 1,183 (6.1%) |
| $35,000 to $39,999 | 750 (4.1%) | 693 (3.6%) |
| $40,000 to $44,999 | 816 (4.5%) | 905 (4.6%) |
| $45,000 to $49,999 | 1,142 (6.2%) | 768 (3.9%) |
| $50,000 to $54,999 | 757 (4.1%) | 247 (1.3%) |
| $55,000 to $64,999 | 938 (5.1%) | 815 (4.2%) |
| $65,000 to $74,999 | 506 (2.8%) | 596 (3.1%) |
| $75,000 to $99,999 | 1,021 (5.6%) | 602 (3.1%) |
| $100,000+ | 773 (4.2%) | 343 (1.8%) |
| Total | 18,288 (100.0%) | 19,487 (100.0%) |
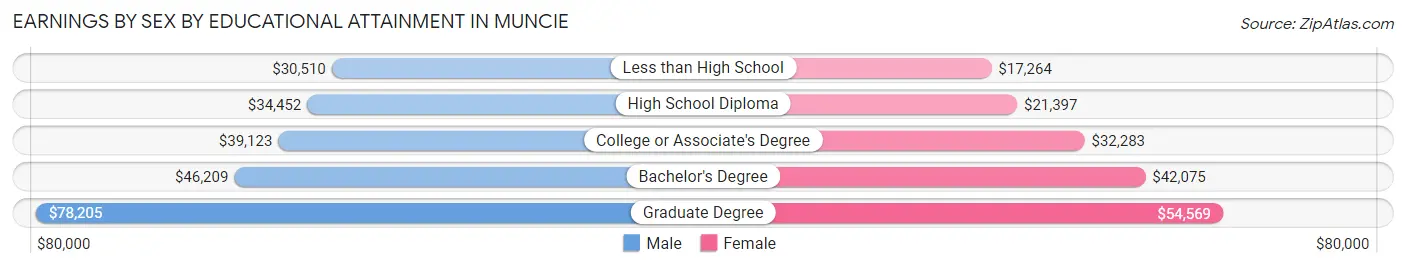
Earnings by Sex by Educational Attainment in Muncie
Average earnings in Muncie are $40,806 for men and $31,586 for women, a difference of 22.6%. Men with an educational attainment of graduate degree enjoy the highest average annual earnings of $78,205, while those with less than high school education earn the least with $30,510. Women with an educational attainment of graduate degree earn the most with the average annual earnings of $54,569, while those with less than high school education have the smallest earnings of $17,264.
| Educational Attainment | Male Income | Female Income |
| Less than High School | $30,510 | $17,264 |
| High School Diploma | $34,452 | $21,397 |
| College or Associate's Degree | $39,123 | $32,283 |
| Bachelor's Degree | $46,209 | $42,075 |
| Graduate Degree | $78,205 | $54,569 |
| Total | $40,806 | $31,586 |
Family Income in Muncie
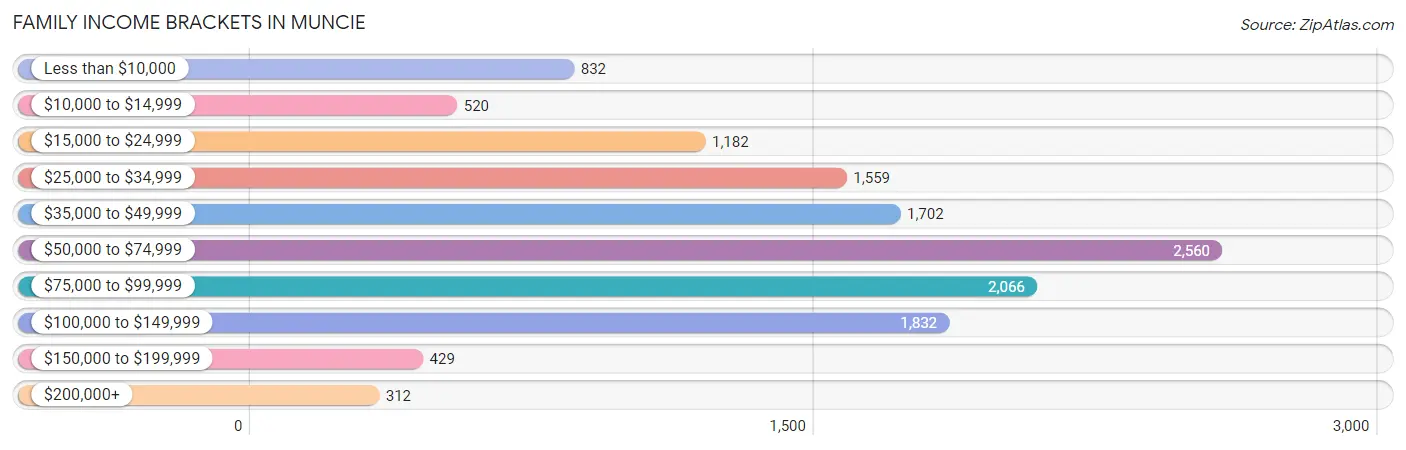
Family Income Brackets in Muncie
According to the Muncie family income data, there are 2,560 families falling into the $50,000 to $74,999 income range, which is the most common income bracket and makes up 19.7% of all families. Conversely, the $200,000+ income bracket is the least frequent group with only 312 families (2.4%) belonging to this category.
| Income Bracket | # Families | % Families |
| Less than $10,000 | 832 | 6.4% |
| $10,000 to $14,999 | 520 | 4.0% |
| $15,000 to $24,999 | 1,182 | 9.1% |
| $25,000 to $34,999 | 1,559 | 12.0% |
| $35,000 to $49,999 | 1,702 | 13.1% |
| $50,000 to $74,999 | 2,560 | 19.7% |
| $75,000 to $99,999 | 2,066 | 15.9% |
| $100,000 to $149,999 | 1,832 | 14.1% |
| $150,000 to $199,999 | 429 | 3.3% |
| $200,000+ | 312 | 2.4% |
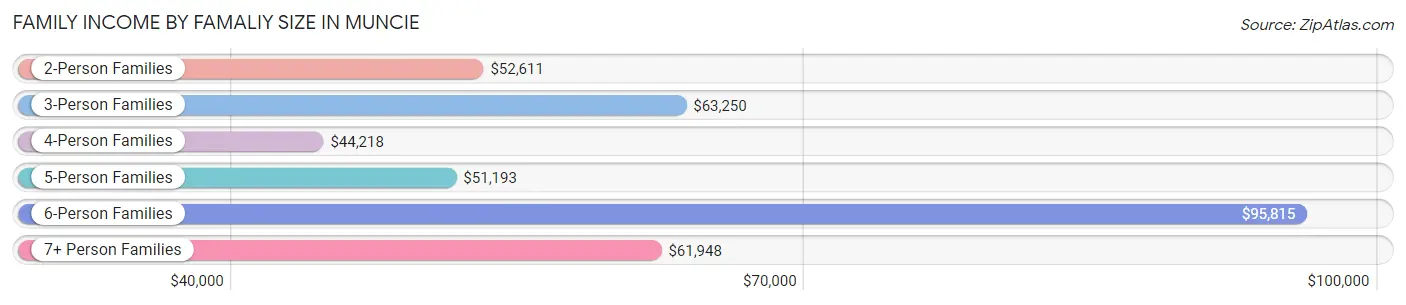
Family Income by Famaliy Size in Muncie
6-person families (357 | 2.8%) account for the highest median family income in Muncie with $95,815 per family, while 2-person families (6,876 | 52.9%) have the highest median income of $26,306 per family member.
| Income Bracket | # Families | Median Income |
| 2-Person Families | 6,876 (52.9%) | $52,611 |
| 3-Person Families | 3,329 (25.6%) | $63,250 |
| 4-Person Families | 1,377 (10.6%) | $44,218 |
| 5-Person Families | 971 (7.5%) | $51,193 |
| 6-Person Families | 357 (2.8%) | $95,815 |
| 7+ Person Families | 83 (0.6%) | $61,948 |
| Total | 12,993 (100.0%) | $55,415 |
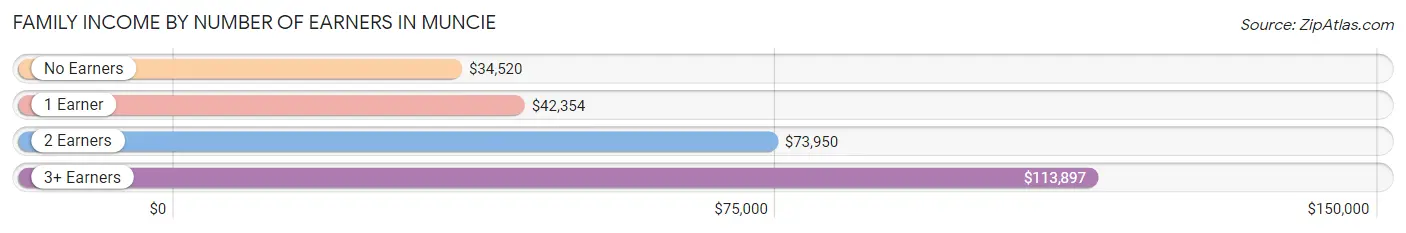
Family Income by Number of Earners in Muncie
The median family income in Muncie is $55,415, with families comprising 3+ earners (1,046) having the highest median family income of $113,897, while families with no earners (2,480) have the lowest median family income of $34,520, accounting for 8.1% and 19.1% of families, respectively.
| Number of Earners | # Families | Median Income |
| No Earners | 2,480 (19.1%) | $34,520 |
| 1 Earner | 5,017 (38.6%) | $42,354 |
| 2 Earners | 4,450 (34.3%) | $73,950 |
| 3+ Earners | 1,046 (8.1%) | $113,897 |
| Total | 12,993 (100.0%) | $55,415 |
Household Income in Muncie
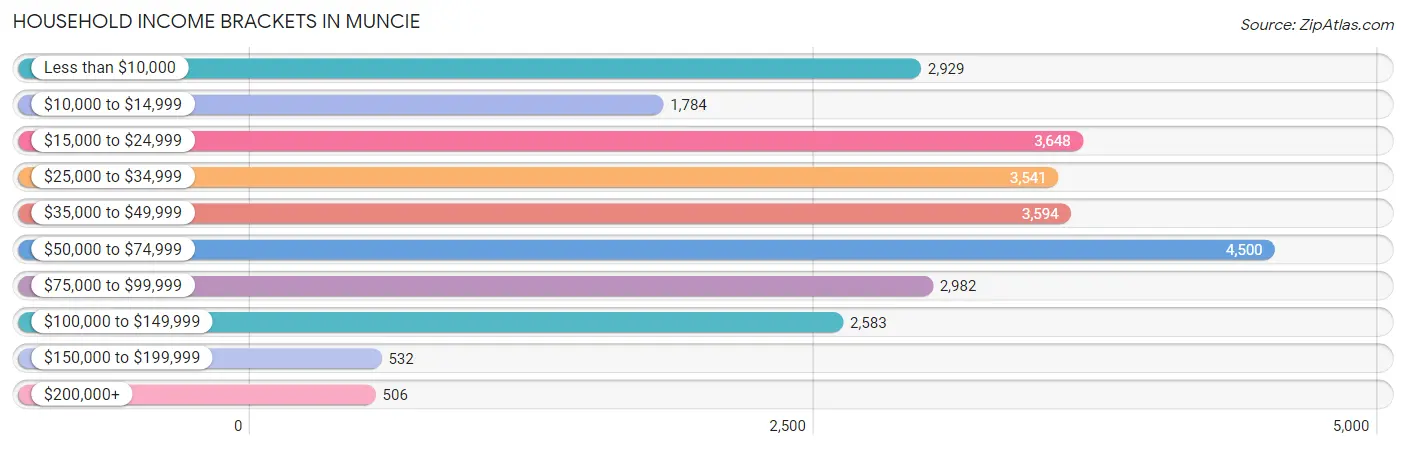
Household Income Brackets in Muncie
With 4,500 households falling in the category, the $50,000 to $74,999 income range is the most frequent in Muncie, accounting for 16.9% of all households. In contrast, only 506 households (1.9%) fall into the $200,000+ income bracket, making it the least populous group.
| Income Bracket | # Households | % Households |
| Less than $10,000 | 2,929 | 11.0% |
| $10,000 to $14,999 | 1,784 | 6.7% |
| $15,000 to $24,999 | 3,648 | 13.7% |
| $25,000 to $34,999 | 3,541 | 13.3% |
| $35,000 to $49,999 | 3,594 | 13.5% |
| $50,000 to $74,999 | 4,500 | 16.9% |
| $75,000 to $99,999 | 2,982 | 11.2% |
| $100,000 to $149,999 | 2,583 | 9.7% |
| $150,000 to $199,999 | 532 | 2.0% |
| $200,000+ | 506 | 1.9% |
Household Income by Householder Age in Muncie
The median household income in Muncie is $40,309, with the highest median household income of $51,865 found in the 45 to 64 years age bracket for the primary householder. A total of 7,984 households (30.0%) fall into this category. Meanwhile, the 15 to 24 years age bracket for the primary householder has the lowest median household income of $23,696, with 4,719 households (17.7%) in this group.
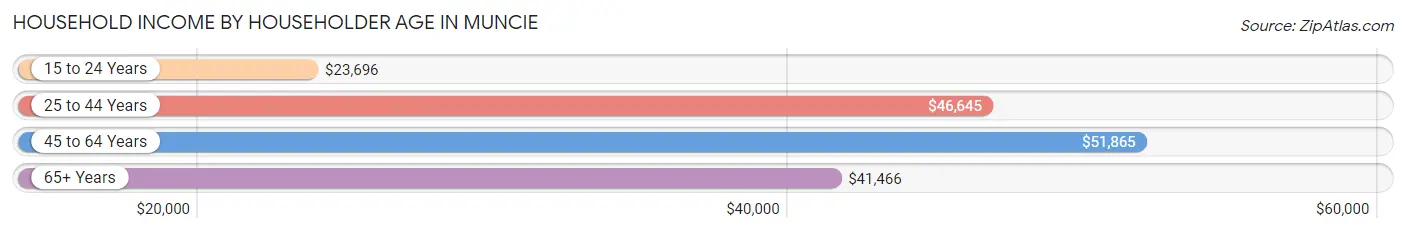
| Income Bracket | # Households | Median Income |
| 15 to 24 Years | 4,719 (17.7%) | $23,696 |
| 25 to 44 Years | 7,882 (29.6%) | $46,645 |
| 45 to 64 Years | 7,984 (30.0%) | $51,865 |
| 65+ Years | 6,040 (22.7%) | $41,466 |
| Total | 26,625 (100.0%) | $40,309 |
Poverty in Muncie
Income Below Poverty by Sex and Age in Muncie
With 28.9% poverty level for males and 31.8% for females among the residents of Muncie, 18 to 24 year old males and 18 to 24 year old females are the most vulnerable to poverty, with 3,671 males (57.8%) and 4,173 females (60.5%) in their respective age groups living below the poverty level.
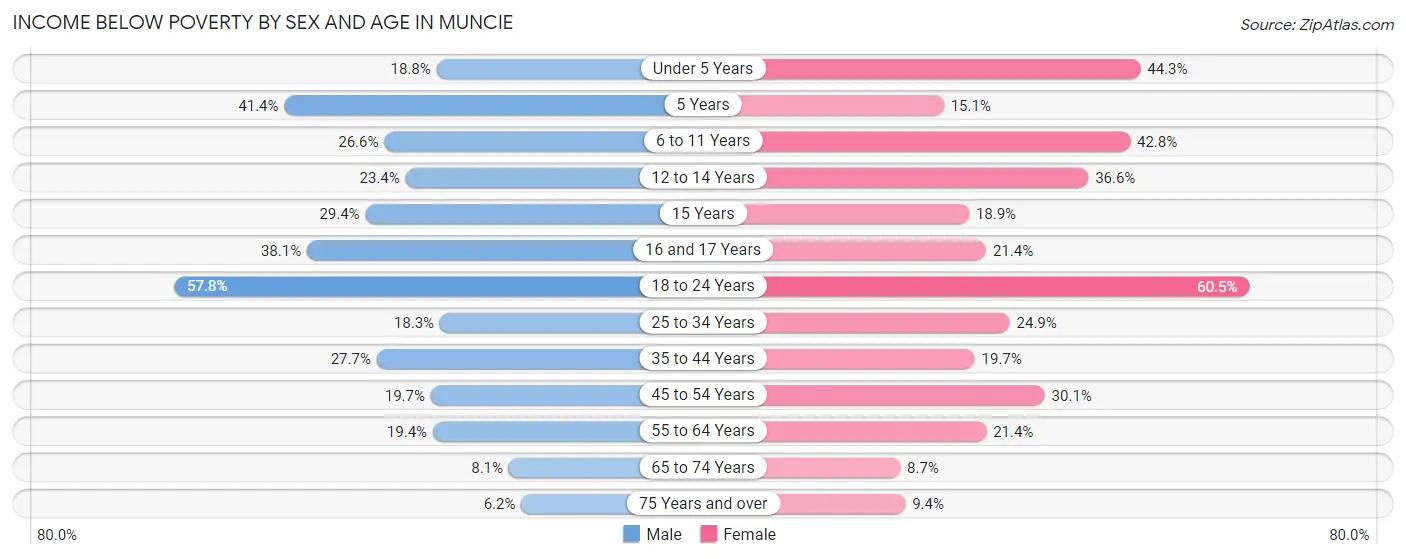
| Age Bracket | Male | Female |
| Under 5 Years | 283 (18.8%) | 621 (44.3%) |
| 5 Years | 145 (41.4%) | 46 (15.1%) |
| 6 to 11 Years | 426 (26.6%) | 722 (42.8%) |
| 12 to 14 Years | 171 (23.4%) | 240 (36.6%) |
| 15 Years | 87 (29.4%) | 54 (18.9%) |
| 16 and 17 Years | 233 (38.1%) | 143 (21.4%) |
| 18 to 24 Years | 3,671 (57.8%) | 4,173 (60.5%) |
| 25 to 34 Years | 719 (18.3%) | 996 (24.9%) |
| 35 to 44 Years | 824 (27.7%) | 624 (19.7%) |
| 45 to 54 Years | 551 (19.7%) | 988 (30.1%) |
| 55 to 64 Years | 641 (19.4%) | 710 (21.4%) |
| 65 to 74 Years | 161 (8.1%) | 254 (8.7%) |
| 75 Years and over | 76 (6.2%) | 200 (9.4%) |
| Total | 7,988 (28.9%) | 9,771 (31.8%) |
Income Above Poverty by Sex and Age in Muncie
According to the poverty statistics in Muncie, males aged 75 years and over and females aged 65 to 74 years are the age groups that are most secure financially, with 93.8% of males and 91.3% of females in these age groups living above the poverty line.
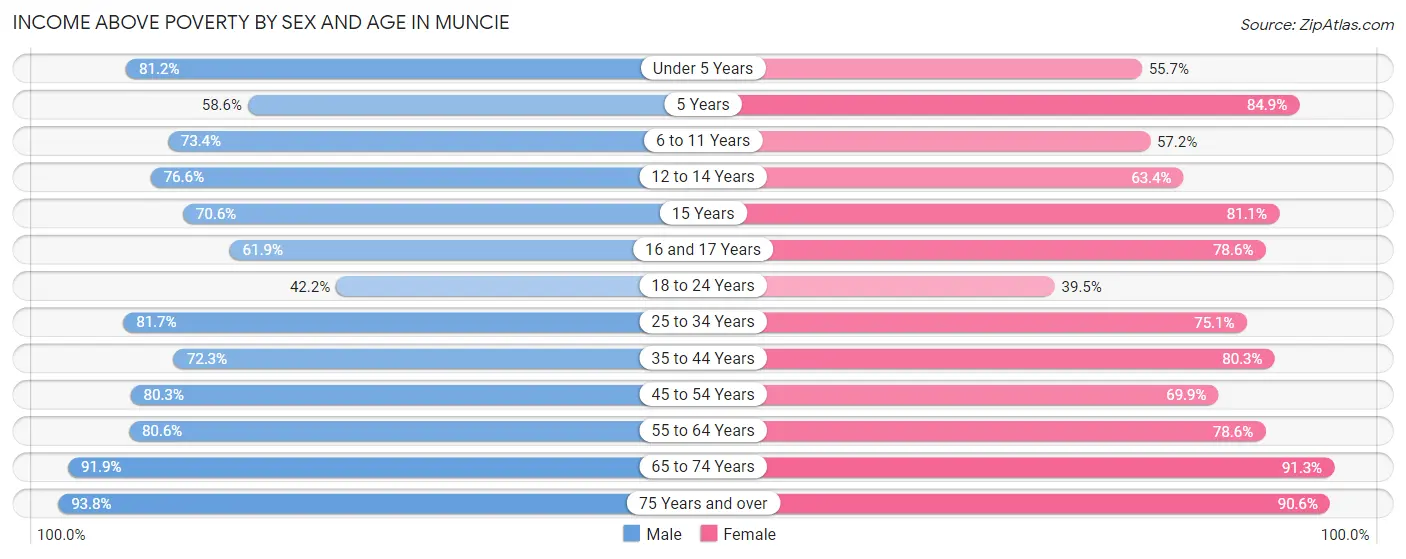
| Age Bracket | Male | Female |
| Under 5 Years | 1,220 (81.2%) | 780 (55.7%) |
| 5 Years | 205 (58.6%) | 258 (84.9%) |
| 6 to 11 Years | 1,176 (73.4%) | 965 (57.2%) |
| 12 to 14 Years | 559 (76.6%) | 416 (63.4%) |
| 15 Years | 209 (70.6%) | 232 (81.1%) |
| 16 and 17 Years | 379 (61.9%) | 525 (78.6%) |
| 18 to 24 Years | 2,680 (42.2%) | 2,725 (39.5%) |
| 25 to 34 Years | 3,204 (81.7%) | 3,000 (75.1%) |
| 35 to 44 Years | 2,150 (72.3%) | 2,541 (80.3%) |
| 45 to 54 Years | 2,249 (80.3%) | 2,292 (69.9%) |
| 55 to 64 Years | 2,668 (80.6%) | 2,602 (78.6%) |
| 65 to 74 Years | 1,830 (91.9%) | 2,678 (91.3%) |
| 75 Years and over | 1,141 (93.8%) | 1,924 (90.6%) |
| Total | 19,670 (71.1%) | 20,938 (68.2%) |
Income Below Poverty Among Married-Couple Families in Muncie
The poverty statistics for married-couple families in Muncie show that 8.1% or 610 of the total 7,563 families live below the poverty line. Families with 3 or 4 children have the highest poverty rate of 23.1%, comprising of 171 families. On the other hand, families with no children have the lowest poverty rate of 5.2%, which includes 255 families.
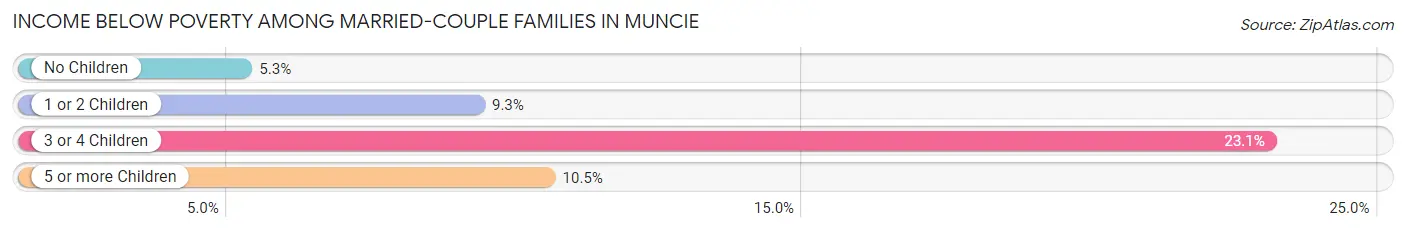
| Children | Above Poverty | Below Poverty |
| No Children | 4,598 (94.8%) | 255 (5.2%) |
| 1 or 2 Children | 1,717 (90.7%) | 176 (9.3%) |
| 3 or 4 Children | 570 (76.9%) | 171 (23.1%) |
| 5 or more Children | 68 (89.5%) | 8 (10.5%) |
| Total | 6,953 (91.9%) | 610 (8.1%) |
Income Below Poverty Among Single-Parent Households in Muncie
According to the poverty data in Muncie, 25.4% or 395 single-father households and 34.8% or 1,348 single-mother households are living below the poverty line. Among single-father households, those with 3 or 4 children have the highest poverty rate, with 106 households (38.0%) experiencing poverty. Likewise, among single-mother households, those with 3 or 4 children have the highest poverty rate, with 240 households (69.2%) falling below the poverty line.
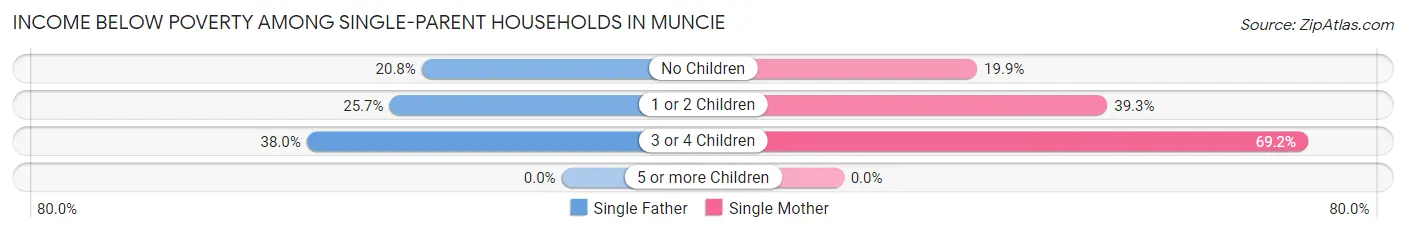
| Children | Single Father | Single Mother |
| No Children | 144 (20.8%) | 284 (19.9%) |
| 1 or 2 Children | 145 (25.7%) | 824 (39.3%) |
| 3 or 4 Children | 106 (38.0%) | 240 (69.2%) |
| 5 or more Children | 0 (0.0%) | 0 (0.0%) |
| Total | 395 (25.4%) | 1,348 (34.8%) |
Income Below Poverty Among Married-Couple vs Single-Parent Households in Muncie
The poverty data for Muncie shows that 610 of the married-couple family households (8.1%) and 1,743 of the single-parent households (32.1%) are living below the poverty level. Within the married-couple family households, those with 3 or 4 children have the highest poverty rate, with 171 households (23.1%) falling below the poverty line. Among the single-parent households, those with 3 or 4 children have the highest poverty rate, with 346 household (55.3%) living below poverty.
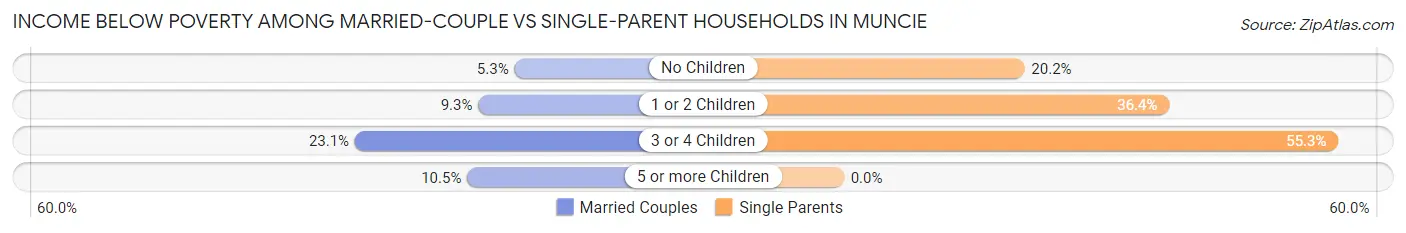
| Children | Married-Couple Families | Single-Parent Households |
| No Children | 255 (5.2%) | 428 (20.2%) |
| 1 or 2 Children | 176 (9.3%) | 969 (36.4%) |
| 3 or 4 Children | 171 (23.1%) | 346 (55.3%) |
| 5 or more Children | 8 (10.5%) | 0 (0.0%) |
| Total | 610 (8.1%) | 1,743 (32.1%) |
Race in Muncie
The most populous races in Muncie are White / Caucasian (53,134 | 81.5%), Black / African American (6,617 | 10.2%), and Two or more Races (3,379 | 5.2%).
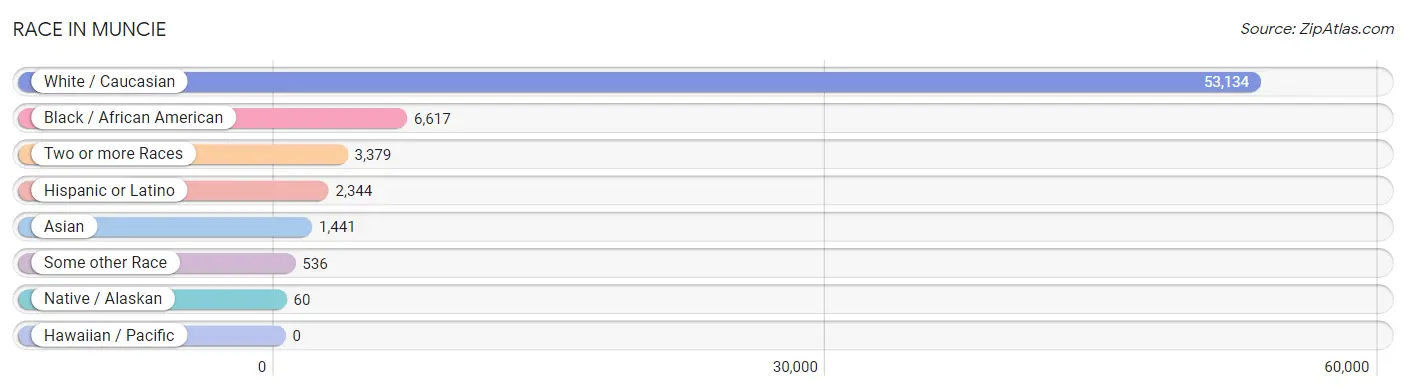
| Race | # Population | % Population |
| Asian | 1,441 | 2.2% |
| Black / African American | 6,617 | 10.2% |
| Hawaiian / Pacific | 0 | 0.0% |
| Hispanic or Latino | 2,344 | 3.6% |
| Native / Alaskan | 60 | 0.1% |
| White / Caucasian | 53,134 | 81.5% |
| Two or more Races | 3,379 | 5.2% |
| Some other Race | 536 | 0.8% |
| Total | 65,167 | 100.0% |
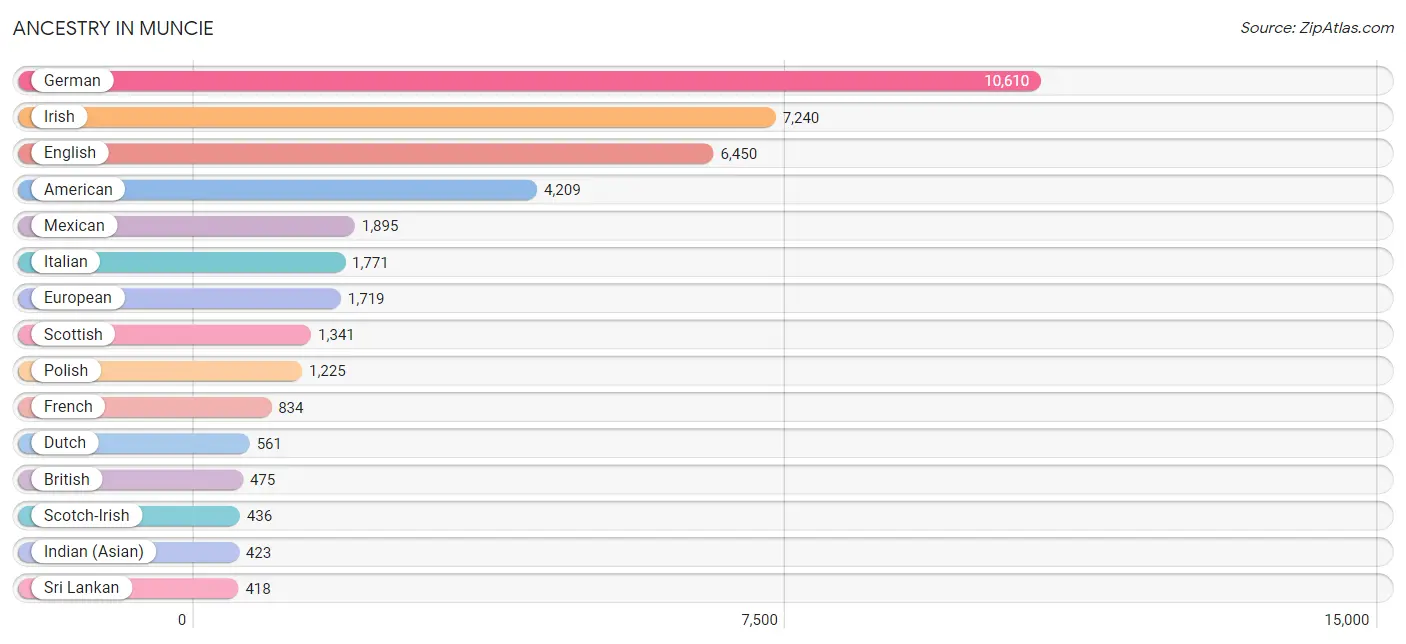
Ancestry in Muncie
The most populous ancestries reported in Muncie are German (10,610 | 16.3%), Irish (7,240 | 11.1%), English (6,450 | 9.9%), American (4,209 | 6.5%), and Mexican (1,895 | 2.9%), together accounting for 46.7% of all Muncie residents.
| Ancestry | # Population | % Population |
| African | 172 | 0.3% |
| Alsatian | 13 | 0.0% |
| American | 4,209 | 6.5% |
| Apache | 10 | 0.0% |
| Arab | 182 | 0.3% |
| Australian | 38 | 0.1% |
| Austrian | 201 | 0.3% |
| Bahamian | 31 | 0.1% |
| Bangladeshi | 26 | 0.0% |
| Barbadian | 16 | 0.0% |
| Belgian | 28 | 0.0% |
| Bhutanese | 60 | 0.1% |
| Blackfeet | 18 | 0.0% |
| Brazilian | 17 | 0.0% |
| British | 475 | 0.7% |
| Burmese | 104 | 0.2% |
| Canadian | 38 | 0.1% |
| Celtic | 6 | 0.0% |
| Central American | 135 | 0.2% |
| Cherokee | 231 | 0.4% |
| Choctaw | 45 | 0.1% |
| Creek | 15 | 0.0% |
| Croatian | 7 | 0.0% |
| Cuban | 17 | 0.0% |
| Czech | 82 | 0.1% |
| Czechoslovakian | 49 | 0.1% |
| Danish | 66 | 0.1% |
| Delaware | 6 | 0.0% |
| Dutch | 561 | 0.9% |
| Eastern European | 77 | 0.1% |
| English | 6,450 | 9.9% |
| European | 1,719 | 2.6% |
| Finnish | 20 | 0.0% |
| French | 834 | 1.3% |
| French Canadian | 71 | 0.1% |
| German | 10,610 | 16.3% |
| German Russian | 3 | 0.0% |
| Ghanaian | 88 | 0.1% |
| Greek | 261 | 0.4% |
| Guatemalan | 29 | 0.0% |
| Haitian | 11 | 0.0% |
| Honduran | 21 | 0.0% |
| Hungarian | 94 | 0.1% |
| Indian (Asian) | 423 | 0.6% |
| Iranian | 22 | 0.0% |
| Iraqi | 1 | 0.0% |
| Irish | 7,240 | 11.1% |
| Iroquois | 75 | 0.1% |
| Italian | 1,771 | 2.7% |
| Jamaican | 23 | 0.0% |
| Jordanian | 14 | 0.0% |
| Kenyan | 9 | 0.0% |
| Korean | 228 | 0.4% |
| Latvian | 9 | 0.0% |
| Lebanese | 10 | 0.0% |
| Lithuanian | 55 | 0.1% |
| Mexican | 1,895 | 2.9% |
| Mexican American Indian | 25 | 0.0% |
| Mongolian | 20 | 0.0% |
| Native Hawaiian | 73 | 0.1% |
| New Zealander | 17 | 0.0% |
| Nigerian | 41 | 0.1% |
| Northern European | 150 | 0.2% |
| Norwegian | 124 | 0.2% |
| Pakistani | 6 | 0.0% |
| Panamanian | 7 | 0.0% |
| Pennsylvania German | 28 | 0.0% |
| Peruvian | 38 | 0.1% |
| Polish | 1,225 | 1.9% |
| Portuguese | 125 | 0.2% |
| Potawatomi | 6 | 0.0% |
| Puerto Rican | 178 | 0.3% |
| Romanian | 109 | 0.2% |
| Russian | 239 | 0.4% |
| Salvadoran | 78 | 0.1% |
| Samoan | 48 | 0.1% |
| Scandinavian | 110 | 0.2% |
| Scotch-Irish | 436 | 0.7% |
| Scottish | 1,341 | 2.1% |
| Senegalese | 22 | 0.0% |
| Serbian | 17 | 0.0% |
| Sioux | 4 | 0.0% |
| Slovak | 62 | 0.1% |
| Slovene | 6 | 0.0% |
| South American | 38 | 0.1% |
| Spanish American | 39 | 0.1% |
| Sri Lankan | 418 | 0.6% |
| Subsaharan African | 360 | 0.5% |
| Swedish | 343 | 0.5% |
| Swiss | 180 | 0.3% |
| Syrian | 9 | 0.0% |
| Thai | 324 | 0.5% |
| Trinidadian and Tobagonian | 20 | 0.0% |
| Ukrainian | 19 | 0.0% |
| Vietnamese | 84 | 0.1% |
| Welsh | 244 | 0.4% | View All 96 Rows |
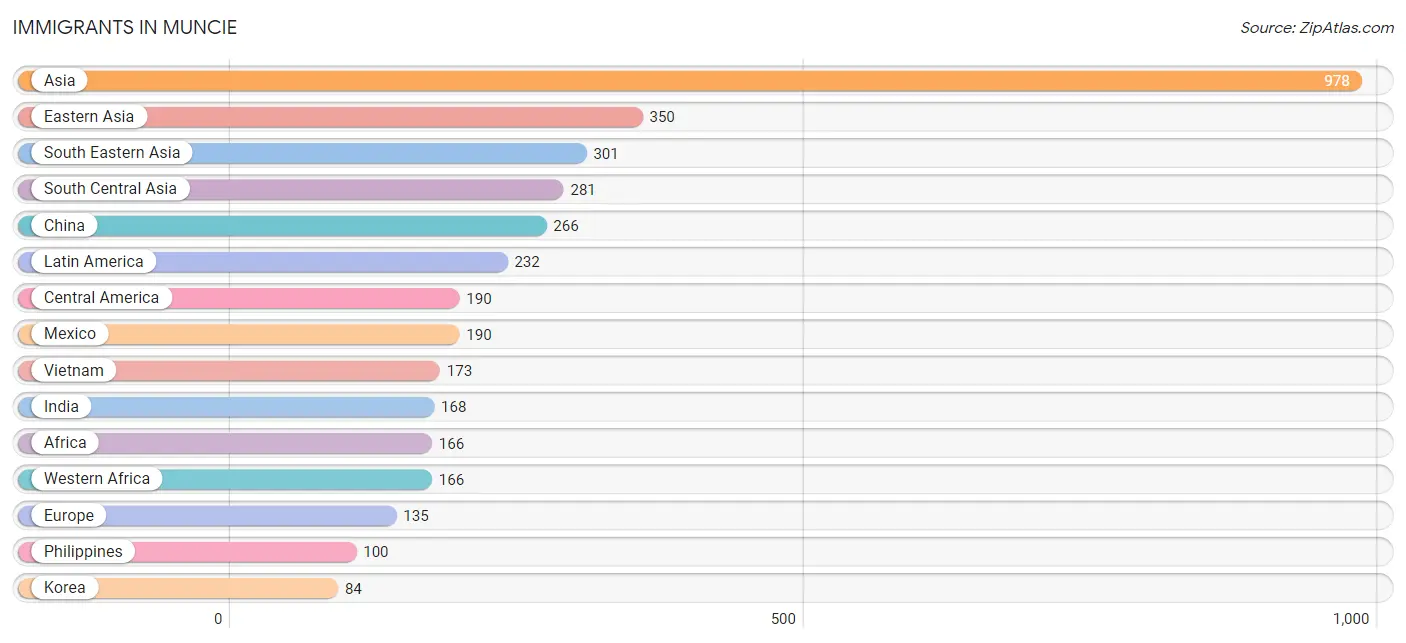
Immigrants in Muncie
The most numerous immigrant groups reported in Muncie came from Asia (978 | 1.5%), Eastern Asia (350 | 0.5%), South Eastern Asia (301 | 0.5%), South Central Asia (281 | 0.4%), and China (266 | 0.4%), together accounting for 3.3% of all Muncie residents.
| Immigration Origin | # Population | % Population |
| Africa | 166 | 0.3% |
| Asia | 978 | 1.5% |
| Bangladesh | 71 | 0.1% |
| Brazil | 17 | 0.0% |
| Caribbean | 25 | 0.0% |
| Central America | 190 | 0.3% |
| China | 266 | 0.4% |
| Eastern Asia | 350 | 0.5% |
| Eastern Europe | 50 | 0.1% |
| Europe | 135 | 0.2% |
| Germany | 40 | 0.1% |
| Ghana | 82 | 0.1% |
| Haiti | 10 | 0.0% |
| Hong Kong | 4 | 0.0% |
| Hungary | 12 | 0.0% |
| India | 168 | 0.3% |
| Iran | 30 | 0.1% |
| Kazakhstan | 8 | 0.0% |
| Korea | 84 | 0.1% |
| Latin America | 232 | 0.4% |
| Liberia | 14 | 0.0% |
| Lithuania | 9 | 0.0% |
| Malaysia | 14 | 0.0% |
| Mexico | 190 | 0.3% |
| Netherlands | 12 | 0.0% |
| Nigeria | 56 | 0.1% |
| Northern Europe | 33 | 0.1% |
| Oceania | 2 | 0.0% |
| Pakistan | 4 | 0.0% |
| Philippines | 100 | 0.2% |
| Poland | 1 | 0.0% |
| Russia | 17 | 0.0% |
| Saudi Arabia | 32 | 0.1% |
| Senegal | 14 | 0.0% |
| Serbia | 10 | 0.0% |
| South America | 17 | 0.0% |
| South Central Asia | 281 | 0.4% |
| South Eastern Asia | 301 | 0.5% |
| Thailand | 6 | 0.0% |
| Trinidad and Tobago | 15 | 0.0% |
| Ukraine | 1 | 0.0% |
| Vietnam | 173 | 0.3% |
| Western Africa | 166 | 0.3% |
| Western Asia | 46 | 0.1% |
| Western Europe | 52 | 0.1% |
| Yemen | 14 | 0.0% | View All 46 Rows |
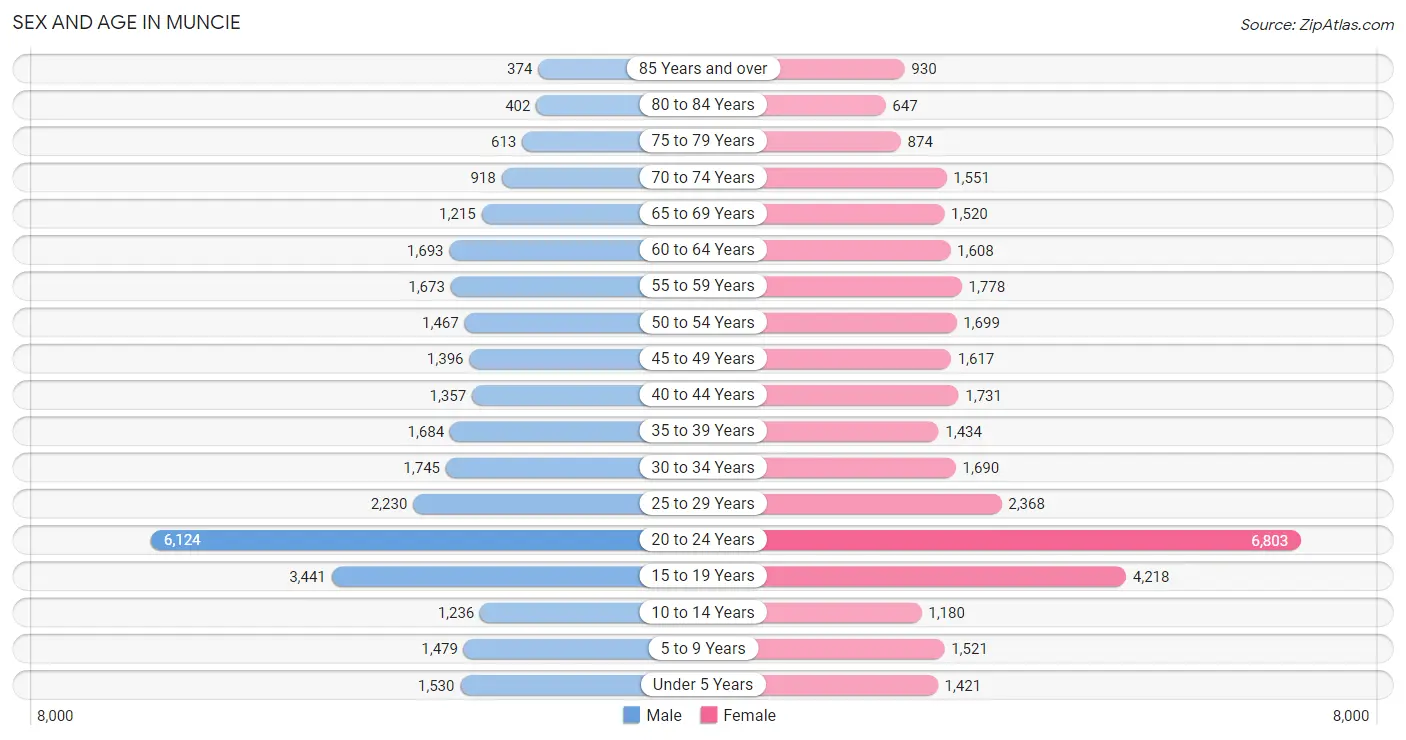
Sex and Age in Muncie
Sex and Age in Muncie
The most populous age groups in Muncie are 20 to 24 Years (6,124 | 20.0%) for men and 20 to 24 Years (6,803 | 19.7%) for women.
| Age Bracket | Male | Female |
| Under 5 Years | 1,530 (5.0%) | 1,421 (4.1%) |
| 5 to 9 Years | 1,479 (4.8%) | 1,521 (4.4%) |
| 10 to 14 Years | 1,236 (4.0%) | 1,180 (3.4%) |
| 15 to 19 Years | 3,441 (11.3%) | 4,218 (12.2%) |
| 20 to 24 Years | 6,124 (20.0%) | 6,803 (19.7%) |
| 25 to 29 Years | 2,230 (7.3%) | 2,368 (6.9%) |
| 30 to 34 Years | 1,745 (5.7%) | 1,690 (4.9%) |
| 35 to 39 Years | 1,684 (5.5%) | 1,434 (4.2%) |
| 40 to 44 Years | 1,357 (4.4%) | 1,731 (5.0%) |
| 45 to 49 Years | 1,396 (4.6%) | 1,617 (4.7%) |
| 50 to 54 Years | 1,467 (4.8%) | 1,699 (4.9%) |
| 55 to 59 Years | 1,673 (5.5%) | 1,778 (5.1%) |
| 60 to 64 Years | 1,693 (5.5%) | 1,608 (4.6%) |
| 65 to 69 Years | 1,215 (4.0%) | 1,520 (4.4%) |
| 70 to 74 Years | 918 (3.0%) | 1,551 (4.5%) |
| 75 to 79 Years | 613 (2.0%) | 874 (2.5%) |
| 80 to 84 Years | 402 (1.3%) | 647 (1.9%) |
| 85 Years and over | 374 (1.2%) | 930 (2.7%) |
| Total | 30,577 (100.0%) | 34,590 (100.0%) |
Families and Households in Muncie
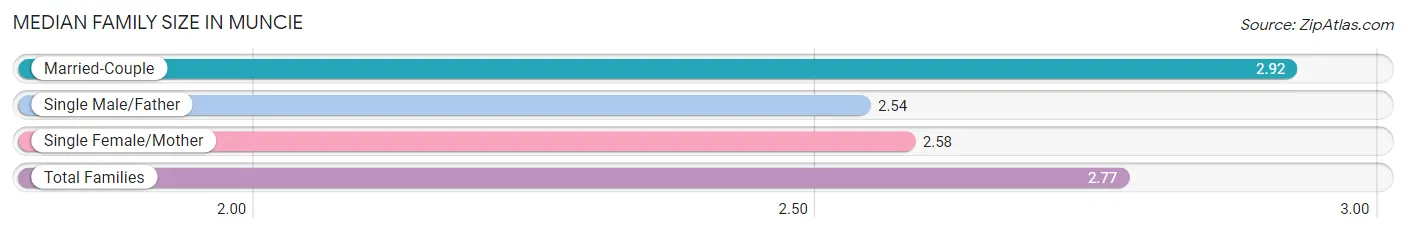
Median Family Size in Muncie
The median family size in Muncie is 2.77 persons per family, with married-couple families (7,563 | 58.2%) accounting for the largest median family size of 2.92 persons per family. On the other hand, single male/father families (1,557 | 12.0%) represent the smallest median family size with 2.54 persons per family.
| Family Type | # Families | Family Size |
| Married-Couple | 7,563 (58.2%) | 2.92 |
| Single Male/Father | 1,557 (12.0%) | 2.54 |
| Single Female/Mother | 3,873 (29.8%) | 2.58 |
| Total Families | 12,993 (100.0%) | 2.77 |
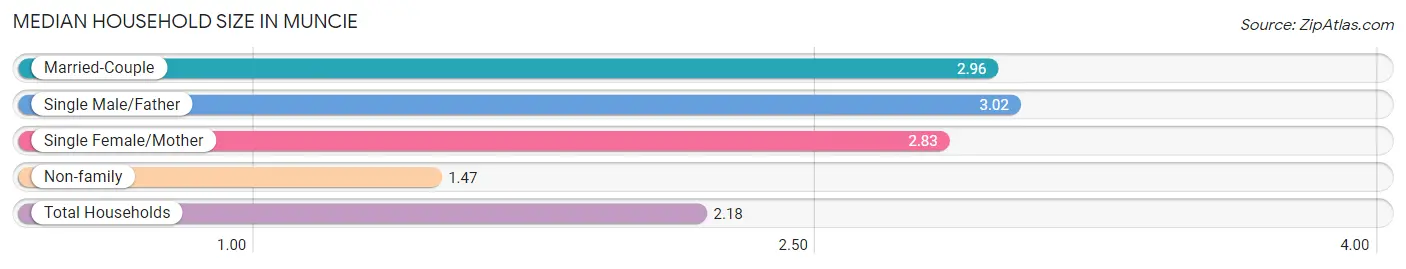
Median Household Size in Muncie
The median household size in Muncie is 2.18 persons per household, with single male/father households (1,557 | 5.9%) accounting for the largest median household size of 3.02 persons per household. non-family households (13,632 | 51.2%) represent the smallest median household size with 1.47 persons per household.
| Household Type | # Households | Household Size |
| Married-Couple | 7,563 (28.4%) | 2.96 |
| Single Male/Father | 1,557 (5.9%) | 3.02 |
| Single Female/Mother | 3,873 (14.5%) | 2.83 |
| Non-family | 13,632 (51.2%) | 1.47 |
| Total Households | 26,625 (100.0%) | 2.18 |
Household Size by Marriage Status in Muncie
Out of a total of 26,625 households in Muncie, 12,993 (48.8%) are family households, while 13,632 (51.2%) are nonfamily households. The most numerous type of family households are 2-person households, comprising 6,078, and the most common type of nonfamily households are 1-person households, comprising 9,565.
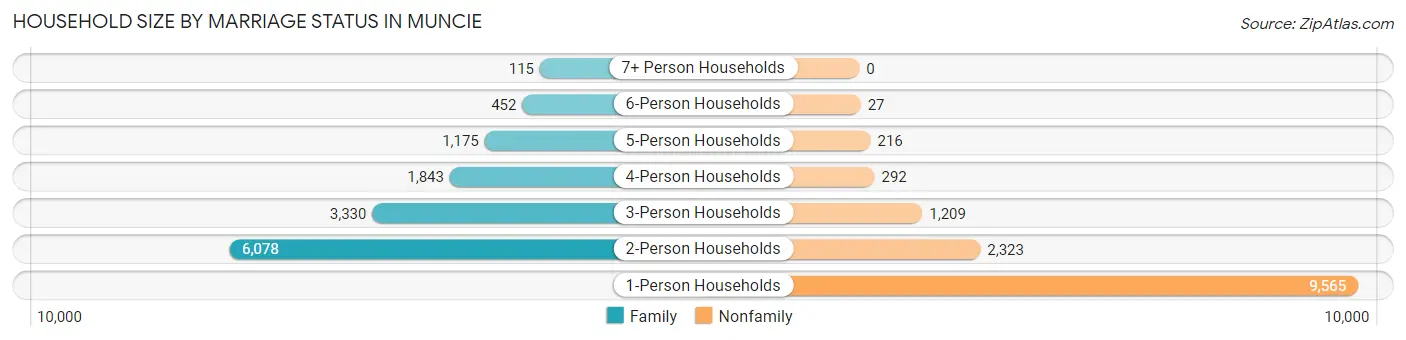
| Household Size | Family Households | Nonfamily Households |
| 1-Person Households | - | 9,565 (35.9%) |
| 2-Person Households | 6,078 (22.8%) | 2,323 (8.7%) |
| 3-Person Households | 3,330 (12.5%) | 1,209 (4.5%) |
| 4-Person Households | 1,843 (6.9%) | 292 (1.1%) |
| 5-Person Households | 1,175 (4.4%) | 216 (0.8%) |
| 6-Person Households | 452 (1.7%) | 27 (0.1%) |
| 7+ Person Households | 115 (0.4%) | 0 (0.0%) |
| Total | 12,993 (48.8%) | 13,632 (51.2%) |
Female Fertility in Muncie
Fertility by Age in Muncie
Average fertility rate in Muncie is 46.0 births per 1,000 women. Women in the age bracket of 20 to 34 years have the highest fertility rate with 74.0 births per 1,000 women. Women in the age bracket of 20 to 34 years acount for 85.9% of all women with births.
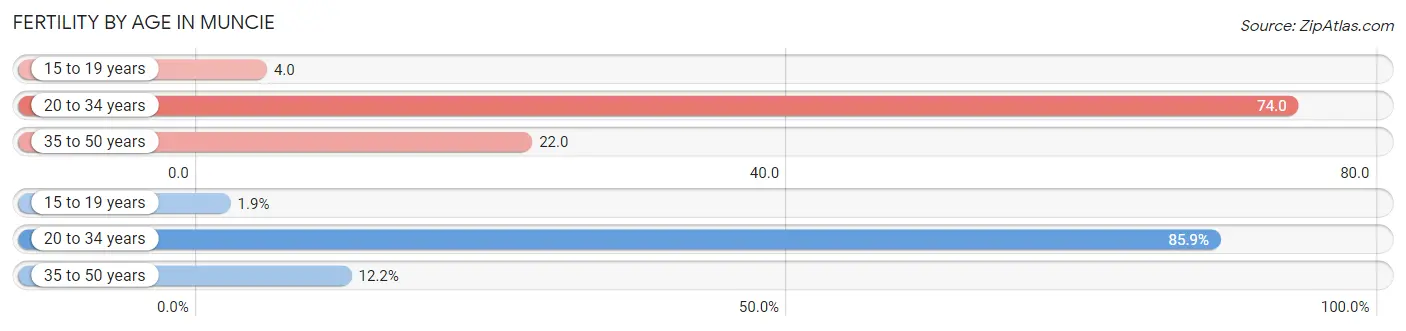
| Age Bracket | Women with Births | Births / 1,000 Women |
| 15 to 19 years | 18 (1.9%) | 4.0 |
| 20 to 34 years | 804 (85.9%) | 74.0 |
| 35 to 50 years | 114 (12.2%) | 22.0 |
| Total | 936 (100.0%) | 46.0 |
Fertility by Age by Marriage Status in Muncie
49.8% of women with births (936) in Muncie are married. The highest percentage of unmarried women with births falls into 15 to 19 years age bracket with 100.0% of them unmarried at the time of birth, while the lowest percentage of unmarried women with births belong to 20 to 34 years age bracket with 45.8% of them unmarried.
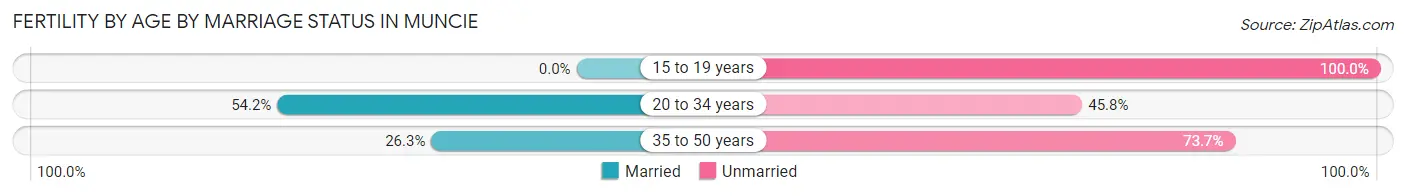
| Age Bracket | Married | Unmarried |
| 15 to 19 years | 0 (0.0%) | 18 (100.0%) |
| 20 to 34 years | 436 (54.2%) | 368 (45.8%) |
| 35 to 50 years | 30 (26.3%) | 84 (73.7%) |
| Total | 466 (49.8%) | 470 (50.2%) |
Fertility by Education in Muncie
Average fertility rate in Muncie is 46.0 births per 1,000 women. Women with the education attainment of bachelor's degree have the highest fertility rate of 68.0 births per 1,000 women, while women with the education attainment of less than high school have the lowest fertility at 25.0 births per 1,000 women. Women with the education attainment of college or associate's degree represent 47.3% of all women with births.
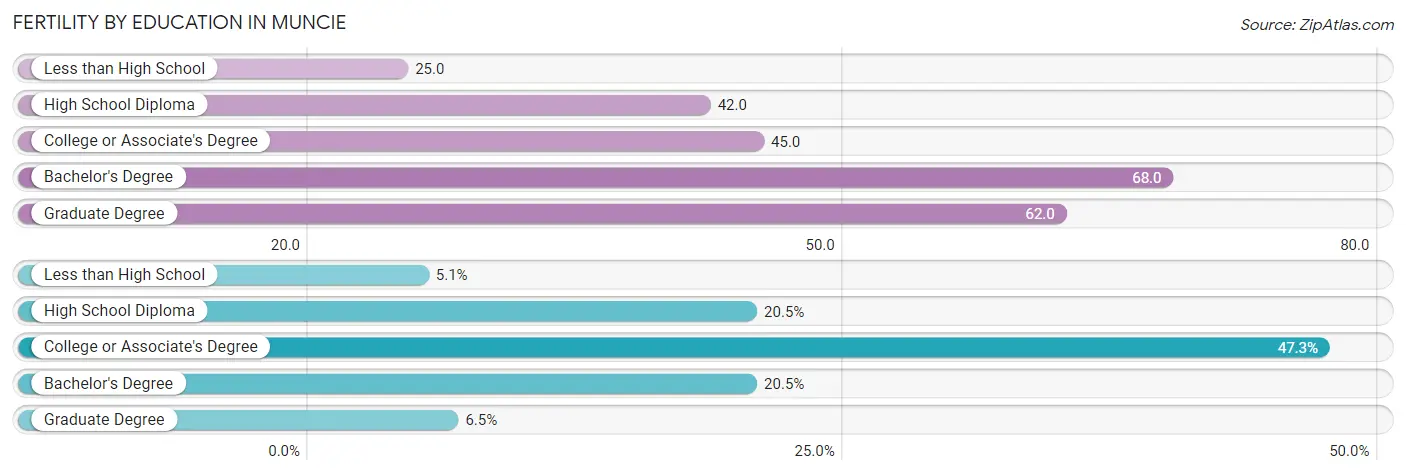
| Educational Attainment | Women with Births | Births / 1,000 Women |
| Less than High School | 48 (5.1%) | 25.0 |
| High School Diploma | 192 (20.5%) | 42.0 |
| College or Associate's Degree | 443 (47.3%) | 45.0 |
| Bachelor's Degree | 192 (20.5%) | 68.0 |
| Graduate Degree | 61 (6.5%) | 62.0 |
| Total | 936 (100.0%) | 46.0 |
Fertility by Education by Marriage Status in Muncie
50.2% of women with births in Muncie are unmarried. Women with the educational attainment of bachelor's degree are most likely to be married with 72.4% of them married at childbirth, while women with the educational attainment of less than high school are least likely to be married with 91.7% of them unmarried at childbirth.
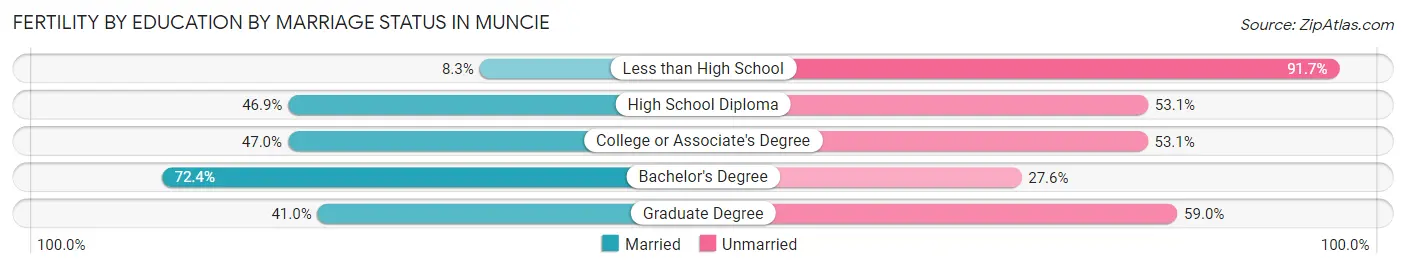
| Educational Attainment | Married | Unmarried |
| Less than High School | 4 (8.3%) | 44 (91.7%) |
| High School Diploma | 90 (46.9%) | 102 (53.1%) |
| College or Associate's Degree | 208 (46.9%) | 235 (53.0%) |
| Bachelor's Degree | 139 (72.4%) | 53 (27.6%) |
| Graduate Degree | 25 (41.0%) | 36 (59.0%) |
| Total | 466 (49.8%) | 470 (50.2%) |
Employment Characteristics in Muncie
Employment by Class of Employer in Muncie
Among the 29,221 employed individuals in Muncie, private company employees (20,315 | 69.5%), not-for-profit organizations (3,338 | 11.4%), and state government employees (2,322 | 8.0%) make up the most common classes of employment.
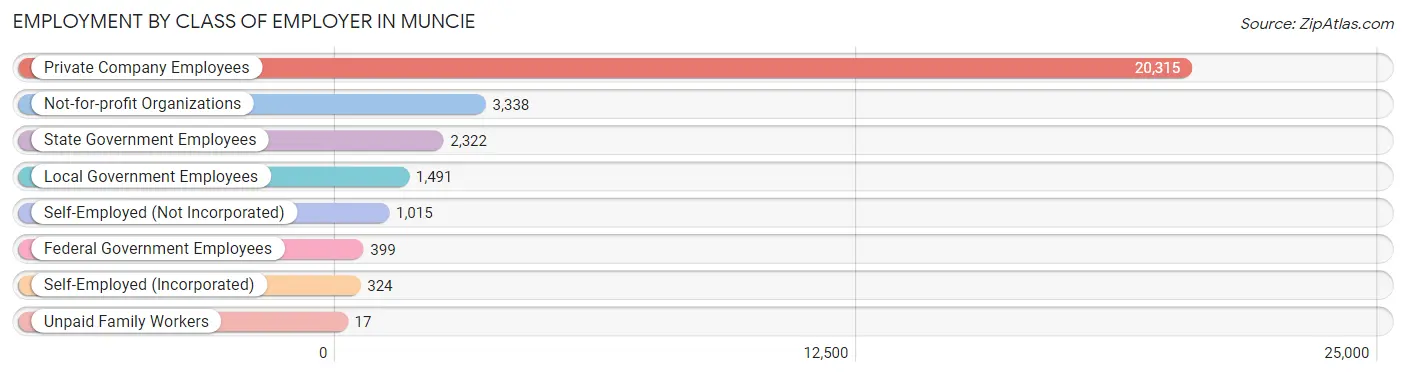
| Employer Class | # Employees | % Employees |
| Private Company Employees | 20,315 | 69.5% |
| Self-Employed (Incorporated) | 324 | 1.1% |
| Self-Employed (Not Incorporated) | 1,015 | 3.5% |
| Not-for-profit Organizations | 3,338 | 11.4% |
| Local Government Employees | 1,491 | 5.1% |
| State Government Employees | 2,322 | 8.0% |
| Federal Government Employees | 399 | 1.4% |
| Unpaid Family Workers | 17 | 0.1% |
| Total | 29,221 | 100.0% |
Employment Status by Age in Muncie
According to the labor force statistics for Muncie, out of the total population over 16 years of age (56,201), 58.2% or 32,709 individuals are in the labor force, with 8.2% or 2,682 of them unemployed. The age group with the highest labor force participation rate is 25 to 29 years, with 86.1% or 3,959 individuals in the labor force. Within the labor force, the 16 to 19 years age range has the highest percentage of unemployed individuals, with 17.1% or 509 of them being unemployed.
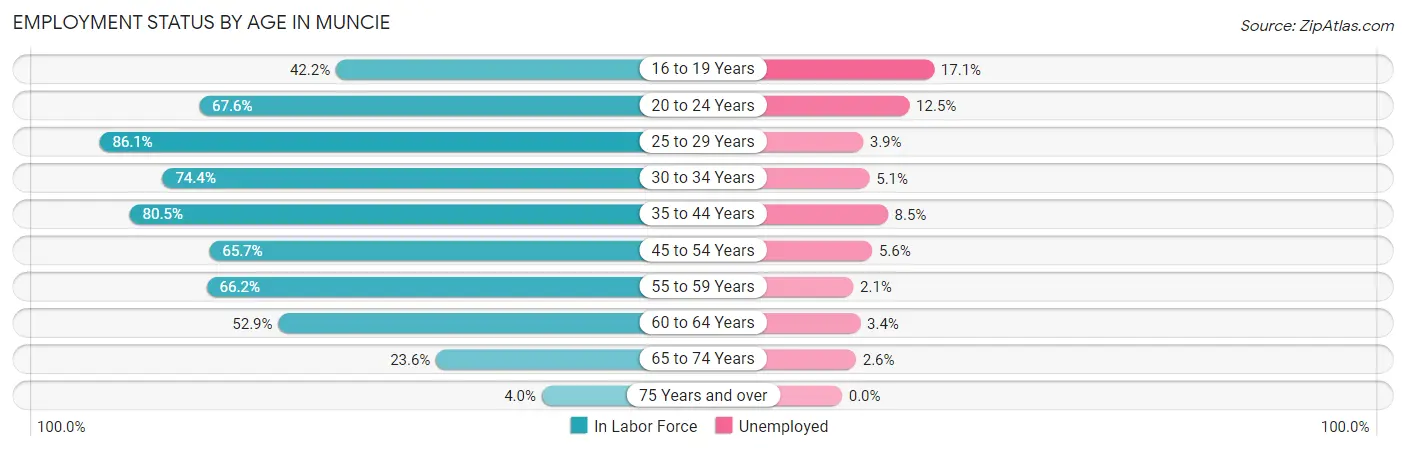
| Age Bracket | In Labor Force | Unemployed |
| 16 to 19 Years | 2,979 (42.2%) | 509 (17.1%) |
| 20 to 24 Years | 8,739 (67.6%) | 1,092 (12.5%) |
| 25 to 29 Years | 3,959 (86.1%) | 154 (3.9%) |
| 30 to 34 Years | 2,556 (74.4%) | 130 (5.1%) |
| 35 to 44 Years | 4,996 (80.5%) | 425 (8.5%) |
| 45 to 54 Years | 4,060 (65.7%) | 227 (5.6%) |
| 55 to 59 Years | 2,285 (66.2%) | 48 (2.1%) |
| 60 to 64 Years | 1,746 (52.9%) | 59 (3.4%) |
| 65 to 74 Years | 1,228 (23.6%) | 32 (2.6%) |
| 75 Years and over | 154 (4.0%) | 0 (0.0%) |
| Total | 32,709 (58.2%) | 2,682 (8.2%) |
Employment Status by Educational Attainment in Muncie
According to labor force statistics for Muncie, 72.1% of individuals (19,590) out of the total population between 25 and 64 years of age (27,170) are in the labor force, with 5.3% or 1,038 of them being unemployed. The group with the highest labor force participation rate are those with the educational attainment of bachelor's degree or higher, with 85.9% or 5,893 individuals in the labor force. Within the labor force, individuals with high school diploma education have the highest percentage of unemployment, with 8.6% or 524 of them being unemployed.
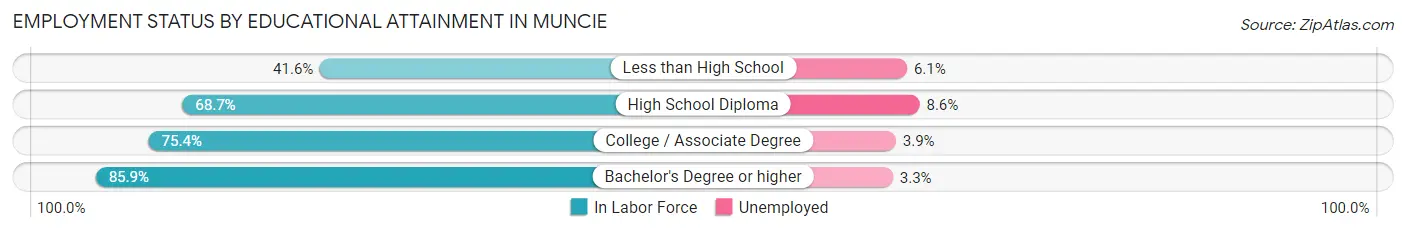
| Educational Attainment | In Labor Force | Unemployed |
| Less than High School | 1,252 (41.6%) | 184 (6.1%) |
| High School Diploma | 6,088 (68.7%) | 762 (8.6%) |
| College / Associate Degree | 6,363 (75.4%) | 329 (3.9%) |
| Bachelor's Degree or higher | 5,893 (85.9%) | 226 (3.3%) |
| Total | 19,590 (72.1%) | 1,440 (5.3%) |
Employment Occupations by Sex in Muncie
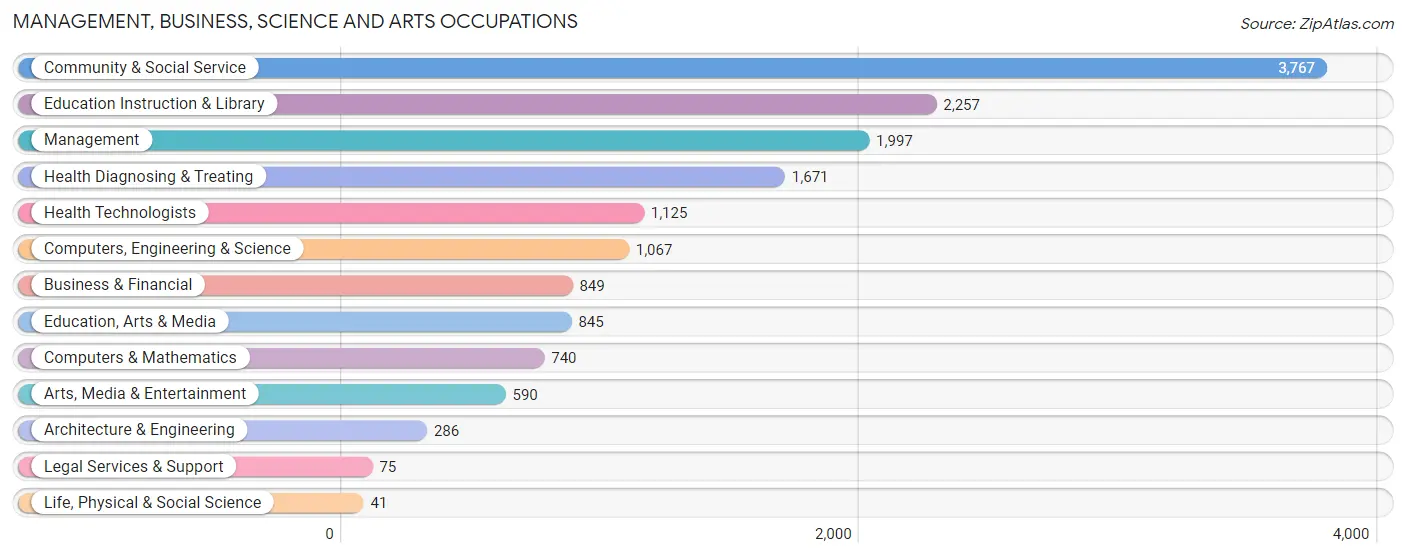
Management, Business, Science and Arts Occupations
The most common Management, Business, Science and Arts occupations in Muncie are Community & Social Service (3,767 | 12.6%), Education Instruction & Library (2,257 | 7.5%), Management (1,997 | 6.7%), Health Diagnosing & Treating (1,671 | 5.6%), and Health Technologists (1,125 | 3.7%).
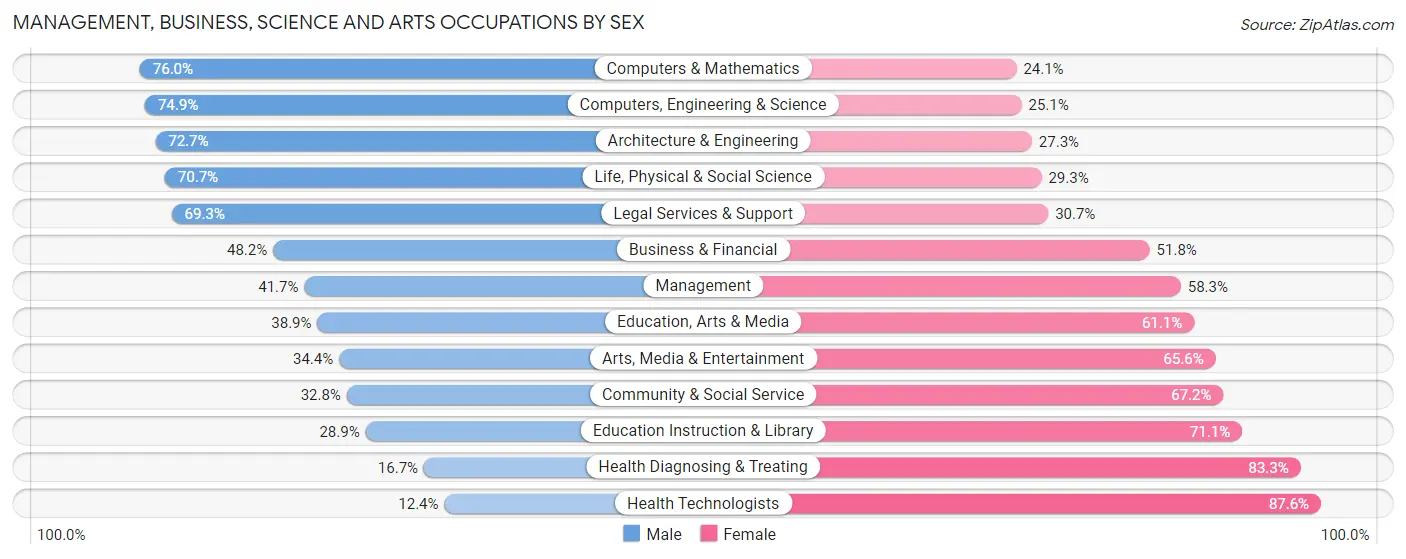
Management, Business, Science and Arts Occupations by Sex
Within the Management, Business, Science and Arts occupations in Muncie, the most male-oriented occupations are Computers & Mathematics (75.9%), Computers, Engineering & Science (74.9%), and Architecture & Engineering (72.7%), while the most female-oriented occupations are Health Technologists (87.6%), Health Diagnosing & Treating (83.3%), and Education Instruction & Library (71.1%).
| Occupation | Male | Female |
| Management | 832 (41.7%) | 1,165 (58.3%) |
| Business & Financial | 409 (48.2%) | 440 (51.8%) |
| Computers, Engineering & Science | 799 (74.9%) | 268 (25.1%) |
| Computers & Mathematics | 562 (75.9%) | 178 (24.0%) |
| Architecture & Engineering | 208 (72.7%) | 78 (27.3%) |
| Life, Physical & Social Science | 29 (70.7%) | 12 (29.3%) |
| Community & Social Service | 1,236 (32.8%) | 2,531 (67.2%) |
| Education, Arts & Media | 329 (38.9%) | 516 (61.1%) |
| Legal Services & Support | 52 (69.3%) | 23 (30.7%) |
| Education Instruction & Library | 652 (28.9%) | 1,605 (71.1%) |
| Arts, Media & Entertainment | 203 (34.4%) | 387 (65.6%) |
| Health Diagnosing & Treating | 279 (16.7%) | 1,392 (83.3%) |
| Health Technologists | 140 (12.4%) | 985 (87.6%) |
| Total (Category) | 3,555 (38.0%) | 5,796 (62.0%) |
| Total (Overall) | 14,213 (47.4%) | 15,766 (52.6%) |
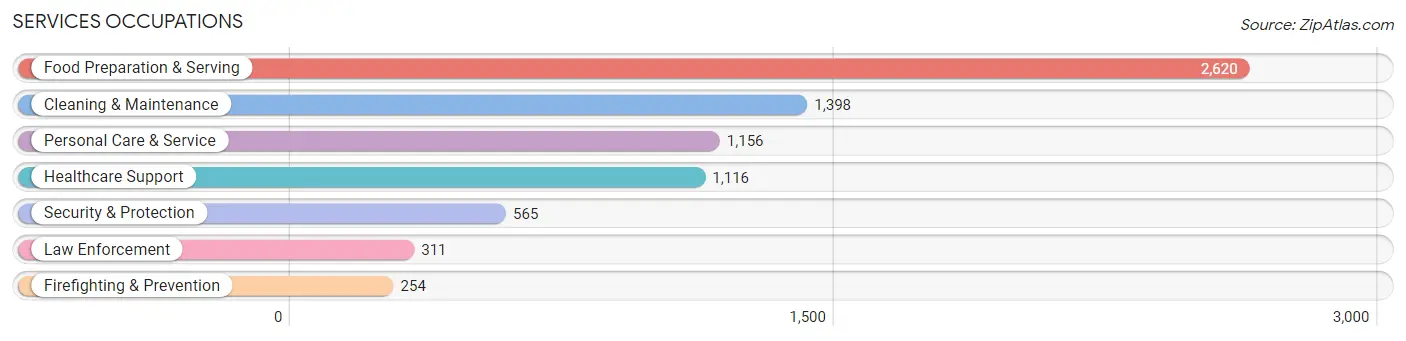
Services Occupations
The most common Services occupations in Muncie are Food Preparation & Serving (2,620 | 8.7%), Cleaning & Maintenance (1,398 | 4.7%), Personal Care & Service (1,156 | 3.9%), Healthcare Support (1,116 | 3.7%), and Security & Protection (565 | 1.9%).
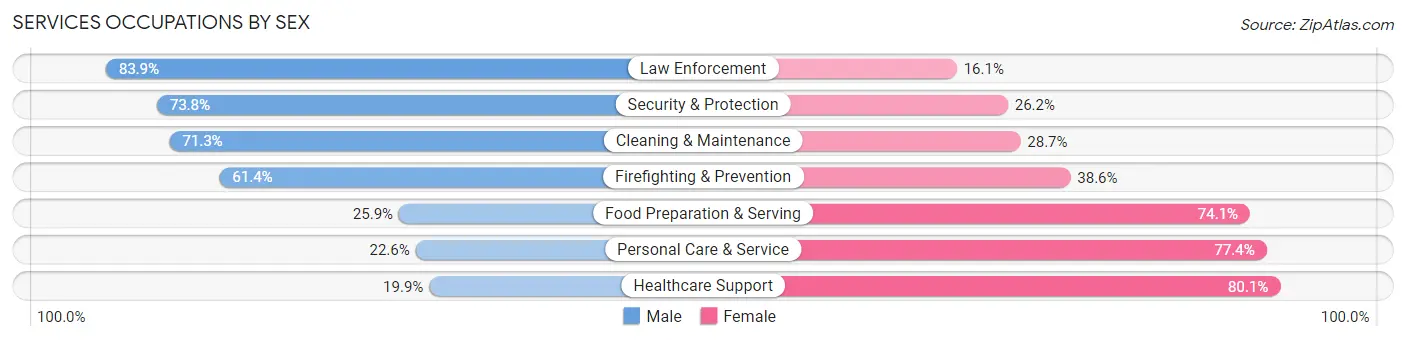
Services Occupations by Sex
Within the Services occupations in Muncie, the most male-oriented occupations are Law Enforcement (83.9%), Security & Protection (73.8%), and Cleaning & Maintenance (71.3%), while the most female-oriented occupations are Healthcare Support (80.1%), Personal Care & Service (77.4%), and Food Preparation & Serving (74.1%).
| Occupation | Male | Female |
| Healthcare Support | 222 (19.9%) | 894 (80.1%) |
| Security & Protection | 417 (73.8%) | 148 (26.2%) |
| Firefighting & Prevention | 156 (61.4%) | 98 (38.6%) |
| Law Enforcement | 261 (83.9%) | 50 (16.1%) |
| Food Preparation & Serving | 678 (25.9%) | 1,942 (74.1%) |
| Cleaning & Maintenance | 997 (71.3%) | 401 (28.7%) |
| Personal Care & Service | 261 (22.6%) | 895 (77.4%) |
| Total (Category) | 2,575 (37.6%) | 4,280 (62.4%) |
| Total (Overall) | 14,213 (47.4%) | 15,766 (52.6%) |
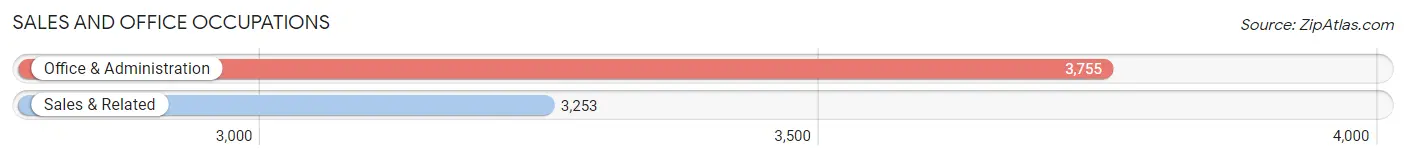
Sales and Office Occupations
The most common Sales and Office occupations in Muncie are Office & Administration (3,755 | 12.5%), and Sales & Related (3,253 | 10.8%).
Sales and Office Occupations by Sex
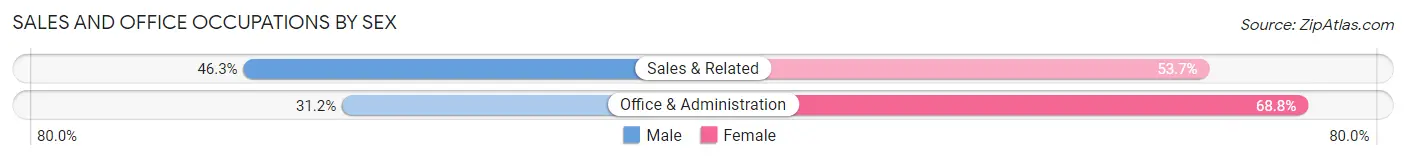
| Occupation | Male | Female |
| Sales & Related | 1,507 (46.3%) | 1,746 (53.7%) |
| Office & Administration | 1,170 (31.2%) | 2,585 (68.8%) |
| Total (Category) | 2,677 (38.2%) | 4,331 (61.8%) |
| Total (Overall) | 14,213 (47.4%) | 15,766 (52.6%) |
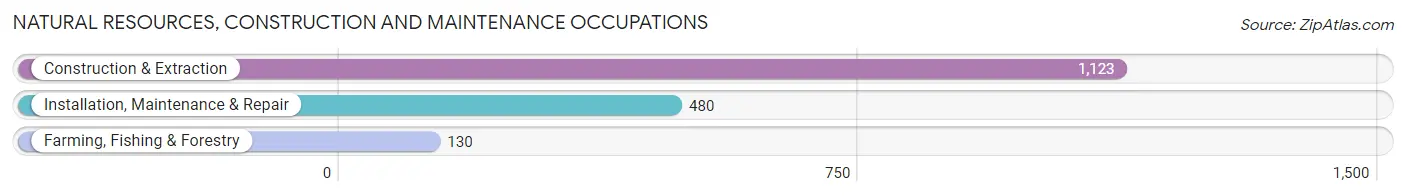
Natural Resources, Construction and Maintenance Occupations
The most common Natural Resources, Construction and Maintenance occupations in Muncie are Construction & Extraction (1,123 | 3.7%), Installation, Maintenance & Repair (480 | 1.6%), and Farming, Fishing & Forestry (130 | 0.4%).
Natural Resources, Construction and Maintenance Occupations by Sex
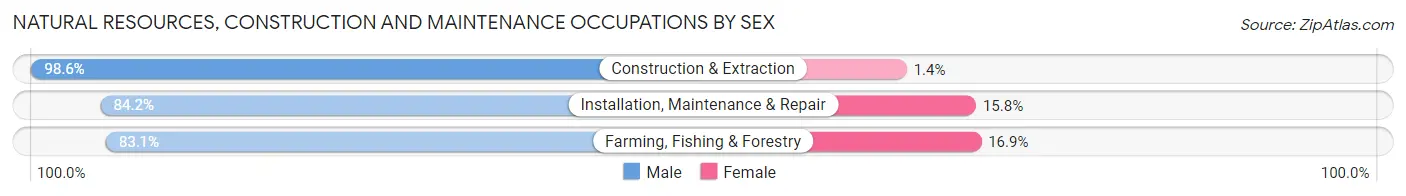
| Occupation | Male | Female |
| Farming, Fishing & Forestry | 108 (83.1%) | 22 (16.9%) |
| Construction & Extraction | 1,107 (98.6%) | 16 (1.4%) |
| Installation, Maintenance & Repair | 404 (84.2%) | 76 (15.8%) |
| Total (Category) | 1,619 (93.4%) | 114 (6.6%) |
| Total (Overall) | 14,213 (47.4%) | 15,766 (52.6%) |
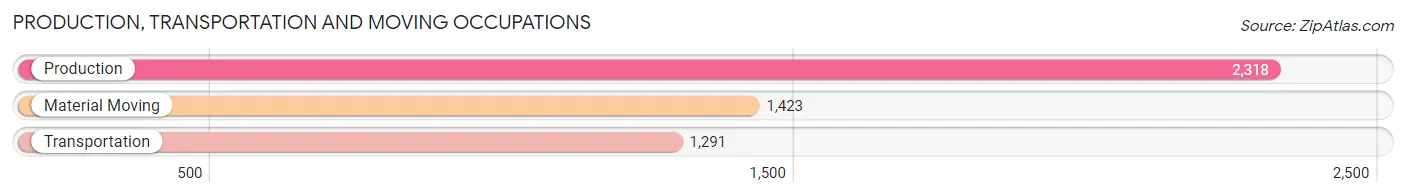
Production, Transportation and Moving Occupations
The most common Production, Transportation and Moving occupations in Muncie are Production (2,318 | 7.7%), Material Moving (1,423 | 4.8%), and Transportation (1,291 | 4.3%).
Production, Transportation and Moving Occupations by Sex
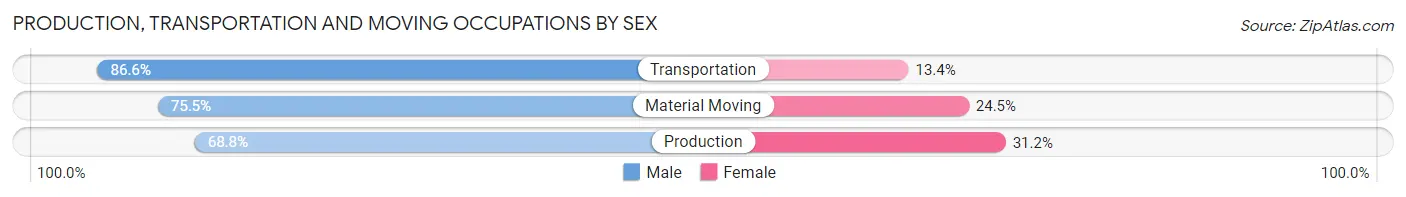
| Occupation | Male | Female |
| Production | 1,594 (68.8%) | 724 (31.2%) |
| Transportation | 1,118 (86.6%) | 173 (13.4%) |
| Material Moving | 1,075 (75.5%) | 348 (24.5%) |
| Total (Category) | 3,787 (75.3%) | 1,245 (24.7%) |
| Total (Overall) | 14,213 (47.4%) | 15,766 (52.6%) |
Employment Industries by Sex in Muncie
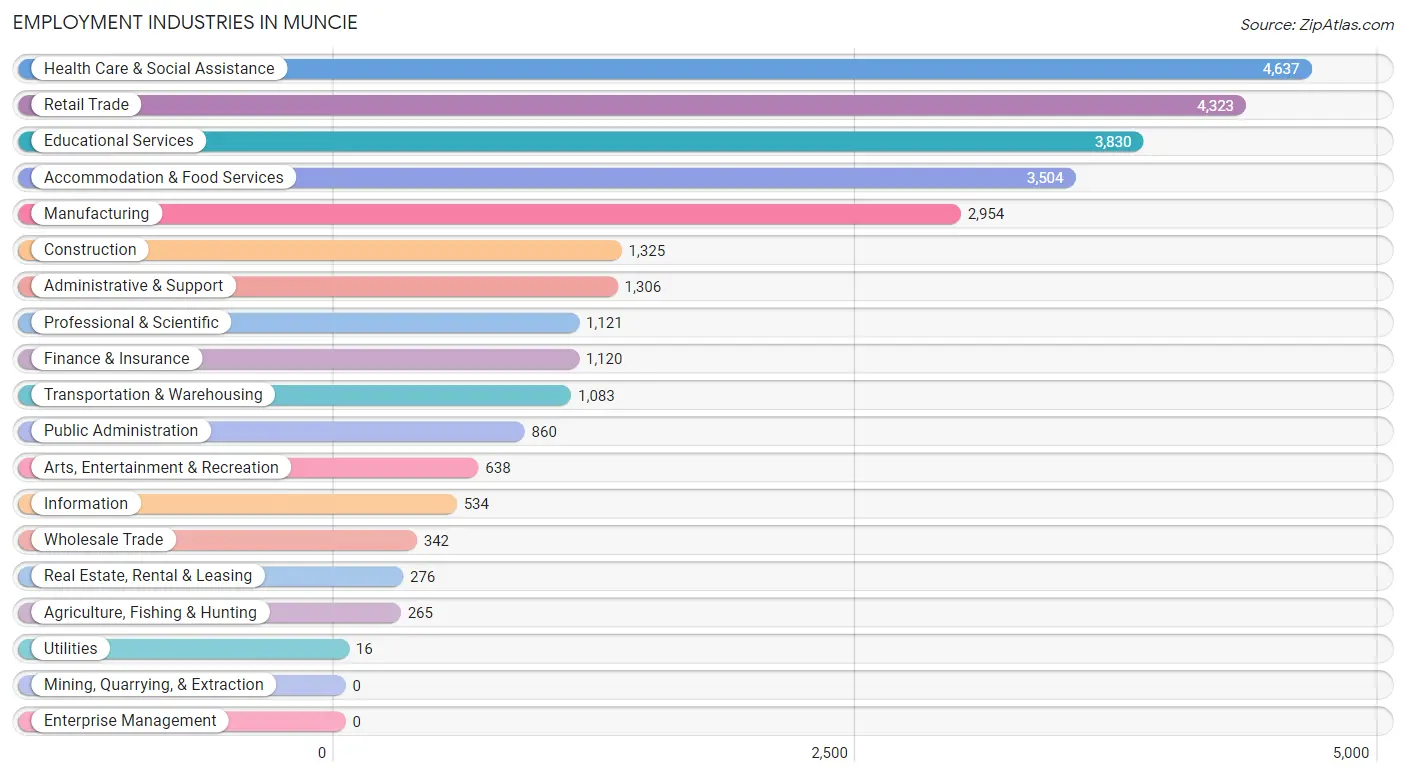
Employment Industries in Muncie
The major employment industries in Muncie include Health Care & Social Assistance (4,637 | 15.5%), Retail Trade (4,323 | 14.4%), Educational Services (3,830 | 12.8%), Accommodation & Food Services (3,504 | 11.7%), and Manufacturing (2,954 | 9.9%).
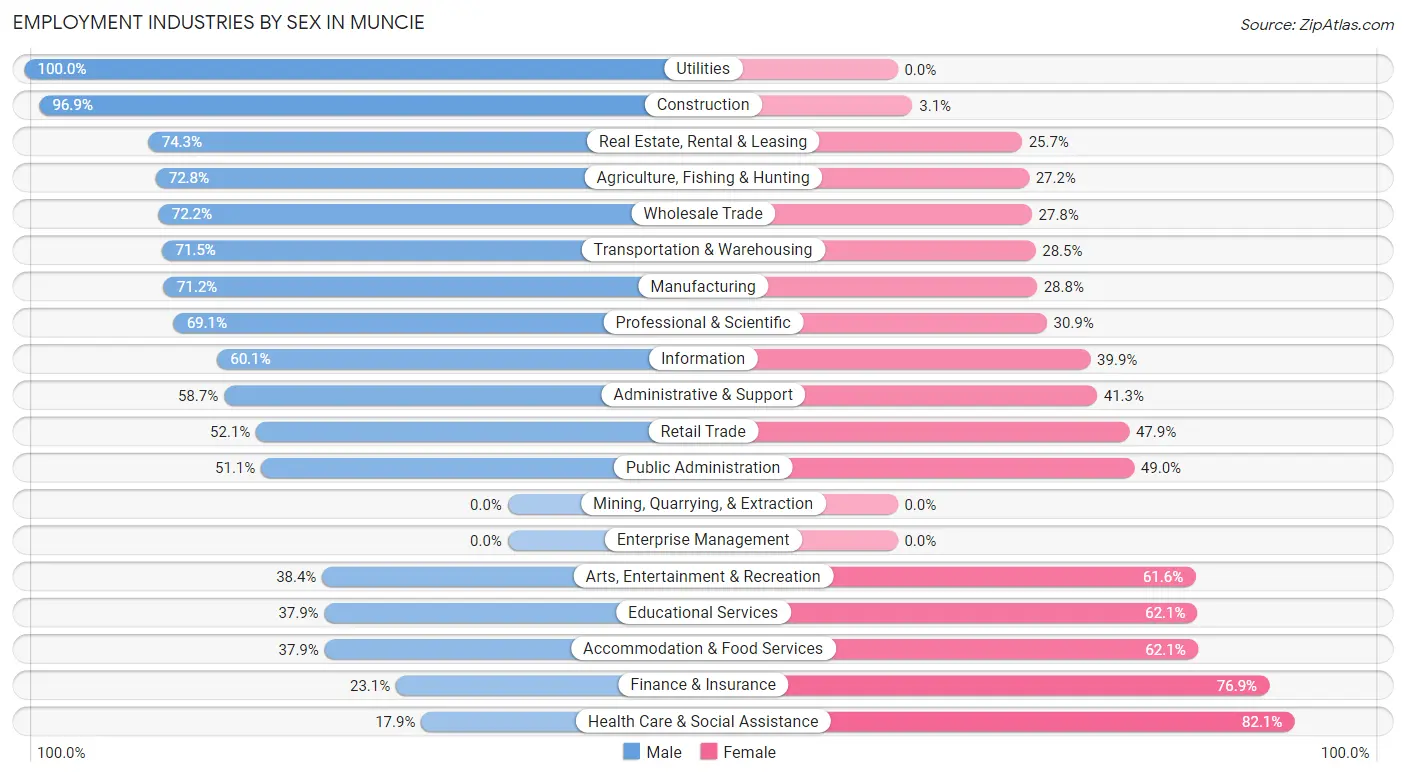
Employment Industries by Sex in Muncie
The Muncie industries that see more men than women are Utilities (100.0%), Construction (96.9%), and Real Estate, Rental & Leasing (74.3%), whereas the industries that tend to have a higher number of women are Health Care & Social Assistance (82.1%), Finance & Insurance (76.9%), and Accommodation & Food Services (62.1%).
| Industry | Male | Female |
| Agriculture, Fishing & Hunting | 193 (72.8%) | 72 (27.2%) |
| Mining, Quarrying, & Extraction | 0 (0.0%) | 0 (0.0%) |
| Construction | 1,284 (96.9%) | 41 (3.1%) |
| Manufacturing | 2,102 (71.2%) | 852 (28.8%) |
| Wholesale Trade | 247 (72.2%) | 95 (27.8%) |
| Retail Trade | 2,251 (52.1%) | 2,072 (47.9%) |
| Transportation & Warehousing | 774 (71.5%) | 309 (28.5%) |
| Utilities | 16 (100.0%) | 0 (0.0%) |
| Information | 321 (60.1%) | 213 (39.9%) |
| Finance & Insurance | 259 (23.1%) | 861 (76.9%) |
| Real Estate, Rental & Leasing | 205 (74.3%) | 71 (25.7%) |
| Professional & Scientific | 775 (69.1%) | 346 (30.9%) |
| Enterprise Management | 0 (0.0%) | 0 (0.0%) |
| Administrative & Support | 767 (58.7%) | 539 (41.3%) |
| Educational Services | 1,453 (37.9%) | 2,377 (62.1%) |
| Health Care & Social Assistance | 830 (17.9%) | 3,807 (82.1%) |
| Arts, Entertainment & Recreation | 245 (38.4%) | 393 (61.6%) |
| Accommodation & Food Services | 1,328 (37.9%) | 2,176 (62.1%) |
| Public Administration | 439 (51.0%) | 421 (48.9%) |
| Total | 14,213 (47.4%) | 15,766 (52.6%) |
Education in Muncie
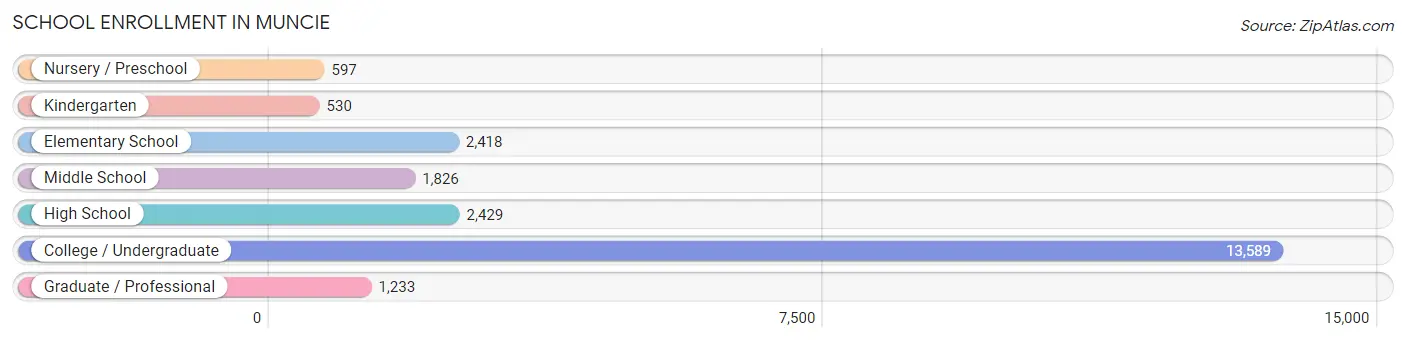
School Enrollment in Muncie
The most common levels of schooling among the 22,622 students in Muncie are college / undergraduate (13,589 | 60.1%), high school (2,429 | 10.7%), and elementary school (2,418 | 10.7%).
| School Level | # Students | % Students |
| Nursery / Preschool | 597 | 2.6% |
| Kindergarten | 530 | 2.3% |
| Elementary School | 2,418 | 10.7% |
| Middle School | 1,826 | 8.1% |
| High School | 2,429 | 10.7% |
| College / Undergraduate | 13,589 | 60.1% |
| Graduate / Professional | 1,233 | 5.4% |
| Total | 22,622 | 100.0% |
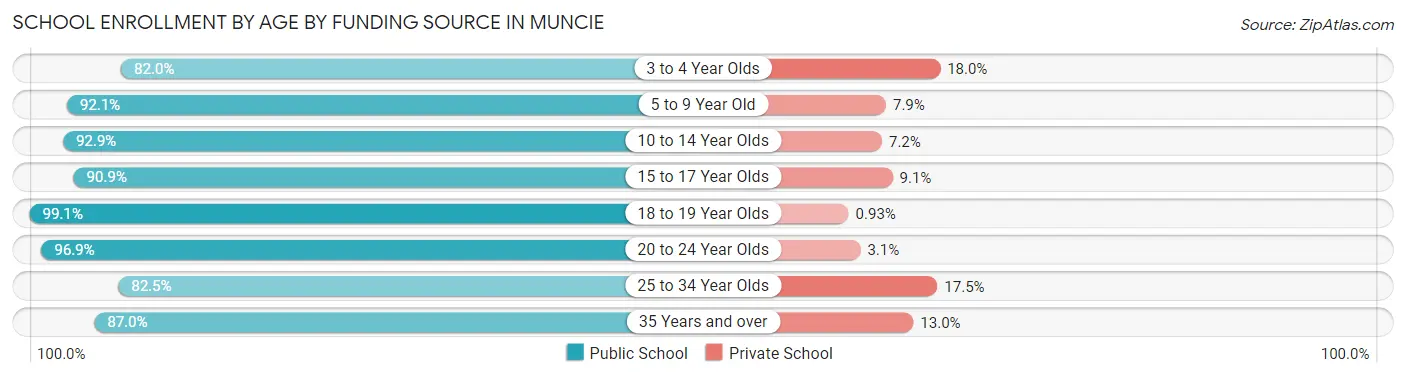
School Enrollment by Age by Funding Source in Muncie
Out of a total of 22,622 students who are enrolled in schools in Muncie, 1,176 (5.2%) attend a private institution, while the remaining 21,446 (94.8%) are enrolled in public schools. The age group of 3 to 4 year olds has the highest likelihood of being enrolled in private schools, with 80 (18.0% in the age bracket) enrolled. Conversely, the age group of 18 to 19 year olds has the lowest likelihood of being enrolled in a private school, with 4,903 (99.1% in the age bracket) attending a public institution.
| Age Bracket | Public School | Private School |
| 3 to 4 Year Olds | 365 (82.0%) | 80 (18.0%) |
| 5 to 9 Year Old | 2,429 (92.1%) | 208 (7.9%) |
| 10 to 14 Year Olds | 2,221 (92.8%) | 171 (7.1%) |
| 15 to 17 Year Olds | 1,657 (90.9%) | 166 (9.1%) |
| 18 to 19 Year Olds | 4,903 (99.1%) | 46 (0.9%) |
| 20 to 24 Year Olds | 8,621 (96.9%) | 279 (3.1%) |
| 25 to 34 Year Olds | 799 (82.5%) | 169 (17.5%) |
| 35 Years and over | 442 (87.0%) | 66 (13.0%) |
| Total | 21,446 (94.8%) | 1,176 (5.2%) |
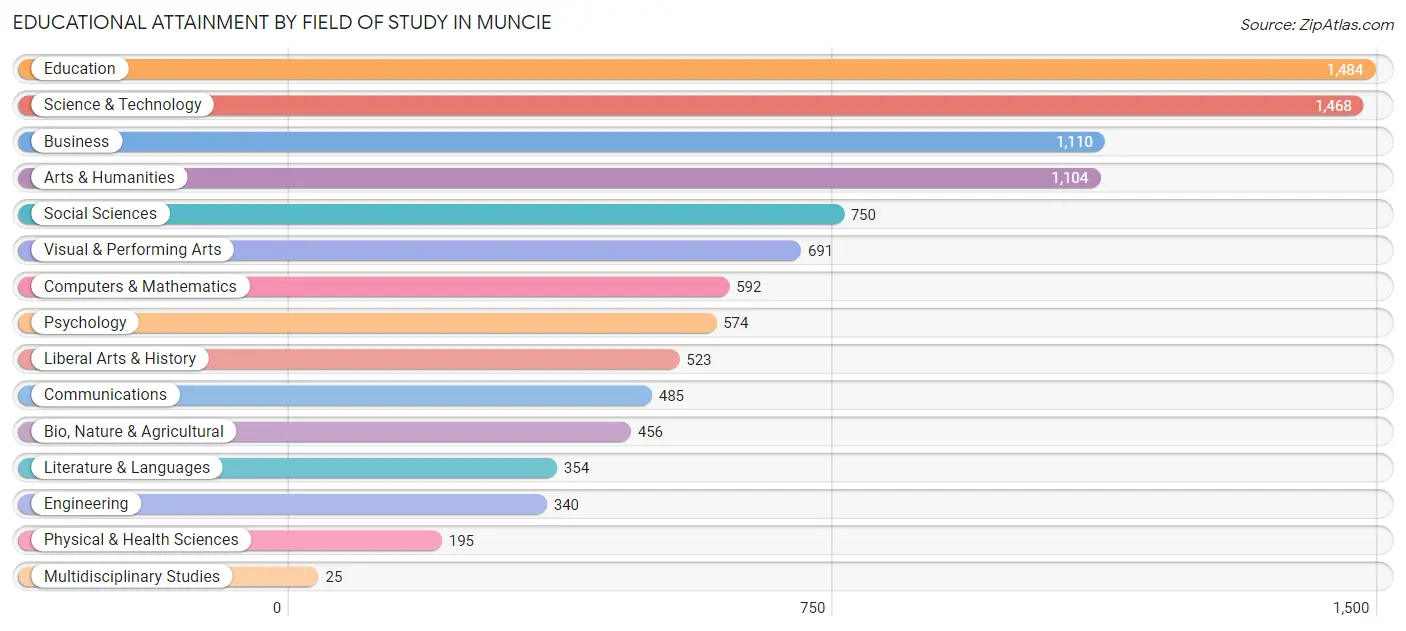
Educational Attainment by Field of Study in Muncie
Education (1,484 | 14.6%), science & technology (1,468 | 14.5%), business (1,110 | 10.9%), arts & humanities (1,104 | 10.9%), and social sciences (750 | 7.4%) are the most common fields of study among 10,151 individuals in Muncie who have obtained a bachelor's degree or higher.
| Field of Study | # Graduates | % Graduates |
| Computers & Mathematics | 592 | 5.8% |
| Bio, Nature & Agricultural | 456 | 4.5% |
| Physical & Health Sciences | 195 | 1.9% |
| Psychology | 574 | 5.7% |
| Social Sciences | 750 | 7.4% |
| Engineering | 340 | 3.4% |
| Multidisciplinary Studies | 25 | 0.3% |
| Science & Technology | 1,468 | 14.5% |
| Business | 1,110 | 10.9% |
| Education | 1,484 | 14.6% |
| Literature & Languages | 354 | 3.5% |
| Liberal Arts & History | 523 | 5.1% |
| Visual & Performing Arts | 691 | 6.8% |
| Communications | 485 | 4.8% |
| Arts & Humanities | 1,104 | 10.9% |
| Total | 10,151 | 100.0% |
Transportation & Commute in Muncie
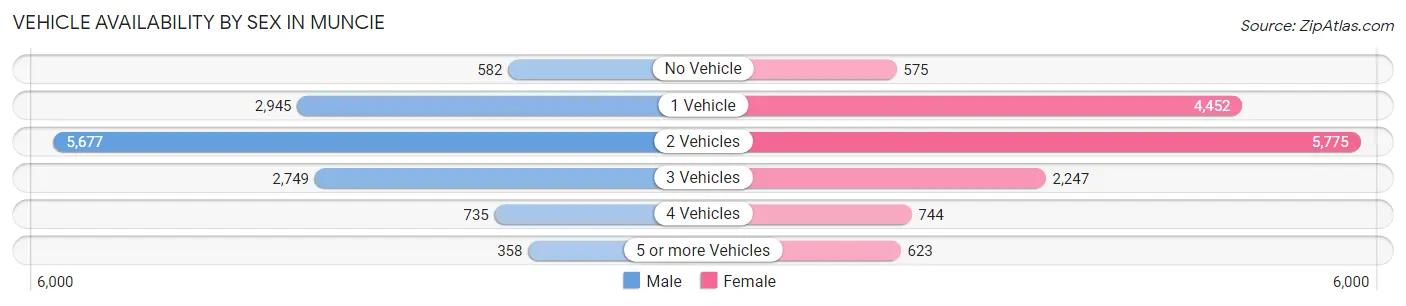
Vehicle Availability by Sex in Muncie
The most prevalent vehicle ownership categories in Muncie are males with 2 vehicles (5,677, accounting for 43.5%) and females with 2 vehicles (5,775, making up 39.4%).
| Vehicles Available | Male | Female |
| No Vehicle | 582 (4.5%) | 575 (4.0%) |
| 1 Vehicle | 2,945 (22.6%) | 4,452 (30.9%) |
| 2 Vehicles | 5,677 (43.5%) | 5,775 (40.1%) |
| 3 Vehicles | 2,749 (21.1%) | 2,247 (15.6%) |
| 4 Vehicles | 735 (5.6%) | 744 (5.2%) |
| 5 or more Vehicles | 358 (2.7%) | 623 (4.3%) |
| Total | 13,046 (100.0%) | 14,416 (100.0%) |
Commute Time in Muncie
The most frequently occuring commute durations in Muncie are 5 to 9 minutes (7,042 commuters, 25.6%), 10 to 14 minutes (5,989 commuters, 21.8%), and 15 to 19 minutes (4,325 commuters, 15.7%).
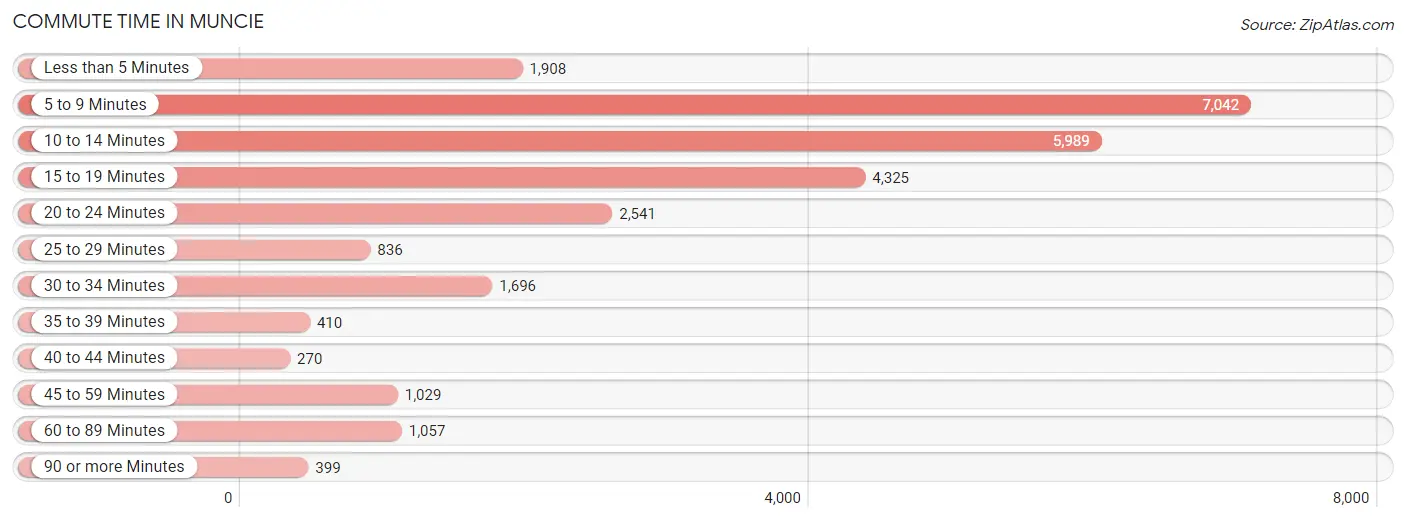
| Commute Time | # Commuters | % Commuters |
| Less than 5 Minutes | 1,908 | 6.9% |
| 5 to 9 Minutes | 7,042 | 25.6% |
| 10 to 14 Minutes | 5,989 | 21.8% |
| 15 to 19 Minutes | 4,325 | 15.7% |
| 20 to 24 Minutes | 2,541 | 9.2% |
| 25 to 29 Minutes | 836 | 3.0% |
| 30 to 34 Minutes | 1,696 | 6.2% |
| 35 to 39 Minutes | 410 | 1.5% |
| 40 to 44 Minutes | 270 | 1.0% |
| 45 to 59 Minutes | 1,029 | 3.7% |
| 60 to 89 Minutes | 1,057 | 3.8% |
| 90 or more Minutes | 399 | 1.5% |
Commute Time by Sex in Muncie
The most common commute times in Muncie are 5 to 9 minutes (3,001 commuters, 22.9%) for males and 5 to 9 minutes (4,041 commuters, 28.1%) for females.
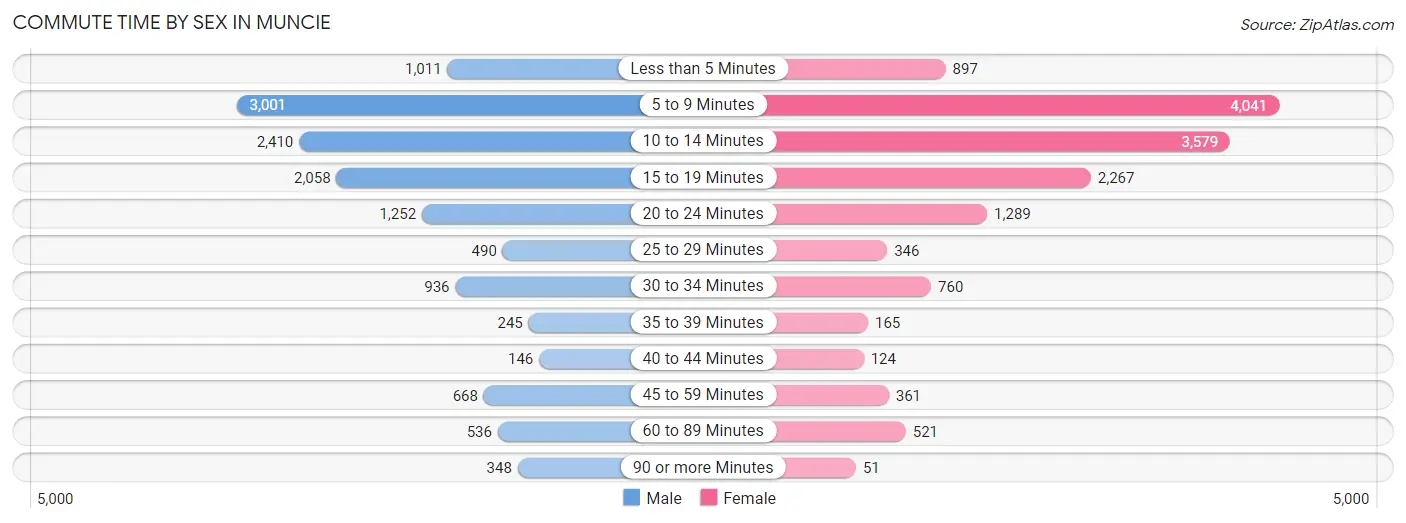
| Commute Time | Male | Female |
| Less than 5 Minutes | 1,011 (7.7%) | 897 (6.2%) |
| 5 to 9 Minutes | 3,001 (22.9%) | 4,041 (28.1%) |
| 10 to 14 Minutes | 2,410 (18.4%) | 3,579 (24.8%) |
| 15 to 19 Minutes | 2,058 (15.7%) | 2,267 (15.7%) |
| 20 to 24 Minutes | 1,252 (9.6%) | 1,289 (8.9%) |
| 25 to 29 Minutes | 490 (3.7%) | 346 (2.4%) |
| 30 to 34 Minutes | 936 (7.1%) | 760 (5.3%) |
| 35 to 39 Minutes | 245 (1.9%) | 165 (1.1%) |
| 40 to 44 Minutes | 146 (1.1%) | 124 (0.9%) |
| 45 to 59 Minutes | 668 (5.1%) | 361 (2.5%) |
| 60 to 89 Minutes | 536 (4.1%) | 521 (3.6%) |
| 90 or more Minutes | 348 (2.7%) | 51 (0.4%) |
Time of Departure to Work by Sex in Muncie
The most frequent times of departure to work in Muncie are 4:00 PM to 11:59 PM (2,085, 15.9%) for males and 7:30 AM to 7:59 AM (2,788, 19.4%) for females.
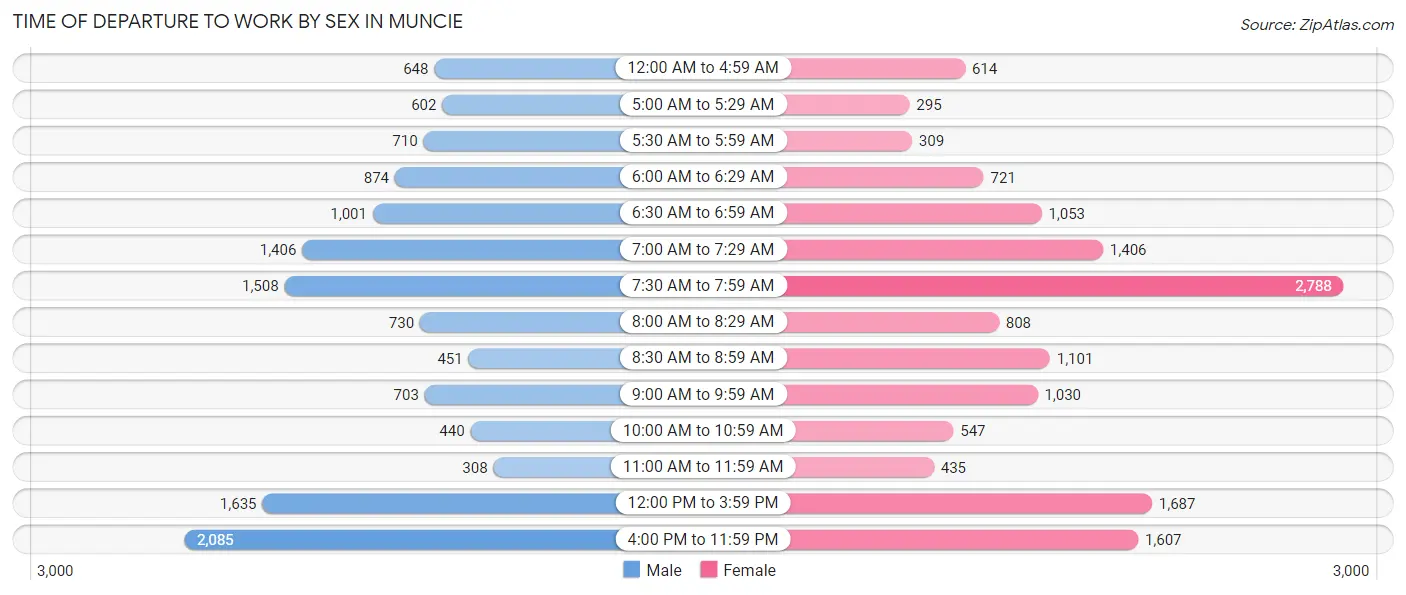
| Time of Departure | Male | Female |
| 12:00 AM to 4:59 AM | 648 (5.0%) | 614 (4.3%) |
| 5:00 AM to 5:29 AM | 602 (4.6%) | 295 (2.1%) |
| 5:30 AM to 5:59 AM | 710 (5.4%) | 309 (2.1%) |
| 6:00 AM to 6:29 AM | 874 (6.7%) | 721 (5.0%) |
| 6:30 AM to 6:59 AM | 1,001 (7.6%) | 1,053 (7.3%) |
| 7:00 AM to 7:29 AM | 1,406 (10.7%) | 1,406 (9.8%) |
| 7:30 AM to 7:59 AM | 1,508 (11.5%) | 2,788 (19.4%) |
| 8:00 AM to 8:29 AM | 730 (5.6%) | 808 (5.6%) |
| 8:30 AM to 8:59 AM | 451 (3.4%) | 1,101 (7.6%) |
| 9:00 AM to 9:59 AM | 703 (5.4%) | 1,030 (7.1%) |
| 10:00 AM to 10:59 AM | 440 (3.4%) | 547 (3.8%) |
| 11:00 AM to 11:59 AM | 308 (2.4%) | 435 (3.0%) |
| 12:00 PM to 3:59 PM | 1,635 (12.5%) | 1,687 (11.7%) |
| 4:00 PM to 11:59 PM | 2,085 (15.9%) | 1,607 (11.2%) |
| Total | 13,101 (100.0%) | 14,401 (100.0%) |
Housing Occupancy in Muncie
Occupancy by Ownership in Muncie
Of the total 26,625 dwellings in Muncie, owner-occupied units account for 13,224 (49.7%), while renter-occupied units make up 13,401 (50.3%).
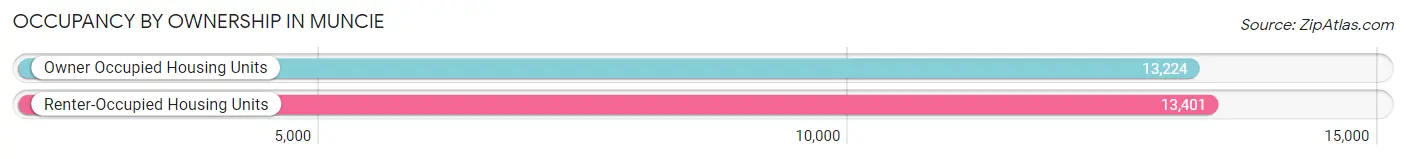
| Occupancy | # Housing Units | % Housing Units |
| Owner Occupied Housing Units | 13,224 | 49.7% |
| Renter-Occupied Housing Units | 13,401 | 50.3% |
| Total Occupied Housing Units | 26,625 | 100.0% |
Occupancy by Household Size in Muncie
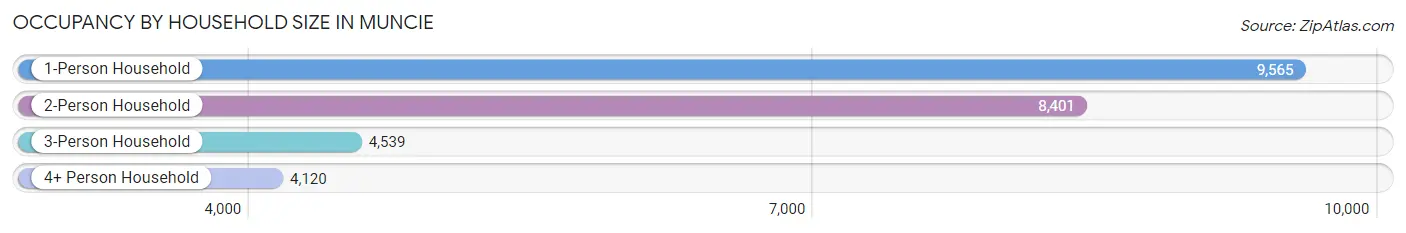
| Household Size | # Housing Units | % Housing Units |
| 1-Person Household | 9,565 | 35.9% |
| 2-Person Household | 8,401 | 31.6% |
| 3-Person Household | 4,539 | 17.1% |
| 4+ Person Household | 4,120 | 15.5% |
| Total Housing Units | 26,625 | 100.0% |
Occupancy by Ownership by Household Size in Muncie
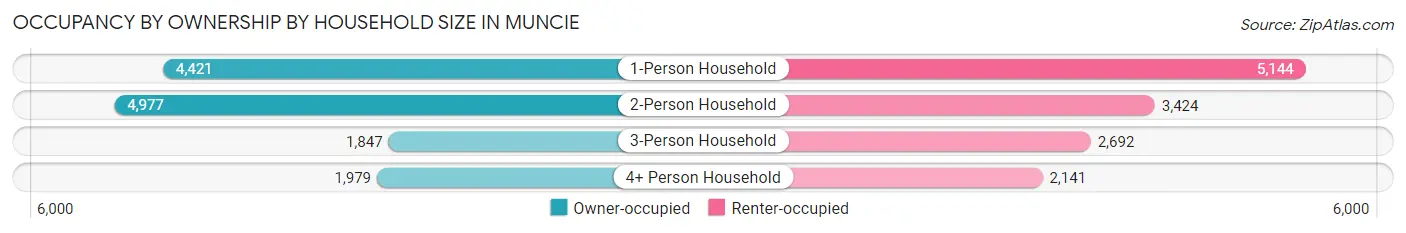
| Household Size | Owner-occupied | Renter-occupied |
| 1-Person Household | 4,421 (46.2%) | 5,144 (53.8%) |
| 2-Person Household | 4,977 (59.2%) | 3,424 (40.8%) |
| 3-Person Household | 1,847 (40.7%) | 2,692 (59.3%) |
| 4+ Person Household | 1,979 (48.0%) | 2,141 (52.0%) |
| Total Housing Units | 13,224 (49.7%) | 13,401 (50.3%) |
Occupancy by Educational Attainment in Muncie
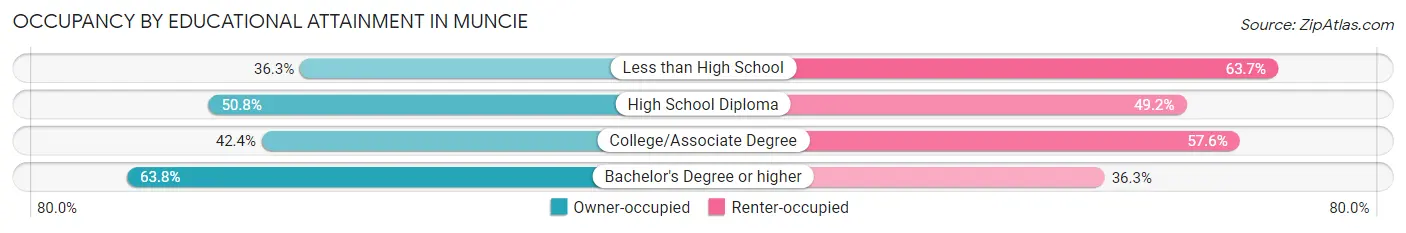
| Household Size | Owner-occupied | Renter-occupied |
| Less than High School | 878 (36.3%) | 1,540 (63.7%) |
| High School Diploma | 3,946 (50.8%) | 3,817 (49.2%) |
| College/Associate Degree | 4,130 (42.4%) | 5,616 (57.6%) |
| Bachelor's Degree or higher | 4,270 (63.7%) | 2,428 (36.2%) |
Occupancy by Age of Householder in Muncie
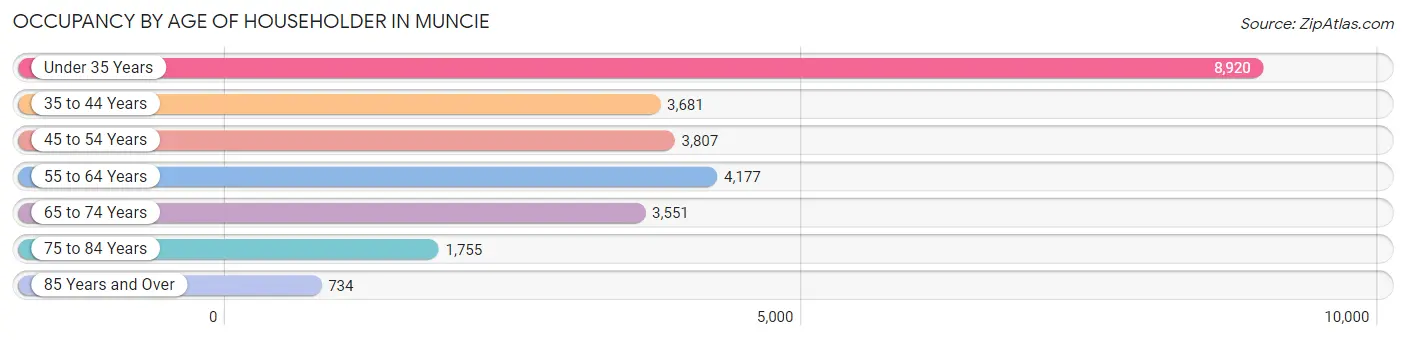
| Age Bracket | # Households | % Households |
| Under 35 Years | 8,920 | 33.5% |
| 35 to 44 Years | 3,681 | 13.8% |
| 45 to 54 Years | 3,807 | 14.3% |
| 55 to 64 Years | 4,177 | 15.7% |
| 65 to 74 Years | 3,551 | 13.3% |
| 75 to 84 Years | 1,755 | 6.6% |
| 85 Years and Over | 734 | 2.8% |
| Total | 26,625 | 100.0% |
Housing Finances in Muncie
Median Income by Occupancy in Muncie
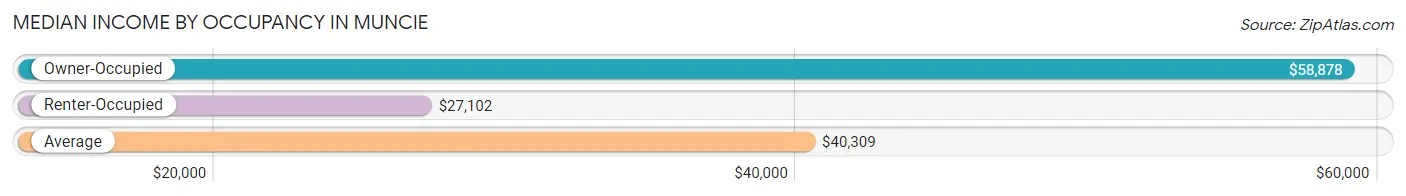
| Occupancy Type | # Households | Median Income |
| Owner-Occupied | 13,224 (49.7%) | $58,878 |
| Renter-Occupied | 13,401 (50.3%) | $27,102 |
| Average | 26,625 (100.0%) | $40,309 |
Occupancy by Householder Income Bracket in Muncie
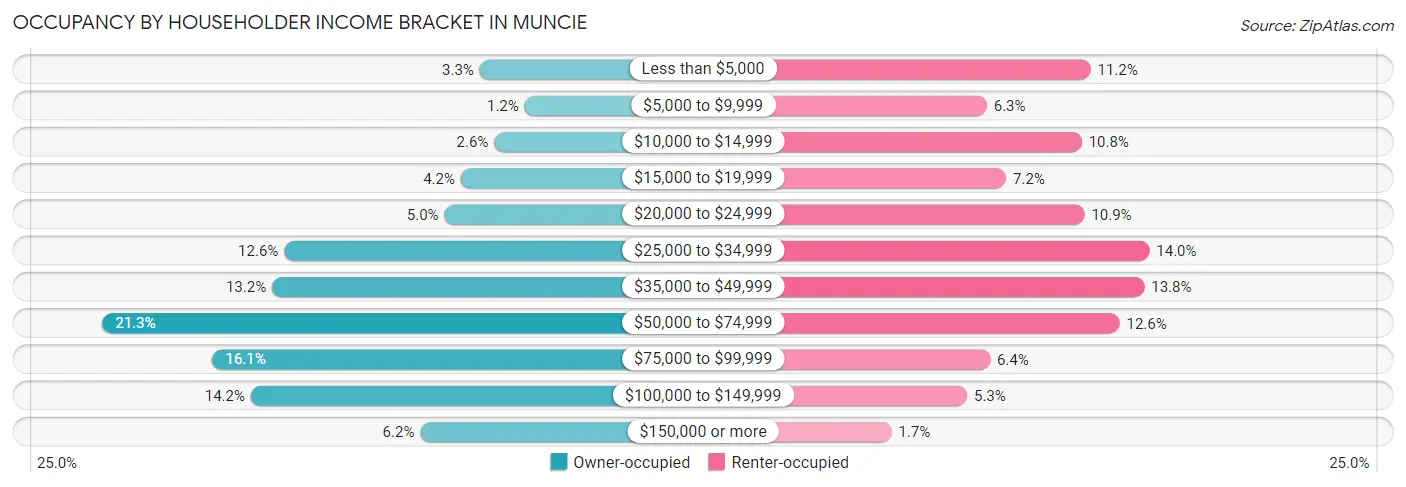
| Income Bracket | Owner-occupied | Renter-occupied |
| Less than $5,000 | 440 (3.3%) | 1,499 (11.2%) |
| $5,000 to $9,999 | 158 (1.2%) | 838 (6.2%) |
| $10,000 to $14,999 | 349 (2.6%) | 1,443 (10.8%) |
| $15,000 to $19,999 | 559 (4.2%) | 961 (7.2%) |
| $20,000 to $24,999 | 662 (5.0%) | 1,461 (10.9%) |
| $25,000 to $34,999 | 1,672 (12.6%) | 1,875 (14.0%) |
| $35,000 to $49,999 | 1,748 (13.2%) | 1,842 (13.8%) |
| $50,000 to $74,999 | 2,817 (21.3%) | 1,685 (12.6%) |
| $75,000 to $99,999 | 2,122 (16.1%) | 857 (6.4%) |
| $100,000 to $149,999 | 1,882 (14.2%) | 711 (5.3%) |
| $150,000 or more | 815 (6.2%) | 229 (1.7%) |
| Total | 13,224 (100.0%) | 13,401 (100.0%) |
Monthly Housing Cost Tiers in Muncie
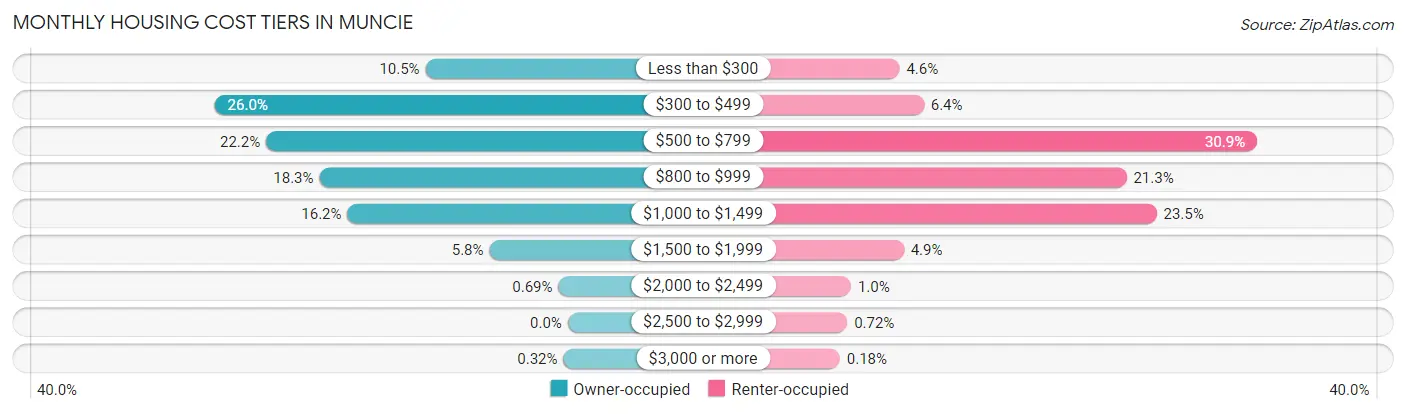
| Monthly Cost | Owner-occupied | Renter-occupied |
| Less than $300 | 1,386 (10.5%) | 612 (4.6%) |
| $300 to $499 | 3,438 (26.0%) | 852 (6.4%) |
| $500 to $799 | 2,939 (22.2%) | 4,141 (30.9%) |
| $800 to $999 | 2,419 (18.3%) | 2,853 (21.3%) |
| $1,000 to $1,499 | 2,146 (16.2%) | 3,149 (23.5%) |
| $1,500 to $1,999 | 763 (5.8%) | 654 (4.9%) |
| $2,000 to $2,499 | 91 (0.7%) | 134 (1.0%) |
| $2,500 to $2,999 | 0 (0.0%) | 96 (0.7%) |
| $3,000 or more | 42 (0.3%) | 24 (0.2%) |
| Total | 13,224 (100.0%) | 13,401 (100.0%) |
Physical Housing Characteristics in Muncie
Housing Structures in Muncie
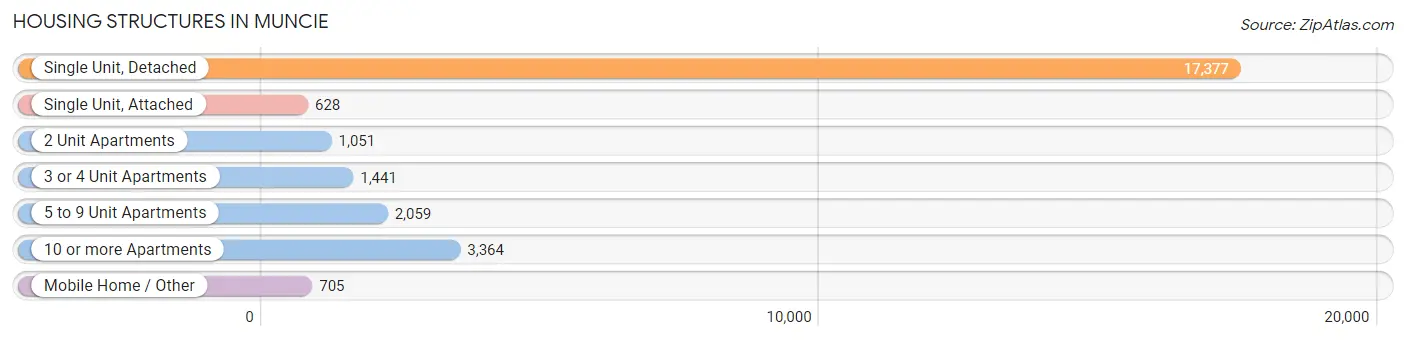
| Structure Type | # Housing Units | % Housing Units |
| Single Unit, Detached | 17,377 | 65.3% |
| Single Unit, Attached | 628 | 2.4% |
| 2 Unit Apartments | 1,051 | 4.0% |
| 3 or 4 Unit Apartments | 1,441 | 5.4% |
| 5 to 9 Unit Apartments | 2,059 | 7.7% |
| 10 or more Apartments | 3,364 | 12.6% |
| Mobile Home / Other | 705 | 2.6% |
| Total | 26,625 | 100.0% |
Housing Structures by Occupancy in Muncie
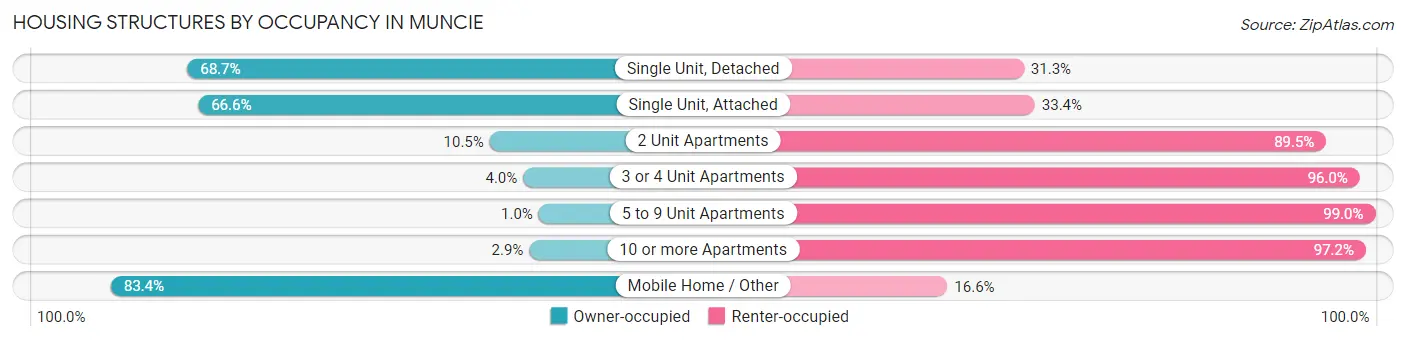
| Structure Type | Owner-occupied | Renter-occupied |
| Single Unit, Detached | 11,933 (68.7%) | 5,444 (31.3%) |
| Single Unit, Attached | 418 (66.6%) | 210 (33.4%) |
| 2 Unit Apartments | 110 (10.5%) | 941 (89.5%) |
| 3 or 4 Unit Apartments | 58 (4.0%) | 1,383 (96.0%) |
| 5 to 9 Unit Apartments | 21 (1.0%) | 2,038 (99.0%) |
| 10 or more Apartments | 96 (2.9%) | 3,268 (97.2%) |
| Mobile Home / Other | 588 (83.4%) | 117 (16.6%) |
| Total | 13,224 (49.7%) | 13,401 (50.3%) |
Housing Structures by Number of Rooms in Muncie
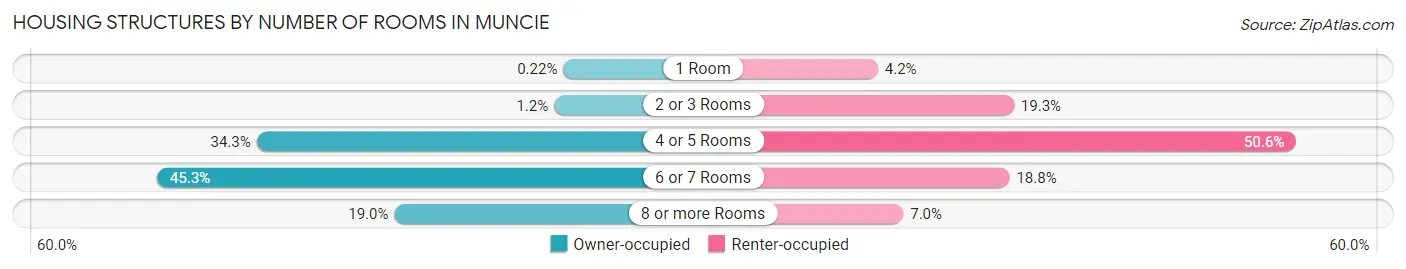
| Number of Rooms | Owner-occupied | Renter-occupied |
| 1 Room | 29 (0.2%) | 564 (4.2%) |
| 2 or 3 Rooms | 164 (1.2%) | 2,588 (19.3%) |
| 4 or 5 Rooms | 4,530 (34.3%) | 6,785 (50.6%) |
| 6 or 7 Rooms | 5,992 (45.3%) | 2,522 (18.8%) |
| 8 or more Rooms | 2,509 (19.0%) | 942 (7.0%) |
| Total | 13,224 (100.0%) | 13,401 (100.0%) |
Housing Structure by Heating Type in Muncie
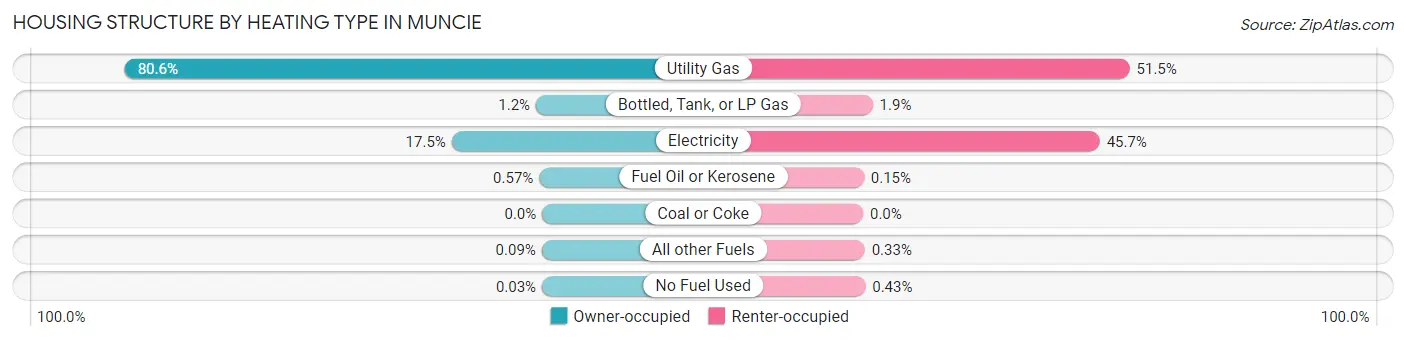
| Heating Type | Owner-occupied | Renter-occupied |
| Utility Gas | 10,664 (80.6%) | 6,903 (51.5%) |
| Bottled, Tank, or LP Gas | 158 (1.2%) | 249 (1.9%) |
| Electricity | 2,311 (17.5%) | 6,128 (45.7%) |
| Fuel Oil or Kerosene | 75 (0.6%) | 20 (0.2%) |
| Coal or Coke | 0 (0.0%) | 0 (0.0%) |
| All other Fuels | 12 (0.1%) | 44 (0.3%) |
| No Fuel Used | 4 (0.0%) | 57 (0.4%) |
| Total | 13,224 (100.0%) | 13,401 (100.0%) |
Household Vehicle Usage in Muncie
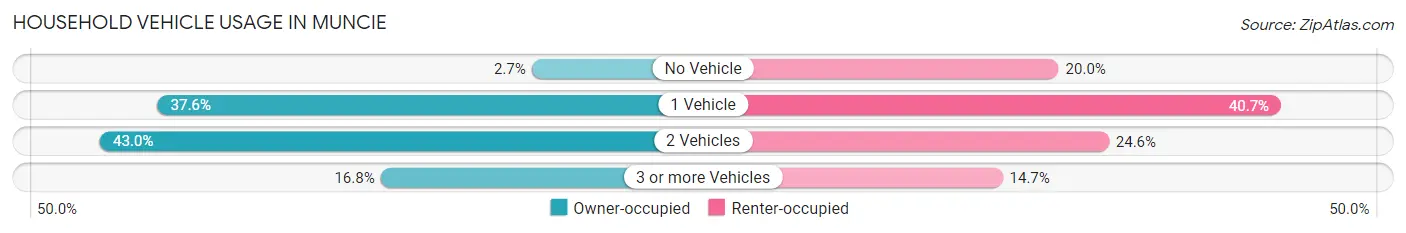
| Vehicles per Household | Owner-occupied | Renter-occupied |
| No Vehicle | 355 (2.7%) | 2,673 (20.0%) |
| 1 Vehicle | 4,970 (37.6%) | 5,454 (40.7%) |
| 2 Vehicles | 5,680 (42.9%) | 3,302 (24.6%) |
| 3 or more Vehicles | 2,219 (16.8%) | 1,972 (14.7%) |
| Total | 13,224 (100.0%) | 13,401 (100.0%) |
Real Estate & Mortgages in Muncie
Real Estate and Mortgage Overview in Muncie
| Characteristic | Without Mortgage | With Mortgage |
| Housing Units | 6,121 | 7,103 |
| Median Property Value | $73,800 | $98,200 |
| Median Household Income | $47,679 | $527 |
| Monthly Housing Costs | $398 | $42 |
| Real Estate Taxes | $751 | $144 |
Property Value by Mortgage Status in Muncie
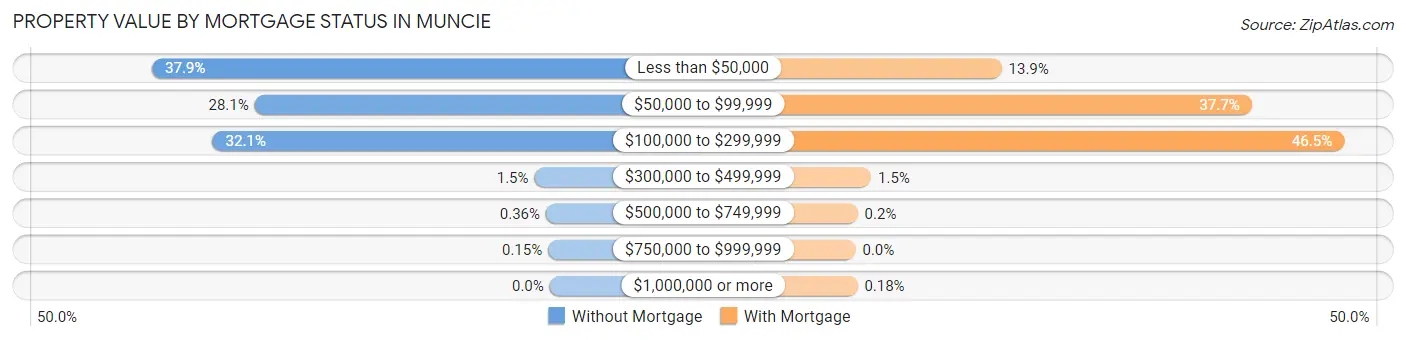
| Property Value | Without Mortgage | With Mortgage |
| Less than $50,000 | 2,317 (37.9%) | 988 (13.9%) |
| $50,000 to $99,999 | 1,720 (28.1%) | 2,679 (37.7%) |
| $100,000 to $299,999 | 1,964 (32.1%) | 3,304 (46.5%) |
| $300,000 to $499,999 | 89 (1.5%) | 105 (1.5%) |
| $500,000 to $749,999 | 22 (0.4%) | 14 (0.2%) |
| $750,000 to $999,999 | 9 (0.2%) | 0 (0.0%) |
| $1,000,000 or more | 0 (0.0%) | 13 (0.2%) |
| Total | 6,121 (100.0%) | 7,103 (100.0%) |
Household Income by Mortgage Status in Muncie
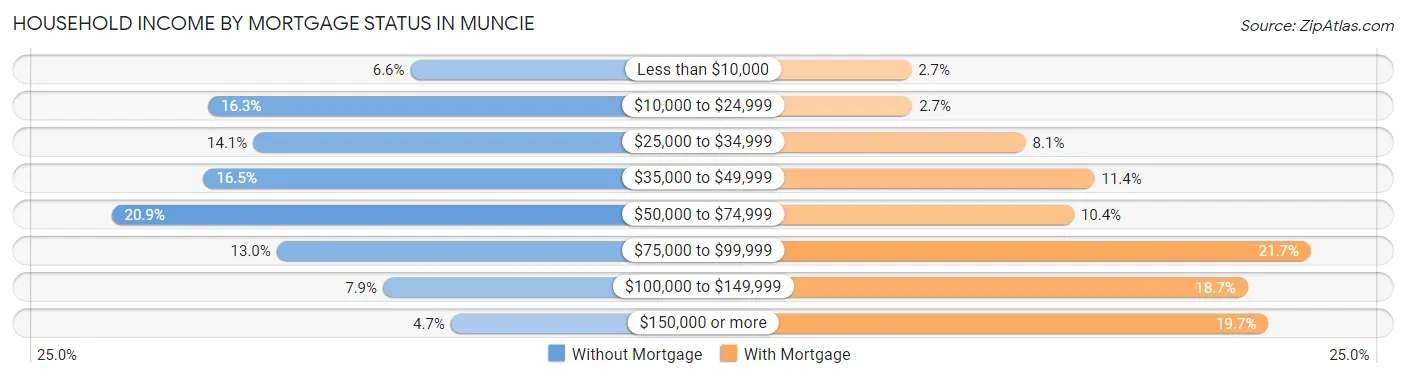
| Household Income | Without Mortgage | With Mortgage |
| Less than $10,000 | 406 (6.6%) | 188 (2.6%) |
| $10,000 to $24,999 | 995 (16.3%) | 192 (2.7%) |
| $25,000 to $34,999 | 864 (14.1%) | 575 (8.1%) |
| $35,000 to $49,999 | 1,009 (16.5%) | 808 (11.4%) |
| $50,000 to $74,999 | 1,277 (20.9%) | 739 (10.4%) |
| $75,000 to $99,999 | 796 (13.0%) | 1,540 (21.7%) |
| $100,000 to $149,999 | 486 (7.9%) | 1,326 (18.7%) |
| $150,000 or more | 288 (4.7%) | 1,396 (19.7%) |
| Total | 6,121 (100.0%) | 7,103 (100.0%) |
Property Value to Household Income Ratio in Muncie
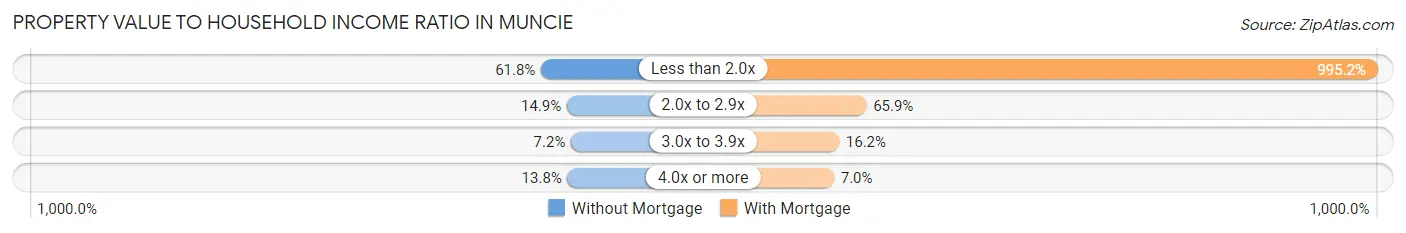
| Value-to-Income Ratio | Without Mortgage | With Mortgage |
| Less than 2.0x | 3,781 (61.8%) | 70,687 (995.2%) |
| 2.0x to 2.9x | 912 (14.9%) | 4,681 (65.9%) |
| 3.0x to 3.9x | 443 (7.2%) | 1,149 (16.2%) |
| 4.0x or more | 844 (13.8%) | 495 (7.0%) |
| Total | 6,121 (100.0%) | 7,103 (100.0%) |
Real Estate Taxes by Mortgage Status in Muncie
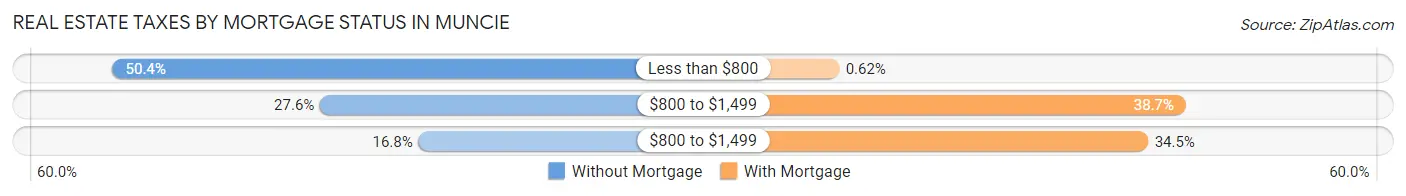
| Property Taxes | Without Mortgage | With Mortgage |
| Less than $800 | 3,082 (50.3%) | 44 (0.6%) |
| $800 to $1,499 | 1,690 (27.6%) | 2,746 (38.7%) |
| $800 to $1,499 | 1,030 (16.8%) | 2,449 (34.5%) |
| Total | 6,121 (100.0%) | 7,103 (100.0%) |
Health & Disability in Muncie
Health Insurance Coverage by Age in Muncie
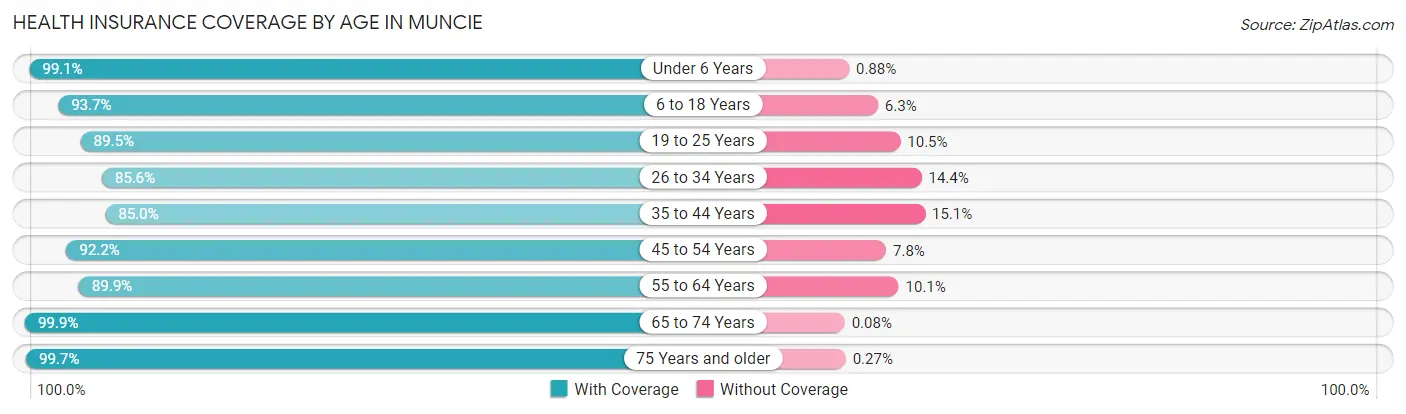
| Age Bracket | With Coverage | Without Coverage |
| Under 6 Years | 3,596 (99.1%) | 32 (0.9%) |
| 6 to 18 Years | 8,403 (93.7%) | 562 (6.3%) |
| 19 to 25 Years | 15,372 (89.5%) | 1,796 (10.5%) |
| 26 to 34 Years | 6,039 (85.6%) | 1,017 (14.4%) |
| 35 to 44 Years | 5,216 (85.0%) | 924 (15.0%) |
| 45 to 54 Years | 5,606 (92.2%) | 474 (7.8%) |
| 55 to 64 Years | 5,950 (89.9%) | 671 (10.1%) |
| 65 to 74 Years | 4,919 (99.9%) | 4 (0.1%) |
| 75 Years and older | 3,332 (99.7%) | 9 (0.3%) |
| Total | 58,433 (91.4%) | 5,489 (8.6%) |
Health Insurance Coverage by Citizenship Status in Muncie
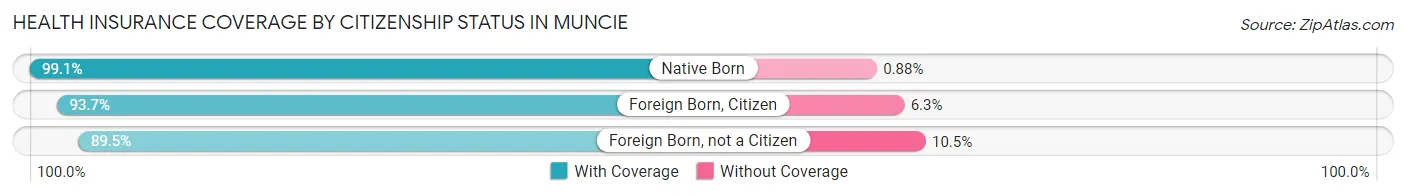
| Citizenship Status | With Coverage | Without Coverage |
| Native Born | 3,596 (99.1%) | 32 (0.9%) |
| Foreign Born, Citizen | 8,403 (93.7%) | 562 (6.3%) |
| Foreign Born, not a Citizen | 15,372 (89.5%) | 1,796 (10.5%) |
Health Insurance Coverage by Household Income in Muncie
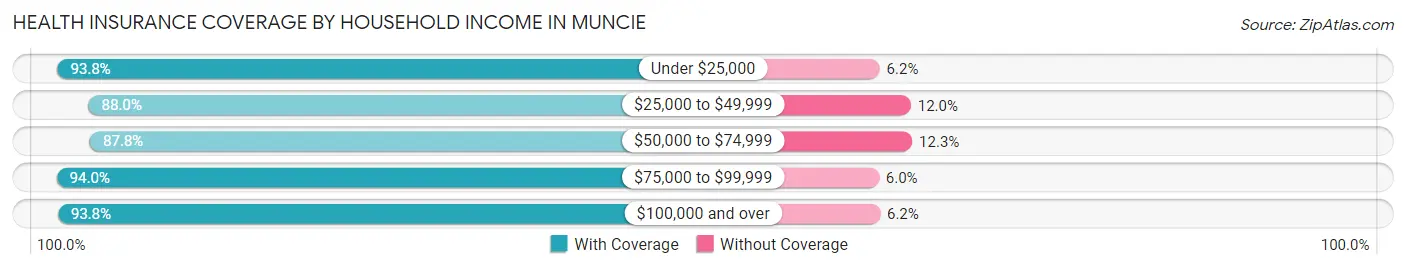
| Household Income | With Coverage | Without Coverage |
| Under $25,000 | 13,553 (93.8%) | 889 (6.2%) |
| $25,000 to $49,999 | 13,133 (88.0%) | 1,790 (12.0%) |
| $50,000 to $74,999 | 9,318 (87.7%) | 1,301 (12.2%) |
| $75,000 to $99,999 | 7,570 (94.0%) | 484 (6.0%) |
| $100,000 and over | 9,443 (93.8%) | 627 (6.2%) |
Public vs Private Health Insurance Coverage by Age in Muncie
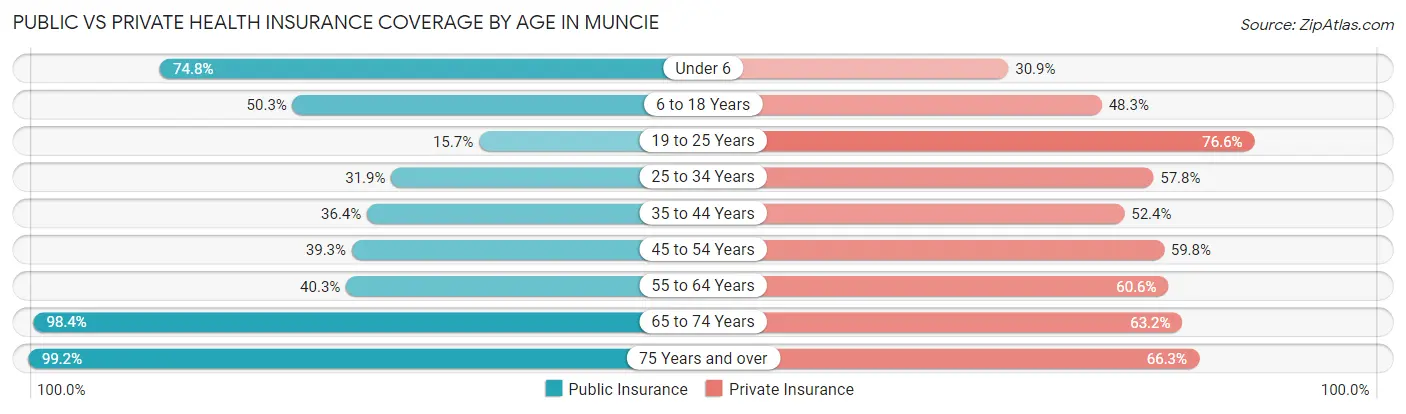
| Age Bracket | Public Insurance | Private Insurance |
| Under 6 | 2,715 (74.8%) | 1,121 (30.9%) |
| 6 to 18 Years | 4,505 (50.2%) | 4,326 (48.2%) |
| 19 to 25 Years | 2,688 (15.7%) | 13,148 (76.6%) |
| 25 to 34 Years | 2,254 (31.9%) | 4,080 (57.8%) |
| 35 to 44 Years | 2,237 (36.4%) | 3,219 (52.4%) |
| 45 to 54 Years | 2,387 (39.3%) | 3,634 (59.8%) |
| 55 to 64 Years | 2,669 (40.3%) | 4,013 (60.6%) |
| 65 to 74 Years | 4,842 (98.4%) | 3,111 (63.2%) |
| 75 Years and over | 3,315 (99.2%) | 2,214 (66.3%) |
| Total | 27,612 (43.2%) | 38,866 (60.8%) |
Disability Status by Sex by Age in Muncie
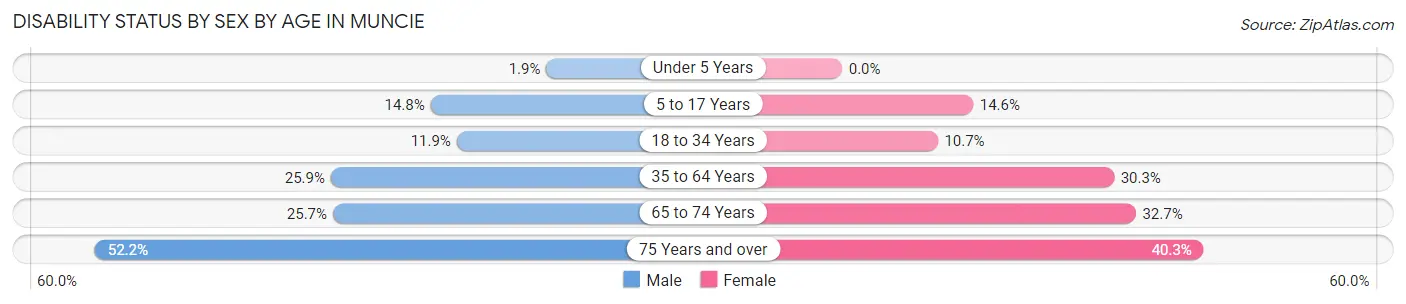
| Age Bracket | Male | Female |
| Under 5 Years | 29 (1.9%) | 0 (0.0%) |
| 5 to 17 Years | 534 (14.8%) | 531 (14.6%) |
| 18 to 34 Years | 1,489 (11.9%) | 1,500 (10.6%) |
| 35 to 64 Years | 2,353 (25.9%) | 2,954 (30.3%) |
| 65 to 74 Years | 511 (25.7%) | 959 (32.7%) |
| 75 Years and over | 635 (52.2%) | 856 (40.3%) |
Disability Class by Sex by Age in Muncie
Disability Class: Hearing Difficulty
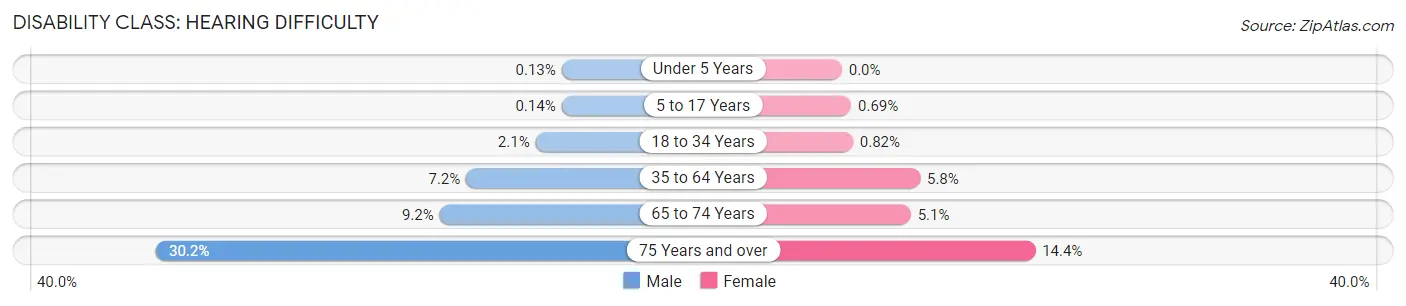
| Age Bracket | Male | Female |
| Under 5 Years | 2 (0.1%) | 0 (0.0%) |
| 5 to 17 Years | 5 (0.1%) | 25 (0.7%) |
| 18 to 34 Years | 259 (2.1%) | 116 (0.8%) |
| 35 to 64 Years | 656 (7.2%) | 567 (5.8%) |
| 65 to 74 Years | 183 (9.2%) | 150 (5.1%) |
| 75 Years and over | 368 (30.2%) | 305 (14.4%) |
Disability Class: Vision Difficulty
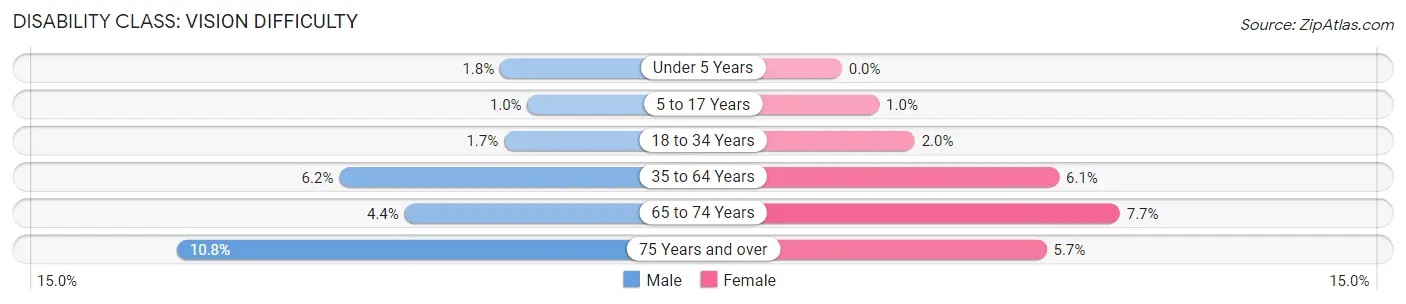
| Age Bracket | Male | Female |
| Under 5 Years | 27 (1.8%) | 0 (0.0%) |
| 5 to 17 Years | 36 (1.0%) | 38 (1.0%) |
| 18 to 34 Years | 207 (1.7%) | 286 (2.0%) |
| 35 to 64 Years | 567 (6.2%) | 590 (6.0%) |
| 65 to 74 Years | 88 (4.4%) | 227 (7.7%) |
| 75 Years and over | 131 (10.8%) | 121 (5.7%) |
Disability Class: Cognitive Difficulty
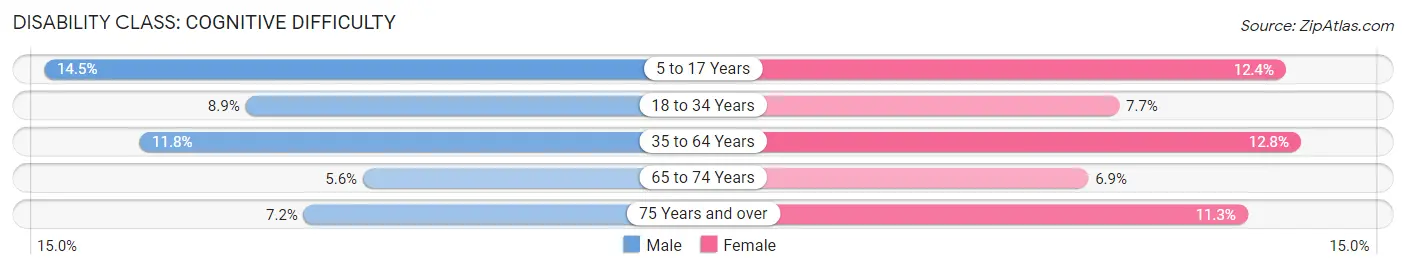
| Age Bracket | Male | Female |
| 5 to 17 Years | 522 (14.5%) | 450 (12.4%) |
| 18 to 34 Years | 1,109 (8.8%) | 1,087 (7.7%) |
| 35 to 64 Years | 1,073 (11.8%) | 1,247 (12.8%) |
| 65 to 74 Years | 111 (5.6%) | 201 (6.9%) |
| 75 Years and over | 88 (7.2%) | 240 (11.3%) |
Disability Class: Ambulatory Difficulty
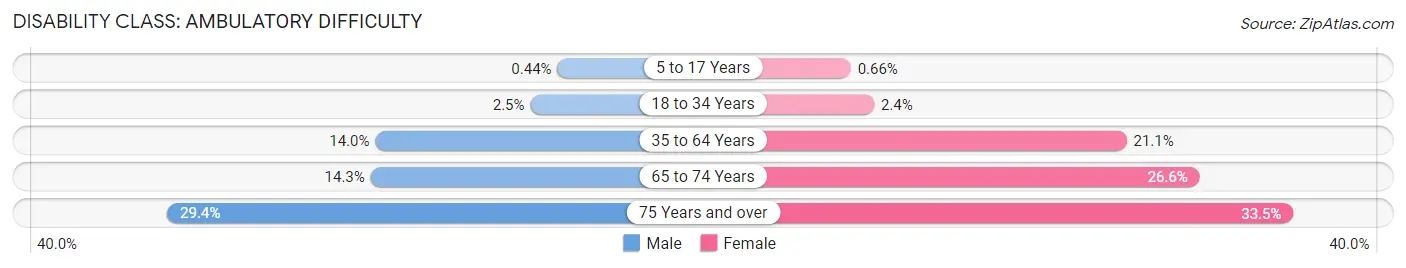
| Age Bracket | Male | Female |
| 5 to 17 Years | 16 (0.4%) | 24 (0.7%) |
| 18 to 34 Years | 307 (2.5%) | 336 (2.4%) |
| 35 to 64 Years | 1,268 (14.0%) | 2,063 (21.1%) |
| 65 to 74 Years | 285 (14.3%) | 779 (26.6%) |
| 75 Years and over | 358 (29.4%) | 712 (33.5%) |
Disability Class: Self-Care Difficulty
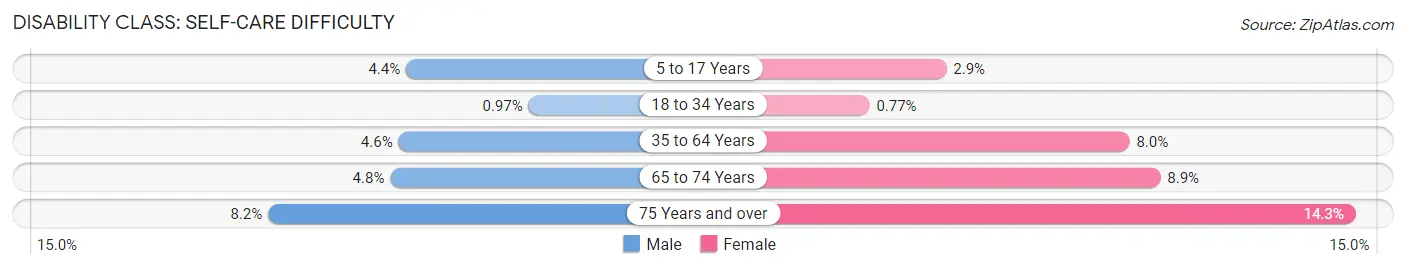
| Age Bracket | Male | Female |
| 5 to 17 Years | 158 (4.4%) | 106 (2.9%) |
| 18 to 34 Years | 122 (1.0%) | 108 (0.8%) |
| 35 to 64 Years | 417 (4.6%) | 782 (8.0%) |
| 65 to 74 Years | 96 (4.8%) | 260 (8.9%) |
| 75 Years and over | 100 (8.2%) | 304 (14.3%) |
Technology Access in Muncie
Computing Device Access in Muncie
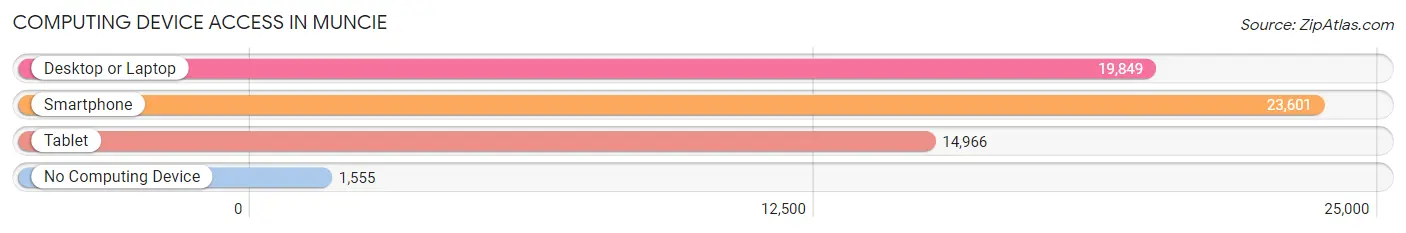
| Device Type | # Households | % Households |
| Desktop or Laptop | 19,849 | 74.6% |
| Smartphone | 23,601 | 88.6% |
| Tablet | 14,966 | 56.2% |
| No Computing Device | 1,555 | 5.8% |
| Total | 26,625 | 100.0% |
Internet Access in Muncie
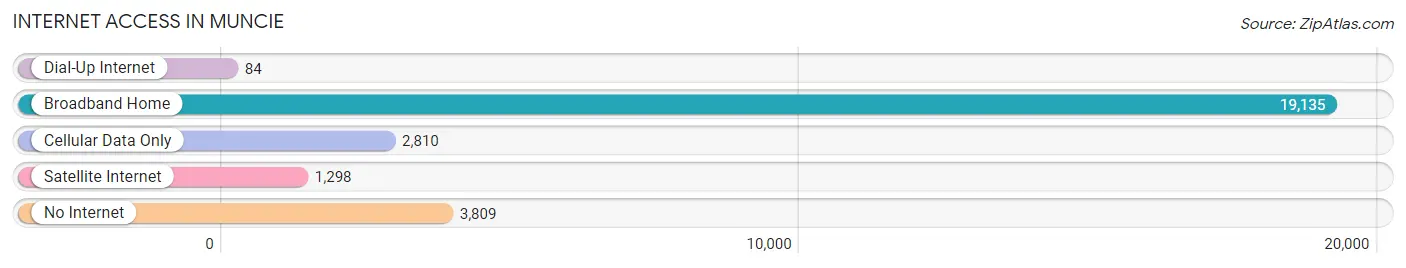
| Internet Type | # Households | % Households |
| Dial-Up Internet | 84 | 0.3% |
| Broadband Home | 19,135 | 71.9% |
| Cellular Data Only | 2,810 | 10.5% |
| Satellite Internet | 1,298 | 4.9% |
| No Internet | 3,809 | 14.3% |
| Total | 26,625 | 100.0% |
Muncie Summary
Muncie, Indiana is a city located in Delaware County in the east-central part of the state. It is the county seat and the largest city in the county. The city is situated along the White River and is home to Ball State University. The city has a population of 70,085 as of the 2020 census, making it the sixth-largest city in Indiana.
History
Muncie was founded in 1845 by a group of settlers from Munsee Town, a Lenape Indian village located in what is now Delaware County. The settlers named the town after their former home. The city was incorporated in 1865 and quickly grew to become a major industrial center. The city was home to several factories, including the Ball Brothers Glass Manufacturing Company, which was founded in 1880 and became the largest glass manufacturer in the world. The company was later renamed Ball Corporation and is still headquartered in Muncie.
The city was also home to the Muncie Automobile Company, which produced cars from 1902 to 1924. The company was later acquired by General Motors and became the Muncie Transmission Division. The city was also home to the Muncie Power Products Company, which produced engines and transmissions for industrial and agricultural applications.
Geography
Muncie is located in east-central Indiana, approximately 60 miles northeast of Indianapolis. The city is situated along the White River and is surrounded by rolling hills and farmland. The city has a total area of 24.3 square miles, of which 24.2 square miles is land and 0.1 square miles is water.
Economy
Muncie is home to a diverse economy, with a variety of industries and businesses. The city is home to several major employers, including Ball Corporation, which is the largest employer in the city. Other major employers include the Muncie Community Schools, IU Health Ball Memorial Hospital, and the Muncie Sanitary District. The city is also home to several manufacturing companies, including BorgWarner, which produces automotive parts, and Magna Powertrain, which produces transmissions and other automotive components.
Demographics
As of the 2020 census, the population of Muncie was 70,085. The city has a population density of 2,890 people per square mile. The median age in the city is 33.7 years, and the median household income is $41,945. The city is majority white (77.2%), with African Americans making up the largest minority group (14.2%). Other minority groups include Hispanics (4.3%), Asians (2.2%), and Native Americans (0.5%).
Muncie is a diverse city with a rich history and a vibrant economy. The city is home to a variety of industries and businesses, and is a great place to live, work, and play. With its diverse population and strong economy, Muncie is a great place to call home.
Common Questions
What is Per Capita Income in Muncie?
Per Capita income in Muncie is $23,415.
What is the Median Family Income in Muncie?
Median Family Income in Muncie is $55,415.
What is the Median Household income in Muncie?
Median Household Income in Muncie is $40,309.
What is Income or Wage Gap in Muncie?
Income or Wage Gap in Muncie is 33.6%.
Women in Muncie earn 66.4 cents for every dollar earned by a man.
What is Family Income Deficit in Muncie?
Family Income Deficit in Muncie is $10,393.
Families that are below poverty line in Muncie earn $10,393 less on average than the poverty threshold level.
What is Inequality or Gini Index in Muncie?
Inequality or Gini Index in Muncie is 0.46.
What is the Total Population of Muncie?
Total Population of Muncie is 65,167.
What is the Total Male Population of Muncie?
Total Male Population of Muncie is 30,577.
What is the Total Female Population of Muncie?
Total Female Population of Muncie is 34,590.
What is the Ratio of Males per 100 Females in Muncie?
There are 88.40 Males per 100 Females in Muncie.
What is the Ratio of Females per 100 Males in Muncie?
There are 113.12 Females per 100 Males in Muncie.
What is the Median Population Age in Muncie?
Median Population Age in Muncie is 29.0 Years.
What is the Average Family Size in Muncie
Average Family Size in Muncie is 2.8 People.
What is the Average Household Size in Muncie
Average Household Size in Muncie is 2.2 People.
How Large is the Labor Force in Muncie?
There are 32,709 People in the Labor Forcein in Muncie.
What is the Percentage of People in the Labor Force in Muncie?
58.2% of People are in the Labor Force in Muncie.
What is the Unemployment Rate in Muncie?
Unemployment Rate in Muncie is 8.2%.