Terre Haute, IN Map & Demographics
Terre Haute Map
Terre Haute Overview
$24,448
PER CAPITA INCOME
$56,841
AVG FAMILY INCOME
$41,230
AVG HOUSEHOLD INCOME
33.6%
WAGE / INCOME GAP [ % ]
66.4¢/ $1
WAGE / INCOME GAP [ $ ]
$10,613
FAMILY INCOME DEFICIT
0.49
INEQUALITY / GINI INDEX
58,599
TOTAL POPULATION
29,634
MALE POPULATION
28,965
FEMALE POPULATION
102.31
MALES / 100 FEMALES
97.74
FEMALES / 100 MALES
32.4
MEDIAN AGE
3.0
AVG FAMILY SIZE
2.2
AVG HOUSEHOLD SIZE
26,620
LABOR FORCE [ PEOPLE ]
55.2%
PERCENT IN LABOR FORCE
7.5%
UNEMPLOYMENT RATE
Terre Haute Area Codes
Income in Terre Haute
Income Overview in Terre Haute
Per Capita Income in Terre Haute is $24,448, while median incomes of families and households are $56,841 and $41,230 respectively.
| Characteristic | Number | Measure |
| Per Capita Income | 58,599 | $24,448 |
| Median Family Income | 11,711 | $56,841 |
| Mean Family Income | 11,711 | $75,061 |
| Median Household Income | 23,088 | $41,230 |
| Mean Household Income | 23,088 | $58,945 |
| Income Deficit | 11,711 | $10,613 |
| Wage / Income Gap (%) | 58,599 | 33.56% |
| Wage / Income Gap ($) | 58,599 | 66.44¢ per $1 |
| Gini / Inequality Index | 58,599 | 0.49 |
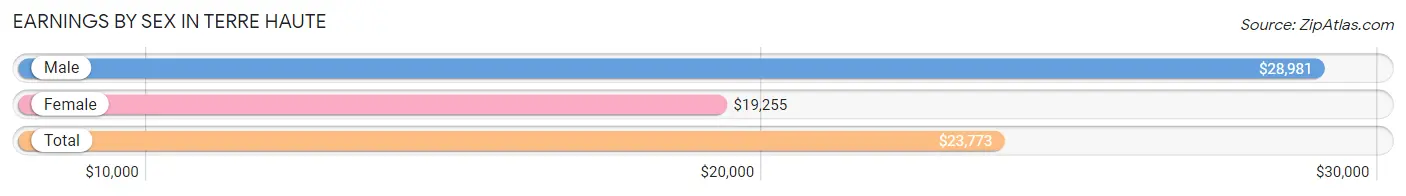
Earnings by Sex in Terre Haute
Average Earnings in Terre Haute are $23,773, $28,981 for men and $19,255 for women, a difference of 33.6%.
| Sex | Number | Average Earnings |
| Male | 15,481 (51.3%) | $28,981 |
| Female | 14,713 (48.7%) | $19,255 |
| Total | 30,194 (100.0%) | $23,773 |
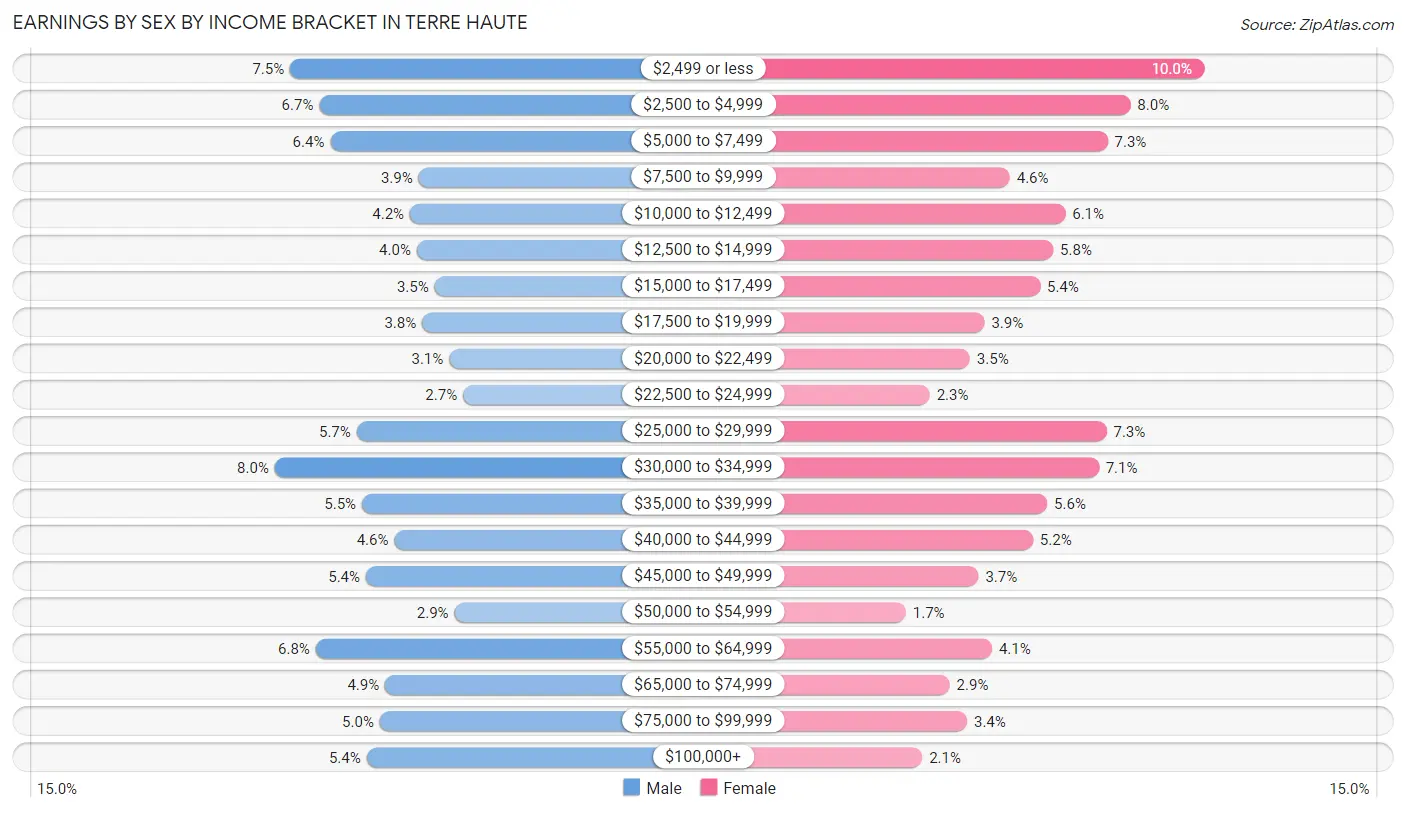
Earnings by Sex by Income Bracket in Terre Haute
The most common earnings brackets in Terre Haute are $30,000 to $34,999 for men (1,234 | 8.0%) and $2,499 or less for women (1,475 | 10.0%).
| Income | Male | Female |
| $2,499 or less | 1,167 (7.5%) | 1,475 (10.0%) |
| $2,500 to $4,999 | 1,040 (6.7%) | 1,173 (8.0%) |
| $5,000 to $7,499 | 992 (6.4%) | 1,079 (7.3%) |
| $7,500 to $9,999 | 608 (3.9%) | 674 (4.6%) |
| $10,000 to $12,499 | 645 (4.2%) | 904 (6.1%) |
| $12,500 to $14,999 | 616 (4.0%) | 853 (5.8%) |
| $15,000 to $17,499 | 539 (3.5%) | 799 (5.4%) |
| $17,500 to $19,999 | 593 (3.8%) | 569 (3.9%) |
| $20,000 to $22,499 | 476 (3.1%) | 509 (3.5%) |
| $22,500 to $24,999 | 415 (2.7%) | 343 (2.3%) |
| $25,000 to $29,999 | 877 (5.7%) | 1,074 (7.3%) |
| $30,000 to $34,999 | 1,234 (8.0%) | 1,041 (7.1%) |
| $35,000 to $39,999 | 855 (5.5%) | 828 (5.6%) |
| $40,000 to $44,999 | 713 (4.6%) | 770 (5.2%) |
| $45,000 to $49,999 | 837 (5.4%) | 544 (3.7%) |
| $50,000 to $54,999 | 452 (2.9%) | 244 (1.7%) |
| $55,000 to $64,999 | 1,056 (6.8%) | 600 (4.1%) |
| $65,000 to $74,999 | 754 (4.9%) | 425 (2.9%) |
| $75,000 to $99,999 | 777 (5.0%) | 497 (3.4%) |
| $100,000+ | 835 (5.4%) | 312 (2.1%) |
| Total | 15,481 (100.0%) | 14,713 (100.0%) |
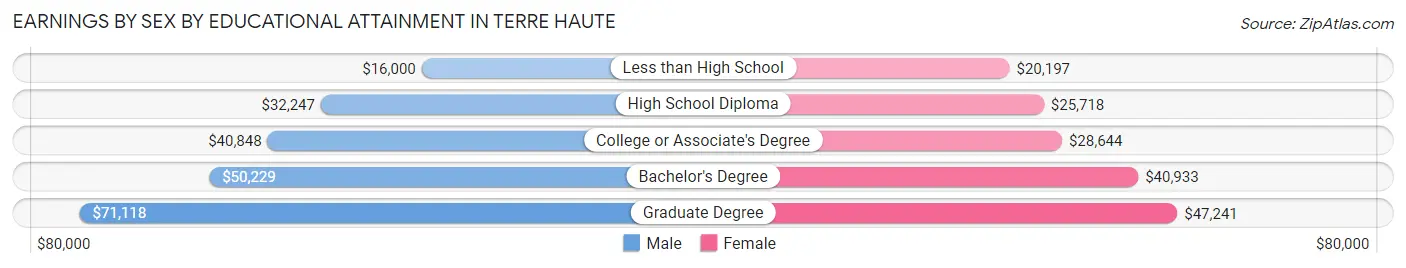
Earnings by Sex by Educational Attainment in Terre Haute
Average earnings in Terre Haute are $37,061 for men and $30,466 for women, a difference of 17.8%. Men with an educational attainment of graduate degree enjoy the highest average annual earnings of $71,118, while those with less than high school education earn the least with $16,000. Women with an educational attainment of graduate degree earn the most with the average annual earnings of $47,241, while those with less than high school education have the smallest earnings of $20,197.
| Educational Attainment | Male Income | Female Income |
| Less than High School | $16,000 | $20,197 |
| High School Diploma | $32,247 | $25,718 |
| College or Associate's Degree | $40,848 | $28,644 |
| Bachelor's Degree | $50,229 | $40,933 |
| Graduate Degree | $71,118 | $47,241 |
| Total | $37,061 | $30,466 |
Family Income in Terre Haute
Family Income Brackets in Terre Haute
According to the Terre Haute family income data, there are 2,096 families falling into the $50,000 to $74,999 income range, which is the most common income bracket and makes up 17.9% of all families. Conversely, the $200,000+ income bracket is the least frequent group with only 468 families (4.0%) belonging to this category.
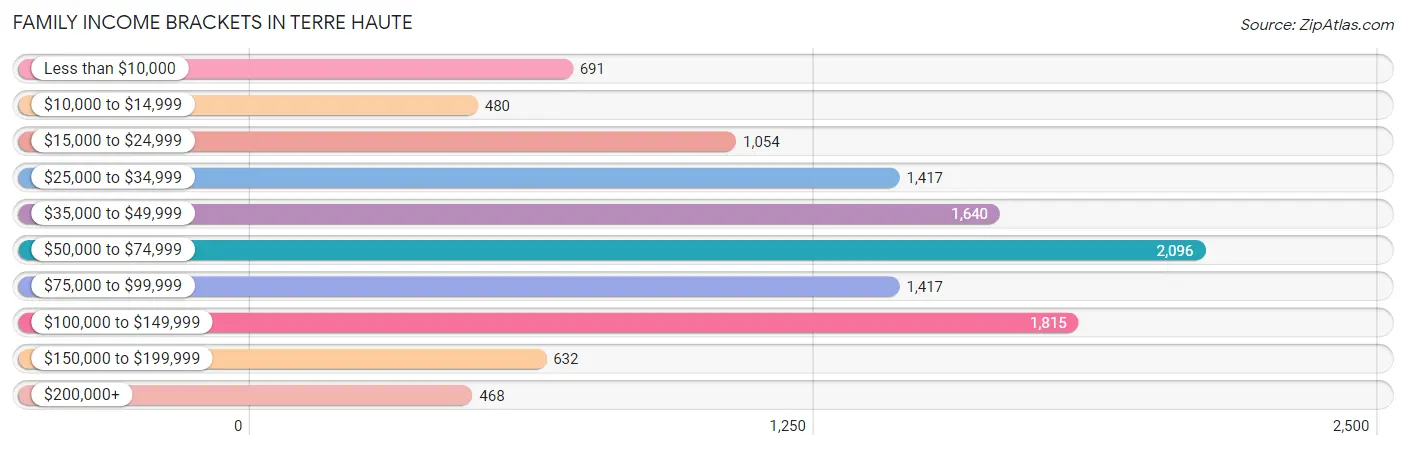
| Income Bracket | # Families | % Families |
| Less than $10,000 | 691 | 5.9% |
| $10,000 to $14,999 | 480 | 4.1% |
| $15,000 to $24,999 | 1,054 | 9.0% |
| $25,000 to $34,999 | 1,417 | 12.1% |
| $35,000 to $49,999 | 1,640 | 14.0% |
| $50,000 to $74,999 | 2,096 | 17.9% |
| $75,000 to $99,999 | 1,417 | 12.1% |
| $100,000 to $149,999 | 1,815 | 15.5% |
| $150,000 to $199,999 | 632 | 5.4% |
| $200,000+ | 468 | 4.0% |
Family Income by Famaliy Size in Terre Haute
5-person families (754 | 6.4%) account for the highest median family income in Terre Haute with $79,904 per family, while 2-person families (5,975 | 51.0%) have the highest median income of $26,637 per family member.
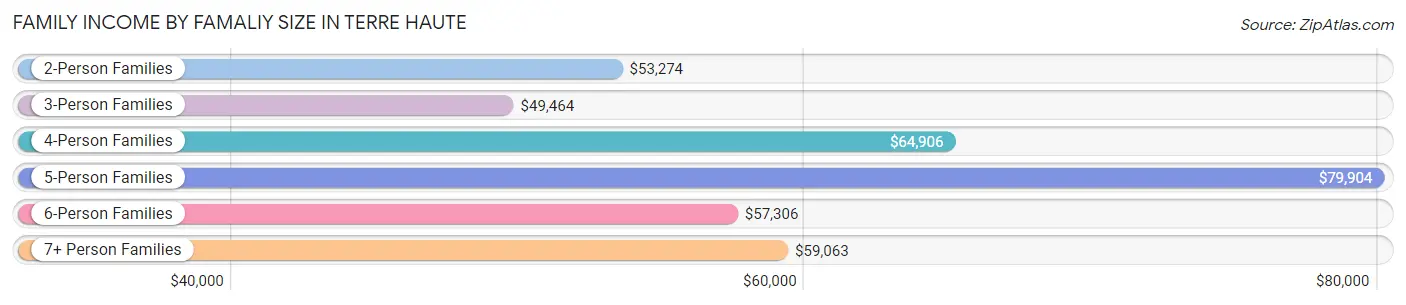
| Income Bracket | # Families | Median Income |
| 2-Person Families | 5,975 (51.0%) | $53,274 |
| 3-Person Families | 2,401 (20.5%) | $49,464 |
| 4-Person Families | 1,916 (16.4%) | $64,906 |
| 5-Person Families | 754 (6.4%) | $79,904 |
| 6-Person Families | 391 (3.3%) | $57,306 |
| 7+ Person Families | 274 (2.3%) | $59,063 |
| Total | 11,711 (100.0%) | $56,841 |
Family Income by Number of Earners in Terre Haute
The median family income in Terre Haute is $56,841, with families comprising 3+ earners (962) having the highest median family income of $106,682, while families with no earners (2,238) have the lowest median family income of $36,649, accounting for 8.2% and 19.1% of families, respectively.
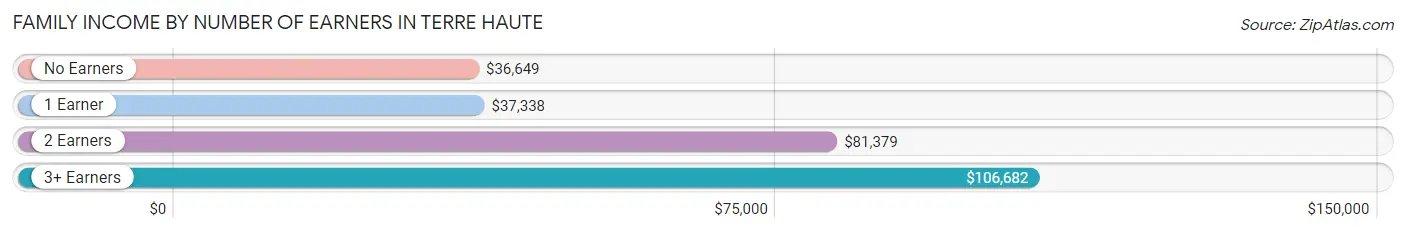
| Number of Earners | # Families | Median Income |
| No Earners | 2,238 (19.1%) | $36,649 |
| 1 Earner | 4,617 (39.4%) | $37,338 |
| 2 Earners | 3,894 (33.3%) | $81,379 |
| 3+ Earners | 962 (8.2%) | $106,682 |
| Total | 11,711 (100.0%) | $56,841 |
Household Income in Terre Haute
Household Income Brackets in Terre Haute
With 3,763 households falling in the category, the $50,000 to $74,999 income range is the most frequent in Terre Haute, accounting for 16.3% of all households. In contrast, only 577 households (2.5%) fall into the $200,000+ income bracket, making it the least populous group.
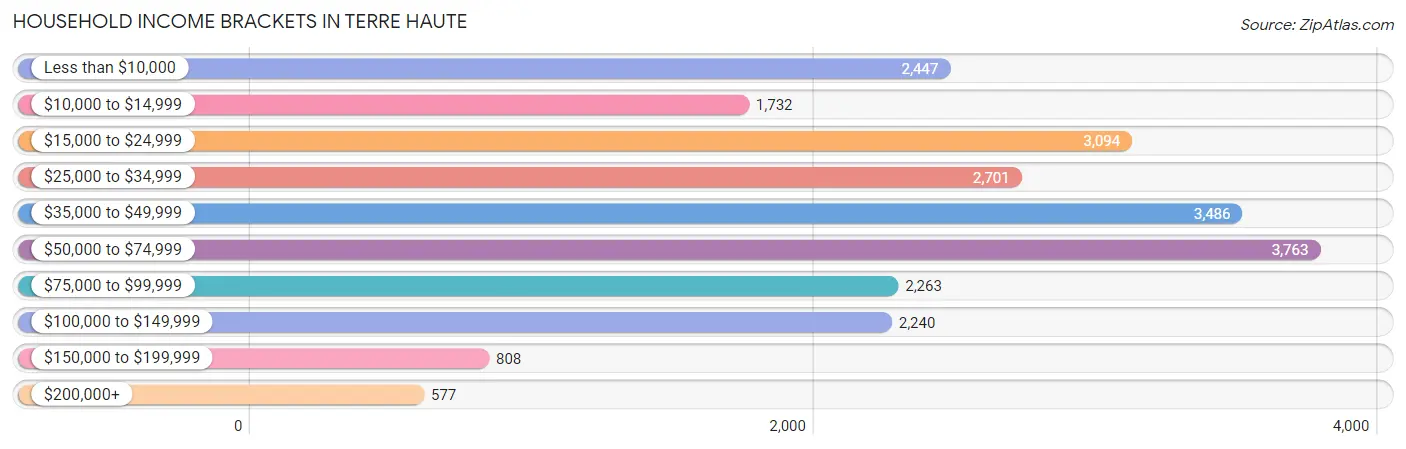
| Income Bracket | # Households | % Households |
| Less than $10,000 | 2,447 | 10.6% |
| $10,000 to $14,999 | 1,732 | 7.5% |
| $15,000 to $24,999 | 3,094 | 13.4% |
| $25,000 to $34,999 | 2,701 | 11.7% |
| $35,000 to $49,999 | 3,486 | 15.1% |
| $50,000 to $74,999 | 3,763 | 16.3% |
| $75,000 to $99,999 | 2,263 | 9.8% |
| $100,000 to $149,999 | 2,240 | 9.7% |
| $150,000 to $199,999 | 808 | 3.5% |
| $200,000+ | 577 | 2.5% |
Household Income by Householder Age in Terre Haute
The median household income in Terre Haute is $41,230, with the highest median household income of $55,985 found in the 45 to 64 years age bracket for the primary householder. A total of 6,426 households (27.8%) fall into this category. Meanwhile, the 15 to 24 years age bracket for the primary householder has the lowest median household income of $20,073, with 3,290 households (14.2%) in this group.
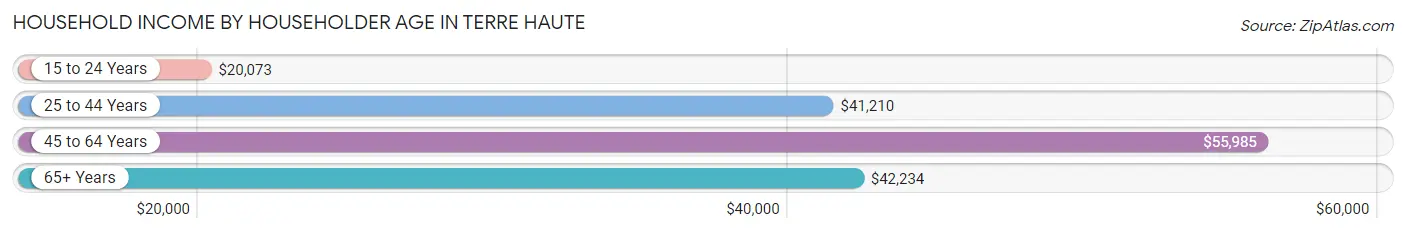
| Income Bracket | # Households | Median Income |
| 15 to 24 Years | 3,290 (14.2%) | $20,073 |
| 25 to 44 Years | 7,300 (31.6%) | $41,210 |
| 45 to 64 Years | 6,426 (27.8%) | $55,985 |
| 65+ Years | 6,072 (26.3%) | $42,234 |
| Total | 23,088 (100.0%) | $41,230 |
Poverty in Terre Haute
Income Below Poverty by Sex and Age in Terre Haute
With 25.1% poverty level for males and 27.7% for females among the residents of Terre Haute, 18 to 24 year old males and 18 to 24 year old females are the most vulnerable to poverty, with 1,712 males (42.8%) and 2,297 females (55.5%) in their respective age groups living below the poverty level.
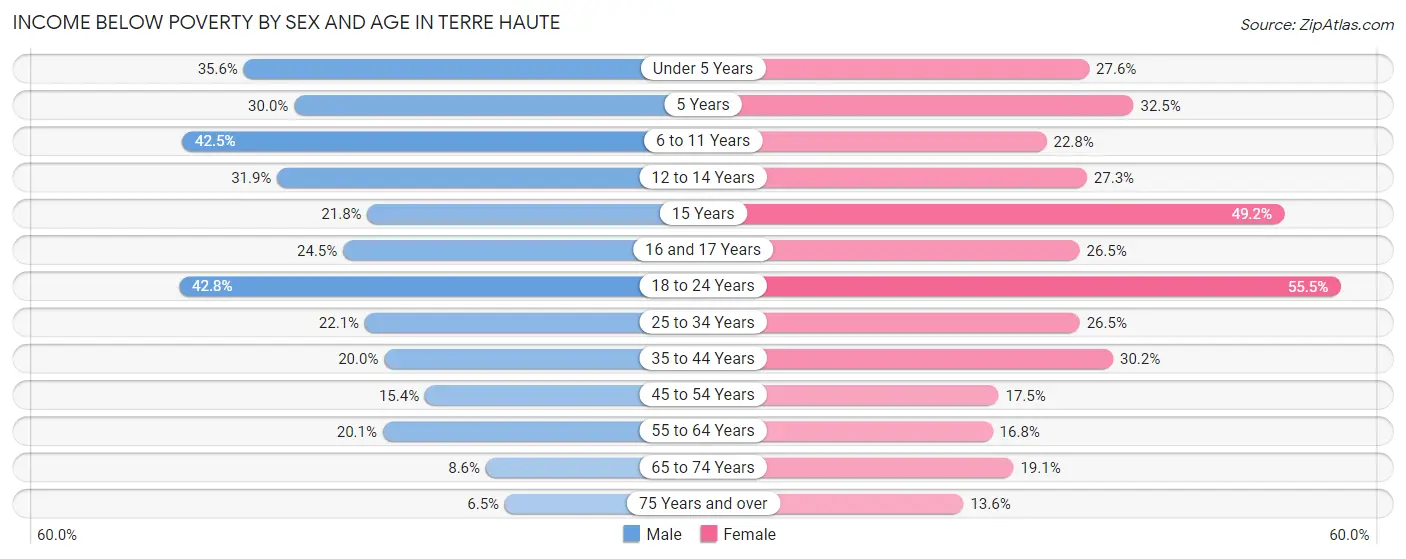
| Age Bracket | Male | Female |
| Under 5 Years | 581 (35.6%) | 418 (27.6%) |
| 5 Years | 128 (30.0%) | 103 (32.5%) |
| 6 to 11 Years | 815 (42.4%) | 406 (22.8%) |
| 12 to 14 Years | 247 (31.9%) | 318 (27.3%) |
| 15 Years | 67 (21.8%) | 158 (49.2%) |
| 16 and 17 Years | 105 (24.5%) | 152 (26.5%) |
| 18 to 24 Years | 1,712 (42.8%) | 2,297 (55.5%) |
| 25 to 34 Years | 856 (22.1%) | 971 (26.5%) |
| 35 to 44 Years | 538 (20.0%) | 819 (30.2%) |
| 45 to 54 Years | 401 (15.4%) | 482 (17.5%) |
| 55 to 64 Years | 533 (20.1%) | 497 (16.8%) |
| 65 to 74 Years | 200 (8.6%) | 519 (19.1%) |
| 75 Years and over | 90 (6.5%) | 311 (13.6%) |
| Total | 6,273 (25.1%) | 7,451 (27.7%) |
Income Above Poverty by Sex and Age in Terre Haute
According to the poverty statistics in Terre Haute, males aged 75 years and over and females aged 75 years and over are the age groups that are most secure financially, with 93.5% of males and 86.5% of females in these age groups living above the poverty line.
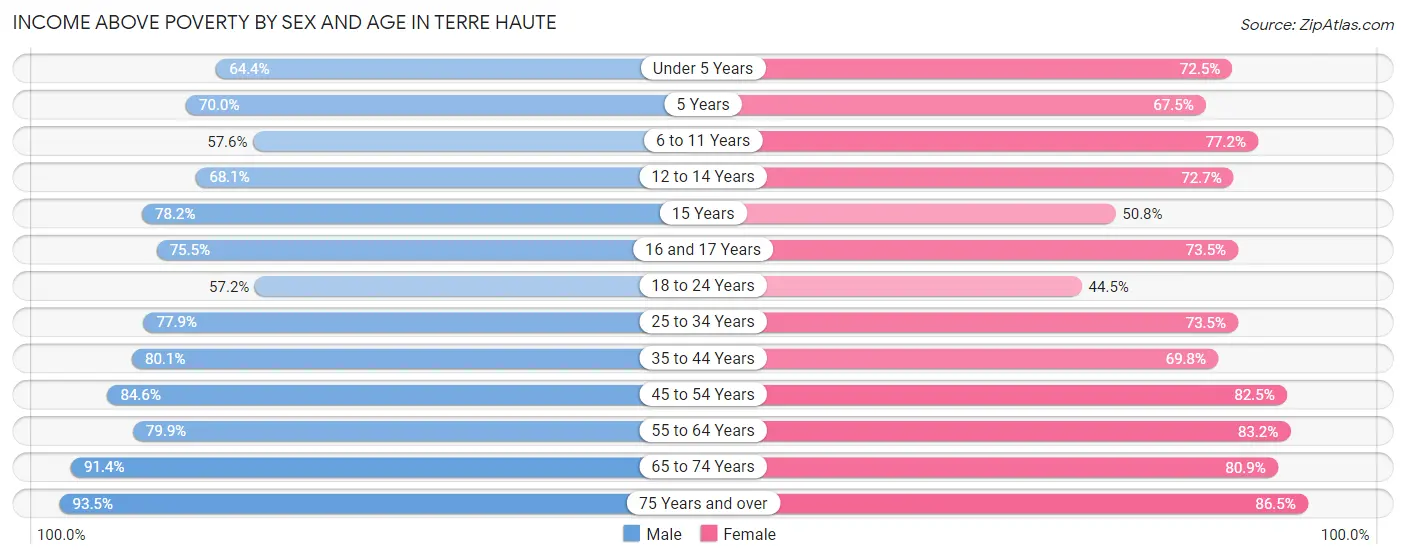
| Age Bracket | Male | Female |
| Under 5 Years | 1,051 (64.4%) | 1,099 (72.5%) |
| 5 Years | 299 (70.0%) | 214 (67.5%) |
| 6 to 11 Years | 1,105 (57.6%) | 1,375 (77.2%) |
| 12 to 14 Years | 528 (68.1%) | 847 (72.7%) |
| 15 Years | 240 (78.2%) | 163 (50.8%) |
| 16 and 17 Years | 323 (75.5%) | 422 (73.5%) |
| 18 to 24 Years | 2,289 (57.2%) | 1,843 (44.5%) |
| 25 to 34 Years | 3,017 (77.9%) | 2,693 (73.5%) |
| 35 to 44 Years | 2,159 (80.0%) | 1,892 (69.8%) |
| 45 to 54 Years | 2,201 (84.6%) | 2,278 (82.5%) |
| 55 to 64 Years | 2,118 (79.9%) | 2,461 (83.2%) |
| 65 to 74 Years | 2,117 (91.4%) | 2,195 (80.9%) |
| 75 Years and over | 1,293 (93.5%) | 1,984 (86.5%) |
| Total | 18,740 (74.9%) | 19,466 (72.3%) |
Income Below Poverty Among Married-Couple Families in Terre Haute
The poverty statistics for married-couple families in Terre Haute show that 8.9% or 668 of the total 7,507 families live below the poverty line. Families with 5 or more children have the highest poverty rate of 54.2%, comprising of 13 families. On the other hand, families with no children have the lowest poverty rate of 5.4%, which includes 252 families.
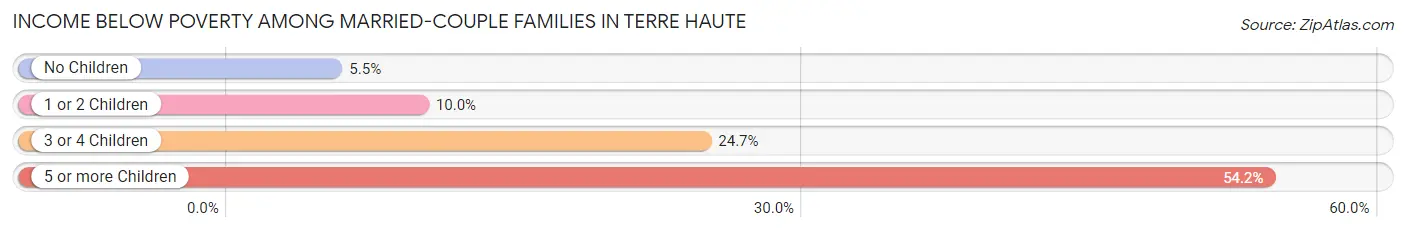
| Children | Above Poverty | Below Poverty |
| No Children | 4,368 (94.6%) | 252 (5.4%) |
| 1 or 2 Children | 1,860 (90.0%) | 206 (10.0%) |
| 3 or 4 Children | 600 (75.3%) | 197 (24.7%) |
| 5 or more Children | 11 (45.8%) | 13 (54.2%) |
| Total | 6,839 (91.1%) | 668 (8.9%) |
Income Below Poverty Among Single-Parent Households in Terre Haute
According to the poverty data in Terre Haute, 18.0% or 242 single-father households and 41.9% or 1,199 single-mother households are living below the poverty line. Among single-father households, those with 3 or 4 children have the highest poverty rate, with 90 households (90.0%) experiencing poverty. Likewise, among single-mother households, those with 3 or 4 children have the highest poverty rate, with 249 households (63.7%) falling below the poverty line.
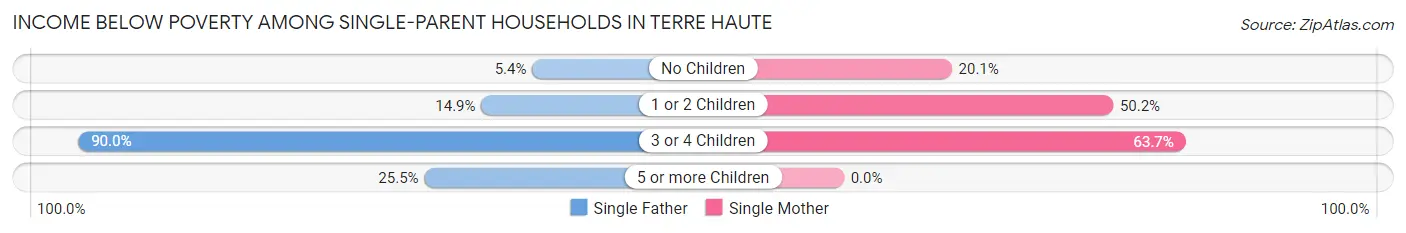
| Children | Single Father | Single Mother |
| No Children | 22 (5.4%) | 176 (20.1%) |
| 1 or 2 Children | 118 (14.9%) | 774 (50.2%) |
| 3 or 4 Children | 90 (90.0%) | 249 (63.7%) |
| 5 or more Children | 12 (25.5%) | 0 (0.0%) |
| Total | 242 (18.0%) | 1,199 (41.9%) |
Income Below Poverty Among Married-Couple vs Single-Parent Households in Terre Haute
The poverty data for Terre Haute shows that 668 of the married-couple family households (8.9%) and 1,441 of the single-parent households (34.3%) are living below the poverty level. Within the married-couple family households, those with 5 or more children have the highest poverty rate, with 13 households (54.2%) falling below the poverty line. Among the single-parent households, those with 3 or 4 children have the highest poverty rate, with 339 household (69.0%) living below poverty.
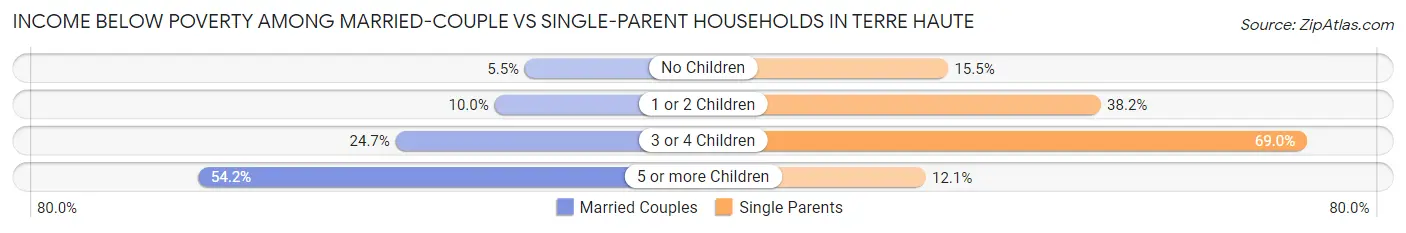
| Children | Married-Couple Families | Single-Parent Households |
| No Children | 252 (5.4%) | 198 (15.5%) |
| 1 or 2 Children | 206 (10.0%) | 892 (38.2%) |
| 3 or 4 Children | 197 (24.7%) | 339 (69.0%) |
| 5 or more Children | 13 (54.2%) | 12 (12.1%) |
| Total | 668 (8.9%) | 1,441 (34.3%) |
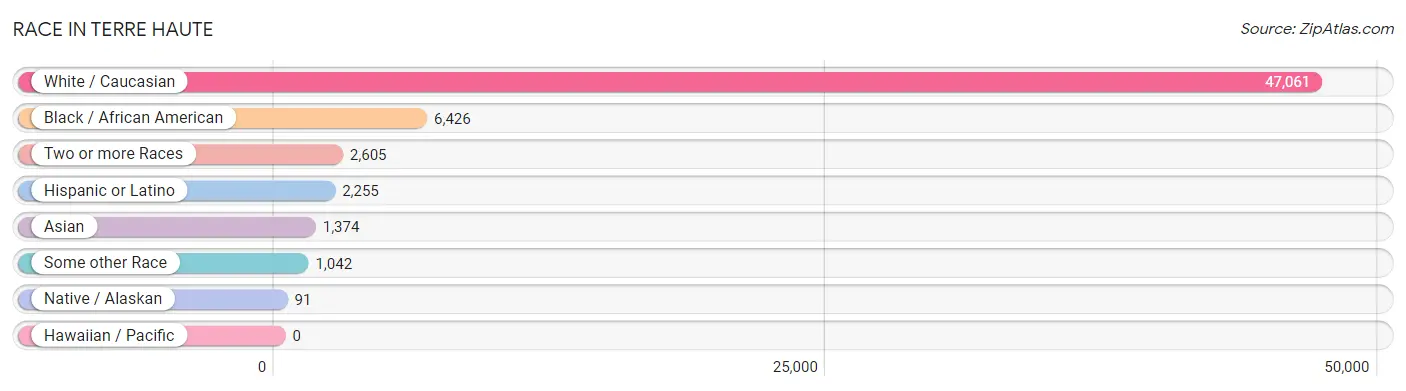
Race in Terre Haute
The most populous races in Terre Haute are White / Caucasian (47,061 | 80.3%), Black / African American (6,426 | 11.0%), and Two or more Races (2,605 | 4.4%).
| Race | # Population | % Population |
| Asian | 1,374 | 2.3% |
| Black / African American | 6,426 | 11.0% |
| Hawaiian / Pacific | 0 | 0.0% |
| Hispanic or Latino | 2,255 | 3.8% |
| Native / Alaskan | 91 | 0.2% |
| White / Caucasian | 47,061 | 80.3% |
| Two or more Races | 2,605 | 4.4% |
| Some other Race | 1,042 | 1.8% |
| Total | 58,599 | 100.0% |
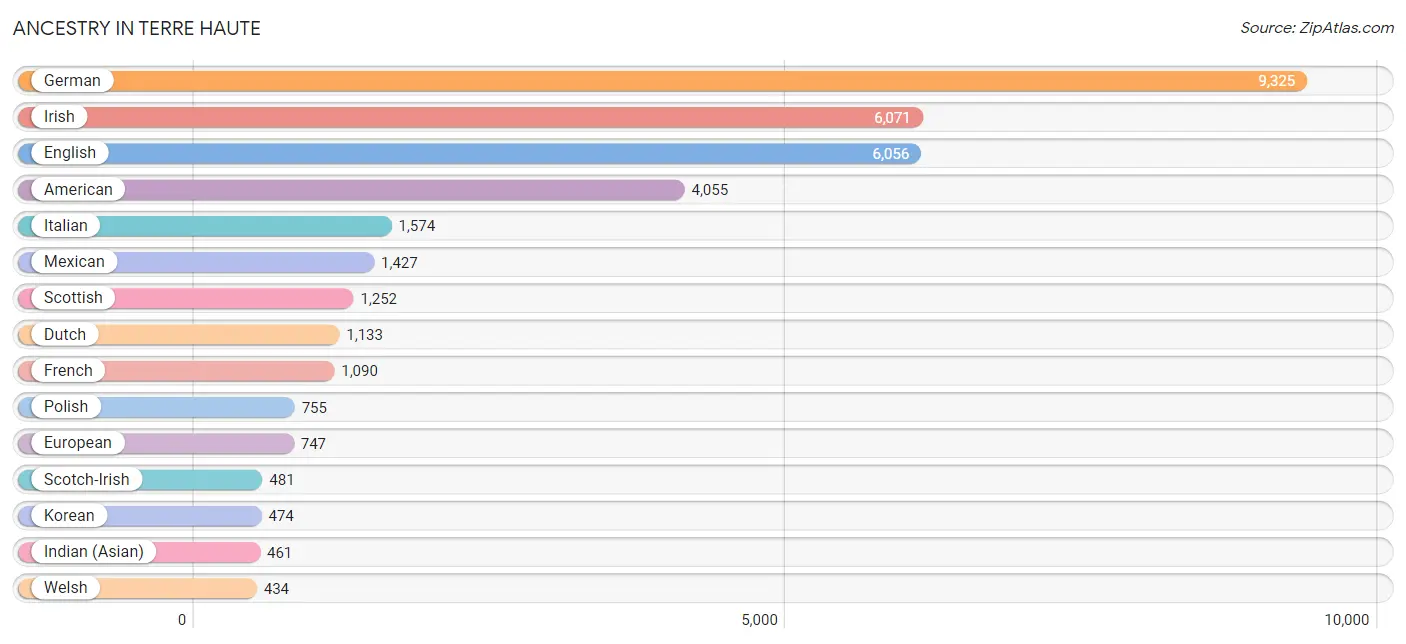
Ancestry in Terre Haute
The most populous ancestries reported in Terre Haute are German (9,325 | 15.9%), Irish (6,071 | 10.4%), English (6,056 | 10.3%), American (4,055 | 6.9%), and Italian (1,574 | 2.7%), together accounting for 46.2% of all Terre Haute residents.
| Ancestry | # Population | % Population |
| African | 198 | 0.3% |
| American | 4,055 | 6.9% |
| Apache | 12 | 0.0% |
| Arab | 147 | 0.3% |
| Australian | 44 | 0.1% |
| Austrian | 78 | 0.1% |
| Belgian | 2 | 0.0% |
| Bhutanese | 75 | 0.1% |
| Blackfeet | 8 | 0.0% |
| British | 159 | 0.3% |
| Burmese | 71 | 0.1% |
| Cajun | 27 | 0.1% |
| Canadian | 133 | 0.2% |
| Celtic | 2 | 0.0% |
| Central American | 23 | 0.0% |
| Central American Indian | 11 | 0.0% |
| Cherokee | 152 | 0.3% |
| Colombian | 54 | 0.1% |
| Croatian | 9 | 0.0% |
| Cuban | 29 | 0.1% |
| Czech | 55 | 0.1% |
| Czechoslovakian | 21 | 0.0% |
| Danish | 69 | 0.1% |
| Dominican | 35 | 0.1% |
| Dutch | 1,133 | 1.9% |
| Eastern European | 86 | 0.2% |
| English | 6,056 | 10.3% |
| European | 747 | 1.3% |
| Filipino | 99 | 0.2% |
| Finnish | 1 | 0.0% |
| French | 1,090 | 1.9% |
| French Canadian | 17 | 0.0% |
| German | 9,325 | 15.9% |
| Ghanaian | 16 | 0.0% |
| Greek | 168 | 0.3% |
| Haitian | 11 | 0.0% |
| Honduran | 23 | 0.0% |
| Hungarian | 290 | 0.5% |
| Icelander | 7 | 0.0% |
| Indian (Asian) | 461 | 0.8% |
| Iranian | 71 | 0.1% |
| Irish | 6,071 | 10.4% |
| Israeli | 26 | 0.0% |
| Italian | 1,574 | 2.7% |
| Japanese | 4 | 0.0% |
| Kenyan | 23 | 0.0% |
| Korean | 474 | 0.8% |
| Lithuanian | 104 | 0.2% |
| Macedonian | 44 | 0.1% |
| Malaysian | 7 | 0.0% |
| Mexican | 1,427 | 2.4% |
| Moroccan | 14 | 0.0% |
| Native Hawaiian | 2 | 0.0% |
| Navajo | 13 | 0.0% |
| Nigerian | 23 | 0.0% |
| Northern European | 32 | 0.1% |
| Norwegian | 353 | 0.6% |
| Okinawan | 16 | 0.0% |
| Pennsylvania German | 39 | 0.1% |
| Polish | 755 | 1.3% |
| Portuguese | 45 | 0.1% |
| Puerto Rican | 278 | 0.5% |
| Romanian | 49 | 0.1% |
| Russian | 260 | 0.4% |
| Scandinavian | 54 | 0.1% |
| Scotch-Irish | 481 | 0.8% |
| Scottish | 1,252 | 2.1% |
| Serbian | 112 | 0.2% |
| Sioux | 52 | 0.1% |
| Slavic | 33 | 0.1% |
| Slovak | 31 | 0.1% |
| South American | 54 | 0.1% |
| Spaniard | 21 | 0.0% |
| Spanish | 24 | 0.0% |
| Sri Lankan | 39 | 0.1% |
| Subsaharan African | 380 | 0.6% |
| Swedish | 322 | 0.5% |
| Swiss | 63 | 0.1% |
| Syrian | 104 | 0.2% |
| Thai | 419 | 0.7% |
| Turkish | 6 | 0.0% |
| Ukrainian | 45 | 0.1% |
| Vietnamese | 1 | 0.0% |
| Welsh | 434 | 0.7% |
| Yugoslavian | 101 | 0.2% | View All 85 Rows |
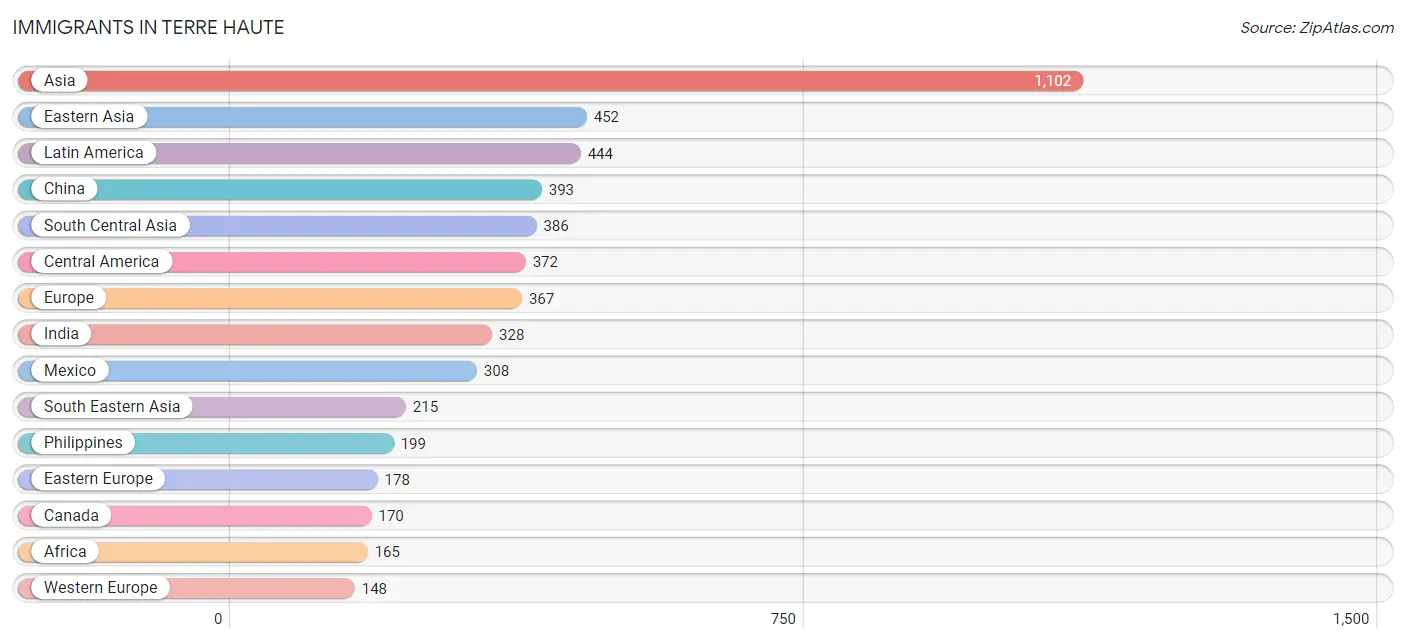
Immigrants in Terre Haute
The most numerous immigrant groups reported in Terre Haute came from Asia (1,102 | 1.9%), Eastern Asia (452 | 0.8%), Latin America (444 | 0.8%), China (393 | 0.7%), and South Central Asia (386 | 0.7%), together accounting for 4.7% of all Terre Haute residents.
| Immigration Origin | # Population | % Population |
| Africa | 165 | 0.3% |
| Asia | 1,102 | 1.9% |
| Australia | 15 | 0.0% |
| Bangladesh | 1 | 0.0% |
| Bosnia and Herzegovina | 26 | 0.0% |
| Brazil | 16 | 0.0% |
| Canada | 170 | 0.3% |
| Caribbean | 56 | 0.1% |
| Central America | 372 | 0.6% |
| China | 393 | 0.7% |
| Congo | 18 | 0.0% |
| Cuba | 37 | 0.1% |
| Denmark | 17 | 0.0% |
| Dominican Republic | 17 | 0.0% |
| Eastern Africa | 26 | 0.0% |
| Eastern Asia | 452 | 0.8% |
| Eastern Europe | 178 | 0.3% |
| El Salvador | 21 | 0.0% |
| England | 10 | 0.0% |
| Europe | 367 | 0.6% |
| France | 8 | 0.0% |
| Germany | 134 | 0.2% |
| Ghana | 44 | 0.1% |
| Honduras | 33 | 0.1% |
| India | 328 | 0.6% |
| Iran | 57 | 0.1% |
| Japan | 14 | 0.0% |
| Kenya | 26 | 0.0% |
| Korea | 45 | 0.1% |
| Latin America | 444 | 0.8% |
| Mexico | 308 | 0.5% |
| Middle Africa | 18 | 0.0% |
| Morocco | 6 | 0.0% |
| Nicaragua | 10 | 0.0% |
| Nigeria | 23 | 0.0% |
| Northern Africa | 6 | 0.0% |
| Northern Europe | 31 | 0.1% |
| Oceania | 15 | 0.0% |
| Philippines | 199 | 0.3% |
| Poland | 14 | 0.0% |
| Portugal | 10 | 0.0% |
| Russia | 55 | 0.1% |
| Saudi Arabia | 29 | 0.1% |
| Scotland | 4 | 0.0% |
| Serbia | 83 | 0.1% |
| Singapore | 16 | 0.0% |
| South America | 16 | 0.0% |
| South Central Asia | 386 | 0.7% |
| South Eastern Asia | 215 | 0.4% |
| Southern Europe | 10 | 0.0% |
| Switzerland | 6 | 0.0% |
| Syria | 20 | 0.0% |
| Taiwan | 65 | 0.1% |
| Western Africa | 67 | 0.1% |
| Western Asia | 49 | 0.1% |
| Western Europe | 148 | 0.3% | View All 56 Rows |
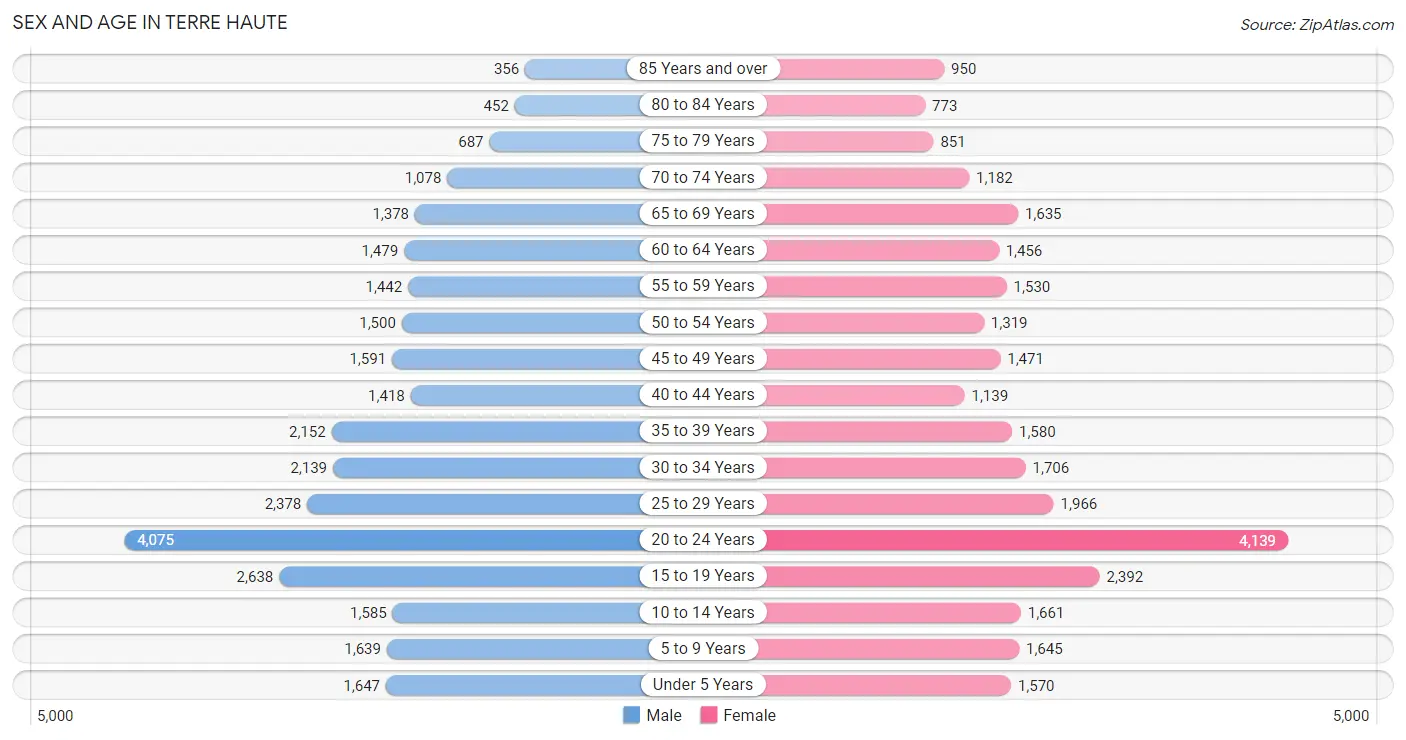
Sex and Age in Terre Haute
Sex and Age in Terre Haute
The most populous age groups in Terre Haute are 20 to 24 Years (4,075 | 13.8%) for men and 20 to 24 Years (4,139 | 14.3%) for women.
| Age Bracket | Male | Female |
| Under 5 Years | 1,647 (5.6%) | 1,570 (5.4%) |
| 5 to 9 Years | 1,639 (5.5%) | 1,645 (5.7%) |
| 10 to 14 Years | 1,585 (5.3%) | 1,661 (5.7%) |
| 15 to 19 Years | 2,638 (8.9%) | 2,392 (8.3%) |
| 20 to 24 Years | 4,075 (13.8%) | 4,139 (14.3%) |
| 25 to 29 Years | 2,378 (8.0%) | 1,966 (6.8%) |
| 30 to 34 Years | 2,139 (7.2%) | 1,706 (5.9%) |
| 35 to 39 Years | 2,152 (7.3%) | 1,580 (5.4%) |
| 40 to 44 Years | 1,418 (4.8%) | 1,139 (3.9%) |
| 45 to 49 Years | 1,591 (5.4%) | 1,471 (5.1%) |
| 50 to 54 Years | 1,500 (5.1%) | 1,319 (4.5%) |
| 55 to 59 Years | 1,442 (4.9%) | 1,530 (5.3%) |
| 60 to 64 Years | 1,479 (5.0%) | 1,456 (5.0%) |
| 65 to 69 Years | 1,378 (4.6%) | 1,635 (5.6%) |
| 70 to 74 Years | 1,078 (3.6%) | 1,182 (4.1%) |
| 75 to 79 Years | 687 (2.3%) | 851 (2.9%) |
| 80 to 84 Years | 452 (1.5%) | 773 (2.7%) |
| 85 Years and over | 356 (1.2%) | 950 (3.3%) |
| Total | 29,634 (100.0%) | 28,965 (100.0%) |
Families and Households in Terre Haute
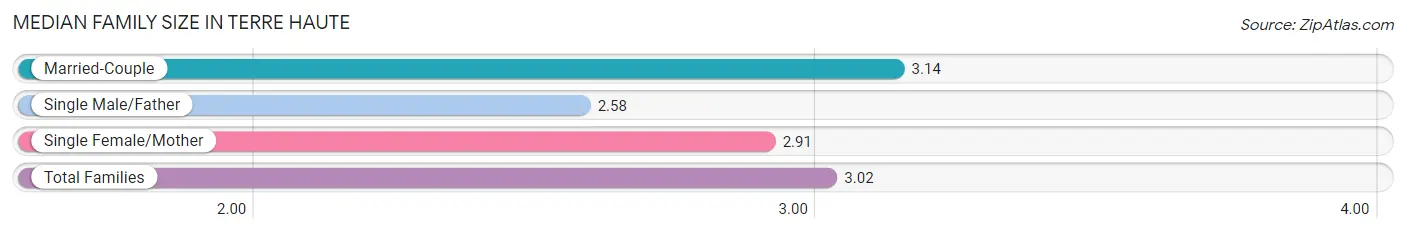
Median Family Size in Terre Haute
The median family size in Terre Haute is 3.02 persons per family, with married-couple families (7,507 | 64.1%) accounting for the largest median family size of 3.14 persons per family. On the other hand, single male/father families (1,343 | 11.5%) represent the smallest median family size with 2.58 persons per family.
| Family Type | # Families | Family Size |
| Married-Couple | 7,507 (64.1%) | 3.14 |
| Single Male/Father | 1,343 (11.5%) | 2.58 |
| Single Female/Mother | 2,861 (24.4%) | 2.91 |
| Total Families | 11,711 (100.0%) | 3.02 |
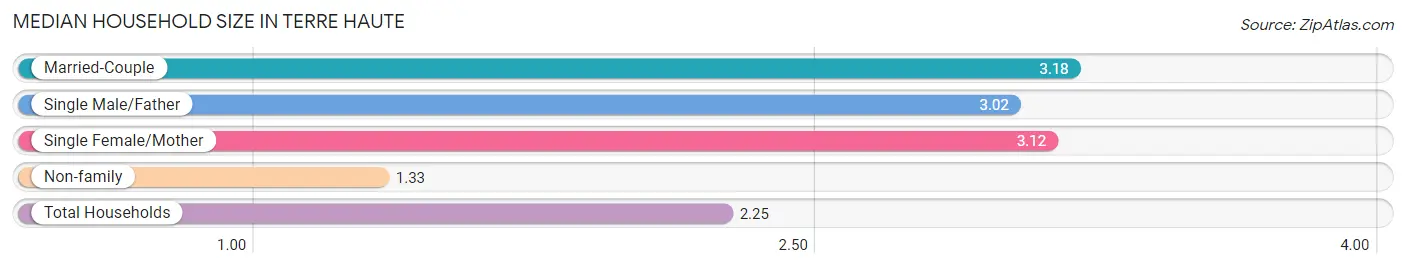
Median Household Size in Terre Haute
The median household size in Terre Haute is 2.25 persons per household, with married-couple households (7,507 | 32.5%) accounting for the largest median household size of 3.18 persons per household. non-family households (11,377 | 49.3%) represent the smallest median household size with 1.33 persons per household.
| Household Type | # Households | Household Size |
| Married-Couple | 7,507 (32.5%) | 3.18 |
| Single Male/Father | 1,343 (5.8%) | 3.02 |
| Single Female/Mother | 2,861 (12.4%) | 3.12 |
| Non-family | 11,377 (49.3%) | 1.33 |
| Total Households | 23,088 (100.0%) | 2.25 |
Household Size by Marriage Status in Terre Haute
Out of a total of 23,088 households in Terre Haute, 11,711 (50.7%) are family households, while 11,377 (49.3%) are nonfamily households. The most numerous type of family households are 2-person households, comprising 5,452, and the most common type of nonfamily households are 1-person households, comprising 8,980.
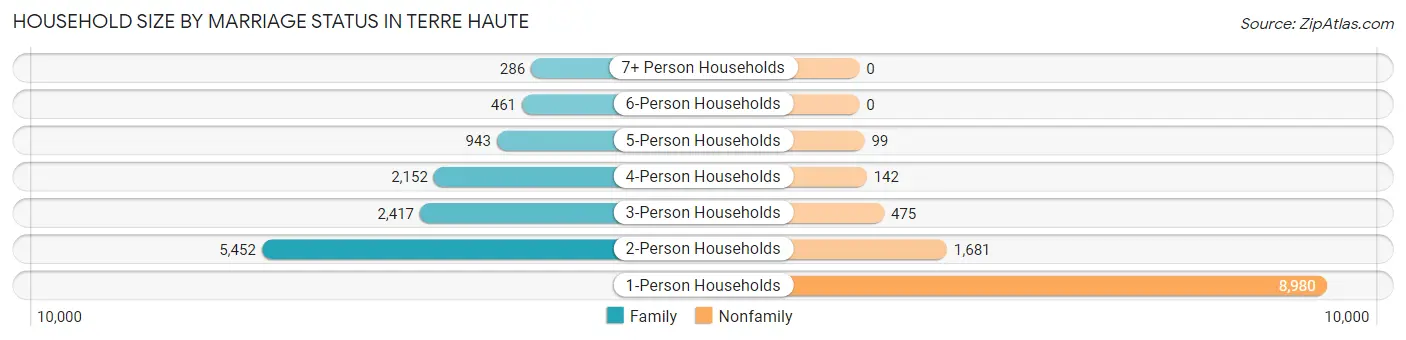
| Household Size | Family Households | Nonfamily Households |
| 1-Person Households | - | 8,980 (38.9%) |
| 2-Person Households | 5,452 (23.6%) | 1,681 (7.3%) |
| 3-Person Households | 2,417 (10.5%) | 475 (2.1%) |
| 4-Person Households | 2,152 (9.3%) | 142 (0.6%) |
| 5-Person Households | 943 (4.1%) | 99 (0.4%) |
| 6-Person Households | 461 (2.0%) | 0 (0.0%) |
| 7+ Person Households | 286 (1.2%) | 0 (0.0%) |
| Total | 11,711 (50.7%) | 11,377 (49.3%) |
Female Fertility in Terre Haute
Fertility by Age in Terre Haute
Average fertility rate in Terre Haute is 41.0 births per 1,000 women. Women in the age bracket of 20 to 34 years have the highest fertility rate with 70.0 births per 1,000 women. Women in the age bracket of 20 to 34 years acount for 90.0% of all women with births.
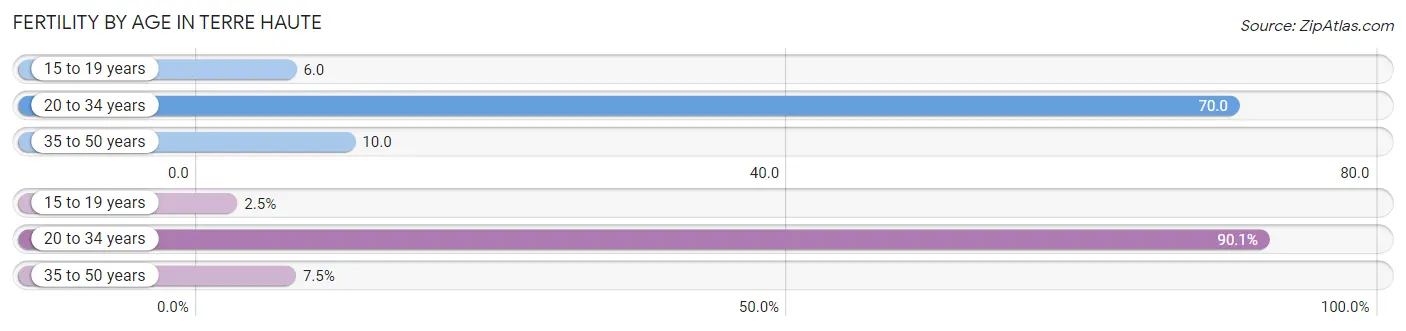
| Age Bracket | Women with Births | Births / 1,000 Women |
| 15 to 19 years | 15 (2.5%) | 6.0 |
| 20 to 34 years | 543 (90.0%) | 70.0 |
| 35 to 50 years | 45 (7.5%) | 10.0 |
| Total | 603 (100.0%) | 41.0 |
Fertility by Age by Marriage Status in Terre Haute
39.3% of women with births (603) in Terre Haute are married. The highest percentage of unmarried women with births falls into 15 to 19 years age bracket with 100.0% of them unmarried at the time of birth, while the lowest percentage of unmarried women with births belong to 35 to 50 years age bracket with 0.0% of them unmarried.
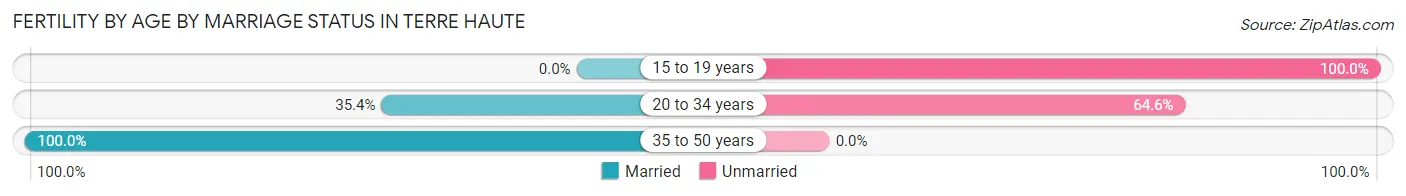
| Age Bracket | Married | Unmarried |
| 15 to 19 years | 0 (0.0%) | 15 (100.0%) |
| 20 to 34 years | 192 (35.4%) | 351 (64.6%) |
| 35 to 50 years | 45 (100.0%) | 0 (0.0%) |
| Total | 237 (39.3%) | 366 (60.7%) |
Fertility by Education in Terre Haute
Average fertility rate in Terre Haute is 41.0 births per 1,000 women. Women with the education attainment of less than high school have the highest fertility rate of 67.0 births per 1,000 women, while women with the education attainment of college or associate's degree have the lowest fertility at 20.0 births per 1,000 women. Women with the education attainment of high school diploma represent 32.5% of all women with births.
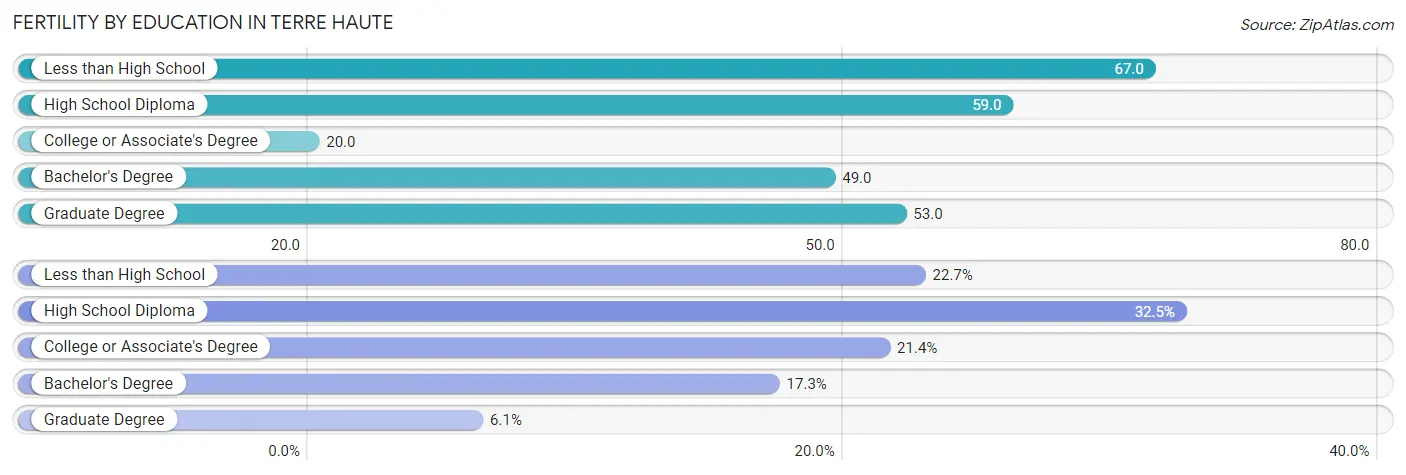
| Educational Attainment | Women with Births | Births / 1,000 Women |
| Less than High School | 137 (22.7%) | 67.0 |
| High School Diploma | 196 (32.5%) | 59.0 |
| College or Associate's Degree | 129 (21.4%) | 20.0 |
| Bachelor's Degree | 104 (17.2%) | 49.0 |
| Graduate Degree | 37 (6.1%) | 53.0 |
| Total | 603 (100.0%) | 41.0 |
Fertility by Education by Marriage Status in Terre Haute
60.7% of women with births in Terre Haute are unmarried. Women with the educational attainment of bachelor's degree are most likely to be married with 100.0% of them married at childbirth, while women with the educational attainment of high school diploma are least likely to be married with 88.8% of them unmarried at childbirth.
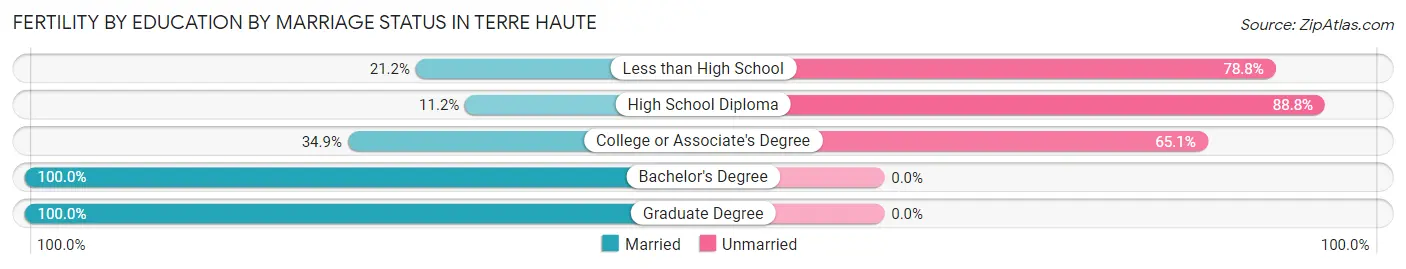
| Educational Attainment | Married | Unmarried |
| Less than High School | 29 (21.2%) | 108 (78.8%) |
| High School Diploma | 22 (11.2%) | 174 (88.8%) |
| College or Associate's Degree | 45 (34.9%) | 84 (65.1%) |
| Bachelor's Degree | 104 (100.0%) | 0 (0.0%) |
| Graduate Degree | 37 (100.0%) | 0 (0.0%) |
| Total | 237 (39.3%) | 366 (60.7%) |
Employment Characteristics in Terre Haute
Employment by Class of Employer in Terre Haute
Among the 23,800 employed individuals in Terre Haute, private company employees (15,908 | 66.8%), not-for-profit organizations (3,425 | 14.4%), and state government employees (1,643 | 6.9%) make up the most common classes of employment.
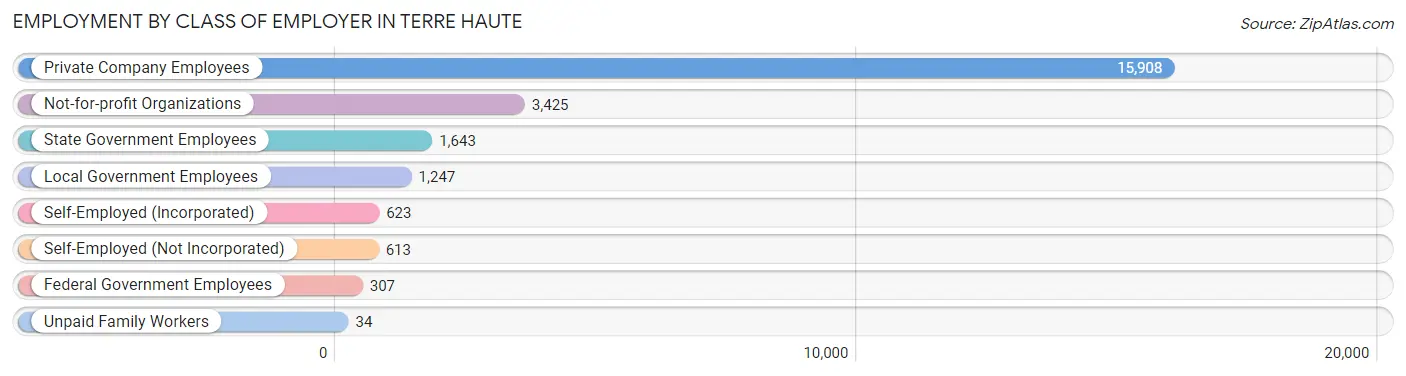
| Employer Class | # Employees | % Employees |
| Private Company Employees | 15,908 | 66.8% |
| Self-Employed (Incorporated) | 623 | 2.6% |
| Self-Employed (Not Incorporated) | 613 | 2.6% |
| Not-for-profit Organizations | 3,425 | 14.4% |
| Local Government Employees | 1,247 | 5.2% |
| State Government Employees | 1,643 | 6.9% |
| Federal Government Employees | 307 | 1.3% |
| Unpaid Family Workers | 34 | 0.1% |
| Total | 23,800 | 100.0% |
Employment Status by Age in Terre Haute
According to the labor force statistics for Terre Haute, out of the total population over 16 years of age (48,224), 55.2% or 26,620 individuals are in the labor force, with 7.5% or 1,996 of them unemployed. The age group with the highest labor force participation rate is 25 to 29 years, with 76.5% or 3,323 individuals in the labor force. Within the labor force, the 20 to 24 years age range has the highest percentage of unemployed individuals, with 11.6% or 690 of them being unemployed.
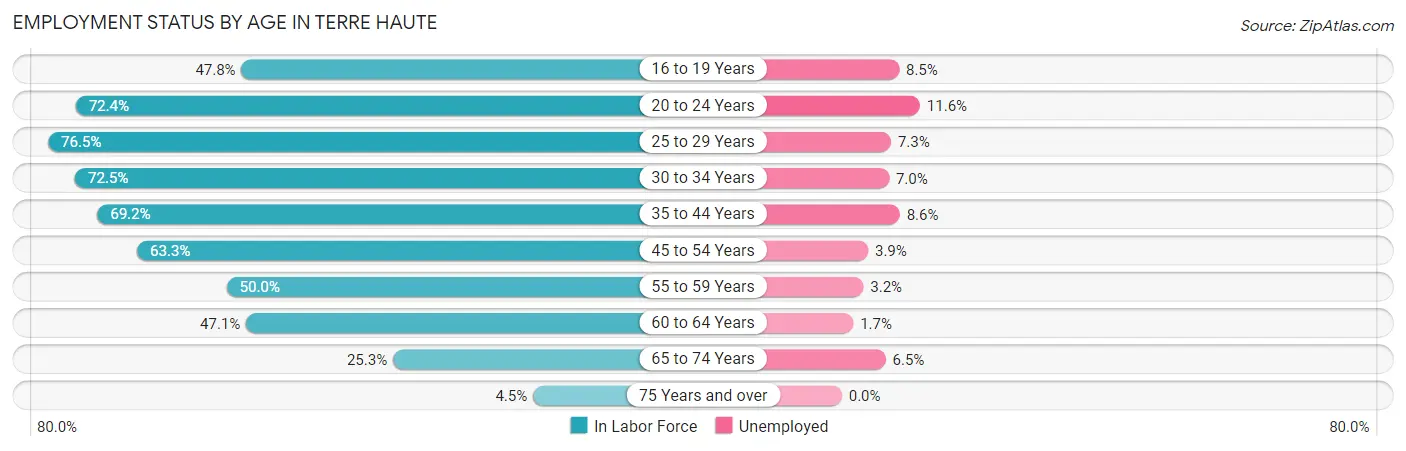
| Age Bracket | In Labor Force | Unemployed |
| 16 to 19 Years | 2,104 (47.8%) | 179 (8.5%) |
| 20 to 24 Years | 5,947 (72.4%) | 690 (11.6%) |
| 25 to 29 Years | 3,323 (76.5%) | 243 (7.3%) |
| 30 to 34 Years | 2,788 (72.5%) | 195 (7.0%) |
| 35 to 44 Years | 4,352 (69.2%) | 374 (8.6%) |
| 45 to 54 Years | 3,723 (63.3%) | 145 (3.9%) |
| 55 to 59 Years | 1,486 (50.0%) | 48 (3.2%) |
| 60 to 64 Years | 1,382 (47.1%) | 23 (1.7%) |
| 65 to 74 Years | 1,334 (25.3%) | 87 (6.5%) |
| 75 Years and over | 183 (4.5%) | 0 (0.0%) |
| Total | 26,620 (55.2%) | 1,996 (7.5%) |
Employment Status by Educational Attainment in Terre Haute
According to labor force statistics for Terre Haute, 64.9% of individuals (17,047) out of the total population between 25 and 64 years of age (26,266) are in the labor force, with 6.0% or 1,023 of them being unemployed. The group with the highest labor force participation rate are those with the educational attainment of bachelor's degree or higher, with 84.0% or 4,959 individuals in the labor force. Within the labor force, individuals with less than high school education have the highest percentage of unemployment, with 18.6% or 243 of them being unemployed.
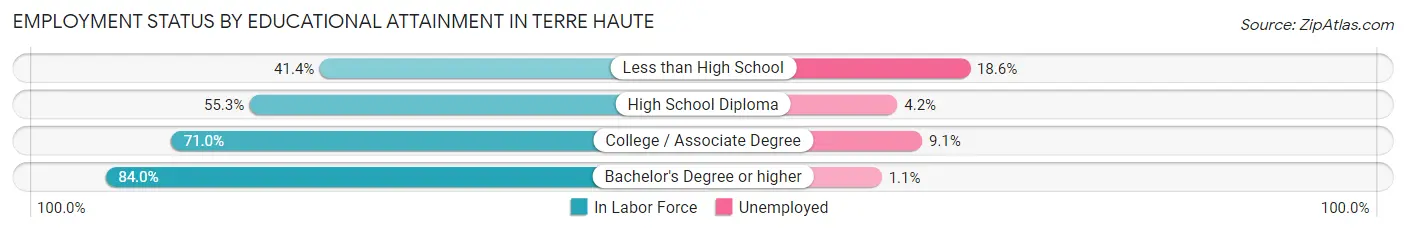
| Educational Attainment | In Labor Force | Unemployed |
| Less than High School | 1,307 (41.4%) | 587 (18.6%) |
| High School Diploma | 5,030 (55.3%) | 382 (4.2%) |
| College / Associate Degree | 5,757 (71.0%) | 738 (9.1%) |
| Bachelor's Degree or higher | 4,959 (84.0%) | 65 (1.1%) |
| Total | 17,047 (64.9%) | 1,576 (6.0%) |
Employment Occupations by Sex in Terre Haute
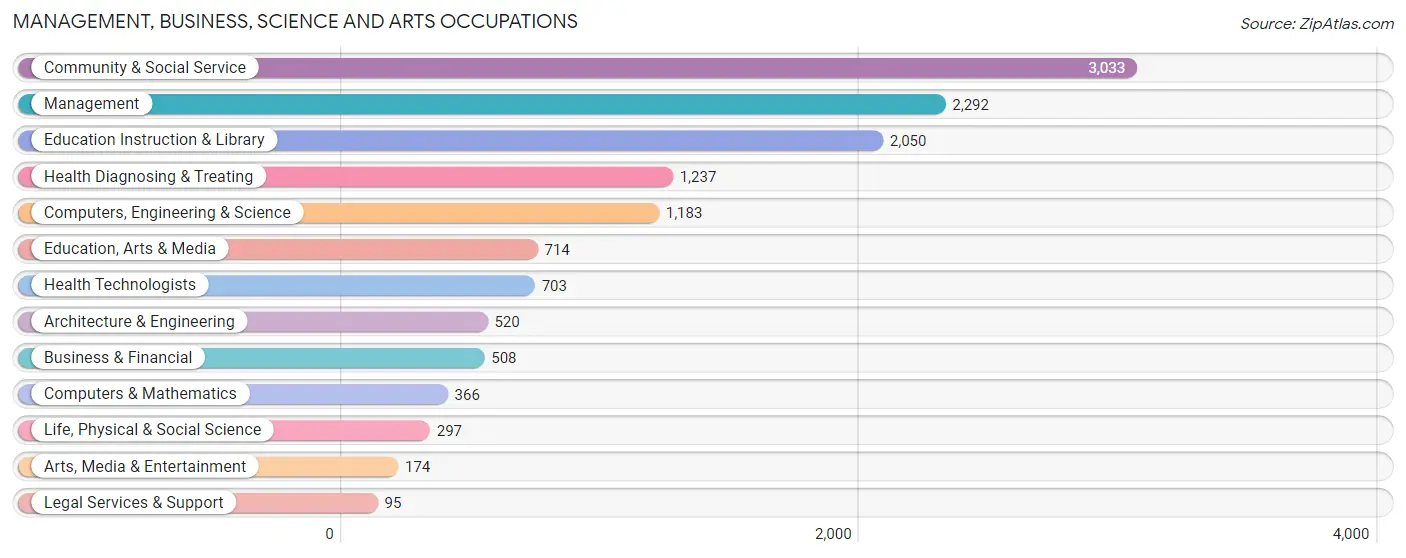
Management, Business, Science and Arts Occupations
The most common Management, Business, Science and Arts occupations in Terre Haute are Community & Social Service (3,033 | 12.3%), Management (2,292 | 9.3%), Education Instruction & Library (2,050 | 8.3%), Health Diagnosing & Treating (1,237 | 5.0%), and Computers, Engineering & Science (1,183 | 4.8%).
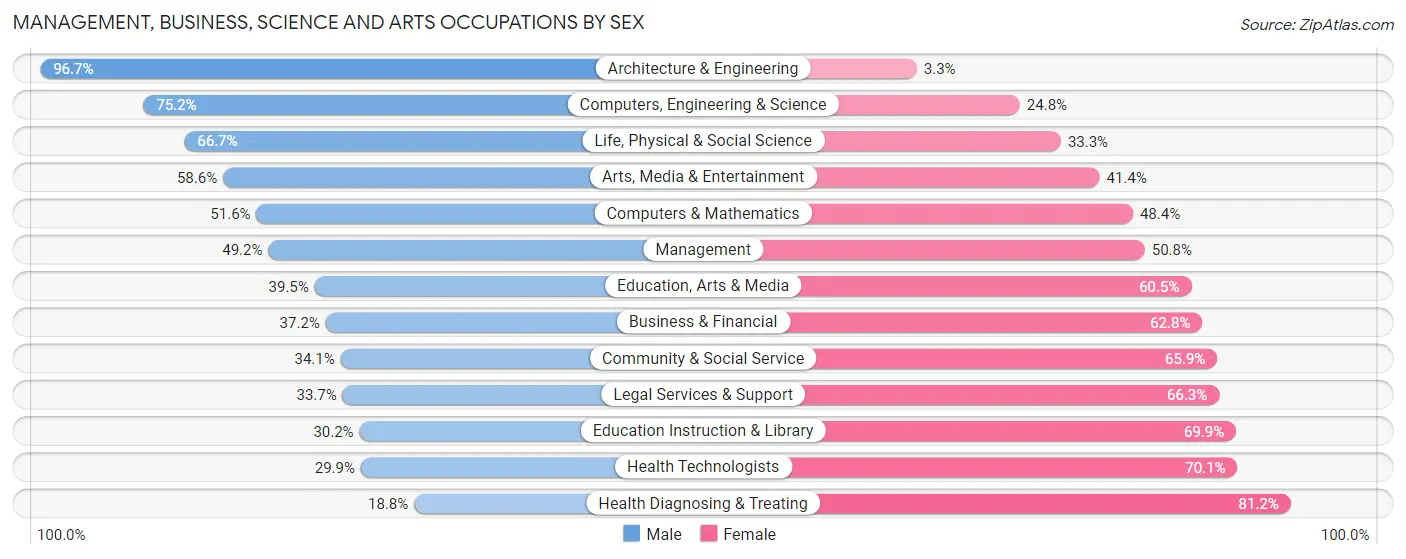
Management, Business, Science and Arts Occupations by Sex
Within the Management, Business, Science and Arts occupations in Terre Haute, the most male-oriented occupations are Architecture & Engineering (96.7%), Computers, Engineering & Science (75.2%), and Life, Physical & Social Science (66.7%), while the most female-oriented occupations are Health Diagnosing & Treating (81.2%), Health Technologists (70.1%), and Education Instruction & Library (69.9%).
| Occupation | Male | Female |
| Management | 1,127 (49.2%) | 1,165 (50.8%) |
| Business & Financial | 189 (37.2%) | 319 (62.8%) |
| Computers, Engineering & Science | 890 (75.2%) | 293 (24.8%) |
| Computers & Mathematics | 189 (51.6%) | 177 (48.4%) |
| Architecture & Engineering | 503 (96.7%) | 17 (3.3%) |
| Life, Physical & Social Science | 198 (66.7%) | 99 (33.3%) |
| Community & Social Service | 1,034 (34.1%) | 1,999 (65.9%) |
| Education, Arts & Media | 282 (39.5%) | 432 (60.5%) |
| Legal Services & Support | 32 (33.7%) | 63 (66.3%) |
| Education Instruction & Library | 618 (30.1%) | 1,432 (69.9%) |
| Arts, Media & Entertainment | 102 (58.6%) | 72 (41.4%) |
| Health Diagnosing & Treating | 232 (18.8%) | 1,005 (81.2%) |
| Health Technologists | 210 (29.9%) | 493 (70.1%) |
| Total (Category) | 3,472 (42.1%) | 4,781 (57.9%) |
| Total (Overall) | 12,087 (49.2%) | 12,501 (50.8%) |
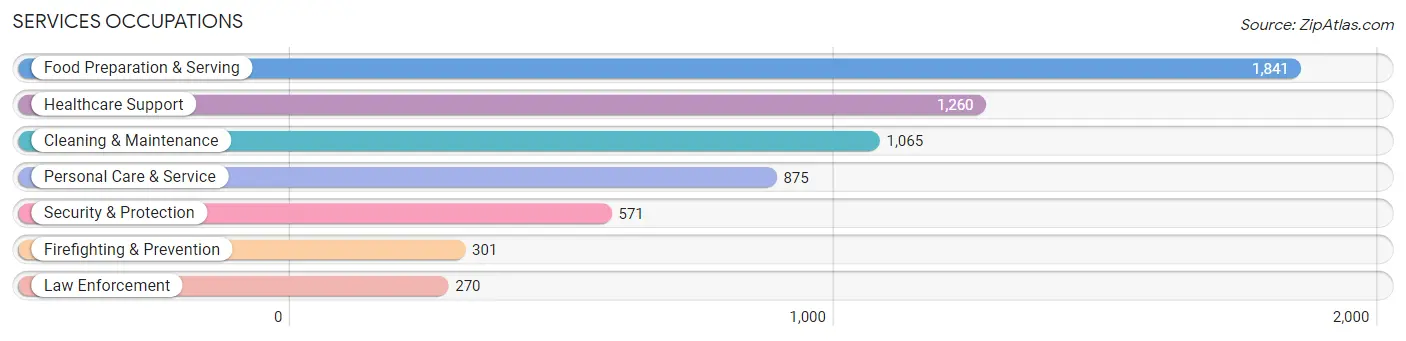
Services Occupations
The most common Services occupations in Terre Haute are Food Preparation & Serving (1,841 | 7.5%), Healthcare Support (1,260 | 5.1%), Cleaning & Maintenance (1,065 | 4.3%), Personal Care & Service (875 | 3.6%), and Security & Protection (571 | 2.3%).
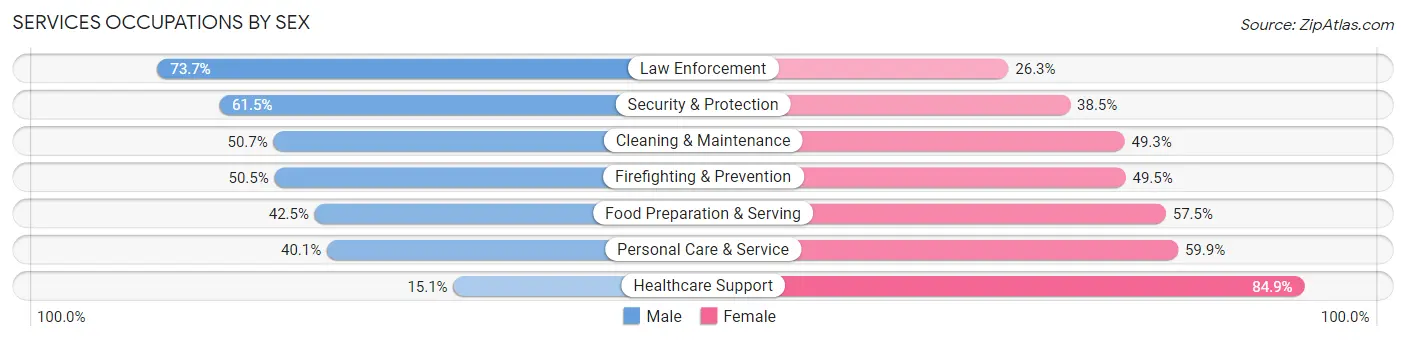
Services Occupations by Sex
Within the Services occupations in Terre Haute, the most male-oriented occupations are Law Enforcement (73.7%), Security & Protection (61.5%), and Cleaning & Maintenance (50.7%), while the most female-oriented occupations are Healthcare Support (84.9%), Personal Care & Service (59.9%), and Food Preparation & Serving (57.5%).
| Occupation | Male | Female |
| Healthcare Support | 190 (15.1%) | 1,070 (84.9%) |
| Security & Protection | 351 (61.5%) | 220 (38.5%) |
| Firefighting & Prevention | 152 (50.5%) | 149 (49.5%) |
| Law Enforcement | 199 (73.7%) | 71 (26.3%) |
| Food Preparation & Serving | 783 (42.5%) | 1,058 (57.5%) |
| Cleaning & Maintenance | 540 (50.7%) | 525 (49.3%) |
| Personal Care & Service | 351 (40.1%) | 524 (59.9%) |
| Total (Category) | 2,215 (39.5%) | 3,397 (60.5%) |
| Total (Overall) | 12,087 (49.2%) | 12,501 (50.8%) |
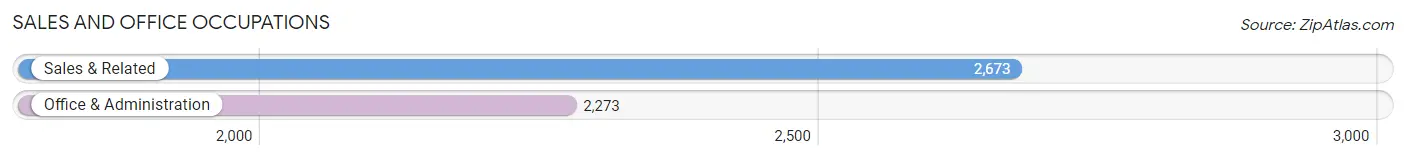
Sales and Office Occupations
The most common Sales and Office occupations in Terre Haute are Sales & Related (2,673 | 10.9%), and Office & Administration (2,273 | 9.2%).
Sales and Office Occupations by Sex
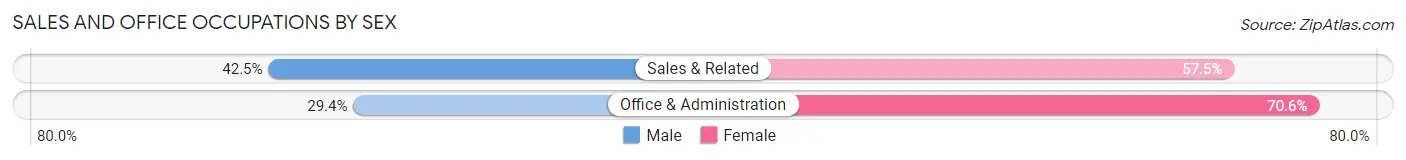
| Occupation | Male | Female |
| Sales & Related | 1,136 (42.5%) | 1,537 (57.5%) |
| Office & Administration | 669 (29.4%) | 1,604 (70.6%) |
| Total (Category) | 1,805 (36.5%) | 3,141 (63.5%) |
| Total (Overall) | 12,087 (49.2%) | 12,501 (50.8%) |
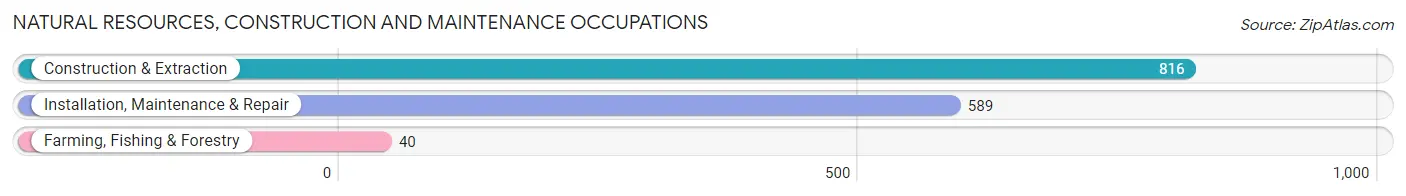
Natural Resources, Construction and Maintenance Occupations
The most common Natural Resources, Construction and Maintenance occupations in Terre Haute are Construction & Extraction (816 | 3.3%), Installation, Maintenance & Repair (589 | 2.4%), and Farming, Fishing & Forestry (40 | 0.2%).
Natural Resources, Construction and Maintenance Occupations by Sex
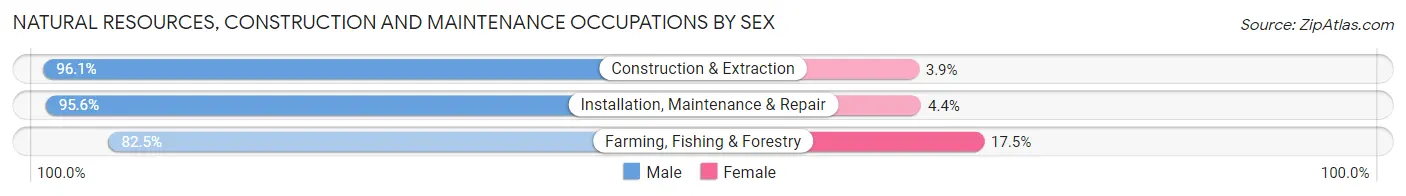
| Occupation | Male | Female |
| Farming, Fishing & Forestry | 33 (82.5%) | 7 (17.5%) |
| Construction & Extraction | 784 (96.1%) | 32 (3.9%) |
| Installation, Maintenance & Repair | 563 (95.6%) | 26 (4.4%) |
| Total (Category) | 1,380 (95.5%) | 65 (4.5%) |
| Total (Overall) | 12,087 (49.2%) | 12,501 (50.8%) |
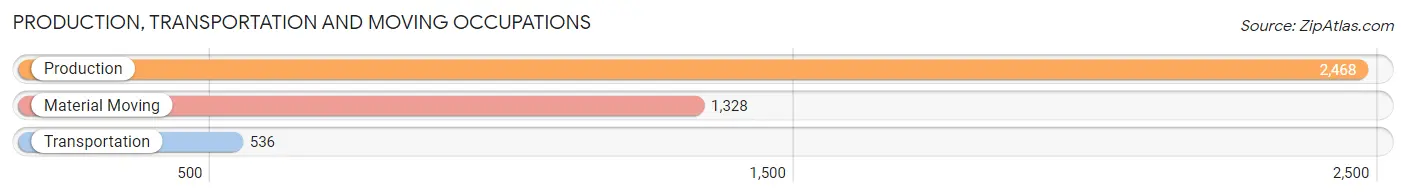
Production, Transportation and Moving Occupations
The most common Production, Transportation and Moving occupations in Terre Haute are Production (2,468 | 10.0%), Material Moving (1,328 | 5.4%), and Transportation (536 | 2.2%).
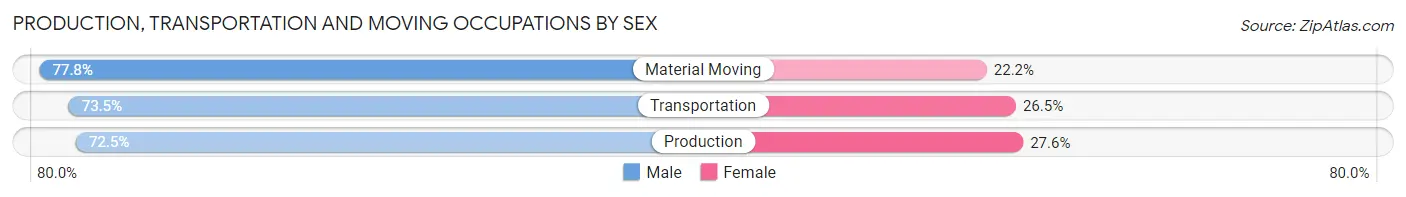
Production, Transportation and Moving Occupations by Sex
| Occupation | Male | Female |
| Production | 1,788 (72.5%) | 680 (27.6%) |
| Transportation | 394 (73.5%) | 142 (26.5%) |
| Material Moving | 1,033 (77.8%) | 295 (22.2%) |
| Total (Category) | 3,215 (74.2%) | 1,117 (25.8%) |
| Total (Overall) | 12,087 (49.2%) | 12,501 (50.8%) |
Employment Industries by Sex in Terre Haute
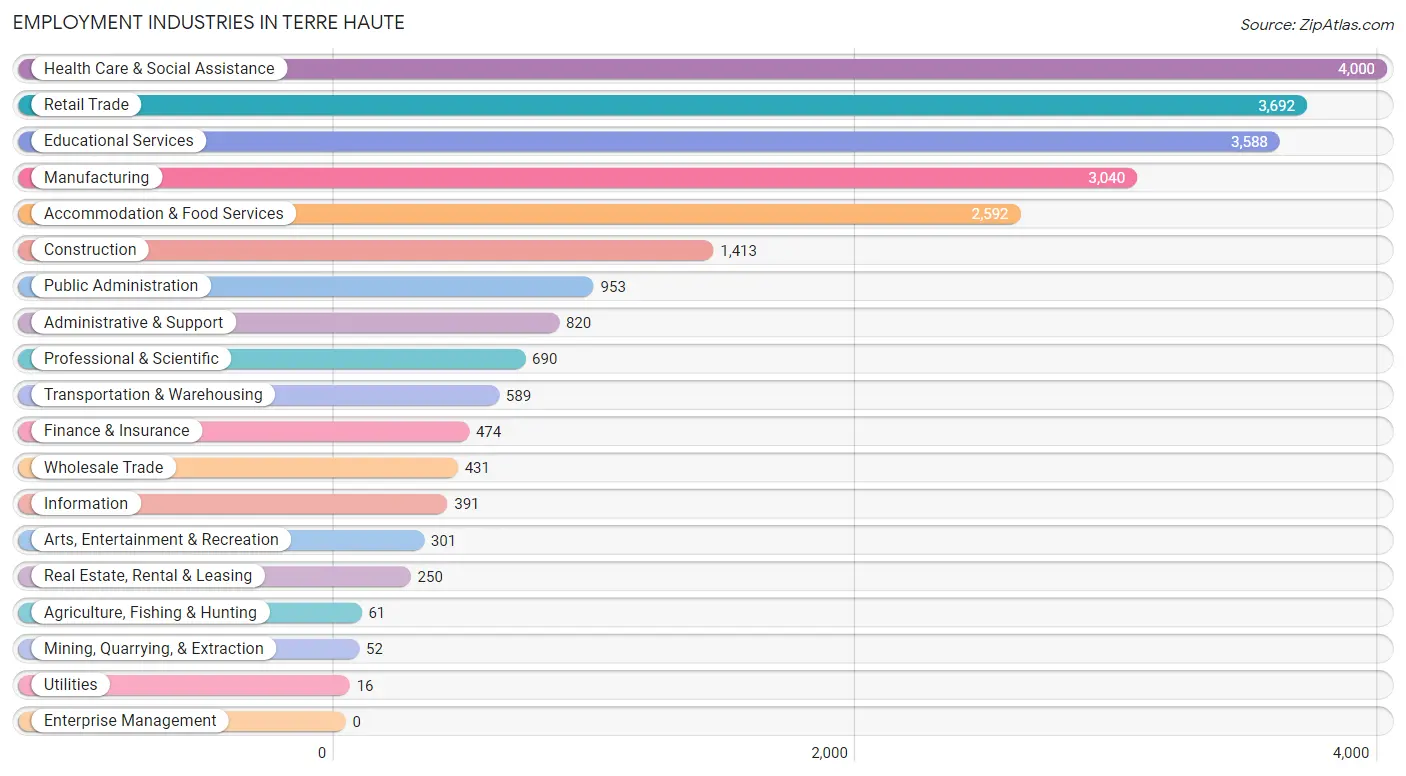
Employment Industries in Terre Haute
The major employment industries in Terre Haute include Health Care & Social Assistance (4,000 | 16.3%), Retail Trade (3,692 | 15.0%), Educational Services (3,588 | 14.6%), Manufacturing (3,040 | 12.4%), and Accommodation & Food Services (2,592 | 10.5%).
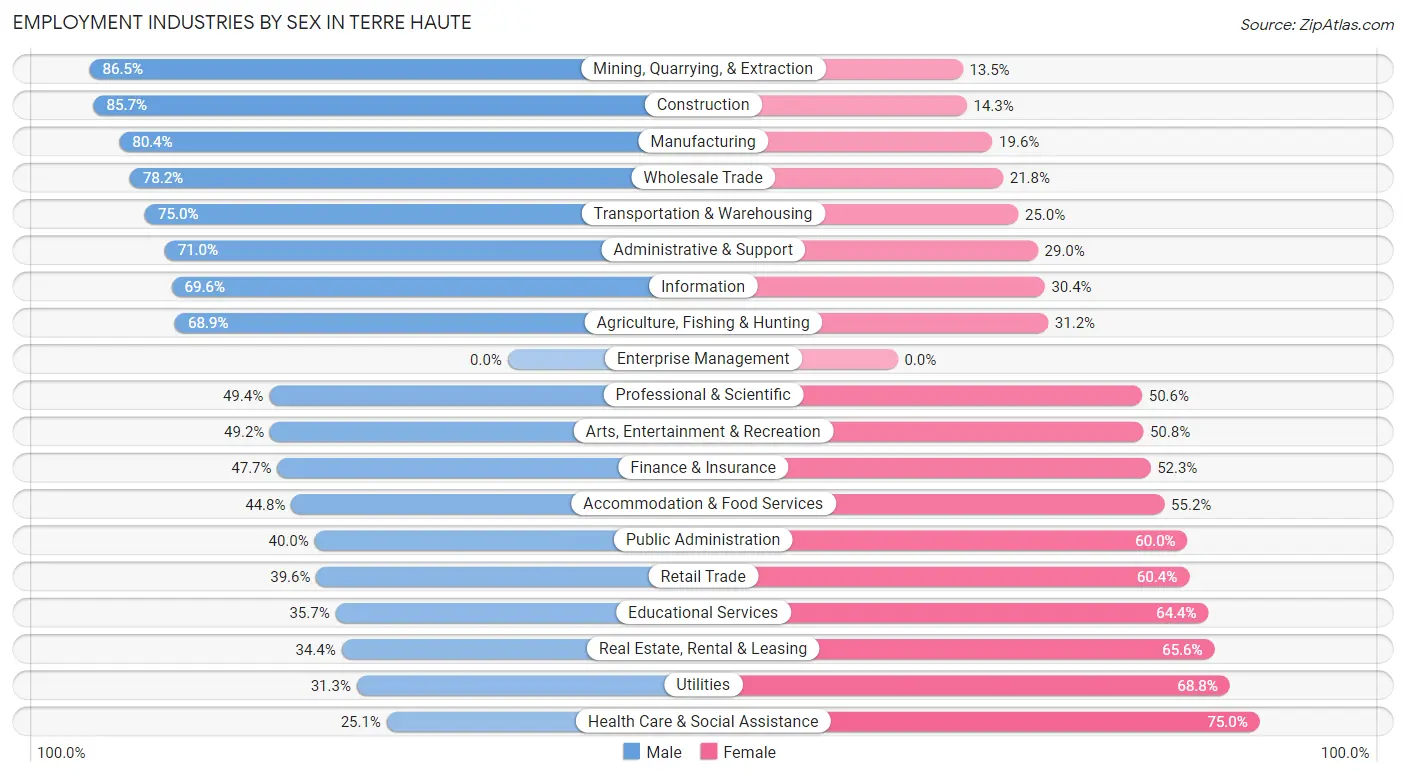
Employment Industries by Sex in Terre Haute
The Terre Haute industries that see more men than women are Mining, Quarrying, & Extraction (86.5%), Construction (85.7%), and Manufacturing (80.4%), whereas the industries that tend to have a higher number of women are Health Care & Social Assistance (75.0%), Utilities (68.8%), and Real Estate, Rental & Leasing (65.6%).
| Industry | Male | Female |
| Agriculture, Fishing & Hunting | 42 (68.9%) | 19 (31.1%) |
| Mining, Quarrying, & Extraction | 45 (86.5%) | 7 (13.5%) |
| Construction | 1,211 (85.7%) | 202 (14.3%) |
| Manufacturing | 2,444 (80.4%) | 596 (19.6%) |
| Wholesale Trade | 337 (78.2%) | 94 (21.8%) |
| Retail Trade | 1,463 (39.6%) | 2,229 (60.4%) |
| Transportation & Warehousing | 442 (75.0%) | 147 (25.0%) |
| Utilities | 5 (31.2%) | 11 (68.8%) |
| Information | 272 (69.6%) | 119 (30.4%) |
| Finance & Insurance | 226 (47.7%) | 248 (52.3%) |
| Real Estate, Rental & Leasing | 86 (34.4%) | 164 (65.6%) |
| Professional & Scientific | 341 (49.4%) | 349 (50.6%) |
| Enterprise Management | 0 (0.0%) | 0 (0.0%) |
| Administrative & Support | 582 (71.0%) | 238 (29.0%) |
| Educational Services | 1,279 (35.6%) | 2,309 (64.3%) |
| Health Care & Social Assistance | 1,002 (25.1%) | 2,998 (75.0%) |
| Arts, Entertainment & Recreation | 148 (49.2%) | 153 (50.8%) |
| Accommodation & Food Services | 1,161 (44.8%) | 1,431 (55.2%) |
| Public Administration | 381 (40.0%) | 572 (60.0%) |
| Total | 12,087 (49.2%) | 12,501 (50.8%) |
Education in Terre Haute
School Enrollment in Terre Haute
The most common levels of schooling among the 18,761 students in Terre Haute are college / undergraduate (8,996 | 47.9%), elementary school (2,638 | 14.1%), and middle school (2,487 | 13.3%).
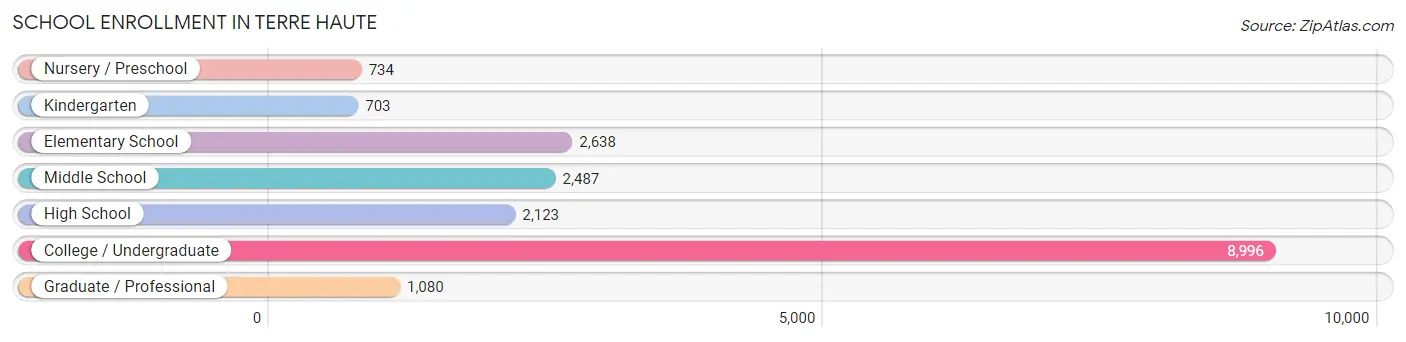
| School Level | # Students | % Students |
| Nursery / Preschool | 734 | 3.9% |
| Kindergarten | 703 | 3.7% |
| Elementary School | 2,638 | 14.1% |
| Middle School | 2,487 | 13.3% |
| High School | 2,123 | 11.3% |
| College / Undergraduate | 8,996 | 47.9% |
| Graduate / Professional | 1,080 | 5.8% |
| Total | 18,761 | 100.0% |
School Enrollment by Age by Funding Source in Terre Haute
Out of a total of 18,761 students who are enrolled in schools in Terre Haute, 2,908 (15.5%) attend a private institution, while the remaining 15,853 (84.5%) are enrolled in public schools. The age group of 18 to 19 year olds has the highest likelihood of being enrolled in private schools, with 721 (23.5% in the age bracket) enrolled. Conversely, the age group of 25 to 34 year olds has the lowest likelihood of being enrolled in a private school, with 1,105 (92.5% in the age bracket) attending a public institution.
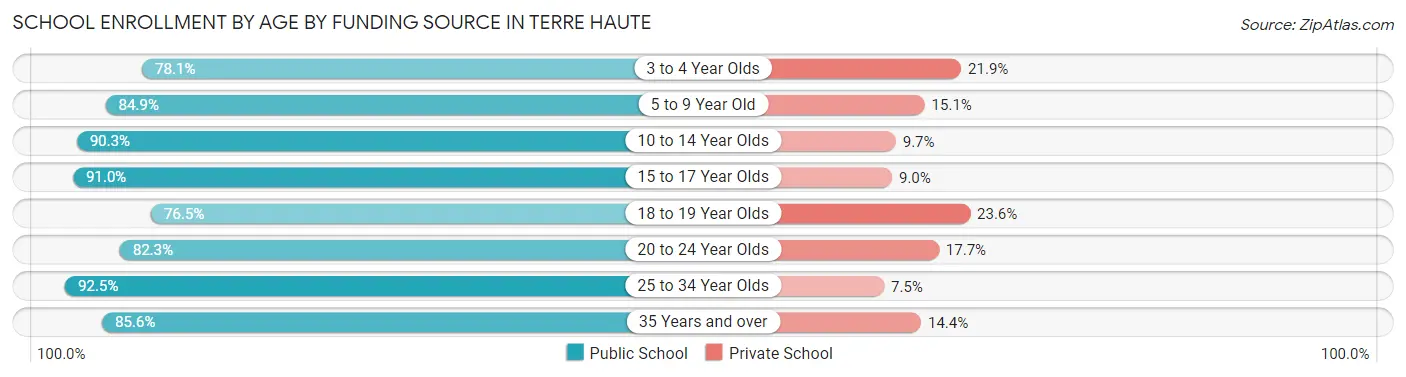
| Age Bracket | Public School | Private School |
| 3 to 4 Year Olds | 432 (78.1%) | 121 (21.9%) |
| 5 to 9 Year Old | 2,492 (84.9%) | 443 (15.1%) |
| 10 to 14 Year Olds | 2,891 (90.3%) | 311 (9.7%) |
| 15 to 17 Year Olds | 1,474 (91.0%) | 146 (9.0%) |
| 18 to 19 Year Olds | 2,341 (76.4%) | 721 (23.5%) |
| 20 to 24 Year Olds | 4,462 (82.3%) | 962 (17.7%) |
| 25 to 34 Year Olds | 1,105 (92.5%) | 90 (7.5%) |
| 35 Years and over | 659 (85.6%) | 111 (14.4%) |
| Total | 15,853 (84.5%) | 2,908 (15.5%) |
Educational Attainment by Field of Study in Terre Haute
Education (1,596 | 18.0%), business (1,284 | 14.5%), science & technology (1,078 | 12.1%), social sciences (713 | 8.0%), and arts & humanities (713 | 8.0%) are the most common fields of study among 8,880 individuals in Terre Haute who have obtained a bachelor's degree or higher.
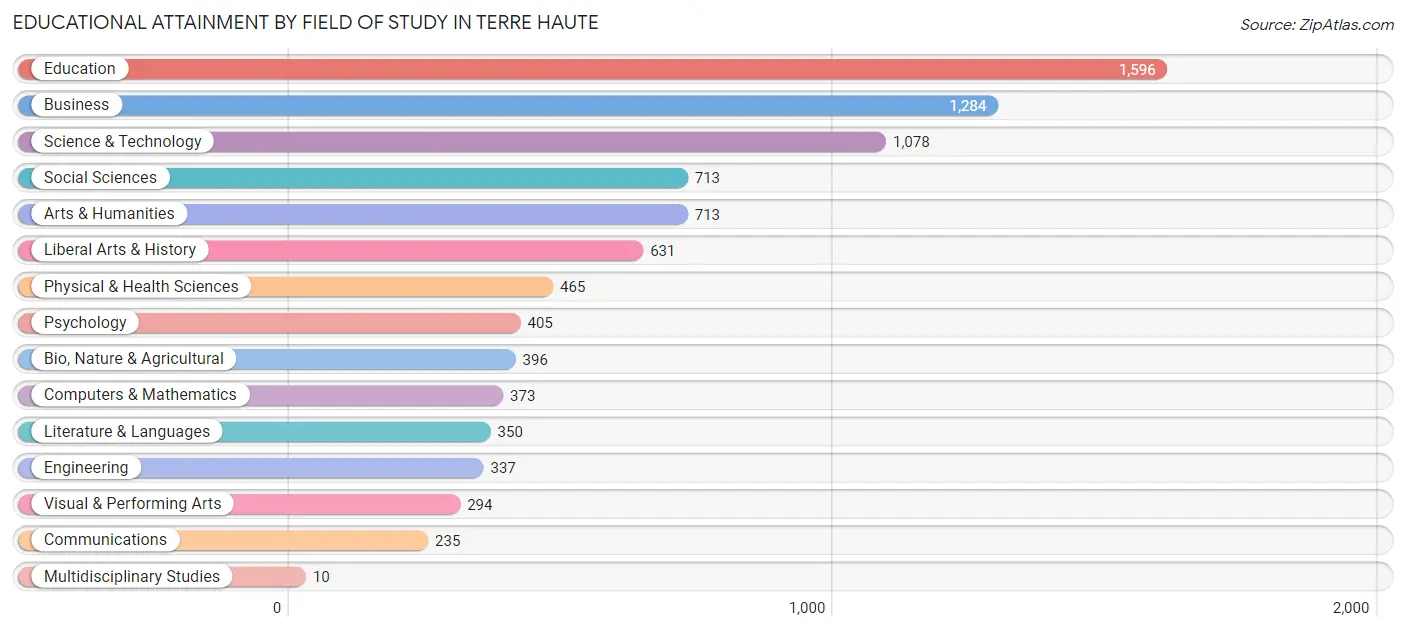
| Field of Study | # Graduates | % Graduates |
| Computers & Mathematics | 373 | 4.2% |
| Bio, Nature & Agricultural | 396 | 4.5% |
| Physical & Health Sciences | 465 | 5.2% |
| Psychology | 405 | 4.6% |
| Social Sciences | 713 | 8.0% |
| Engineering | 337 | 3.8% |
| Multidisciplinary Studies | 10 | 0.1% |
| Science & Technology | 1,078 | 12.1% |
| Business | 1,284 | 14.5% |
| Education | 1,596 | 18.0% |
| Literature & Languages | 350 | 3.9% |
| Liberal Arts & History | 631 | 7.1% |
| Visual & Performing Arts | 294 | 3.3% |
| Communications | 235 | 2.6% |
| Arts & Humanities | 713 | 8.0% |
| Total | 8,880 | 100.0% |
Transportation & Commute in Terre Haute
Vehicle Availability by Sex in Terre Haute
The most prevalent vehicle ownership categories in Terre Haute are males with 2 vehicles (4,584, accounting for 41.0%) and females with 2 vehicles (4,183, making up 41.5%).
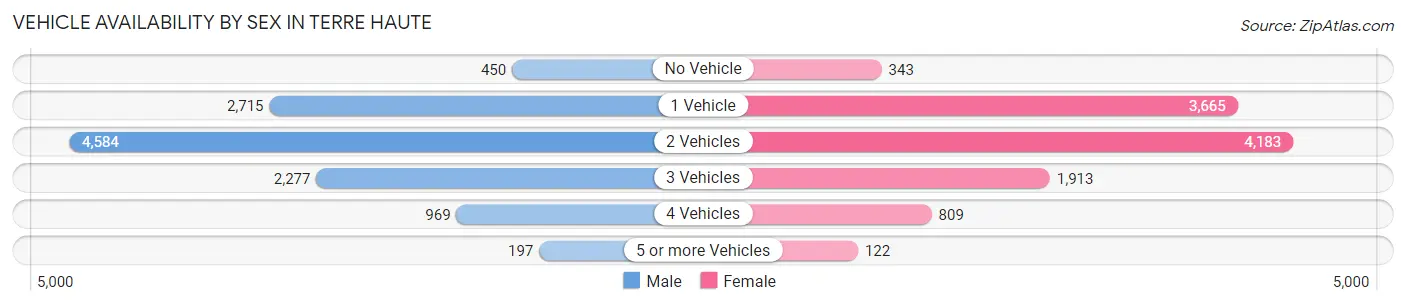
| Vehicles Available | Male | Female |
| No Vehicle | 450 (4.0%) | 343 (3.1%) |
| 1 Vehicle | 2,715 (24.3%) | 3,665 (33.2%) |
| 2 Vehicles | 4,584 (41.0%) | 4,183 (37.9%) |
| 3 Vehicles | 2,277 (20.3%) | 1,913 (17.3%) |
| 4 Vehicles | 969 (8.7%) | 809 (7.3%) |
| 5 or more Vehicles | 197 (1.8%) | 122 (1.1%) |
| Total | 11,192 (100.0%) | 11,035 (100.0%) |
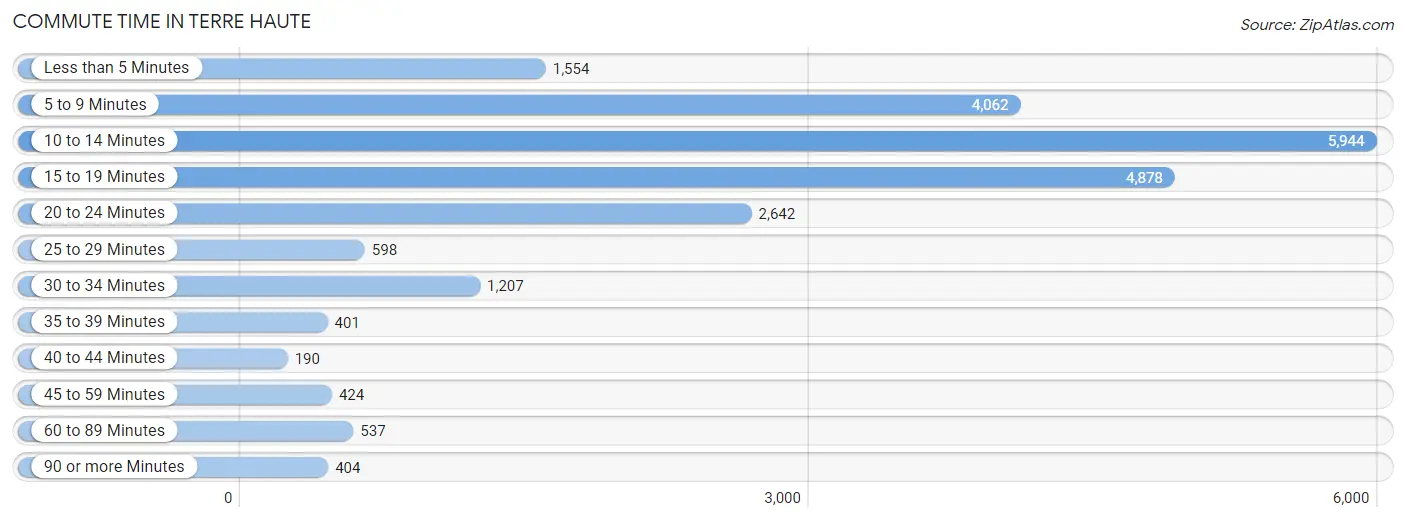
Commute Time in Terre Haute
The most frequently occuring commute durations in Terre Haute are 10 to 14 minutes (5,944 commuters, 26.0%), 15 to 19 minutes (4,878 commuters, 21.4%), and 5 to 9 minutes (4,062 commuters, 17.8%).
| Commute Time | # Commuters | % Commuters |
| Less than 5 Minutes | 1,554 | 6.8% |
| 5 to 9 Minutes | 4,062 | 17.8% |
| 10 to 14 Minutes | 5,944 | 26.0% |
| 15 to 19 Minutes | 4,878 | 21.4% |
| 20 to 24 Minutes | 2,642 | 11.6% |
| 25 to 29 Minutes | 598 | 2.6% |
| 30 to 34 Minutes | 1,207 | 5.3% |
| 35 to 39 Minutes | 401 | 1.8% |
| 40 to 44 Minutes | 190 | 0.8% |
| 45 to 59 Minutes | 424 | 1.9% |
| 60 to 89 Minutes | 537 | 2.4% |
| 90 or more Minutes | 404 | 1.8% |
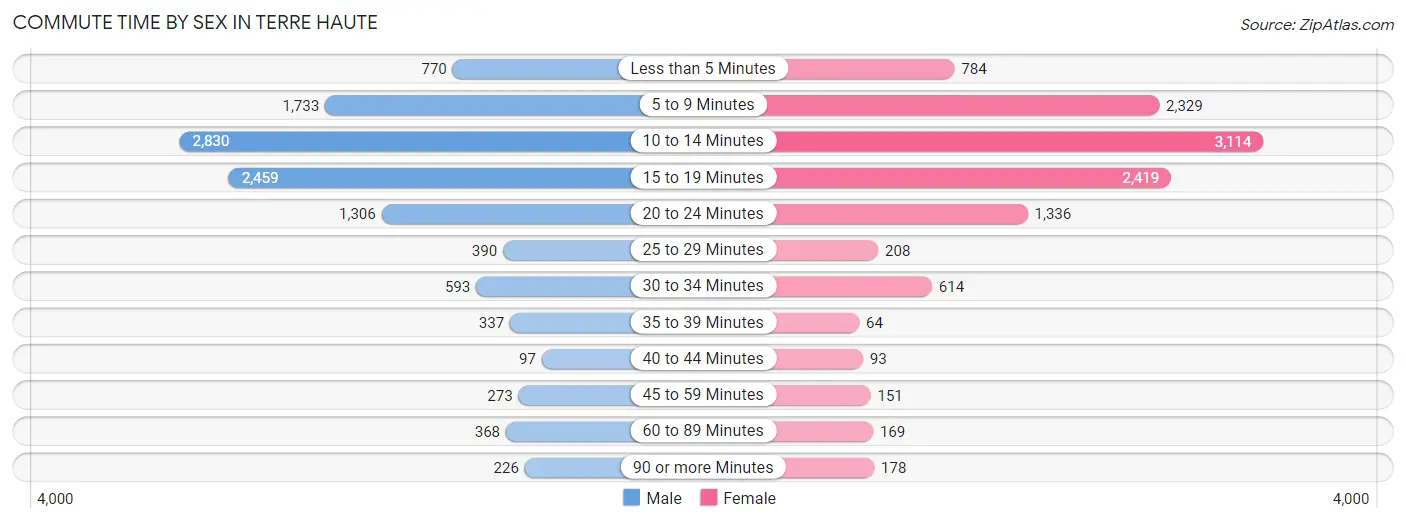
Commute Time by Sex in Terre Haute
The most common commute times in Terre Haute are 10 to 14 minutes (2,830 commuters, 24.9%) for males and 10 to 14 minutes (3,114 commuters, 27.2%) for females.
| Commute Time | Male | Female |
| Less than 5 Minutes | 770 (6.8%) | 784 (6.8%) |
| 5 to 9 Minutes | 1,733 (15.2%) | 2,329 (20.3%) |
| 10 to 14 Minutes | 2,830 (24.9%) | 3,114 (27.2%) |
| 15 to 19 Minutes | 2,459 (21.6%) | 2,419 (21.1%) |
| 20 to 24 Minutes | 1,306 (11.5%) | 1,336 (11.7%) |
| 25 to 29 Minutes | 390 (3.4%) | 208 (1.8%) |
| 30 to 34 Minutes | 593 (5.2%) | 614 (5.4%) |
| 35 to 39 Minutes | 337 (3.0%) | 64 (0.6%) |
| 40 to 44 Minutes | 97 (0.9%) | 93 (0.8%) |
| 45 to 59 Minutes | 273 (2.4%) | 151 (1.3%) |
| 60 to 89 Minutes | 368 (3.2%) | 169 (1.5%) |
| 90 or more Minutes | 226 (2.0%) | 178 (1.5%) |
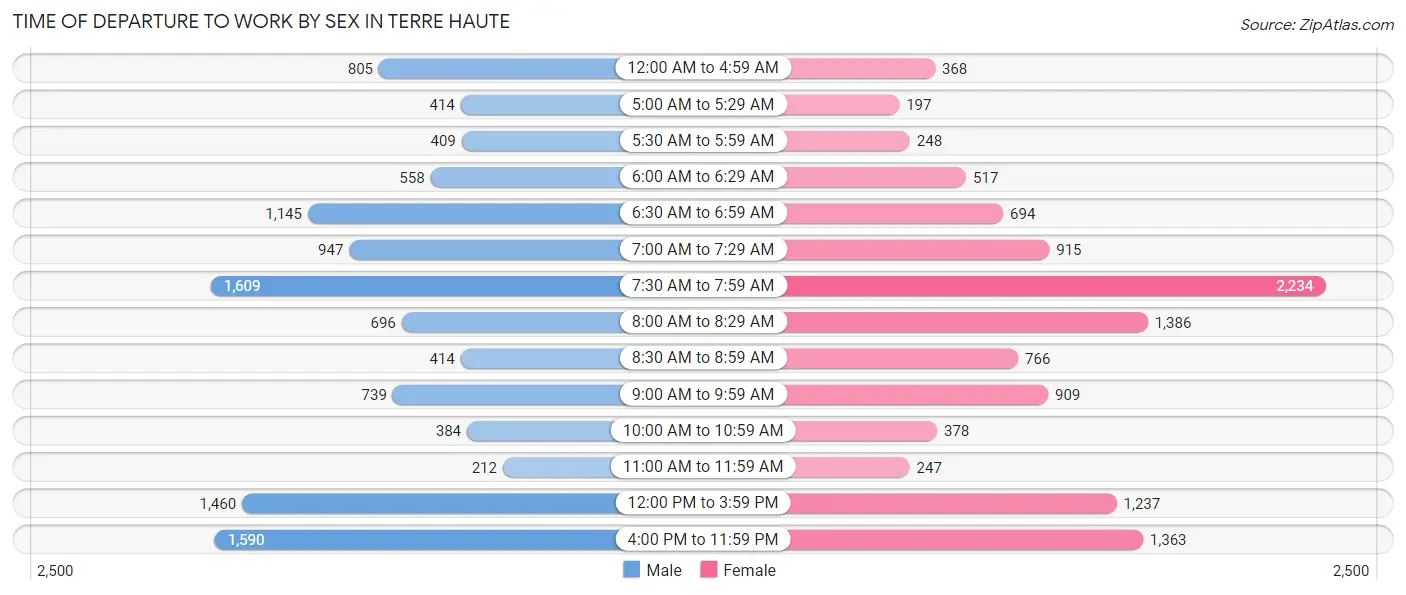
Time of Departure to Work by Sex in Terre Haute
The most frequent times of departure to work in Terre Haute are 7:30 AM to 7:59 AM (1,609, 14.1%) for males and 7:30 AM to 7:59 AM (2,234, 19.5%) for females.
| Time of Departure | Male | Female |
| 12:00 AM to 4:59 AM | 805 (7.1%) | 368 (3.2%) |
| 5:00 AM to 5:29 AM | 414 (3.6%) | 197 (1.7%) |
| 5:30 AM to 5:59 AM | 409 (3.6%) | 248 (2.2%) |
| 6:00 AM to 6:29 AM | 558 (4.9%) | 517 (4.5%) |
| 6:30 AM to 6:59 AM | 1,145 (10.1%) | 694 (6.1%) |
| 7:00 AM to 7:29 AM | 947 (8.3%) | 915 (8.0%) |
| 7:30 AM to 7:59 AM | 1,609 (14.1%) | 2,234 (19.5%) |
| 8:00 AM to 8:29 AM | 696 (6.1%) | 1,386 (12.1%) |
| 8:30 AM to 8:59 AM | 414 (3.6%) | 766 (6.7%) |
| 9:00 AM to 9:59 AM | 739 (6.5%) | 909 (7.9%) |
| 10:00 AM to 10:59 AM | 384 (3.4%) | 378 (3.3%) |
| 11:00 AM to 11:59 AM | 212 (1.9%) | 247 (2.2%) |
| 12:00 PM to 3:59 PM | 1,460 (12.8%) | 1,237 (10.8%) |
| 4:00 PM to 11:59 PM | 1,590 (14.0%) | 1,363 (11.9%) |
| Total | 11,382 (100.0%) | 11,459 (100.0%) |
Housing Occupancy in Terre Haute
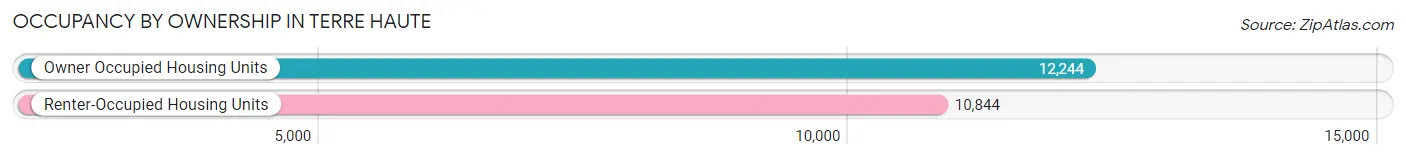
Occupancy by Ownership in Terre Haute
Of the total 23,088 dwellings in Terre Haute, owner-occupied units account for 12,244 (53.0%), while renter-occupied units make up 10,844 (47.0%).
| Occupancy | # Housing Units | % Housing Units |
| Owner Occupied Housing Units | 12,244 | 53.0% |
| Renter-Occupied Housing Units | 10,844 | 47.0% |
| Total Occupied Housing Units | 23,088 | 100.0% |
Occupancy by Household Size in Terre Haute
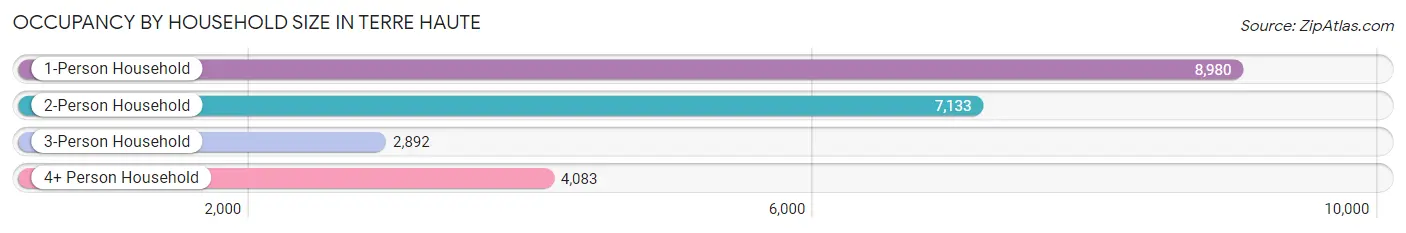
| Household Size | # Housing Units | % Housing Units |
| 1-Person Household | 8,980 | 38.9% |
| 2-Person Household | 7,133 | 30.9% |
| 3-Person Household | 2,892 | 12.5% |
| 4+ Person Household | 4,083 | 17.7% |
| Total Housing Units | 23,088 | 100.0% |
Occupancy by Ownership by Household Size in Terre Haute
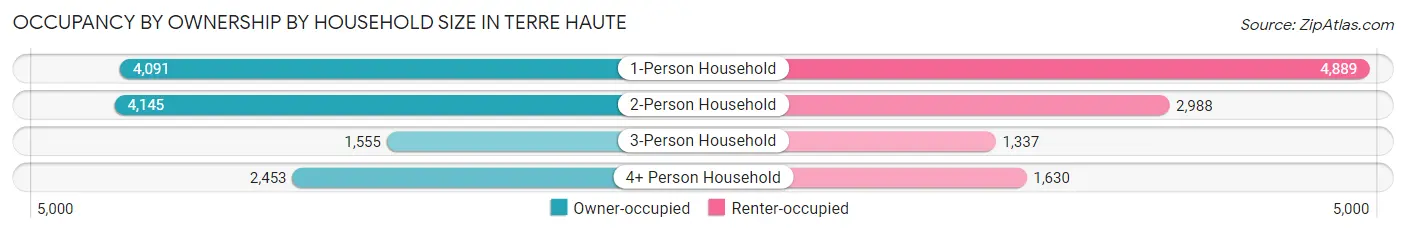
| Household Size | Owner-occupied | Renter-occupied |
| 1-Person Household | 4,091 (45.6%) | 4,889 (54.4%) |
| 2-Person Household | 4,145 (58.1%) | 2,988 (41.9%) |
| 3-Person Household | 1,555 (53.8%) | 1,337 (46.2%) |
| 4+ Person Household | 2,453 (60.1%) | 1,630 (39.9%) |
| Total Housing Units | 12,244 (53.0%) | 10,844 (47.0%) |
Occupancy by Educational Attainment in Terre Haute
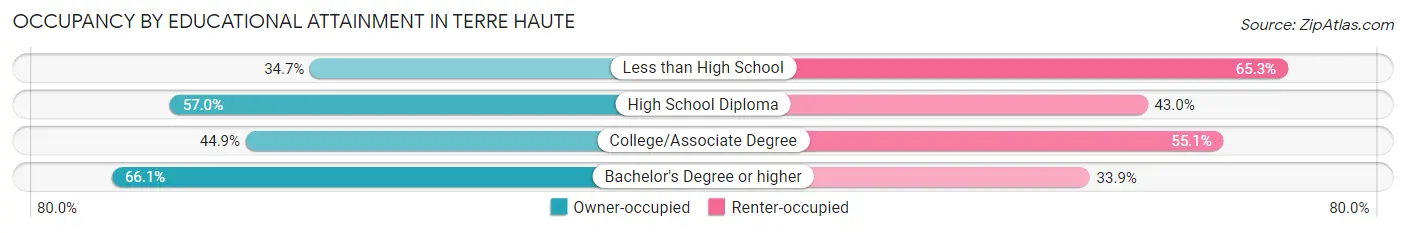
| Household Size | Owner-occupied | Renter-occupied |
| Less than High School | 618 (34.7%) | 1,163 (65.3%) |
| High School Diploma | 3,826 (57.0%) | 2,890 (43.0%) |
| College/Associate Degree | 3,914 (44.9%) | 4,802 (55.1%) |
| Bachelor's Degree or higher | 3,886 (66.1%) | 1,989 (33.9%) |
Occupancy by Age of Householder in Terre Haute
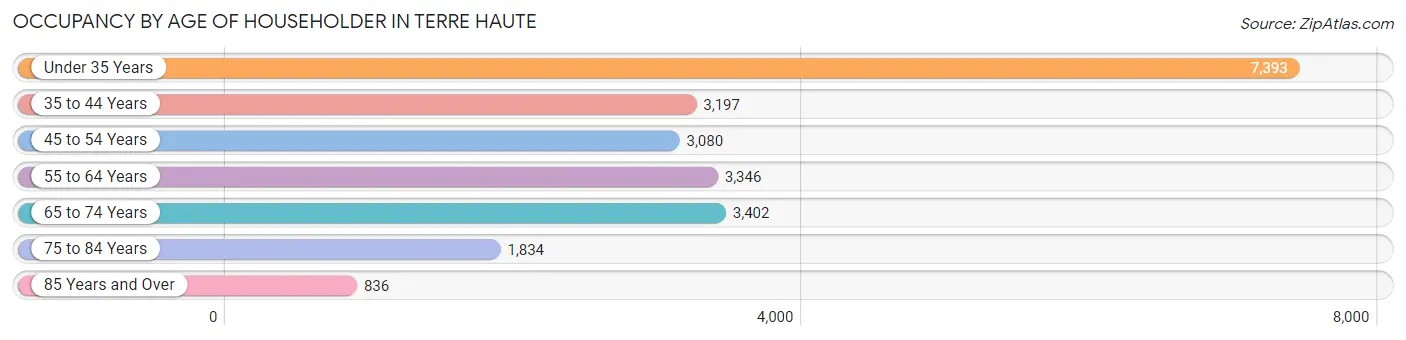
| Age Bracket | # Households | % Households |
| Under 35 Years | 7,393 | 32.0% |
| 35 to 44 Years | 3,197 | 13.9% |
| 45 to 54 Years | 3,080 | 13.3% |
| 55 to 64 Years | 3,346 | 14.5% |
| 65 to 74 Years | 3,402 | 14.7% |
| 75 to 84 Years | 1,834 | 7.9% |
| 85 Years and Over | 836 | 3.6% |
| Total | 23,088 | 100.0% |
Housing Finances in Terre Haute
Median Income by Occupancy in Terre Haute
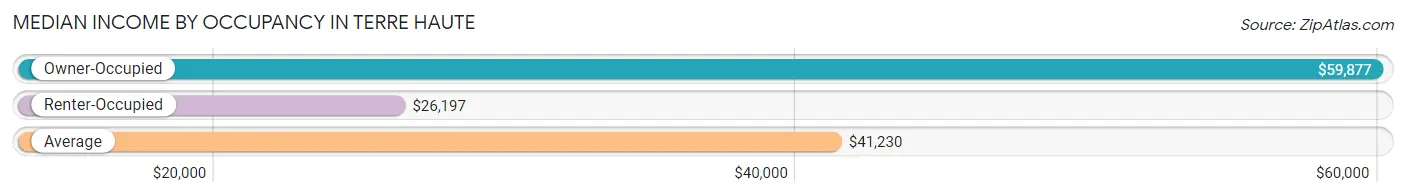
| Occupancy Type | # Households | Median Income |
| Owner-Occupied | 12,244 (53.0%) | $59,877 |
| Renter-Occupied | 10,844 (47.0%) | $26,197 |
| Average | 23,088 (100.0%) | $41,230 |
Occupancy by Householder Income Bracket in Terre Haute
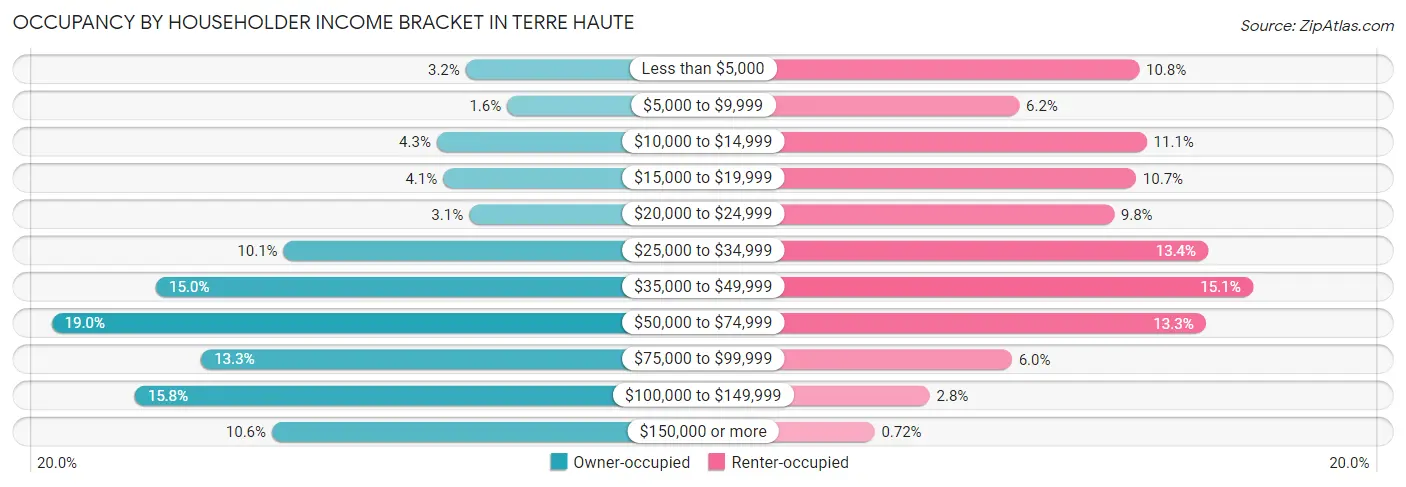
| Income Bracket | Owner-occupied | Renter-occupied |
| Less than $5,000 | 392 (3.2%) | 1,171 (10.8%) |
| $5,000 to $9,999 | 198 (1.6%) | 676 (6.2%) |
| $10,000 to $14,999 | 526 (4.3%) | 1,203 (11.1%) |
| $15,000 to $19,999 | 497 (4.1%) | 1,158 (10.7%) |
| $20,000 to $24,999 | 376 (3.1%) | 1,067 (9.8%) |
| $25,000 to $34,999 | 1,242 (10.1%) | 1,455 (13.4%) |
| $35,000 to $49,999 | 1,835 (15.0%) | 1,640 (15.1%) |
| $50,000 to $74,999 | 2,323 (19.0%) | 1,445 (13.3%) |
| $75,000 to $99,999 | 1,625 (13.3%) | 645 (5.9%) |
| $100,000 to $149,999 | 1,934 (15.8%) | 306 (2.8%) |
| $150,000 or more | 1,296 (10.6%) | 78 (0.7%) |
| Total | 12,244 (100.0%) | 10,844 (100.0%) |
Monthly Housing Cost Tiers in Terre Haute
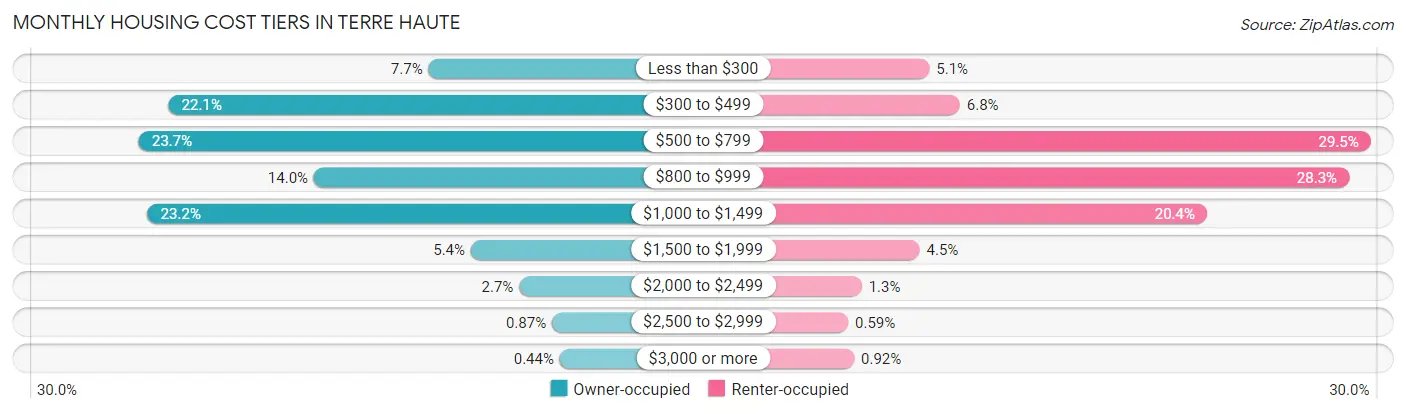
| Monthly Cost | Owner-occupied | Renter-occupied |
| Less than $300 | 942 (7.7%) | 551 (5.1%) |
| $300 to $499 | 2,700 (22.1%) | 733 (6.8%) |
| $500 to $799 | 2,901 (23.7%) | 3,194 (29.4%) |
| $800 to $999 | 1,716 (14.0%) | 3,063 (28.2%) |
| $1,000 to $1,499 | 2,842 (23.2%) | 2,212 (20.4%) |
| $1,500 to $1,999 | 655 (5.3%) | 492 (4.5%) |
| $2,000 to $2,499 | 328 (2.7%) | 145 (1.3%) |
| $2,500 to $2,999 | 106 (0.9%) | 64 (0.6%) |
| $3,000 or more | 54 (0.4%) | 100 (0.9%) |
| Total | 12,244 (100.0%) | 10,844 (100.0%) |
Physical Housing Characteristics in Terre Haute
Housing Structures in Terre Haute
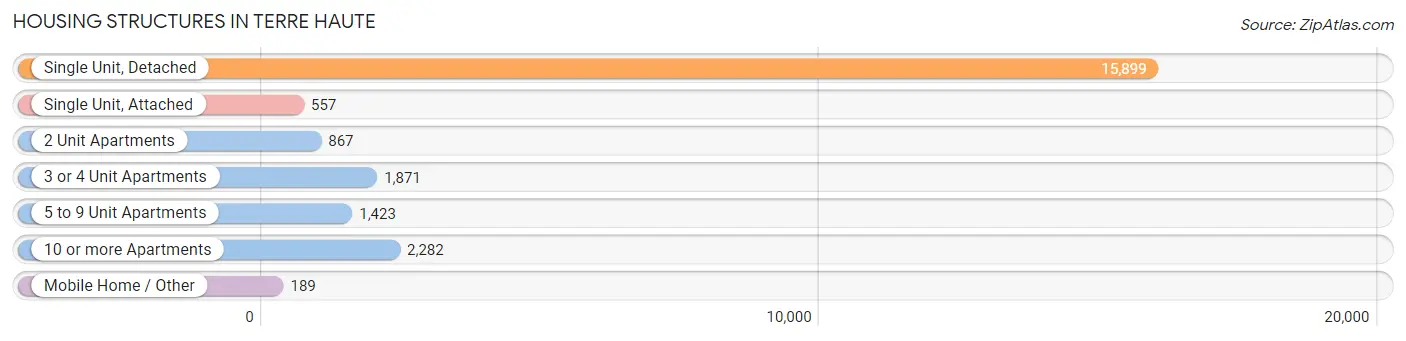
| Structure Type | # Housing Units | % Housing Units |
| Single Unit, Detached | 15,899 | 68.9% |
| Single Unit, Attached | 557 | 2.4% |
| 2 Unit Apartments | 867 | 3.8% |
| 3 or 4 Unit Apartments | 1,871 | 8.1% |
| 5 to 9 Unit Apartments | 1,423 | 6.2% |
| 10 or more Apartments | 2,282 | 9.9% |
| Mobile Home / Other | 189 | 0.8% |
| Total | 23,088 | 100.0% |
Housing Structures by Occupancy in Terre Haute
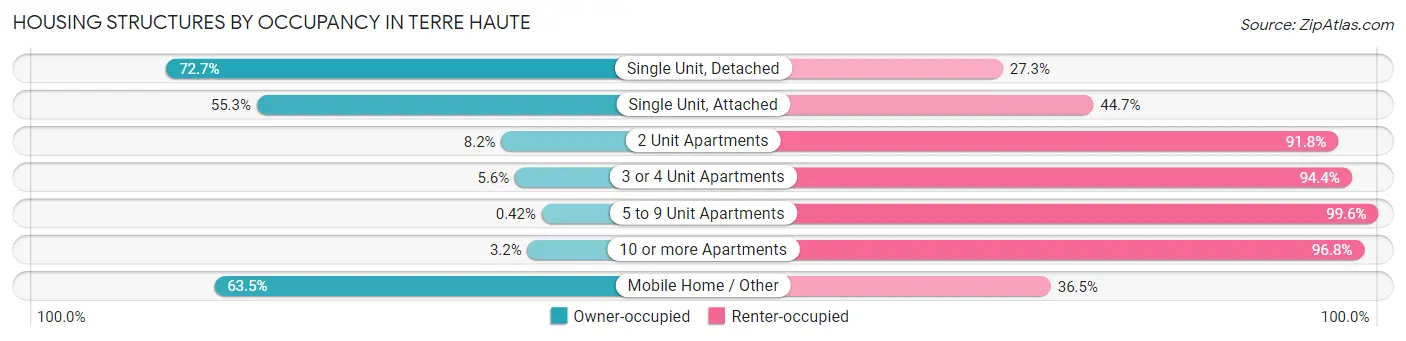
| Structure Type | Owner-occupied | Renter-occupied |
| Single Unit, Detached | 11,563 (72.7%) | 4,336 (27.3%) |
| Single Unit, Attached | 308 (55.3%) | 249 (44.7%) |
| 2 Unit Apartments | 71 (8.2%) | 796 (91.8%) |
| 3 or 4 Unit Apartments | 104 (5.6%) | 1,767 (94.4%) |
| 5 to 9 Unit Apartments | 6 (0.4%) | 1,417 (99.6%) |
| 10 or more Apartments | 72 (3.2%) | 2,210 (96.8%) |
| Mobile Home / Other | 120 (63.5%) | 69 (36.5%) |
| Total | 12,244 (53.0%) | 10,844 (47.0%) |
Housing Structures by Number of Rooms in Terre Haute
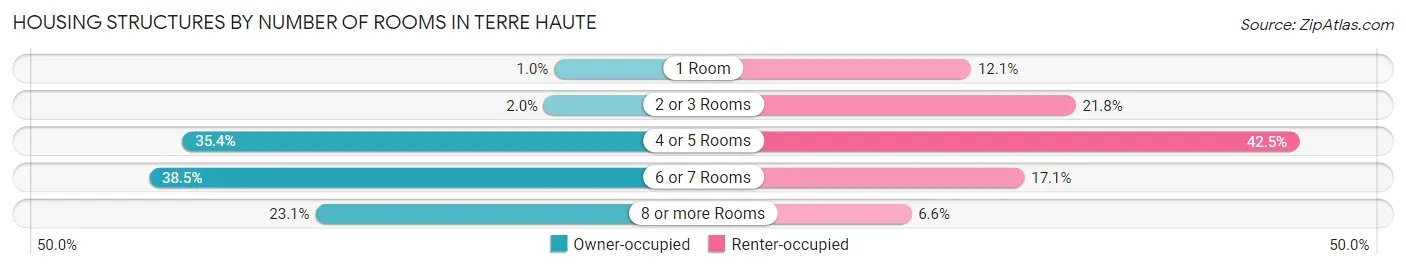
| Number of Rooms | Owner-occupied | Renter-occupied |
| 1 Room | 125 (1.0%) | 1,314 (12.1%) |
| 2 or 3 Rooms | 241 (2.0%) | 2,363 (21.8%) |
| 4 or 5 Rooms | 4,336 (35.4%) | 4,603 (42.4%) |
| 6 or 7 Rooms | 4,712 (38.5%) | 1,849 (17.1%) |
| 8 or more Rooms | 2,830 (23.1%) | 715 (6.6%) |
| Total | 12,244 (100.0%) | 10,844 (100.0%) |
Housing Structure by Heating Type in Terre Haute
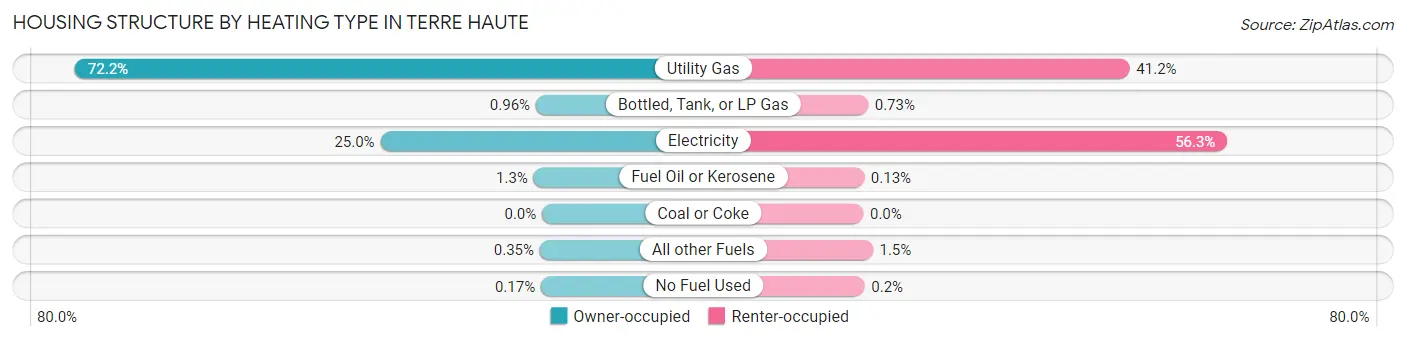
| Heating Type | Owner-occupied | Renter-occupied |
| Utility Gas | 8,843 (72.2%) | 4,466 (41.2%) |
| Bottled, Tank, or LP Gas | 118 (1.0%) | 79 (0.7%) |
| Electricity | 3,060 (25.0%) | 6,104 (56.3%) |
| Fuel Oil or Kerosene | 159 (1.3%) | 14 (0.1%) |
| Coal or Coke | 0 (0.0%) | 0 (0.0%) |
| All other Fuels | 43 (0.4%) | 159 (1.5%) |
| No Fuel Used | 21 (0.2%) | 22 (0.2%) |
| Total | 12,244 (100.0%) | 10,844 (100.0%) |
Household Vehicle Usage in Terre Haute
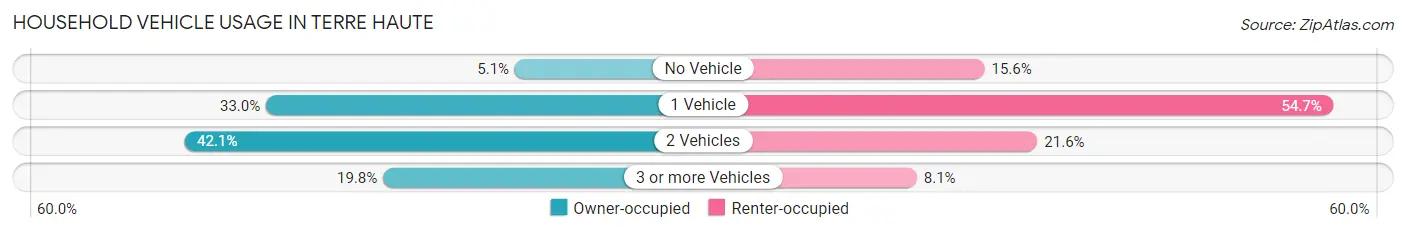
| Vehicles per Household | Owner-occupied | Renter-occupied |
| No Vehicle | 621 (5.1%) | 1,696 (15.6%) |
| 1 Vehicle | 4,034 (33.0%) | 5,936 (54.7%) |
| 2 Vehicles | 5,160 (42.1%) | 2,338 (21.6%) |
| 3 or more Vehicles | 2,429 (19.8%) | 874 (8.1%) |
| Total | 12,244 (100.0%) | 10,844 (100.0%) |
Real Estate & Mortgages in Terre Haute
Real Estate and Mortgage Overview in Terre Haute
| Characteristic | Without Mortgage | With Mortgage |
| Housing Units | 4,813 | 7,431 |
| Median Property Value | $92,600 | $110,700 |
| Median Household Income | $48,397 | $807 |
| Monthly Housing Costs | $412 | $42 |
| Real Estate Taxes | $942 | $369 |
Property Value by Mortgage Status in Terre Haute
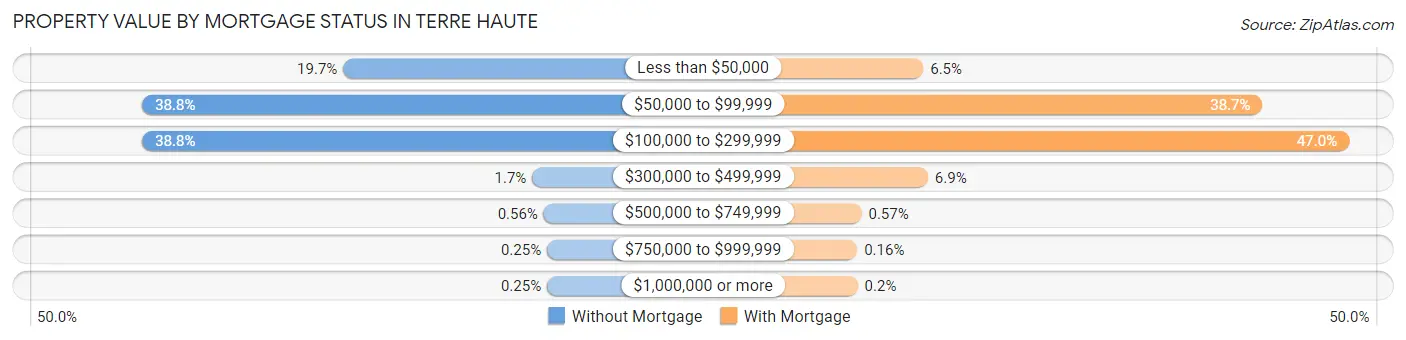
| Property Value | Without Mortgage | With Mortgage |
| Less than $50,000 | 946 (19.7%) | 479 (6.5%) |
| $50,000 to $99,999 | 1,868 (38.8%) | 2,879 (38.7%) |
| $100,000 to $299,999 | 1,868 (38.8%) | 3,492 (47.0%) |
| $300,000 to $499,999 | 80 (1.7%) | 512 (6.9%) |
| $500,000 to $749,999 | 27 (0.6%) | 42 (0.6%) |
| $750,000 to $999,999 | 12 (0.3%) | 12 (0.2%) |
| $1,000,000 or more | 12 (0.3%) | 15 (0.2%) |
| Total | 4,813 (100.0%) | 7,431 (100.0%) |
Household Income by Mortgage Status in Terre Haute
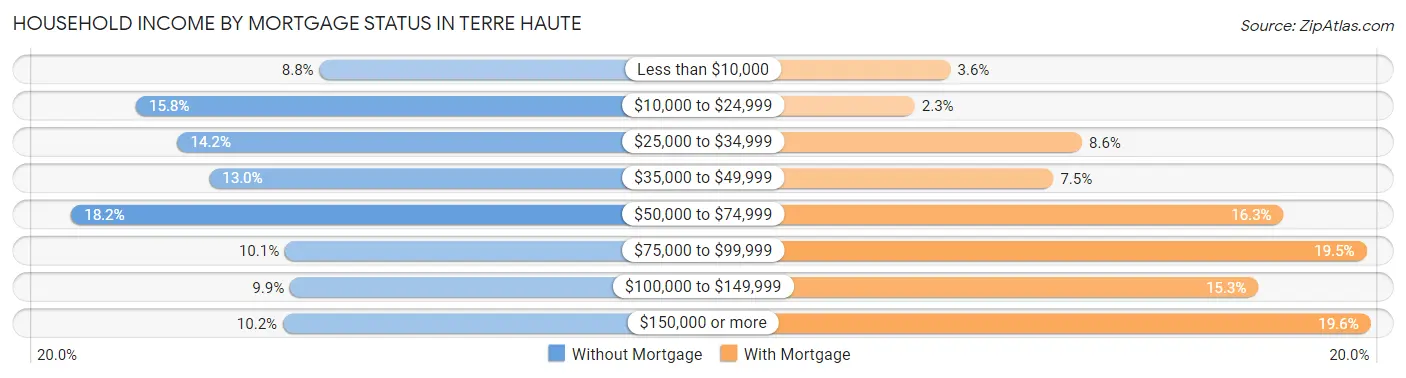
| Household Income | Without Mortgage | With Mortgage |
| Less than $10,000 | 422 (8.8%) | 269 (3.6%) |
| $10,000 to $24,999 | 758 (15.8%) | 168 (2.3%) |
| $25,000 to $34,999 | 682 (14.2%) | 641 (8.6%) |
| $35,000 to $49,999 | 624 (13.0%) | 560 (7.5%) |
| $50,000 to $74,999 | 877 (18.2%) | 1,211 (16.3%) |
| $75,000 to $99,999 | 485 (10.1%) | 1,446 (19.5%) |
| $100,000 to $149,999 | 476 (9.9%) | 1,140 (15.3%) |
| $150,000 or more | 489 (10.2%) | 1,458 (19.6%) |
| Total | 4,813 (100.0%) | 7,431 (100.0%) |
Property Value to Household Income Ratio in Terre Haute
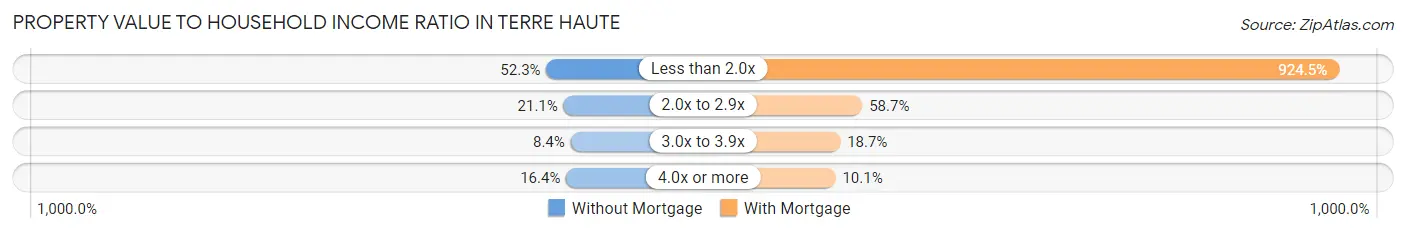
| Value-to-Income Ratio | Without Mortgage | With Mortgage |
| Less than 2.0x | 2,519 (52.3%) | 68,702 (924.5%) |
| 2.0x to 2.9x | 1,013 (21.0%) | 4,358 (58.7%) |
| 3.0x to 3.9x | 403 (8.4%) | 1,388 (18.7%) |
| 4.0x or more | 787 (16.4%) | 753 (10.1%) |
| Total | 4,813 (100.0%) | 7,431 (100.0%) |
Real Estate Taxes by Mortgage Status in Terre Haute
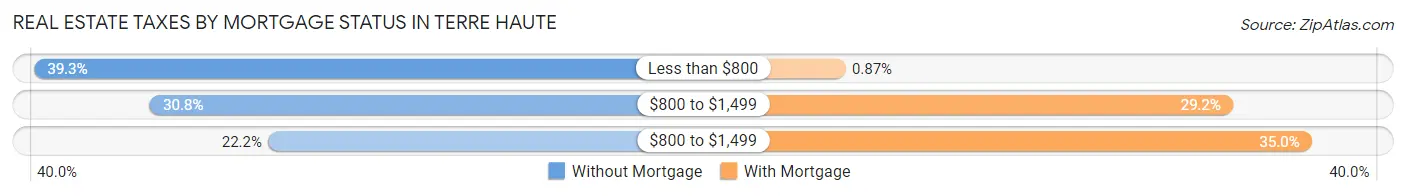
| Property Taxes | Without Mortgage | With Mortgage |
| Less than $800 | 1,891 (39.3%) | 65 (0.9%) |
| $800 to $1,499 | 1,484 (30.8%) | 2,170 (29.2%) |
| $800 to $1,499 | 1,070 (22.2%) | 2,598 (35.0%) |
| Total | 4,813 (100.0%) | 7,431 (100.0%) |
Health & Disability in Terre Haute
Health Insurance Coverage by Age in Terre Haute
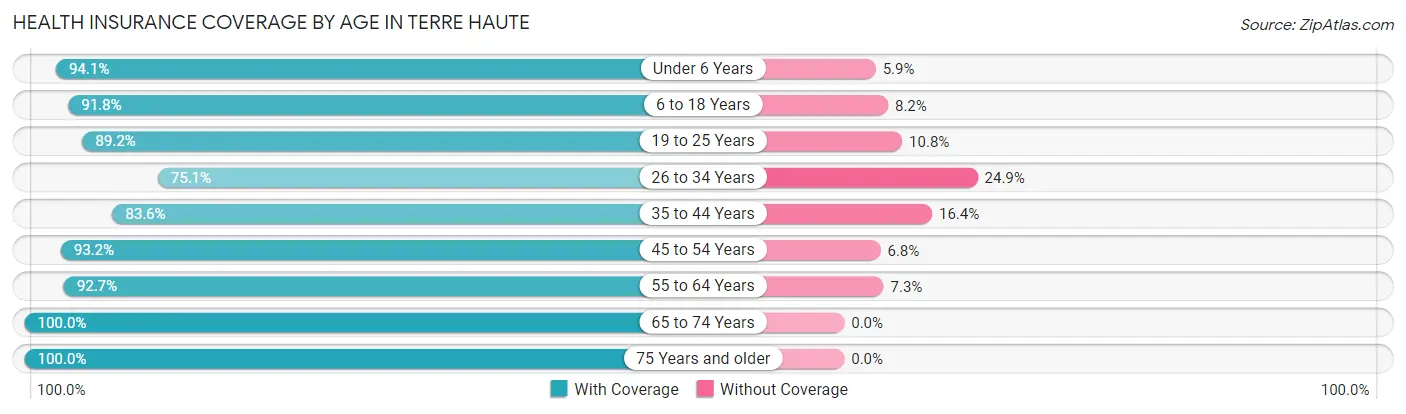
| Age Bracket | With Coverage | Without Coverage |
| Under 6 Years | 3,728 (94.1%) | 232 (5.9%) |
| 6 to 18 Years | 8,249 (91.8%) | 733 (8.2%) |
| 19 to 25 Years | 9,714 (89.2%) | 1,175 (10.8%) |
| 26 to 34 Years | 4,959 (75.1%) | 1,641 (24.9%) |
| 35 to 44 Years | 4,506 (83.6%) | 882 (16.4%) |
| 45 to 54 Years | 4,995 (93.2%) | 362 (6.8%) |
| 55 to 64 Years | 5,198 (92.7%) | 411 (7.3%) |
| 65 to 74 Years | 5,031 (100.0%) | 0 (0.0%) |
| 75 Years and older | 3,678 (100.0%) | 0 (0.0%) |
| Total | 50,058 (90.2%) | 5,436 (9.8%) |
Health Insurance Coverage by Citizenship Status in Terre Haute
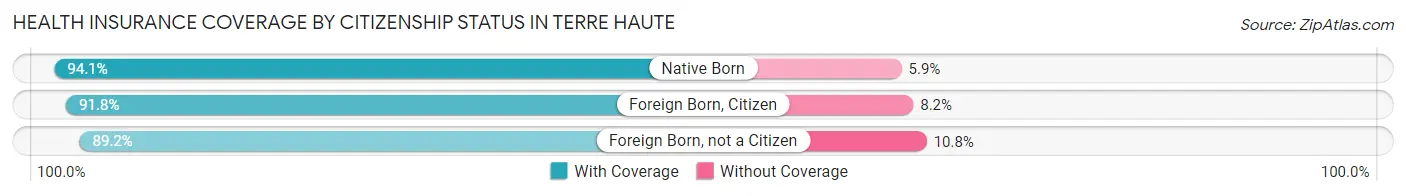
| Citizenship Status | With Coverage | Without Coverage |
| Native Born | 3,728 (94.1%) | 232 (5.9%) |
| Foreign Born, Citizen | 8,249 (91.8%) | 733 (8.2%) |
| Foreign Born, not a Citizen | 9,714 (89.2%) | 1,175 (10.8%) |
Health Insurance Coverage by Household Income in Terre Haute
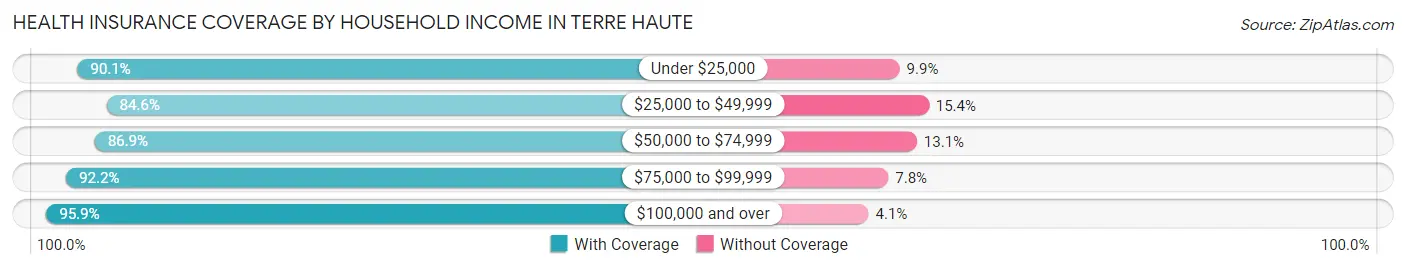
| Household Income | With Coverage | Without Coverage |
| Under $25,000 | 11,402 (90.1%) | 1,253 (9.9%) |
| $25,000 to $49,999 | 11,105 (84.6%) | 2,015 (15.4%) |
| $50,000 to $74,999 | 7,788 (86.9%) | 1,178 (13.1%) |
| $75,000 to $99,999 | 5,622 (92.2%) | 475 (7.8%) |
| $100,000 and over | 10,642 (95.9%) | 453 (4.1%) |
Public vs Private Health Insurance Coverage by Age in Terre Haute
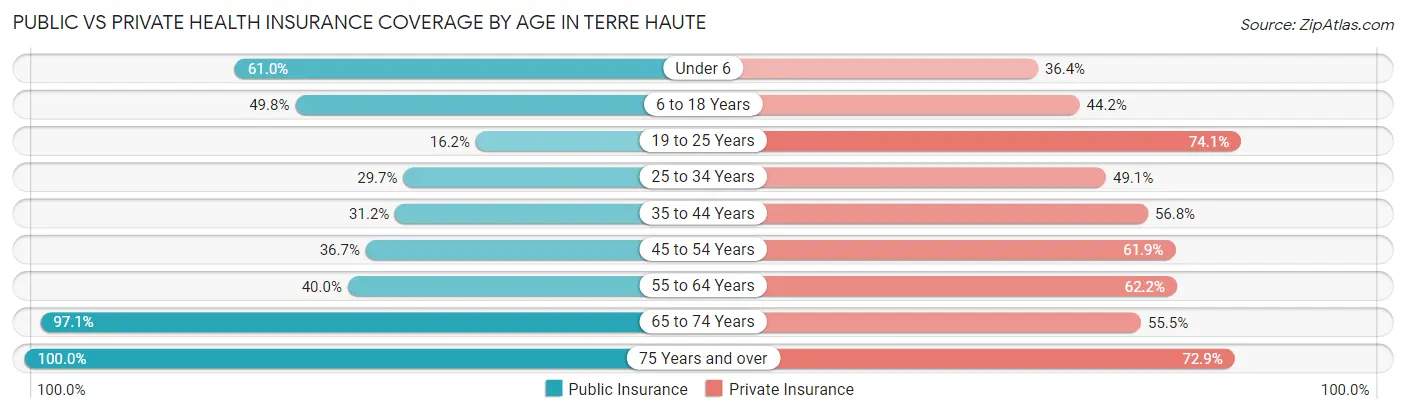
| Age Bracket | Public Insurance | Private Insurance |
| Under 6 | 2,414 (61.0%) | 1,442 (36.4%) |
| 6 to 18 Years | 4,470 (49.8%) | 3,966 (44.2%) |
| 19 to 25 Years | 1,768 (16.2%) | 8,068 (74.1%) |
| 25 to 34 Years | 1,961 (29.7%) | 3,237 (49.0%) |
| 35 to 44 Years | 1,682 (31.2%) | 3,062 (56.8%) |
| 45 to 54 Years | 1,965 (36.7%) | 3,316 (61.9%) |
| 55 to 64 Years | 2,245 (40.0%) | 3,487 (62.2%) |
| 65 to 74 Years | 4,883 (97.1%) | 2,794 (55.5%) |
| 75 Years and over | 3,678 (100.0%) | 2,681 (72.9%) |
| Total | 25,066 (45.2%) | 32,053 (57.8%) |
Disability Status by Sex by Age in Terre Haute
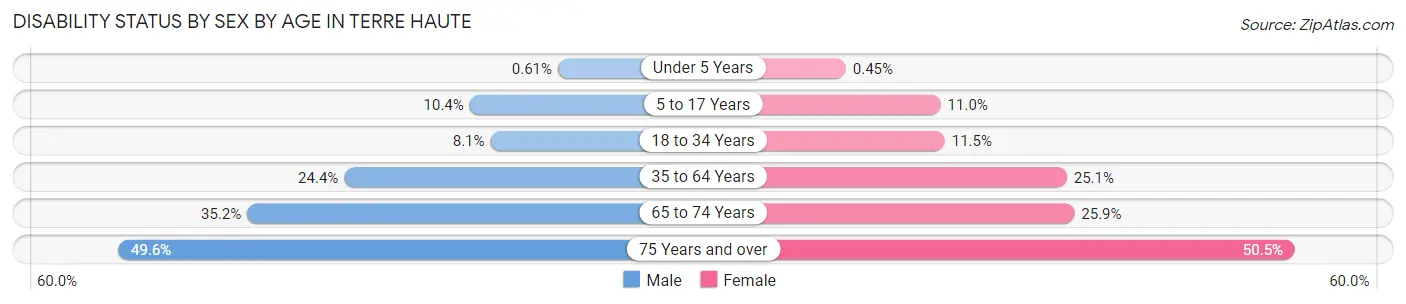
| Age Bracket | Male | Female |
| Under 5 Years | 10 (0.6%) | 7 (0.4%) |
| 5 to 17 Years | 415 (10.4%) | 463 (11.0%) |
| 18 to 34 Years | 792 (8.1%) | 1,065 (11.5%) |
| 35 to 64 Years | 1,931 (24.4%) | 2,116 (25.1%) |
| 65 to 74 Years | 816 (35.2%) | 703 (25.9%) |
| 75 Years and over | 686 (49.6%) | 1,158 (50.5%) |
Disability Class by Sex by Age in Terre Haute
Disability Class: Hearing Difficulty
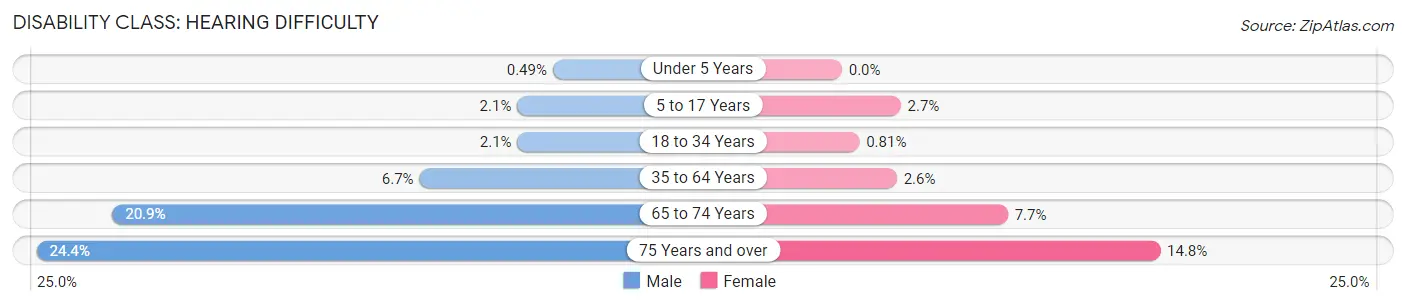
| Age Bracket | Male | Female |
| Under 5 Years | 8 (0.5%) | 0 (0.0%) |
| 5 to 17 Years | 85 (2.1%) | 115 (2.7%) |
| 18 to 34 Years | 208 (2.1%) | 75 (0.8%) |
| 35 to 64 Years | 528 (6.7%) | 215 (2.5%) |
| 65 to 74 Years | 485 (20.9%) | 209 (7.7%) |
| 75 Years and over | 338 (24.4%) | 339 (14.8%) |
Disability Class: Vision Difficulty
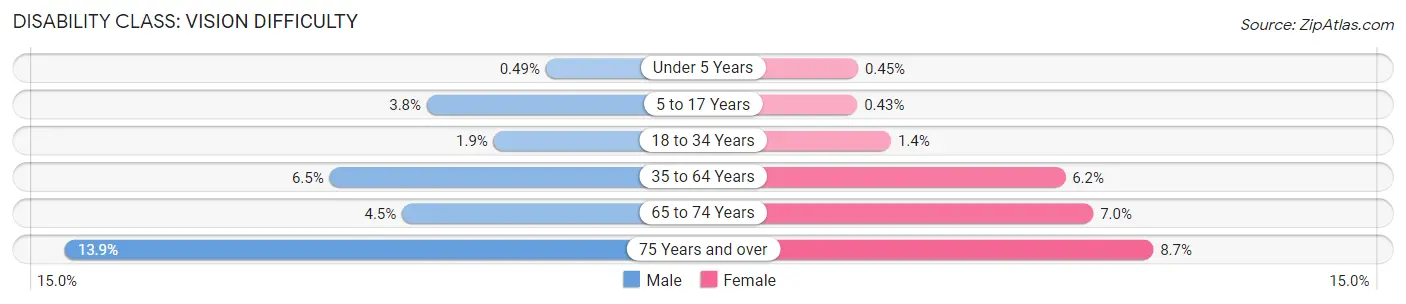
| Age Bracket | Male | Female |
| Under 5 Years | 8 (0.5%) | 7 (0.4%) |
| 5 to 17 Years | 151 (3.8%) | 18 (0.4%) |
| 18 to 34 Years | 189 (1.9%) | 127 (1.4%) |
| 35 to 64 Years | 515 (6.5%) | 525 (6.2%) |
| 65 to 74 Years | 104 (4.5%) | 190 (7.0%) |
| 75 Years and over | 192 (13.9%) | 199 (8.7%) |
Disability Class: Cognitive Difficulty
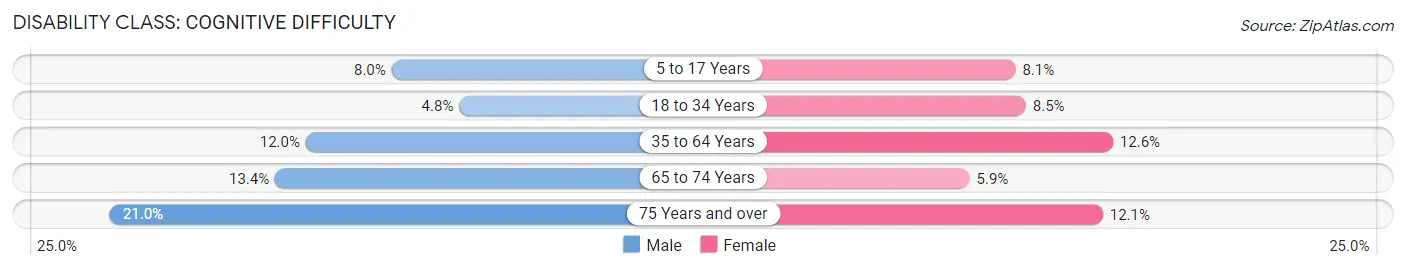
| Age Bracket | Male | Female |
| 5 to 17 Years | 317 (8.0%) | 339 (8.1%) |
| 18 to 34 Years | 471 (4.8%) | 793 (8.5%) |
| 35 to 64 Years | 945 (11.9%) | 1,062 (12.6%) |
| 65 to 74 Years | 310 (13.4%) | 161 (5.9%) |
| 75 Years and over | 291 (21.0%) | 278 (12.1%) |
Disability Class: Ambulatory Difficulty
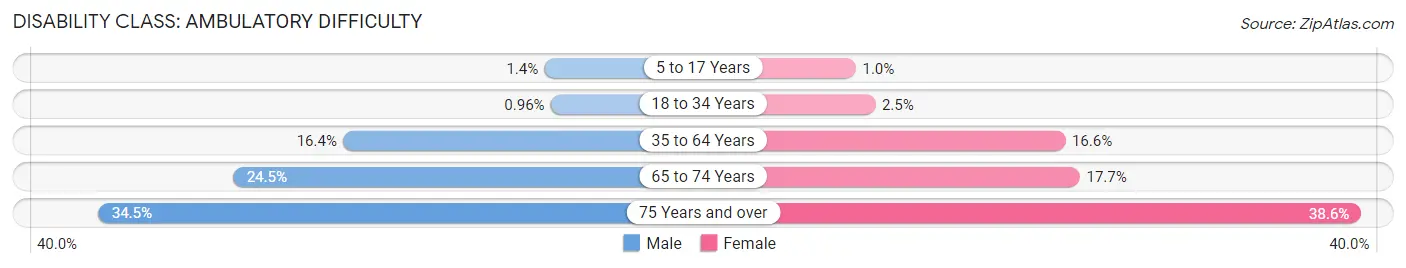
| Age Bracket | Male | Female |
| 5 to 17 Years | 57 (1.4%) | 43 (1.0%) |
| 18 to 34 Years | 94 (1.0%) | 228 (2.5%) |
| 35 to 64 Years | 1,296 (16.4%) | 1,399 (16.6%) |
| 65 to 74 Years | 567 (24.5%) | 479 (17.6%) |
| 75 Years and over | 477 (34.5%) | 885 (38.6%) |
Disability Class: Self-Care Difficulty
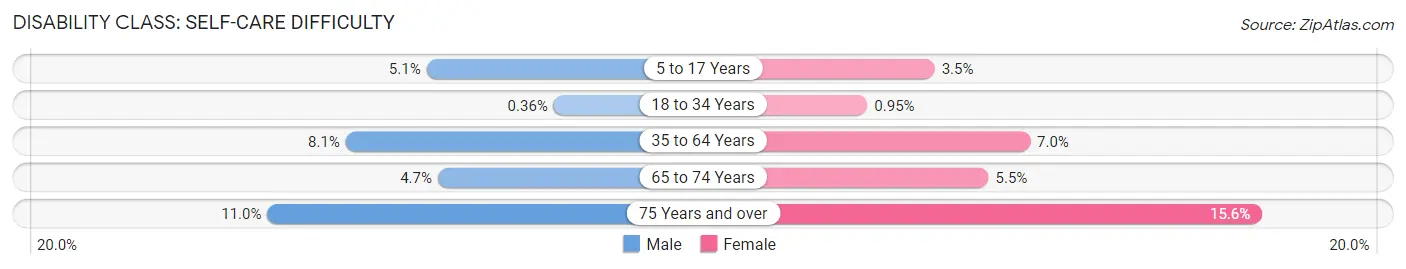
| Age Bracket | Male | Female |
| 5 to 17 Years | 202 (5.1%) | 145 (3.5%) |
| 18 to 34 Years | 35 (0.4%) | 88 (0.9%) |
| 35 to 64 Years | 639 (8.1%) | 590 (7.0%) |
| 65 to 74 Years | 108 (4.7%) | 148 (5.4%) |
| 75 Years and over | 152 (11.0%) | 358 (15.6%) |
Technology Access in Terre Haute
Computing Device Access in Terre Haute
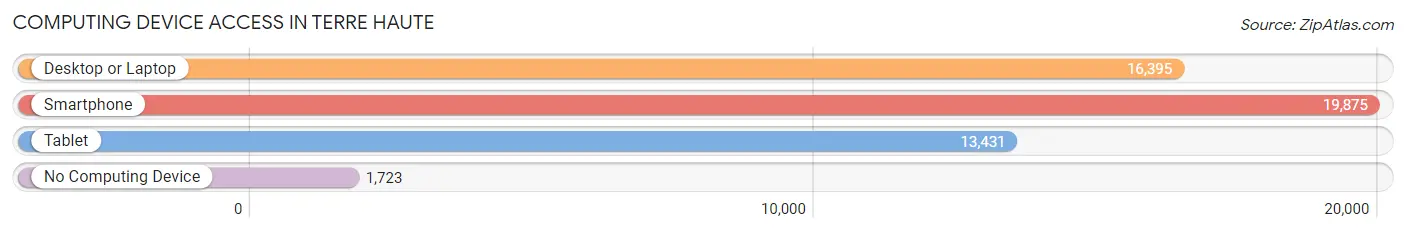
| Device Type | # Households | % Households |
| Desktop or Laptop | 16,395 | 71.0% |
| Smartphone | 19,875 | 86.1% |
| Tablet | 13,431 | 58.2% |
| No Computing Device | 1,723 | 7.5% |
| Total | 23,088 | 100.0% |
Internet Access in Terre Haute
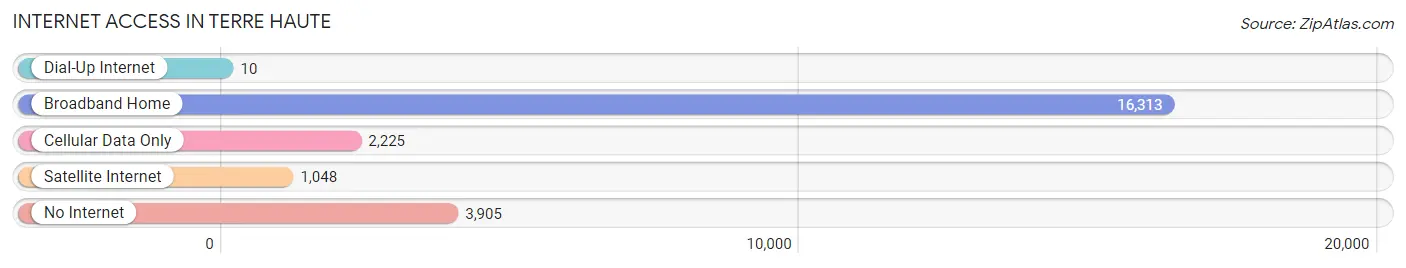
| Internet Type | # Households | % Households |
| Dial-Up Internet | 10 | 0.0% |
| Broadband Home | 16,313 | 70.7% |
| Cellular Data Only | 2,225 | 9.6% |
| Satellite Internet | 1,048 | 4.5% |
| No Internet | 3,905 | 16.9% |
| Total | 23,088 | 100.0% |
Terre Haute Summary
Terre Haute is a city located in the state of Indiana in the United States. It is the county seat of Vigo County and the principal city of the Terre Haute Metropolitan Statistical Area. As of the 2010 census, the city had a total population of 60,785 and a metropolitan population of 170,943.
History
The area that is now Terre Haute was first settled in 1816 by a group of settlers from Kentucky led by General William Henry Harrison, the future president of the United States. The settlement was named Fort Harrison in honor of Harrison's military service. In 1821, the settlement was renamed Terre Haute, which is French for "high ground."
The city was officially incorporated in 1832 and quickly grew to become an important transportation hub due to its location at the intersection of two major railroads. The city was also a major center for the coal mining industry in the late 19th and early 20th centuries.
In the late 19th century, Terre Haute was home to a number of prominent businesses, including the Terre Haute Brewing Company, the Terre Haute House hotel, and the Terre Haute Wagon Company. The city was also home to a number of prominent educational institutions, including Indiana State University, Rose-Hulman Institute of Technology, and Saint Mary-of-the-Woods College.
Geography
Terre Haute is located in western Indiana, approximately 70 miles west of Indianapolis. The city is situated along the Wabash River and is surrounded by rolling hills and farmland. The city has a total area of 24.2 square miles, of which 24.1 square miles is land and 0.1 square miles is water.
The climate in Terre Haute is classified as humid continental, with hot, humid summers and cold, snowy winters. The average annual temperature is 54.2°F, with an average high of 73.2°F in July and an average low of 34.2°F in January.
Economy
Terre Haute's economy is largely based on manufacturing, education, healthcare, and retail. The city is home to a number of major employers, including Indiana State University, Rose-Hulman Institute of Technology, Union Hospital, and the Terre Haute Regional Airport.
The city is also home to a number of major manufacturing companies, including Alcoa, ArcelorMittal, and General Electric. The city is also home to a number of retail stores, including Walmart, Target, and Kohl's.
Demographics
As of the 2010 census, the population of Terre Haute was 60,785. The racial makeup of the city was 79.2% White, 15.3% African American, 0.4% Native American, 1.2% Asian, 0.1% Pacific Islander, 1.3% from other races, and 2.5% from two or more races. Hispanic or Latino of any race were 4.2% of the population.
The median household income in Terre Haute was $37,945, and the median family income was $45,919. The per capita income for the city was $20,845. About 17.2% of the population was below the poverty line.
Common Questions
What is Per Capita Income in Terre Haute?
Per Capita income in Terre Haute is $24,448.
What is the Median Family Income in Terre Haute?
Median Family Income in Terre Haute is $56,841.
What is the Median Household income in Terre Haute?
Median Household Income in Terre Haute is $41,230.
What is Income or Wage Gap in Terre Haute?
Income or Wage Gap in Terre Haute is 33.6%.
Women in Terre Haute earn 66.4 cents for every dollar earned by a man.
What is Family Income Deficit in Terre Haute?
Family Income Deficit in Terre Haute is $10,613.
Families that are below poverty line in Terre Haute earn $10,613 less on average than the poverty threshold level.
What is Inequality or Gini Index in Terre Haute?
Inequality or Gini Index in Terre Haute is 0.49.
What is the Total Population of Terre Haute?
Total Population of Terre Haute is 58,599.
What is the Total Male Population of Terre Haute?
Total Male Population of Terre Haute is 29,634.
What is the Total Female Population of Terre Haute?
Total Female Population of Terre Haute is 28,965.
What is the Ratio of Males per 100 Females in Terre Haute?
There are 102.31 Males per 100 Females in Terre Haute.
What is the Ratio of Females per 100 Males in Terre Haute?
There are 97.74 Females per 100 Males in Terre Haute.
What is the Median Population Age in Terre Haute?
Median Population Age in Terre Haute is 32.4 Years.
What is the Average Family Size in Terre Haute
Average Family Size in Terre Haute is 3.0 People.
What is the Average Household Size in Terre Haute
Average Household Size in Terre Haute is 2.2 People.
How Large is the Labor Force in Terre Haute?
There are 26,620 People in the Labor Forcein in Terre Haute.
What is the Percentage of People in the Labor Force in Terre Haute?
55.2% of People are in the Labor Force in Terre Haute.
What is the Unemployment Rate in Terre Haute?
Unemployment Rate in Terre Haute is 7.5%.